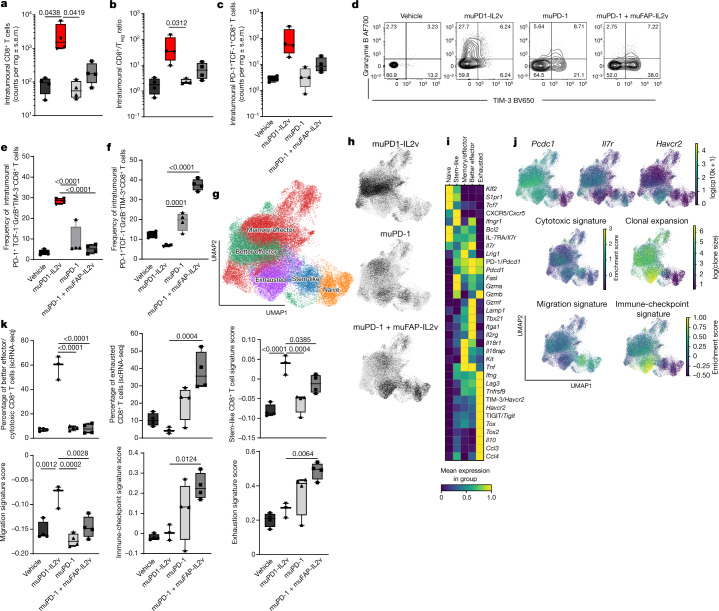
Fig. 4. muPD1-IL2v expands and differentiates PD-1+TCF-1+ stem-like resource CD8+ TILs into a new population of better effector CD8+ TILs.
Immuno-pharmacodynamic study on the effect of the different therapies, given twice, on the abundance, phenotype, effector function and molecular signature of intratumoural CD8+ T cells obtained from syngeneic mice bearing subcutaneous Panc02-H7-Fluc tumours. a, Number of intratumoural CD8+ T cells. b, CD8+ T cell to Treg ratio within the tumour. c, Number of stem-like (PD-1+TCF-1+) CD8+ T cells. In a–c, n = 4 (box plots represent the median, minimum/maximum and individual points; treatment groups appear in the same order in each panel). d, Representative contour plots depicting granzyme B and TIM-3 expression on PD-1+TCF-1−CD8+ TILs from tumour single-cell suspensions acquired by flow cytometry 3 d after administration of the second dose of the treatment as indicated. e,f, Frequencies of granzyme B+TIM-3− (e) and granzyme B−TIM-3+ (f) intratumoural PD-1+TCF-1−CD8+ T cells (n = 4; box plots represent the median, minimum/maximum and individual points). g,h, Two-dimensional (2D) UMAP visualization of CD8+ TILs coloured according to subset (g) and specific treatment effect (h). i, Average relative expression of selected genes (RNA and/or protein level) across the distinct T cell subsets within the CD8+ TILs depicted in g and h. j, Expression of selected markers, signature scores and TCR clonal expansion among CD8+ TILs using a 2D UMAP visualization as in g and h. log(cp10k), natural logarithm of counts per 10,000; log(clone size), natural logarithm of clone size. k, Percentage of better effectors and exhausted CD8+ T cells relative to all CD8+ TILs across the different treatments and average signature enrichment scores among effector CD8+ T cells per treatment group and individual animal (3–4 mice per group; box plots represent the median, minimum/maximum and individual points). In a and k, n = 3–4 mice per group per experiment, >3 independent experiments; statistical comparisons were performed using one-way or two-way ANOVA with Dunnett’s multiple-comparisons test.

