Abstract
This work introduced the high-throughput phase prediction of PtPd-based high-entropy alloys via the algorithm based on a combined Korringa-Kohn-Rostoker coherent potential approximation (KKR-CPA) and artificial neural network (ANN) technique. As the first step, the KKR-CPA was employed to generate 2,720 data of formation energy and lattice parameters in the framework of the first-principles density functional theory. Following the data generation, 15 features were selected and verified for all HEA systems in each phase (FCC and BCC) via ANN. The algorithm exhibited high accuracy for all four prediction models on 36,556 data from 9139 HEA systems with 137,085 features, verified by R2 closed to unity and the mean relative error (MRE) within 5%. From this dataset comprising 5002 and 4137 systems of FCC and BCC phases, it can be realized based on the highest tendency of HEA phase formation that (1) Sc, Co, Cu, Zn, Y, Ru, Cd, Os, Ir, Hg, Al, Si, P, As, and Tl favor FCC phase, (2) Hf, Ga, In, Sn, Pb, and Bi favor BCC phase, and (3) Ti, V, Cr, Mn, Fe, Ni, Zr, Nb, Mo, Tc, Rh, Ag, Ta, W, Re, Au, Ge, and Sb can be found in both FCC and BCC phases with comparable tendency, where all predictions are in good agreement with the data from the literature. Thus, the combination of KKR-CPA and ANN can reduce the computational cost for the screening of PtPd-based HEA and accurately predict the structure, i.e., FCC, BCC, etc.
Subject terms: Density functional theory, Computational science, Scientific data, Chemical engineering
Introduction
High-entropy alloys (HEAs) are classified by configurational entropy of mixing ()1, in which the criteria are ≥ 1.36R and ≥ 1.50R for tetra and penta-metallic alloys2, respectively. This material has been employed in various applications due to its promising properties, especially catalytic3–8 and mechanical properties9–12. Nowadays, discovering new formulae of HEA via experimental techniques requires a high cost of chemicals and characterization13, where the phase and atomic composition are challenges for HEA materials14. Hence, the prediction of the possible phase formation based on computational techniques plays a crucial role in reducing HEA screening costs. It was demonstrated that a system with high in a multi-component alloy tended to form a single-phase HEA, implying that the system would be less likely to segregate15.
During these several years, machine learning (ML) techniques have been employed to predict structural properties and discover unknown materials16. However, a large amount of data is required for ML to predict such properties accurately. This will be the main obstacle if one would like to screen the materials based on experimental techniques. Complementing the experimental data if it is not enough; one should employ the first-principles techniques, e.g., density functional theory (DFT), to help generating enough training data for accurate ML prediction17,18. This coupling of ML and DFT can tremendously reduce the cost of materials discovery compared to the complete experimental materials screening, where only the expensive screening via high-throughput experimentation would be enough for ML19. Therefore, various researchers employed the ML-based method to explore new HEA in recent years, as Kaufmann and Vecchio20 reported, which employed the random forest technique to predict the single and multiple phases of binary, ternary, quaternary, and quinary alloys. They found that all predicted results agreed well with the validation from experimental data and the CALPHAD program. Moreover, Jin et al.21 exhibit the coupled DFT-ML technique to screen the phases of multi-component alloys. The training dataset of binary alloys was generated by DFT random alloy method, known as the Korringa-Kohn-Rostoker coherent potential approximation (KKR-CPA). As a result, their prediction accuracy was up to 80.56% for multi-component alloys and, interestingly, up to 84.20% for HEA materials21. Apart from such an algorithm, numerous techniques, i.e., the gradient boosting model, trained with 1,807 datasets, demonstrated high accuracy of 96.41% for predicting single-phase and non-single-phase refractory HEAs (RHEAs)22. Other methods also exhibit high accuracy prediction, e.g., a combined ML and CALPHAD technique, an artificial neural network technique (ANN) coupled with experimental data9,10,12,23–28. In addition to phase formation of HEAs, machine learning was recently employed to predict the mechanical properties of HEA bulk materials, including microhardness10,27, yield strength12,23, dislocation density12, elastic modulus29, Young’s modulus30, hardness11,31, and elastic constant32. These shed light on the ML-based high-throughput screening of HEA materials.
As in the aspect of the use of HEA as catalytic materials, the PtPd-based HEAs are among high potential candidates that can be utilized in CO2 and CO reduction reaction7,8, oxygen evolution reaction33, oxygen reduction reaction34, and hydrogen evolution reaction35. However, from the literature, it was found that most experimental works involving PtPd-based HEAs focused mainly on the report of limited formulae of HEA in terms of novel synthesis and characterization techniques26,36–43. Therefore, a gigantic set of possible HEA formulae is required to understand and utilize their promising properties fully. Hence, a firm protocol for screening HEA properties, such as their phase and electronic properties, must be studied and established. The phases and structural properties should be the first screening stage, in which bulk HEAs’ thermodynamic stability can be extracted through the formation energy () at the ground-state configuration at 0 K1. Regarding such calculations, Miedema’s scheme model44 is one of the simple and fast methods used to obtain , where the experimental technique must be used to obtain the individual energy for a monometallic component first. Yet, apart from the energy term, the structural information of a specific phase of alloys or compounds cannot be determined. To overcome such a problem, the periodic DFT was employed to determine both the and the structural information of a system is reported being successfully utilized in binary systems45. Nevertheless, to design the HEA, many possible atomic configurations have to be guessed and verified through thermodynamically optimized structures. The routine calculation via DFT alone would be intensive, although all information can be obtained. Also, suppose a combined DFT-ML technique is to be used for HEA discovery. In that case a huge configurational space must be generated to accurately determine the most favorable atomic configuration at a given operating temperature, pressure, and chemical composition. Thus, to reduce the computational cost, even more, we propose the combined KKR-CPA with ML technique for a rapid and low-cost HEA materials screening46–49. This method was proven by Jin et al.21 to be a successful tool for the property prediction of multi-metallic alloys. So far, such a method has not been applied to HEA screening. The KKR method employed is based on Green’s function method of multiple scattering theory to calculate the Green’s function of a system without knowing its eigenvalue of DFT50–52. Whereas the CPA method solves the problem of atomic configuration through the effective medium with the weighted average of Green’s function.
Accordingly, the CPA method is the most suitable for the multi-component system, such as the penta-metallic HEA comprising five metals: A, B, C, D, and E, as illustrated in Fig. 1. The CPA assumes the potential of each element (, , , ,) without the effect of the local environment, where the atomic component is placed in the system in the effective medium ()53. is determined selfconsistently with including all single site scattering events due to the respective atoms placed in the effective medium. It was previously reported that the KKR-CPA results were comparable to those obtained from a combined DFT and SQS (special quasi-random supercell) technique54. The validation of the KKR-CPA method for multi-component alloys is extensively explained in Sect. 1 of the Supporting Information based on the Akai-KKR software. Tables S1 and S2 demonstrate that the Akai-KKR package can indicate the stable phase for FCC and BCC alloys with a good agreement with available literature54–65.
Figure 1.
The coherent potential approximation (CPA) for the penta-metallic high-entropy alloy (HEA) recreated from Tian et al.53.
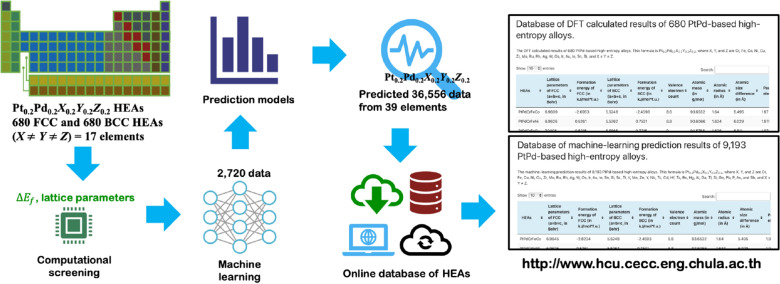
This work presents the ML prediction on the thermodynamically stable PtPd-based HEAs via . The protocol is illustrated in Fig. 2. HEA formulae in focus are the Pt0.2Pd0.2X0.2Y0.2Z0.2 with X, Y, and Z being the components from a pool of 39 elements, i.e., Sc, Ti, V, Cr, Mn, Fe, Co, Ni, Cu, Zn, Y, Zr, Nb, Mo, Tc, Ru, Rh, Ag, Cd, Hf, Ta, W, Re, Os, Ir, Au, Hg, Al, Si, P, Ga, Ge, As, In, Sn, Sb, Tl, Pb, and Bi, where X Y Z. The training and test datasets of lattice parameters (a) and are obtained from the calculated results of 680 FCC and BCC HEA systems, constructed from 17 out of 39 elements mentioned above. The details of the DFT calculation and ML prediction model can be found in Sect. 2 of the Supporting Information. Consequently, the a(FCC), a(BCC), (FCC), and (BCC) of 9,139 HEAs (39 elements) are predicted via machine learning. The relative stability between FCC and BCC for a given HEA is obtained from the formation energy evaluated with respect to their constituent elements. Besides, 36,556 predicted data of 9139 HEAs with a total of 137,085 features are published on our public online database, as shown in Fig. 2. Finally, the screening rules for FCC and BCC-phase PtPd-based HEA are discussed and proposed.
Figure 2.
Our workflow based on first-principles density functional theory (DFT) and machine learning (ML) for the prediction of lattice parameter (a) and formation energy () of HEA systems involving the utilization of our public database at http://www.hcu.cecc.eng.chula.ac.th/hea-database.
Theoretical methods
DFT calculation
The of PtPd-based HEAs can be calculated as Eq. (1).
| 1 |
where is the total energy for the HEA system, and is the total energy for each element calculated from the natural form, e.g., FCC Pt, BCC Mn, HCP Co, etc., The is the element concentration.
The total energies and lattice parameters of FCC and BCC PtPdXYZ HEAs were calculated using the Green’s function method implemented in Akai-KKR (Machikaneyama) package51,52. The KKR-CPA was employed for calculating the electronic structure of the random alloy system comprising n components. The crystal potential was approximated by using the muffin-tin potential with the atomic-sphere approximation. The Perdew–Wang-91 generalized gradient approximation (GGA91)66 was used for an exchange–correlation functional. The self-consistent calculation was performed using the criteria of 8 × 8 × 8k-point mesh in the first Brillouin-zone. The electron density was calculated from the imaginary part of the Green’s function evaluated on the complex energy contour whose width is 1.0 Ry from the Fermi energy. The iteration was performed until the difference between input and output potential becomes 10–6. The maximum angular momentum for the expansion of Green’s function was set to 2. The scalar relativistic approximation (SRA) was used for the relativistic treatment.
Machine learning
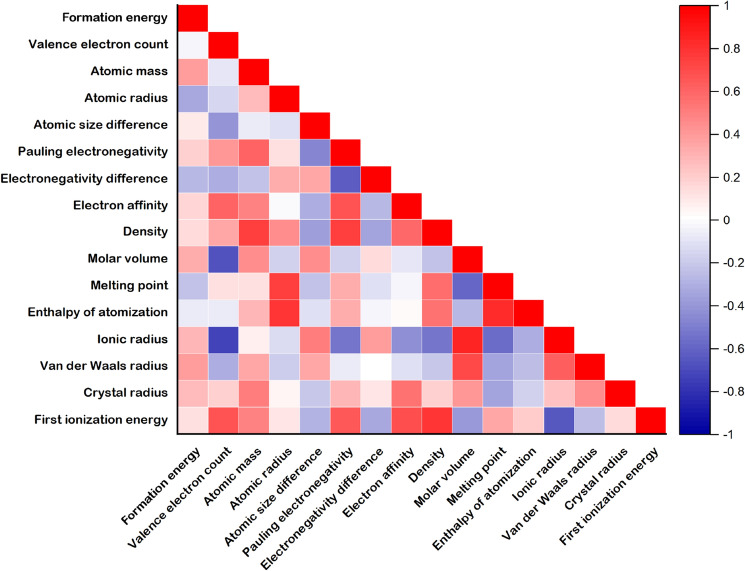
The 2,720 data of a and were collected from the DFT calculation of FCC and BCC PtPdXYZ HEAs (X Y Z = Cr, Fe, Co, Ni, Cu, Zr, Mo, Ru, Rh, Ag, W, Os, Ir, Au, In, Sn, Bi) including 680 data of each FCC and BCC HEA for making each ML prediction model viz., a(FCC), a(BCC), (FCC), and (BCC). Fifteen features from the physical and chemical properties of each element, including valence electron count (VEC), atomic mass (), atomic radius (), atomic size difference (), Pauling electronegativity (), electronegativity difference (), electron affinity (), density (), molar volume (), melting point (), enthalpy of atomization , ionic radius (), Van der Waals radius (), crystal radius (), and first ionization energy (), were considered to be the descriptor of HEAs for making ML. The and were made using Eqs. (2) and (3). Other features can be built as Eq. (4).
| 2 |
| 3 |
| 4 |
where , , and are the , , and concentration of element . Weight-averaged features, and can be calculated using Eq. (4). The Pearson correlation coefficient of the features for (FCC) is illustrated in Fig. 3. The results for (BCC), a(FCC), and a(BCC) are shown in Figs. S1–S3. (FCC) and (BCC) demonstrated a weak relationship with the features. The a(FCC) and a(BCC) showed strong relation with VEC, , , and . However, the overview of correlation between features and (and a) displayed both weak and strong values. Hence, the artificial neural network (ANN) was chosen for the supervised ML method because it can accomplish the complex and nonlinear features of the ML prediction model12,67. The 680 data were randomly split into 70% for the training set (476 data) and 30% for the test set (204 data points). The ANN consisted of four hidden layers, where each hidden layer contained thirteen. The Levenberg–Marquardt backpropagation68 was employed to train all models. The mean relative error (MRE) loop was used to improve the performance of prediction models, which can be calculated by Eq. (5).
| 5 |
where the MRE cutoff is set to 5%. The prediction accuracy was also evaluated by the mean square error (MSE), mean absolute error (MAE), and coefficient of determination () as illustrated in Eqs. (6)–(8).
| 6 |
| 7 |
| 8 |
Figure 3.
Matrix representation of Pearson correlation coefficient of features. The formation energy corresponds to (FCC) of HEAs.
Results and discussion
DFT results
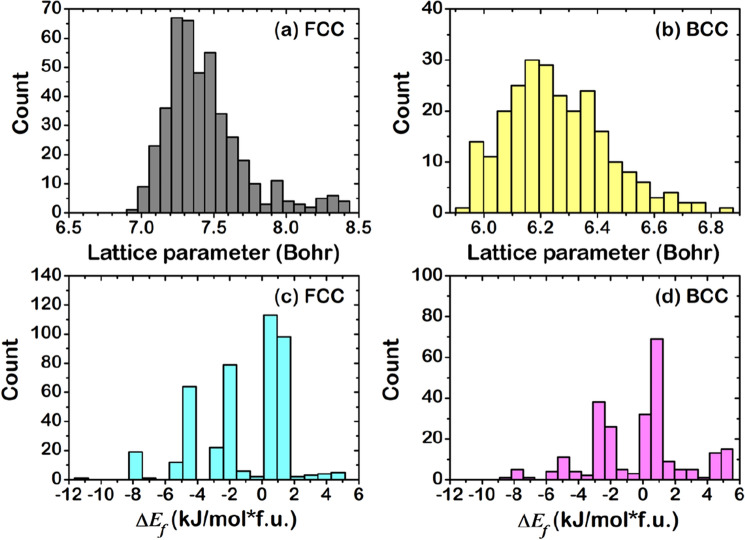
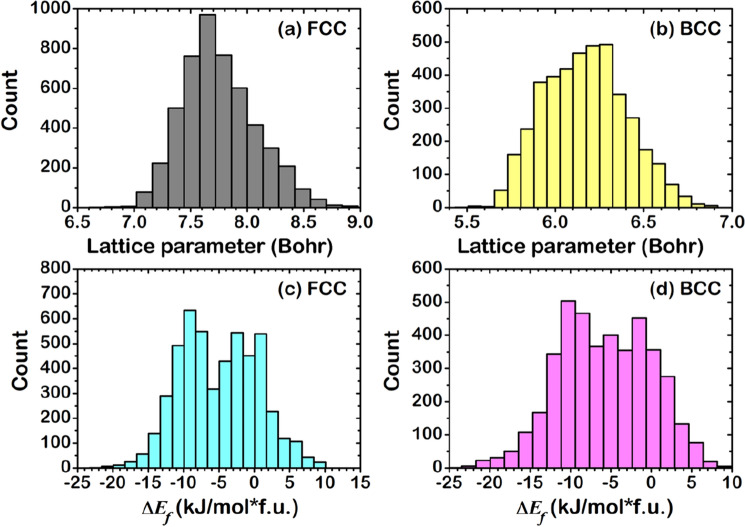
Figure S4 shows distribution data of DFT-calculated results of (FCC), (BCC), (FCC), and (BCC), while Fig. 4 chooses the more plausible phase. Each calculated HEA was classified into FCC or BCC phase by considering the to investigate the stable structure in thermodynamics54,69. For example, the DFT-calculated of PtPdCrFeCo HEA that is −2.6953 kJ/mol f.u. for FCC and −2.4593 kJ/mol f.u. for BCC indicates that FCC is thermodynamically favored over BCC due to the lowest . Figure 4 shows the data distribution, retaining only the thermodynamically stable phase for each HEA. As a result, 680 HEAs include 431 FCC (~ 63%) and 249 BCC phase (~ 37%). Based on Hess’s law70, the positive and negative values of can be denoted to endothermic (Endo) and exothermic (Exo) reaction, respectively, composing 220 Endo (and 211 Exo) for FCC and 129 Endo (and 120 Exo) for BCC phases. This DFT-calculated data demonstrates the ratio of Endo:Exo close to 50%:50%, which is suitably balanced for creating ML prediction models. Both Endo and Exo HEAs were analyzed in terms of components. Figure 5 reveals the distribution of each element counted from Endo and Exo HEAs. Also, color-mapping was employed to separate the data group. The high concentration of each data is ordered as follows: blue, light blue, cyan, green, yellow, orange, and red. It was found that the Exo FCC HEAs have Co and Ru as the most frequent element (Fig. 5a). Similarly, Zr is a good candidate in Exo BCC HEAs (Fig. 5b). For Endo HEAs, Cr, Fe, Ni, Cu, Mo, Rh, Ag, W, Os, Ir, and Au hinder forming in the FCC phase, while Sn and Bi are the remarkable elements in the BCC phase.
Figure 4.
Distribution of the formation energy and lattice parameter given by DFT: (a) (FCC), (b) (BCC), (c) (FCC), and (d) (BCC).
Figure 5.
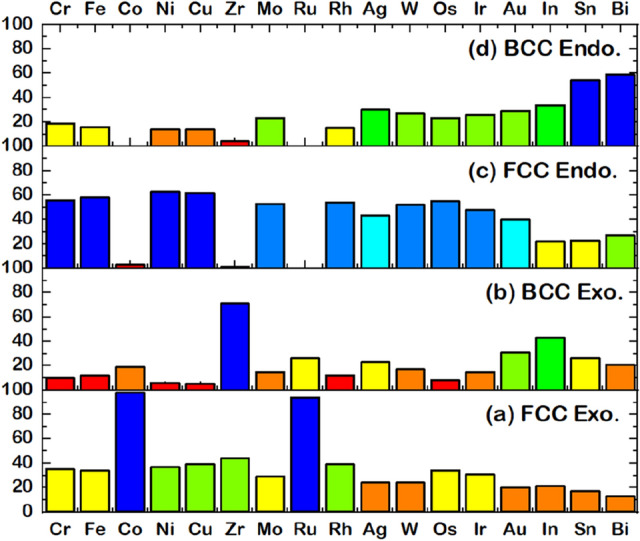
Distribution of elements counted from of PtPdXYZ HEAs (X Y Z = Cr, Fe, Co, Ni, Cu, Zr, Mo, Ru, Rh, Ag, W, Os, Ir, Au, In, Sn, Bi) through DFT-calculated results, including (a) FCC exothermic cases, (b) BCC exothermic cases, (c) FCC endothermic cases, and (d) BCC endothermic cases. The color classification in each group is based on the frequency of the system found to have either FCC Exo, BCC Exo, FCC Endo, or BCC Endo.
It is noted that the KKR-CPA uses Green’s function method to calculate the electronic structure of alloys. In the KKR-CPA, the configuration average of the electronic structure is calculated50–52, hence, there is no detail of atomic configuration in the KKR-CPA method. Thus optimized lattice constant should be regarded as average lattice constant. Figure 4a, b reveal the histogram of a(FCC) and a(BCC). The lattice parameter of most FCC HEAs is distributed in 7.3–7.5 Bohr, while that of BCC HEAs shows a large distribution from 6.0 to 6.5 Bohr.
ML-prediction models
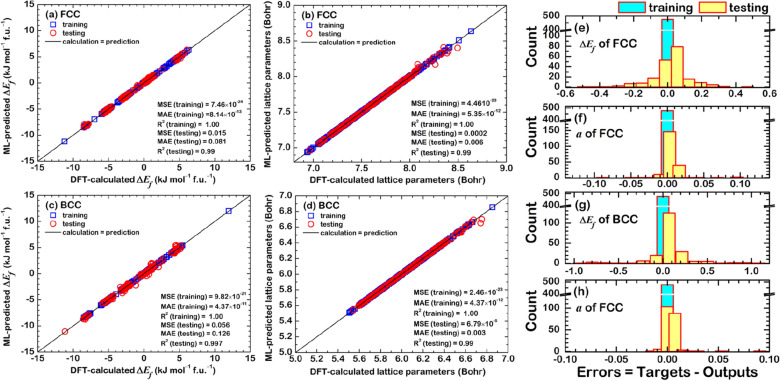
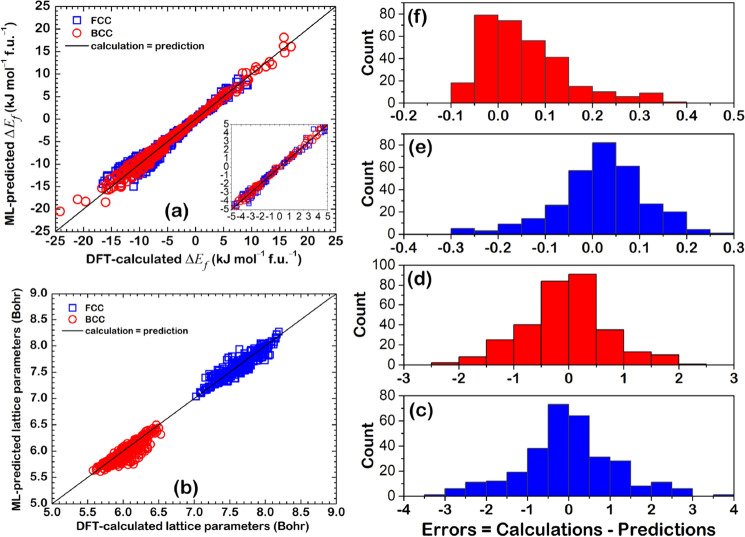
The regression results are illustrated in Fig. 6, where DFT-calculated results were regressed through ANN. The MRE is 0.0237%, 0.0129%, 3.5554%, and 4.7429% for (FCC), (BCC), (FCC), and (BCC) prediction model, respectively. In the training results, the MSE and MAE values were close to zero and the equal to 1 in all the cases, indicating that the ANN with the MRE-loop can improve the accuracy of the training. This also helped increase the accuracy of testing, which can be confirmed by 0.99 of . Figure 6e, g revealed the error values in the testing were ± 0.5 kJ/mol*f.u. for (FCC) and ± 1.0 kJ/mol*f.u. for (BCC). The error values of (Fig. 6f, h) were close to zero and seemed more accurate than the because of the strong correlation with features (see Figs. S2 and S3).
Figure 6.
ML-predicted results compared with DFT-calculated data for (a) (FCC), (b) (BCC), (c) (FCC), and (d) (BCC). Error distribution in the testing is shown in (e)–(h).
The built ML models are employed to predict the 9,139 HEAs as the formulae of Pt0.2Pd0.2X0.2Y0.2Z0.2 (X Y Z), where X, Y, and Z are considered from 39 elements: Sc, Ti, V, Cr, Mn, Fe, Co, Ni, Cu, Zn, Y, Zr, Nb, Mo, Tc, Ru, Rh, Ag, Cd, Hf, Ta, W, Re, Os, Ir, Au, Hg, Al, Si, P, Ga, Ge, As, In, Sn, Sb, Tl, Pb, and Bi. The ML-predicted results of (FCC), (BCC), (FCC), and (BCC) without distinguishing the phase are shown in Fig. S5. The thermodynamically stable phase of 9,139 HEAs is illustrated in Fig. 7. Figure 7a,b reveal enlarged distribution: 7.4–8.0 Bohr for (FCC) and 5.9–6.5 Bohr for (BCC) due to the variety of atomic radius of elements. Similarly, is distributed between about −25.0 kJ/mol f.u. and + 10.0 kJ/mol f.u. for both FCC and BCC. The number of FCC and BCC HEAs is 5002 and 4137, respectively. The number of Exo HEAs is 4140 for FCC and 3567 for BCC phase, more than the Endo HEAs, 862 for FCC and 570 for BCC phase.
Figure 7.
Distribution of ML-predicted results for (a) (FCC), (b) (BCC), (c) (FCC), and (d) (BCC).
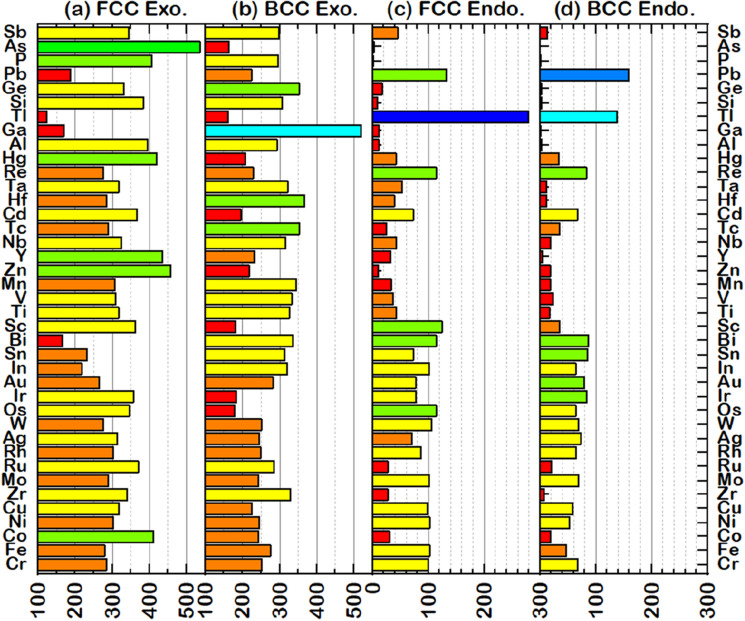
To understand the role of each element involving Endo and Exo forms, Fig. 8 illustrates the element distribution obtained from 9139 PtPdXYZ HEAs (X Y Z = Sc, Ti, V, Cr, Mn, Fe, Co, Ni, Cu, Zn, Y, Zr, Nb, Mo, Tc, Ru, Rh, Ag, Cd, Hf, Ta, W, Re, Os, Ir, Au, Hg, Al, Si, P, Ga, Ge, As, In, Sn, Sb, Tl, Pb, Bi). Overall, all elements of choice except Tl and Pb are found to form Endo HEAs as the ratio FCC:BCC of 50%:50%. Co, Zr, Zn, Al, Ga, Si, Ge, P, and As are hardly involved in Endo HEAs, contrary to Tl, which favors forming the FCC Endo HEAs (Fig. 8c). For the Exo HEAs, the green bar in the FCC phase and the cyan bar in the BCC phase indicate high distribution. In Exo FCC HEAs (Fig. 8a), Co, Zn, Y, Hg, P, and As can be totaled more than 400 HEAs, followed by Sc, Ti, V, Cu, Zr, Nb, Ru, Ag, Cd, Ta, Os, Ir, Si, Ge, and Sb counted by more than 300 HEAs (yellow bar). For the Exo BCC HEAs shown in Fig. 8b, the elements found in more than 300 HEAs are Ti, V, Mn, Y, Zr, Nb, Tc, Hf, Ta, Si, Ga, Ge, In, Sn, and Bi. Among these, Ga, the only element that naturally forms as an orthorhombic structure, plays a significant role in the BCC phase found in more than 500 Exo HEAs (the cyan bar in Fig. 8b). The phase of HEAs is summarized in Fig. 9. Among these data, 15 and 6 elements favor forming FCC and BCC, respectively, while the others almost count both FCC and BCC phases.
Figure 8.
Distribution of elements counted from of PtPdXYZ HEAs (X Y Z = Sc, Ti, V, Cr, Mn, Fe, Co, Ni, Cu, Zn, Y, Zr, Nb, Mo, Tc, Ru, Rh, Ag, Cd, Hf, Ta, W, Re, Os, Ir, Au, Hg, Al, Si, P, Ga, Ge, As, In, Sn, Sb, Tl, Pb, Bi) through ML-predicted results: (a) FCC exothermic cases, (b) BCC exothermic cases, (c) FCC endothermic cases, and (d) BCC endothermic cases. The color classification in each group is based on the frequency of the system found to have either FCC Exo, BCC Exo, FCC Endo, or BCC Endo.
Figure 9.
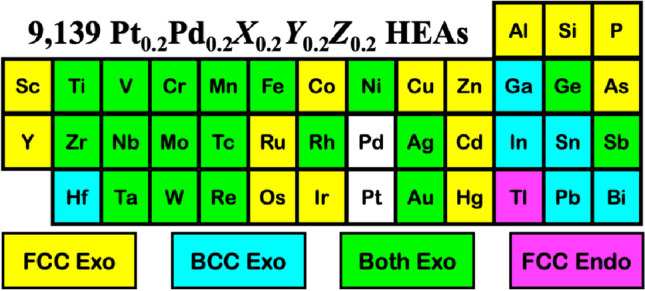
Predicted role of individual elements in the HEA formation energy and phase.
The literature on PtPd-based HEAs is hardly found because they are new group materials. Based on the available data, the phase classification using is demonstrated in Table 1. PtPd-based HEAs of five principal elements reported in the literature showed the predominance of the FCC phase. The values given by ANN models predicted the thermodynamic propensity of the FCC formation of these PtPd-based HEAs, thus agreeing with the available experimental data. In addition to FCC HEAs, BCC HEAs experimentally reported in literature such as CrFeCoNiAl56,58, MnFeNiSiGa56, NbMoTaW54,62,63, VNbMoTaW54,62,63, TiVCrFeCoNiCuAl64, TiZrNbHfTa61,65, and TiZrNbMo58 were employed to validate the KKR-CPA method (Tables S1 and S2). In this case, calculated values successfully categorized the correct phase.
Table 1.
Phase classification of PtPd-based HEAs by (in kJ mol–1 f.u.–1) with a (in Å) validated with literature data.
| HEAs | (FCC) | a (FCC) | (BCC) | a (BCC) | Lowest | Predicted phase | References |
|---|---|---|---|---|---|---|---|
| PtPdFeCoNi | −2.6973 | 3.6713 | −2.4330 | 2.9140 | −2.6973 | FCC |
a = 3.7336 |
| PtPdFeCoIr | −2.6859 | 3.7440 | −2.376 | 2.9715 | −2.6859 | FCC | FCC37 |
| PtPdFeRhIr | 0.2036 | 3.8130 | 0.4338 | 3.0264 | 0.2036 | FCC |
FCC38 a = 3.83438 |
| PtPdCoNiCu | −2.6009 | 3.6831 | −2.3553 | 2.9233 | −2.6009 | FCC | FCC39 |
| PtPdCuAgAu | 0.0882 | 3.9351 | 0.1317 | 3.1233 | 0.0882 | FCC |
a = 3.9367 |
| PtPdRuRhIr | −5.2674 | 3.8669 | −4.9991 | 3.0692 | −5.2674 | FCC |
a = 3.856035 a = 3.8236 a = 3.84 – 3.9642 |
| PtPdRuAgIr | −5.0594 | 3.9276 | −4.9444 | 3.1173 | −5.0594 | FCC | FCC34,41 |
| PtPdRuRhAu | −5.2834 | 3.9165 | −5.1907 | 3.1085 | −5.2834 | FCC | FCC40 |
The prediction on the HEAs containing untrained elements such as Sc, Ti, V, Mn, Zn, Y, Nb, Tc, Cd, Hf, Ta, Re, Hg, Al, Si, P, Ga, Ge, As, Sb, Te, and Pb was tested by the calculated and a of PtPdCrXY, PtPdNiSnX, and PtPdXYZ. This aims to examine whether these prediction models are accurate. Because the DFT calculation of 9,139 HEAs includes 36,556 data for (FCC), (BCC), a(FCC), and a(BCC), the selected HEAs composing untrain elements are used to reduce computational time. The formulae PtPdNiSnX, PtPdCrXY, and PtPdXYZ are represented the HEAs containing one, two, and three untrained elements. The elements X and Y in PtPdNiSnX and PtPdCrXY are Sc, Ti, V, Mn, Zn, Y, Nb, Tc, Cd, Hf, Ta, Re, Hg, Al, Si, P, Ga, Ge, As, Sb, Te, Pb. The elements X, Y, and Z in PtPdXYZ are Sc, Ti, V, Mn,Zn, Al, Si, Sb. The 309 HEAs for validation are implemented in Table S3. The regression plot between DFT-calculation and ML-prediction is illustrated in Fig. 10a,b. The MAE, MSE, and R2 are listed in Table 2. Although the MSE and MAE of the untrained data (Table 2) are higher than that of the trained data (Fig. 6a,c), the R2 of all from the untrained data is still as high as 0.99. The predicted of the selected HEAs has an error ± 4 and ± 3 kJ mol–1 f.u.–1 for FCC and BCC prediction model, respectively (Fig. 10c,d). Figure 10b shows the regression plot of a that seems less accuracy. Figure 10e,f indicate the error value of predicted a less than ± 0.4 Å. This error in a is in an acceptable range for the bulk structure, although the R2 of untrained a is less than that of the trained a (Fig. 6b,d). In addition to the R2, the MSE and MAE values as well as the error value in the prediction should be considered when evaluating the performance of prediction. As a result, the MSE and MAE of untrained a are in the same range of that the trained a (Fig. 6b,d). Although there are some errors found on the prediction of selected HEAs, the performance of prediction models is accepted.
Figure 10.
Validation of PtPdCrXY, PtPdNiSnX, and PtPdXYZ HEAs including regression plots of (a) formation energy, (b) lattice parameters, (c) error of formation energy in FCC data, (d) error of formation energy in BCC data, (e) error of lattice parameters in FCC data, (f) error of lattice parameters in BCC data.
Table 2.
MSE, MAE, and R2 of formation energy () and lattice parameters (a) for the predicted PtPdCrXY, PtPdNiSnX, and PtPdXYZ.
| (FCC) | a (FCC) | (BCC) | a (BCC) | |
|---|---|---|---|---|
| MSE | 1.31 | 0.009(2) | 0.58 | 0.011(5) |
| MAE | 1.31 | 0.005(4) | 0.58 | 0.000(2) |
| R2 | 0.98(1) | 0.86(7) | 0.98(7) | 0.75(9) |
Conclusion
A combination of DFT and ANN was employed to predict the possible formulae of penta-metallic high-entropy alloys. The formation energy and lattice parameter of each system were determined via the KKR-CPA method. The ANN was employed to construct the prediction models and speed up the material screening. The training-to-testing data are 70%:30%, derived from DFT-calculated data of 680 HEAs from 17 elements. 15 features were used in such an algorithm are VEC, , , , , , , , , , , , , , and . The built models possessed high accuracy in the testing, accompanied with the values close to unity and MRE within 5%. Based on the prediction models, 9,139 PtPd-based HEA systems created from a pool of 39 elements were classified into 5,002 FCC and 4,137 BCC systems; the HEA screening rules can be summarized as follows.
-
i.
HEAs with the component of Sc, Co, Cu, Zn, Y, Ru, Cd, Os, Ir, Hg, Al, Si, P, As, and Tl have a high tendency to form in the FCC phase.
-
ii.
HEAs with the component Hf, Ga, In, Sn, Pb, and Bi have a high tendency to form in the BCC phase.
-
iii.
Ti, V, Cr, Mn, Fe, Ni, Zr, Nb, Mo, Tc, Rh, Ag, Ta, W, Re, Au, Ge, and Sb have a comparable tendency to form in either FCC or BCC phase.
These screening rules applied in this work provide the fundamental for the discovery of bulk HEA, where the development of algorithms for the screening of HEA in terms of stable surface configuration is the outlook for future work.
Supplementary Information
Acknowledgments
The authors would like to acknowledge Associate Professor Sato Kazunori for the fruitful discussion of this work. This research is supported by the Second Century Fund (C2F). Also, the authors highly acknowledge (1) Thailand Science Research and Innovation Fund Chulalongkorn University (CU_FRB65_ind (15)_163_21_29), (2) Research Grants for Talented Young Researchers, National Research Council of Thailand 2022, (3) National Science and Technology Development Agency, Thailand, (4) Grants for development of new faculty Staff, Ratchadaphiseksomphot Fund, Chulalongkorn University, (5) the Overseas Research Grants, the Asahi Glass Foundation, and (6) the NSTDA Supercomputer Center (ThaiSC) for computing resources.
Author contributions
M.R. designed the high-throughput screening of PtPd-based HEAs. M.R. calculated total energies and lattice parameters of FCC and BCC HEAs using the Akai-KKR package. J.N. and S.S. corrected and analyzed all enthalpy of formation energies and lattice parameters. J.N. and N.A. performed and analyzed machine learning data. J.N., S.S., N.A., A.S., S.B., and C.W. created all features of 9139 HEAs. M.R. performed validation of the DFT-calculated and ML-predicted results. All authors reviewed and discussed all results.
Data availability
The authors declare that relevant data are within the manuscript.
Competing interests
The authors declare no competing interests.
Footnotes
Publisher's note
Springer Nature remains neutral with regard to jurisdictional claims in published maps and institutional affiliations.
Supplementary Information
The online version contains supplementary material available at 10.1038/s41598-022-21209-0.
References
- 1.Sheng G, Liu CT. Phase stability in high entropy alloys: Formation of solid-solution phase or amorphous phase. Prog. Nat. Sci. Mater. Int. 2011;21(6):433–446. doi: 10.1016/S1002-0071(12)60080-X. [DOI] [Google Scholar]
- 2.Xin Y, Li S, Qian Y, Zhu W, Yuan H, Jiang P, Guo R, Wang L. High-entropy alloys as a platform for catalysis: Progress. Challenges Opportun. Acs Catal. 2020;10(19):11280–11306. doi: 10.1021/acscatal.0c03617. [DOI] [Google Scholar]
- 3.Roy D, Mandal SC, Pathak B. Machine learning-driven high-throughput screening of alloy-based catalysts for selective CO2 hydrogenation to methanol. ACS Appl. Mater. Interfaces. 2021;13(47):56151–56163. doi: 10.1021/acsami.1c16696. [DOI] [PubMed] [Google Scholar]
- 4.Li X, Li B, Yang Z, Chen Z, Gao W, Jiang Q. A transferable machine-learning scheme from pure metals to alloys for predicting adsorption energies. J. Mater. Chem. A. 2022;10:872. doi: 10.1039/D1TA09184K. [DOI] [Google Scholar]
- 5.Wang S, Huo W, Fang F, Xie Z, Shang JK, Jiang J. High entropy alloy/C nanoparticles derived from polymetallic MOF as promising electrocatalysts for alkaline oxygen evolution reaction. Chem. Eng. J. 2022;429:132410. doi: 10.1016/j.cej.2021.132410. [DOI] [Google Scholar]
- 6.Feng D, Dong Y, Nie P, Zhang L, Qiao Z-A. CoNiCuMgZn high entropy alloy nanoparticles embedded onto graphene sheets via anchoring and alloying strategy as efficient electrocatalysts for hydrogen evolution reaction. Chem. Eng. J. 2022;430:132883. doi: 10.1016/j.cej.2021.132883. [DOI] [Google Scholar]
- 7.Nellaiappan S, Katiyar NK, Kumar R, Parui A, Malviya KD, Pradeep K, Singh AK, Sharma S, Tiwary CS, Biswas K. High-entropy alloys as catalysts for the CO2 and CO reduction reactions: Experimental realization. ACS Catal. 2020;10(6):3658–3663. doi: 10.1021/acscatal.9b04302. [DOI] [Google Scholar]
- 8.Pedersen JK, Batchelor TA, Bagger A, Rossmeisl J. High-entropy alloys as catalysts for the CO2 and CO reduction reactions. ACS Catal. 2020;10(3):2169–2176. doi: 10.1021/acscatal.9b04343. [DOI] [Google Scholar]
- 9.Li J, Xie B, He Q, Liu B, Zeng X, Liaw PK, Fang Q, Yang Y, Liu Y. Chemical-element-distribution-mediated deformation partitioning and its control mechanical behavior in high-entropy alloys. J. Mater. Sci. Technol. 2022;120:99–107. doi: 10.1016/j.jmst.2021.11.065. [DOI] [Google Scholar]
- 10.Bundela AS, Rahul M. Machine learning-enabled framework for the prediction of mechanical properties in new high entropy alloys. J. Alloy. Compd. 2022;908:164578. doi: 10.1016/j.jallcom.2022.164578. [DOI] [Google Scholar]
- 11.Li S, Li S, Liu D, Zou R, Yang Z. Hardness prediction of high entropy alloys with machine learning and material descriptors selection by improved genetic algorithm. Comput. Mater. Sci. 2022;205:111185. doi: 10.1016/j.commatsci.2022.111185. [DOI] [Google Scholar]
- 12.Peng J, Xie B, Zeng X, Fang Q, Liu B, Liaw PK, Li J. Vacancy dependent mechanical behaviors of high-entropy alloy. Int. J. Mech. Sci. 2022;218:107065. doi: 10.1016/j.ijmecsci.2022.107065. [DOI] [Google Scholar]
- 13.Yeh J-W. Alloy design strategies and future trends in high-entropy alloys. Jom. 2013;65(12):1759–1771. doi: 10.1007/s11837-013-0761-6. [DOI] [Google Scholar]
- 14.Jiang H, Han K, Gao X, Lu Y, Cao Z, Gao MC, Hawk JA, Li T. A new strategy to design eutectic high-entropy alloys using simple mixture method. Mater. Des. 2018;142:101–105. doi: 10.1016/j.matdes.2018.01.025. [DOI] [Google Scholar]
- 15.Gao MC, Miracle DB, Maurice D, Yan X, Zhang Y, Hawk JA. High-entropy functional materials. J. Mater. Res. 2018;33(19):3138–3155. doi: 10.1557/jmr.2018.323. [DOI] [Google Scholar]
- 16.Ryan K, Lengyel J, Shatruk M. Crystal structure prediction via deep learning. J. Am. Chem. Soc. 2018;140(32):10158–10168. doi: 10.1021/jacs.8b03913. [DOI] [PubMed] [Google Scholar]
- 17.Oliynyk AO, Antono E, Sparks TD, Ghadbeigi L, Gaultois MW, Meredig B, Mar A. High-throughput machine-learning-driven synthesis of full-Heusler compounds. Chem. Mater. 2016;28(20):7324–7331. doi: 10.1021/acs.chemmater.6b02724. [DOI] [Google Scholar]
- 18.Takahashi K, Fujima J, Miyazato I, Nakanowatari S, Fujiwara A, Nguyen TN, Taniike T, Takahashi L. Catalysis gene expression profiling: Sequencing and designing catalysts. J. Phys. Chem. Lett. 2021;12(30):7335–7341. doi: 10.1021/acs.jpclett.1c02111. [DOI] [PubMed] [Google Scholar]
- 19.Sorkin V, Chen S, Tan TL, Yu Z, Man M, Zhang Y. First-principles-based high-throughput computation for high entropy alloys with short range order. J. Alloy. Compd. 2021;882:160776. doi: 10.1016/j.jallcom.2021.160776. [DOI] [Google Scholar]
- 20.Kaufmann K, Vecchio KS. Searching for high entropy alloys: A machine learning approach. Acta Mater. 2020;198:178–222. doi: 10.1016/j.actamat.2020.07.065. [DOI] [Google Scholar]
- 21.Jin T, Park I, Park T, Park J, Shim JH. Accelerated crystal structure prediction of multi-elements random alloy using expandable features. Sci. Rep. 2021;11(1):1–9. doi: 10.1038/s41598-021-84544-8. [DOI] [PMC free article] [PubMed] [Google Scholar]
- 22.Yan Y, Lu D, Wang K. Accelerated discovery of single-phase refractory high entropy alloys assisted by machine learning. Comput. Mater. Sci. 2021;199:110723. doi: 10.1016/j.commatsci.2021.110723. [DOI] [Google Scholar]
- 23.Klimenko D, Stepanov N, Li J, Fang Q, Zherebtsov S. Machine learning-based strength prediction for refractory high-entropy alloys of the Al-Cr-Nb-Ti-V-Zr system. Materials. 2021;14(23):7213. doi: 10.3390/ma14237213. [DOI] [PMC free article] [PubMed] [Google Scholar]
- 24.Nassar A, Mullis A. Rapid screening of high-entropy alloys using neural networks and constituent elements. Comput. Mater. Sci. 2021;199:110755. doi: 10.1016/j.commatsci.2021.110755. [DOI] [Google Scholar]
- 25.Hou S, Sun M, Bai M, Lin D, Li Y, Liu W. A hybrid prediction frame for HEAs based on empirical knowledge and machine learning. Acta Mater. 2022;228:117742. doi: 10.1016/j.actamat.2022.117742. [DOI] [Google Scholar]
- 26.Ragone M, Saray MT, Long L, Shahbazian-Yassar R, Mashayek F, Yurkiv V. Deep learning for mapping element distribution of high-entropy alloys in scanning transmission electron microscopy images. Comput. Mater. Sci. 2022;201:110905. doi: 10.1016/j.commatsci.2021.110905. [DOI] [Google Scholar]
- 27.Liu F, Xiao X, Huang L, Tan L, Liu Y. Design of NiCoCrAl eutectic high entropy alloys by combining machine learning with CALPHAD method. Mater. Today Commun. 2022;30:103172. doi: 10.1016/j.mtcomm.2022.103172. [DOI] [Google Scholar]
- 28.Zhou X-Y, Zhu J-H, Wu Y, Yang X-S, Lookman T, Wu H-H. Machine learning assisted design of FeCoNiCrMn high-entropy alloys with ultra-low hydrogen diffusion coefficients. Acta Mater. 2022;224:117535. doi: 10.1016/j.actamat.2021.117535. [DOI] [Google Scholar]
- 29.Zhang J, Cai C, Kim G, Wang Y, Chen W. Composition design of high-entropy alloys with deep sets learning. npj Comput. Mater. 2022;8(1):1–11. doi: 10.1038/s41524-022-00779-7. [DOI] [Google Scholar]
- 30.Zhang S, Wang G. Predicting mechanical properties of high entropy alloys with face centered cubic structure from first principles calculations. Mater. Today Commun. 2022;32:104059. doi: 10.1016/j.mtcomm.2022.104059. [DOI] [Google Scholar]
- 31.Wen C, Zhang Y, Wang C, Xue D, Bai Y, Antonov S, Dai L, Lookman T, Su Y. Machine learning assisted design of high entropy alloys with desired property. Acta Mater. 2019;170:109–117. doi: 10.1016/j.actamat.2019.03.010. [DOI] [Google Scholar]
- 32.Bhandari U, Ghadimi H, Zhang C, Yang S, Guo S. Predicting elastic constants of refractory complex concentrated alloys using machine learning approach. Materials. 2022;15(14):4997. doi: 10.3390/ma15144997. [DOI] [PMC free article] [PubMed] [Google Scholar]
- 33.Katiyar NK, Dhakar S, Parui A, Gakhad P, Singh AK, Biswas K, Tiwary CS, Sharma S. Electrooxidation of hydrazine utilizing high-entropy alloys: Assisting the oxygen evolution reaction at the thermodynamic voltage. ACS Catal. 2021;11(22):14000–14007. doi: 10.1021/acscatal.1c03571. [DOI] [Google Scholar]
- 34.Pedersen JK, Clausen CM, Krysiak OA, Xiao B, Batchelor TA, Löffler T, Mints VA, Banko L, Arenz M, Savan A. Bayesian optimization of high-entropy alloy compositions for electrocatalytic oxygen reduction. Angew. Chem. 2021;60(45):24144–24152. doi: 10.1002/anie.202108116. [DOI] [PMC free article] [PubMed] [Google Scholar]
- 35.Wu D, Kusada K, Yamamoto T, Toriyama T, Matsumura S, Gueye I, Seo O, Kim J, Hiroi S, Sakata O. On the electronic structure and hydrogen evolution reaction activity of platinum group metal-based high-entropy-alloy nanoparticles. Chem. Sci. 2020;11(47):12731–12736. doi: 10.1039/D0SC02351E. [DOI] [PMC free article] [PubMed] [Google Scholar]
- 36.Yao Y, Huang Z, Li T, Wang H, Liu Y, Stein HS, Mao Y, Gao J, Jiao M, Dong Q. High-throughput, combinatorial synthesis of multimetallic nanoclusters. Proc. Natl. Acad. Sci. 2020;117(12):6316–6322. doi: 10.1073/pnas.1903721117. [DOI] [PMC free article] [PubMed] [Google Scholar]
- 37.Gao S, Hao S, Huang Z, Yuan Y, Han S, Lei L, Zhang X, Shahbazian-Yassar R, Lu J. Synthesis of high-entropy alloy nanoparticles on supports by the fast moving bed pyrolysis. Nat. Commun. 2020;11(1):1–11. doi: 10.1038/ncomms100. [DOI] [PMC free article] [PubMed] [Google Scholar]
- 38.Baba K, Ishizu N, Nishizaki T, Kitagawa J. Magnetic and transport properties of new dual-phase high-entropy alloy FeRhIrPdPt. Materials. 2021;14(11):2877. doi: 10.3390/ma14112877. [DOI] [PMC free article] [PubMed] [Google Scholar]
- 39.Chen Y, Zhan X, Bueno SL, Shafei IH, Ashberry HM, Chatterjee K, Xu L, Tang Y, Skrabalak SE. Synthesis of monodisperse high entropy alloy nanocatalysts from core@ shell nanoparticles. Nanoscale Horizons. 2021;6(3):231–237. doi: 10.1039/D0NH00656D. [DOI] [PubMed] [Google Scholar]
- 40.Okejiri F, Yang Z, Chen H, Do-Thanh C-L, Wang T, Yang S, Dai S. Ultrasound-driven fabrication of high-entropy alloy nanocatalysts promoted by alcoholic ionic liquids. Nano Res. 2021;15:1–7. [Google Scholar]
- 41.Batchelor TA, Löffler T, Xiao B, Krysiak OA, Strotkötter V, Pedersen JK, Clausen CM, Savan A, Li Y, Schuhmann W. Complex-solid-solution electrocatalyst discovery by computational prediction and high-throughput experimentation. Angew. Chem. Int. Ed. 2021;60(13):6932–6937. doi: 10.1002/anie.202014374. [DOI] [PMC free article] [PubMed] [Google Scholar]
- 42.Broge NL, Bondesgaard M, Søndergaard-Pedersen F, Roelsgaard M, Iversen BB. Autocatalytic formation of high-entropy alloy nanoparticles. Angew. Chem. 2020;132(49):22104–22108. doi: 10.1002/ange.202009002. [DOI] [PubMed] [Google Scholar]
- 43.Banko L, Krysiak OA, Pedersen JK, Xiao B, Savan A, Löffler T, Baha S, Rossmeisl J, Schuhmann W, Ludwig A. Unravelling composition–activity–stability trends in high entropy alloy electrocatalysts by using a data-guided combinatorial synthesis strategy and computational modeling. Adv. Energy Mater. 2022;12:2103312. doi: 10.1002/aenm.202103312. [DOI] [Google Scholar]
- 44.Takeuchi A, Inoue A. Mixing enthalpy of liquid phase calculated by Miedema’s scheme and approximated with sub-regular solution model for assessing forming ability of amorphous and glassy alloys. Intermetallics. 2010;18(9):1779–1789. doi: 10.1016/j.intermet.2010.06.003. [DOI] [Google Scholar]
- 45.Troparevsky MC, Morris JR, Kent PR, Lupini AR, Stocks GM. Criteria for predicting the formation of single-phase high-entropy alloys. Phys. Rev. X. 2015;5(1):011041. [Google Scholar]
- 46.Soven P. Coherent-potential model of substitutional disordered alloys. Phys. Rev. 1967;156(3):809. doi: 10.1103/PhysRev.156.809. [DOI] [Google Scholar]
- 47.Gyorffy B. Coherent-potential approximation for a nonoverlapping-muffin-tin-potential model of random substitutional alloys. Phys. Rev. B. 1972;5(6):2382. doi: 10.1103/PhysRevB.5.2382. [DOI] [Google Scholar]
- 48.Stocks G, Temmerman W, Gyorffy B. Complete solution of the Korringa-Kohn-Rostoker coherent-potential-approximation equations: Cu-Ni alloys. Phys. Rev. Lett. 1978;41(5):339. doi: 10.1103/PhysRevLett.41.339. [DOI] [Google Scholar]
- 49.Faulkner J, Stocks G. Calculating properties with the coherent-potential approximation. Phys. Rev. B. 1980;21(8):3222. doi: 10.1103/PhysRevB.21.3222. [DOI] [Google Scholar]
- 50.Akai H, Dederichs P. Local moment disorder in ferromagnetic alloys. Phys. Rev. B. 1993;47(14):8739. doi: 10.1103/PhysRevB.47.8739. [DOI] [PubMed] [Google Scholar]
- 51.Akai H. Fast Korringa-Kohn-Rostoker coherent potential approximation and its application to FCC Ni-Fe systems. J. Phys. Condens. Matter. 1989;1(43):8045. doi: 10.1088/0953-8984/1/43/006. [DOI] [Google Scholar]
- 52.Akai, H. AkaiKKR (Machikaneyama). http://kkr.issp.u-tokyo.ac.jp.
- 53.Tian F. A review of solid-solution models of high-entropy alloys based on ab initio calculations. Front. Mater. 2017;4:36. doi: 10.3389/fmats.2017.00036. [DOI] [Google Scholar]
- 54.Hu Y, Bai L, Tong Y, Deng D, Liang X, Zhang J, Li Y, Chen Y. First-principle calculation investigation of NbMoTaW based refractory high entropy alloys. J. Alloy. Compd. 2020;827:153963. doi: 10.1016/j.jallcom.2020.153963. [DOI] [Google Scholar]
- 55.Troparevsky MC, Morris JR, Daene M, Wang Y, Lupini AR, Stocks GM. Beyond atomic sizes and Hume-Rothery rules: Understanding and predicting high-entropy alloys. Jom. 2015;67(10):2350–2363. doi: 10.1007/s11837-015-1594-2. [DOI] [Google Scholar]
- 56.Huang E-W, Lee W-J, Singh SS, Kumar P, Lee C-Y, Lam T-N, Chin H-H, Lin B-H, Liaw PK. Machine-learning and high-throughput studies for high-entropy materials. Mater. Sci. Eng. R. Rep. 2022;147:100645. doi: 10.1016/j.mser.2021.100645. [DOI] [Google Scholar]
- 57.Lucas M, Wilks G, Mauger L, Munoz JA, Senkov ON, Michel E, Horwath J, Semiatin S, Stone MB, Abernathy DL. Absence of long-range chemical ordering in equimolar FeCoCrNi. Appl. Phys. Lett. 2012;100(25):251907. doi: 10.1063/1.4730327. [DOI] [Google Scholar]
- 58.Zhang Y, Yang X, Liaw P. Alloy design and properties optimization of high-entropy alloys. Jom. 2012;64(7):830–838. doi: 10.1007/s11837-012-0366-5. [DOI] [Google Scholar]
- 59.Lucas M, Mauger L, Munoz J, Xiao Y, Sheets A, Semiatin S, Horwath J, Turgut Z. Magnetic and vibrational properties of high-entropy alloys. J. Appl. Phys. 2011;109(7):07E307. doi: 10.1063/1.3538936. [DOI] [Google Scholar]
- 60.Wu Z, Bei H, Otto F, Pharr GM, George EP. Recovery, recrystallization, grain growth and phase stability of a family of FCC-structured multi-component equiatomic solid solution alloys. Intermetallics. 2014;46:131–140. doi: 10.1016/j.intermet.2013.10.024. [DOI] [Google Scholar]
- 61.Cantor B, Chang I, Knight P, Vincent A. Microstructural development in equiatomic multicomponent alloys. Mater. Sci. Eng. A. 2004;375:213–218. doi: 10.1016/j.msea.2003.10.257. [DOI] [Google Scholar]
- 62.Senkov O, Wilks G, Miracle D, Chuang C, Liaw P. Refractory high-entropy alloys. Intermetallics. 2010;18(9):1758–1765. doi: 10.1016/j.intermet.2010.05.014. [DOI] [Google Scholar]
- 63.Senkov ON, Wilks G, Scott J, Miracle DB. Mechanical properties of Nb25Mo25Ta25W25 and V20Nb20Mo20Ta20W20 refractory high entropy alloys. Intermetallics. 2011;19(5):698–706. doi: 10.1016/j.intermet.2011.01.004. [DOI] [Google Scholar]
- 64.Yeh J-W, Lin S-J, Chin T-S, Gan J-Y, Chen S-K, Shun T-T, Tsau C-H, Chou S-Y. Formation of simple crystal structures in Cu-Co-Ni-Cr-Al-Fe-Ti-V alloys with multiprincipal metallic elements. Metall. Mater. Trans. A. 2004;35(8):2533–2536. doi: 10.1007/s11661-006-0234-4. [DOI] [Google Scholar]
- 65.Senkov O, Scott J, Senkova S, Meisenkothen F, Miracle D, Woodward C. Microstructure and elevated temperature properties of a refractory TaNbHfZrTi alloy. J. Mater. Sci. 2012;47(9):4062–4074. doi: 10.1007/s10853-012-6260-2. [DOI] [Google Scholar]
- 66.Perdew JP, Chevary J, Vosko S, Jackson KA, Pederson MR, Singh D, Fiolhais C. Erratum: Atoms, molecules, solids, and surfaces: Applications of the generalized gradient approximation for exchange and correlation. Phys. Rev. B. 1993;48(7):4978. doi: 10.1103/PhysRevB.48.4978.2. [DOI] [PubMed] [Google Scholar]
- 67.Huang W, Martin P, Zhuang HL. Machine-learning phase prediction of high-entropy alloys. Acta Mater. 2019;169:225–236. doi: 10.1016/j.actamat.2019.03.012. [DOI] [Google Scholar]
- 68.Aldrich C. Exploratory Analysis of Metallurgical Process Data with Neural Networks and Related Methods. Elsevier; 2002. [Google Scholar]
- 69.Rittiruam M, Yangthaisong A, Seetawan T. Enhancing the thermoelectric performance of self-defect TiNiSn: A first-principles calculation. J. Electron. Mater. 2018;47(12):7456–7462. doi: 10.1007/s11664-018-6686-7. [DOI] [Google Scholar]
- 70.Chakrabarty DK. An Introduction to Physical Chemistry. Alpha Science International Ltd; 2001. [Google Scholar]
Associated Data
This section collects any data citations, data availability statements, or supplementary materials included in this article.
Supplementary Materials
Data Availability Statement
The authors declare that relevant data are within the manuscript.


