

ABSTRACT
Background
Multiple dietary patterns have been recommended by the 2015–2020 Dietary Guidelines for Americans for the prevention of cardiovascular disease (CVD). The adherence to these patterns and its relation with risk of CVD remain unclear in the US Hispanic/Latino population.
Objectives
We aimed to evaluate 3 healthy eating patterns measured by 3 dietary pattern scores [the Alternate Mediterranean diet (aMED), the Healthy Eating Index (HEI)-2015, and the healthful Plant-based Diet Index (hPDI)] across different Hispanic/Latino backgrounds and generations. We further examined the associations of these dietary scores with incident CVD in US Hispanics/Latinos.
Methods
We included 10,293 adult participants of US Hispanics/Latinos of 6 backgrounds (Mexican, Puerto Rican, Cuban, Dominican, Central American, and South American), free of CVD or cancer at baseline, in the Hispanic Community Health Study/Study of Latinos. Dietary pattern scores were derived at the baseline visit using two 24-h dietary recalls. The primary outcome was major incident CVD (n = 232), comprised of coronary heart disease and stroke, during an average 6-y follow-up.
Results
Mean levels of all 3 dietary scores were significantly different across the 6 Hispanic/Latino background groups (all P < 0.001), with the highest (i.e., healthiest) in those of Mexican background and lowest in those of Puerto Rican background. Compared with non-mainland-US-born Hispanics/Latinos, mainland-US-born Hispanics/Latinos had significantly lower dietary scores (P < 0.001). Differences in dietary scores between mainland-US-born and non-mainland-US-born Hispanics/Latinos were majorly driven by differences in dietary intakes of healthy plant-based foods. After adjusting for multiple covariates, significantly lower risk ratios (95% CI) of CVD were observed for 1-SD increments of the dietary scores, with 0.74 (0.60, 0.91) for aMED, 0.80 (0.63, 1.00) for HEI-2015, and 0.74 (0.60, 0.93) for hPDI.
Conclusions
Although adherence to healthy eating patterns varied by Hispanic/Latino backgrounds and generations, greater adherence to these eating patterns was associated with lower risk of CVD across diverse US Hispanics/Latinos.
Keywords: cardiovascular disease, dietary guidelines, dietary patterns, immigrant generations, US Hispanics/Latinos
Introduction
The Dietary Guidelines for Americans (DGAs) have been providing recommendations on how to achieve better health outcomes based on the latest scientific evidence every 5 y (1). The 2015–2020 DGAs highlighted, for the first time, the importance of overall healthy dietary patterns rather than individual nutrients or foods in chronic disease prevention, including the Mediterranean-Style Eating Pattern, the Vegetarian Eating Pattern, and the DGA-recommended Eating Pattern, as they integrated interacting and potentially cumulative effects of different dietary components (1). Three dietary scores, the Alternate Mediterranean diet score (aMED) (2), the Healthy Eating Index (HEI)-2015 (3), and the healthful Plant-based Diet Index (hPDI) (4), have been constructed to measure adherence to these dietary patterns, respectively. Adherence to different healthy eating patterns has been associated with multiple health benefits including lower risk of cardiovascular disease (CVD) (5–8).
However, very few studies have evaluated adherence to different healthy eating patterns in the US Hispanic/Latino population, the largest minority group in the United States (9). Siega-Riz et al. (10) examined the HEI-2010, a dietary score that measures alignment with the 2010–2015 DGAs, in a US Hispanic/Latino population of diverse backgrounds, and found that the HEI-2010 was higher in US Hispanics/Latinos than in non-Hispanic whites and non-Hispanic blacks in the NHANES (11). The HEI-2010 varied across Hispanic background groups from being the highest (i.e., healthiest) in those of Mexican background to the lowest in those of Puerto Rican background (10). An updated analysis in the NHANES showed similar racial/ethnic differences in HEI-2015 scores (12). However, little is known on the updated HEI-2015, aMED, and hPDI scores which measure alignment with the 2015–2020 DGAs among US Hispanic/Latino adults with heterogeneous dietary habits. In addition, it remains unknown whether adherence to different healthy eating patterns is associated with lower risk of CVD in US Hispanics/Latinos who have a high burden of cardiometabolic risk (e.g., obesity and diabetes) (13–16), although the beneficial association between adherence to different healthy eating patterns and risk of CVD has been documented in other populations (mostly non-Hispanic whites) (5–8).
Therefore, in this study, we aimed to evaluate 3 dietary scores, aMED, HEI-2015, and hPDI, which measure adherence to 3 different dietary patterns recommended by the 2015–2020 DGAs, in US Hispanics/Latinos of diverse backgrounds from a population-based cohort. We also examined associations between these 3 dietary scores and risk of CVD over ∼6 y in this population.
Methods
Study population
The Hispanic Community Health Study/Study of Latinos (HCHS/SOL) is a population-based cohort study in 16,415 self-identified Hispanic/Latino adults aged 18–74 y from 9872 households living in 4 US urban centers (Bronx, NY; Chicago, IL; Miami, FL; and San Diego, CA). Participants of Cuban, Dominican, Mexican, Puerto Rican, Central American, and South American backgrounds were recruited using a multistage area probability sampling design (2 stages for household and 3 stages for participant), as described previously (17). Comprehensive interviews and a clinical assessment were conducted by trained, certified, and bilingual staff at in-person clinical visits between March 2008 and June 2011. A second visit period started in October 2014 and concluded in December 2017. The study was approved by the institutional review boards at all participating institutions, and all participants gave written informed consent.
Assessment of dietary scores
Information on dietary intake was collected during the baseline visit by using two 24-h dietary recalls. The first recall was conducted at baseline in-person interviews, whereas the second recall was conducted through telephone, ∼30 d after the first interview.
Participants were instructed to estimate portion sizes with the use of food models (in-person) or a food-amount booklet (for telephone interviews). Data on foods and nutrients were collected and analyzed using the multiple-pass methods of the Nutrition Data System for Research software (version 11) from the Nutrition Coordinating Center at University of Minnesota. We averaged dietary data from both recalls to derive dietary pattern scores. If dietary information was missing in either visit, we used the information from 1 visit solely to calculate the dietary pattern score. Among 16,415 participants, 15,424 had both dietary recalls, whereas 861 participants had only 1 recall. Participants without any dietary recalls were excluded from the current analysis.
The aMED (2), the HEI-2015 (3), and the hPDI (4) were calculated to measure adherence to different dietary patterns. Supplemental Tables 1–3 summarize the detailed components and scoring criteria for each dietary score. The aMED, adapted by Fung et al. (2) to reflect adherence to the Mediterranean diet, included 9 components, with the total score ranging from 9 to 45. The HEI-2015, which includes 13 components with a total score from 0 to 100, assesses the extent to which an individual's diet aligns with the 2015–2020 DGAs (3). The hPDI comprises solely food groups that were coded based on intake quintiles, with a total score ranging from 15 to 75 (4). Higher dietary scores for each of the aforementioned 3 indexes represented greater adherence to individual healthy eating patterns.
Assessment of CVD
The primary outcome was incident CVD, comprised by coronary heart disease (CHD) and stroke during the follow-up period between the first and the second visit. CHD was defined as self-reported myocardial infarction, coronary bypass surgery, balloon angioplasty, or stent placement in coronary arteries, and stroke was ascertained from self-reported stroke (15).
Assessment of covariates
A structured questionnaire was used to obtain information on socioeconomic and demographic characteristics including Hispanic/Latino background, lifestyle factors, and medical and family histories. Generational status was defined based on participants’ nativity, classified as either born in or outside the US mainland (50 states). Those born in Puerto Rico or other US territories were classified as born outside of the US mainland to reflect their migration and acculturation experiences. Physical activity was measured using the Global Physical Activity Questionnaire and data were summarized in metabolic equivalent-hours per day (MET-h/d). BMI was calculated as measured weight in kilograms divided by measured height in meters squared (kg/m2). Dietary acculturation asked if the types of foods participants usually ate were of Hispanic/Latino or American origin on a 5-level Likert scale: 1 = mainly Hispanic/Latino foods, 2 = mostly Hispanic/Latino foods and some US/American foods, 3 = equal amount of Hispanic/Latino foods and US/American foods, 4 = mostly US/American foods and some Hispanic/Latino foods, or 5 = mainly US/American foods (18). In the current analysis, the first and second categories were combined as the “mostly Hispanic/Latino foods” group, and the fourth and fifth categories were combined as the “mostly US/American foods” group.
Statistical analysis
Among a total of 16,415 participants, 11,577 participants who completed the second visit examination were included in the current analysis. We excluded 137 participants with missing dietary information and 46 with implausible total energy intake (>6000 or <600 kcal/d in males, and >4000 or <400 kcal/d in females). Participants with baseline self-reported CVD and cancer (n = 1147) were also excluded, leaving 10,293 participants for further analysis because the exclusion criteria were not mutually exclusive (Supplemental Figure 1). To account for oversampling of subgroups and nonresponse to baseline and the follow-up visit, all analyses incorporated the HCHS/SOL complex study design and sampling weights, as described previously (17). Weights were trimmed and calibrated to 2010 US Census characteristics by age, sex, and Hispanic/Latino background in each field center's target population.
Age-adjusted descriptive characteristics of the study population were presented according to tertiles of the dietary pattern scores. Adjusted means (95% CIs) of 3 dietary scores across 6 Hispanic/Latino background groups were estimated using survey linear regression, adjusting for age, sex, mainland-US-born status, and field center. Adjusted means (95% CIs) of 3 dietary scores and 21 major food/drink groups (servings/d) between mainland-US-born and non-mainland-US-born participants were estimated using survey linear regression, adjusting for age, sex, field center, and Hispanic/Latino background. Percentages of mainland-US-born and non-mainland-US-born participants across 3 food type groups (mostly Hispanic/Latino foods, equal amount of Hispanic/Latino foods and US/American foods, and mostly US/American foods) were examined by χ2 test. Adjusted means (95% CIs) of 3 dietary scores across 3 food type groups were estimated using survey linear regression, adjusting for age, sex, field center, and Hispanic/Latino background.
Survey Poisson regression was used to estimate RRs and 95% CIs of incident CVD per SD increment of the dietary scores (dietary scores were standardized to z-scores) and across tertiles of the dietary scores after adjusting for age and sex (model 1). In the multivariable model (model 2), we further adjusted for field center, Hispanic/Latino background, generational status, education (no high school; at most high school; greater than high school), smoking (never; former; current ≤10 packs/y; current >10 packs/y), alcohol consumption except for aMED score (never; former; current ≤ 2 drinks/d in males or ≤1 drink/d in females; current >2 drinks/d in males or >1 drink/d in females), total energy intake (kcal/d), physical activity (MET-h/d), BMI, and use of antidiabetic drugs (yes/no), antihypertensive drugs (yes/no), or lipid-lowering drugs (yes/no). Associations of the 3 dietary scores with risk of CVD were further examined according to Hispanic/Latino background, age group, sex, generational status, smoking status, obesity status, and diabetes status.
Statistical analyses were performed using R version 3.3.2 (R Foundation) and Stata version 15.1 (StataCorp). All statistical tests were 2-sided, and P < 0.05 was considered to indicate statistical significance.
Results
Participant characteristics
Table 1 shows age-adjusted baseline characteristics according to tertiles of the 3 dietary pattern scores. Individuals with a higher aMED, HEI-2015, or hPDI score were significantly older. After adjusting for age, individuals in the highest tertile for all 3 dietary patterns were more likely to be never smokers; users of antihypertensive, lipid-lowering, and antidiabetic medications (P < 0.05); and to have lower BMI, than those with a lower score. Significant differences in these dietary scores were observed across field centers and Hispanic/Latino backgrounds. In addition, the characteristics’ distributions across tertiles were not consistent across the 3 dietary pattern scores. For example, higher education was associated with higher aMED but lower hPDI. Higher physical activity was associated with higher aMED and HEI-2015 but lower hPDI. Higher total energy intake was associated with higher aMED but lower HEI-2015 and hPDI. Moderate correlations between the 3 dietary scores were observed (Spearman r = 0.68 between aMED and HEI-2015; r = 0.48 between aMED and hPDI; and r = 0.56 between hPDI and HEI-2015).
TABLE 1.
Age-adjusted baseline characteristics of participants according to dietary pattern score tertiles1
| aMED | HEI-2015 | hPDI | |||||||
|---|---|---|---|---|---|---|---|---|---|
| T1 | T2 | T3 | T1 | T2 | T3 | T1 | T2 | T3 | |
| Score median (range) | 2 (0–2) | 3 (3–3) | 5 (4–9) | 45.2 (16.0–52.6) | 58.7 (52.7–64.8) | 72.0 (64.9–95.7) | 39 (22–42) | 46 (43–48) | 52 (49–69) |
| Participants, n | 2544 | 2390 | 5359 | 3431 | 3431 | 3431 | 3150 | 3544 | 3599 |
| Age, y | 37.6 ± 0.4 | 39.2 ± 0.5 | 42.1 ± 0.4* | 38.5 ± 0.3 | 40.0 ± 0.4 | 42.3 ± 0.5* | 36.1 ± 0.4 | 40.1 ± 0.4 | 45.9 ± 0.5* |
| Male | 44.0 | 44.5 | 41.5 | 47.3 | 41.9 | 38.7* | 55.9 | 42.3 | 28.1* |
| Study field center | |||||||||
| Bronx | 39.8 | 28.3 | 20.1* | 37.1 | 24.6 | 18.5* | 27.2 | 28.3 | 25.6* |
| Chicago | 11.0 | 14.7 | 18.6 | 11.0 | 15.2 | 22.1 | 11.9 | 15.1 | 21.3 |
| Miami | 35.7 | 34.3 | 25.6 | 37.8 | 33.7 | 17.1 | 39.1 | 31.0 | 21.2 |
| San Diego | 13.6 | 22.7 | 35.8 | 14.1 | 26.5 | 42.3 | 21.8 | 25.6 | 32.0 |
| Hispanic/Latino ethnic background | |||||||||
| Central American | 7.1 | 7.7 | 7.3* | 7.7 | 7.9 | 6.4* | 6.3 | 8.0 | 8.2* |
| Cuban | 26.5 | 23.5 | 16.7 | 27.0 | 24.1 | 9.6 | 29.7 | 21.3 | 12.4 |
| Dominican | 9.6 | 11.9 | 8.7 | 9.7 | 11.1 | 7.9 | 6.6 | 10.0 | 12.2 |
| Mexican | 20.1 | 33.3 | 49.5 | 21.0 | 37.3 | 59.4 | 26.6 | 38.3 | 49.6 |
| Puerto Rican | 26.9 | 14.1 | 9.4 | 23.3 | 12.5 | 8.5 | 20.9 | 13.4 | 10.1 |
| South American | 5.2 | 5.8 | 4.7 | 6.7 | 4.2 | 4.2 | 5.6 | 5.4 | 3.8 |
| Other heritage | 4.6 | 3.6 | 3.6 | 4.7 | 3.0 | 4.0 | 4.2 | 3.5 | 3.6 |
| Above high school education | 37.3 | 38.8 | 42.4* | 39.3 | 40.8 | 41.1 | 44.5 | 39.5 | 37.0* |
| Smoking status | |||||||||
| Never | 56.9 | 61.5 | 66.1* | 55.9 | 63.8 | 69.2* | 56.5 | 62.8 | 68.6* |
| Former | 15.6 | 19.2 | 19.4 | 18.1 | 18.3 | 19.1 | 18.2 | 19.7 | 17.7 |
| Current | 27.4 | 19.1 | 14.4 | 25.8 | 17.7 | 11.5 | 25.2 | 17.4 | 13.5 |
| Drinking status | |||||||||
| Never | 20.4 | 19.7 | 20.1 | 19.0 | 21.4 | 19.3* | 19.9 | 20.2 | 20.3* |
| Former | 28.8 | 31.1 | 29.4 | 27.9 | 29.0 | 33.3 | 26.7 | 29.9 | 32.9 |
| Current | 50.7 | 49.2 | 50.6 | 53.2 | 49.6 | 47.4 | 53.4 | 50.0 | 46.8 |
| Use of antihypertensive drugs | 12.6 | 14.9 | 12.5* | 13.1 | 12.8 | 13.2* | 12.2 | 13.5 | 13.5* |
| Use of lipid-lowering drugs | 7.9 | 9.1 | 10.1* | 7.5 | 9.4 | 11.3* | 7.0 | 9.4 | 11.0* |
| Use of antidiabetic drugs | 6.9 | 8.8 | 9.2* | 6.6 | 8.6 | 10.6* | 6.8 | 7.2 | 11.3* |
| BMI, kg/m2 | 29.4 ± 0.2 | 29.4 ± 0.2 | 29.2 ± 0.1* | 29.5 ± 0.2 | 29.3 ± 0.2 | 28.9 ± 0.2* | 29.4 ± 0.2 | 29.4 ± 0.2 | 29.0 ± 0.2* |
| Physical activity, MET-h/d | 11.5 ± 0.6 | 13.1 ± 0.7 | 12.2 ± 0.4* | 11.9 ± 0.5 | 12.5 ± 0.5 | 12.3 ± 0.6* | 13.2 ± 0.6 | 12.1 ± 0.5 | 10.9 ± 0.5* |
| Total energy intake, kcal/d | 1830 ± 24 | 1940 ± 27 | 2026 ± 19* | 1979 ± 24 | 1992 ± 22 | 1846 ± 24* | 2234 ± 21 | 1864 ± 22 | 1631 ± 23* |
Values are age-adjusted means ± SEs for continuous variables (except for age) or percentages for categoric variables accounting for the Hispanic Community Health Study/Study of Latinos complex survey design. *P < 0.05, calculated using chi-square test for categoric variables and linear regression for continuous variables, respectively, across dietary pattern score tertiles. aMED, alternate Mediterranean diet; HEI, Healthy Eating Index; hPDI, healthful Plant-based Diet Index; MET, metabolic equivalent; T, tertile.
Dietary patterns according to Hispanic background and mainland-US-born status
After adjustment for age, sex, generational status, and field center, means of all 3 dietary scores were significantly different across the 6 Hispanic/Latino background groups (all P < 0.001). All 3 scores were highest in those of Mexican background, followed by those of Dominican, Central American, South American, Cuban, and Puerto Rican backgrounds (Figure 1). Figure 2 shows the means ± SDs of the 3 dietary scores and major food group components between mainland-US-born and non-mainland-US-born Hispanics/Latinos. Compared with mainland-US-born Hispanic/Latino adults, non-mainland-US-born Hispanics/Latinos had significantly higher dietary scores (all P < 0.001), after adjusting for age, sex, field center, and Hispanic background (Figure 2A). Compared with mainland-US-born Hispanics/Latinos, non-mainland-US-born Hispanics/Latinos had higher intakes of many healthy foods, including vegetable oils, fresh vegetables, seafood and plant proteins, total fruits, whole grains, fruits, fish, and legumes, and lower intake of refined grains (Figure 2B).
FIGURE 1.

Adjusted means of 3 dietary pattern scores according to Hispanic/Latino background groups. Data are adjusted means and 95% CIs of aMED, HEI-2015, and hPDI across 6 Hispanic/Latino background groups, adjusting for age, sex, generation status, and field center. P values were calculated using ANOVA. aMED, Alternate Mediterranean diet; HEI, Healthy Eating Index; hPDI, healthful Plant-based Diet Index.
FIGURE 2.

Adjusted means of 3 dietary pattern scores and major food/drink group intakes according to mainland-US-born status. (A) Data are adjusted means and 95% CIs of 3 dietary pattern scores (aMED, HEI-2015, and hPDI) between mainland-US-born and non-mainland-US born Hispanics/Latinos, adjusting for age, sex, Hispanic/Latino background, and field center. P values were calculated using linear regression. (B) Data are adjusted means of 21 major food/drink groups (servings/d) between mainland-US-born and non-mainland-US born Hispanics/Latinos, adjusting for age, sex, Hispanic/Latino background, and field center. *P < 0.05, calculated using linear regression, after controlling for multiple testing using the false discovery rate. aMED, Alternate Mediterranean diet; HEI, Healthy Eating Index; hPDI, healthful Plant-based Diet Index; SSB, sugar-sweetened beverage.
We also compared the 3 dietary scores between mainland-US-born and non-mainland-US-born Hispanics/Latinos across 6 Hispanic/Latino backgrounds. Non-mainland-US-born Hispanics/Latinos had generally higher dietary scores than mainland-US-born Hispanics/Latinos, although significant differences were only observed in the subgroups of Mexican and Central American backgrounds (Supplemental Figure 2). In addition, non-mainland-US-born Hispanics/Latinos were more likely to consume Hispanic/Latino foods, whereas mainland-US-born Hispanics/Latinos were more likely to consume US/American foods (Supplemental Figure 3A). Consistently, all 3 dietary scores were higher in individuals consuming mostly Hispanic/Latino foods than in those consuming mostly US/American foods (Supplemental Figure 3B).
Dietary patterns and incident CVD
During an average of 6 y of follow-up, 232 incident cases of CVD were identified among 10,293 participants free of CVD or cancer at baseline. All 3 continuous dietary scores were inversely associated with risk of CVD (Table 2). After multivariate adjustment, a 1-SD increment of aMED, HEI-2015, and hPDI was associated with an RR of CVD of 0.74 (95% CI: 0.60, 0.91), 0.80 (95% CI: 0.63, 1.00), and 0.74 (95% CI: 0.60, 0.93), respectively. Tertile analyses showed similar results (Table 2). After multivariate adjustment, the RR was 0.52 (95% CI: 0.34, 0.81) for aMED, 0.65 (95% CI: 0.39, 1.07) for HEI-2015, and 0.59 (95% CI: 0.37, 0.95) for hPDI when comparing the highest with the lowest tertiles of dietary scores.
TABLE 2.
Associations between dietary pattern scores and incident cardiovascular disease1
| Dietary pattern score (per SD increment) | Dietary pattern score tertiles | |||||
|---|---|---|---|---|---|---|
| RR (95% CI) | P value | T1 (Reference) | T2, RR (95% CI) | T3, RR (95% CI) | P-trend | |
| aMED | ||||||
| Cases/participants, n | 232/10,293 | 75/2544 | 60/2390 | 97/5359 | ||
| Model 1 | 0.70 (0.58, 0.85) | <0.001 | 1.00 | 0.81 (0.49, 1.36) | 0.46 (0.30, 0.69) | <0.001 |
| Model 2 | 0.74 (0.60, 0.91) | 0.005 | 1.00 | 0.88 (0.49, 1.57) | 0.52 (0.34, 0.81) | 0.003 |
| HEI-2015 | ||||||
| Cases/participants, n | 232/10,293 | 84/3431 | 79/3431 | 69/3431 | ||
| Model 1 | 0.76 (0.62, 0.93) | 0.009 | 1.00 | 0.80 (0.51, 1.26) | 0.61 (0.39, 0.95) | 0.03 |
| Model 2 | 0.80 (0.63, 1.00) | 0.05 | 1.00 | 0.86 (0.51, 1.42) | 0.65 (0.39, 1.07) | 0.11 |
| hPDI | ||||||
| Cases/participants, n | 232/10,293 | 83/3150 | 71/3544 | 78/3599 | ||
| Model 1 | 0.79 (0.63, 0.99) | 0.04 | 1.00 | 0.61 (0.39, 0.95) | 0.66 (0.42, 1.05) | 0.08 |
| Model 2 | 0.74 (0.60, 0.93) | 0.008 | 1.00 | 0.60 (0.40, 0.91) | 0.59 (0.37, 0.95) | 0.03 |
Values are RRs and 95% CIs from survey Poisson regressions, adjusting for age and sex (model 1); and further adjusting for study field center, Hispanic/Latino background, generation status, education, smoking, alcohol consumption (not for aMED), total energy intake, physical activity, BMI, and use of antidiabetic drugs, antihypertensive drugs, or lipid-lowering drugs (model 2). aMED, alternate Mediterranean diet; HEI, Healthy Eating Index; hPDI, healthful Plant-based Diet Index; T, tertile.
We did not find significant differences in the associations of the 3 dietary scores with risk of CVD across Hispanic/Latino backgrounds (Figure 3) (all P-interactions ≥ 0.35). However, most of these associations in each of the background groups were not statistically significant, which might be due to insufficient statistical power in this subgroup analysis (Supplemental Table 4). In addition, we did not find significant differences in the associations between dietary scores and risk of CVD stratified by sex, generation status, smoking status, and diabetes status (Supplemental Table 5).
FIGURE 3.
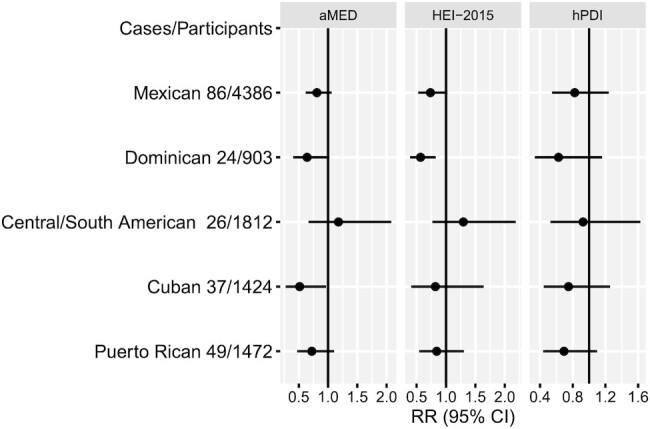
Associations between 3 dietary pattern scores and incident CVD according to Hispanic/Latino background. Data are risk ratios (RRs) and 95% CIs for CVDs per 1-SD increment of the continuous dietary pattern scores from survey Poisson regressions, adjusting for age, sex, generation status, study field center, education, smoking, alcohol consumption (not for aMED), total energy intake, physical activity, BMI, and use of antidiabetic drugs, antihypertensive drugs, or lipid-lowering drugs. All P-interactions ≥ 0.35. aMED, Alternate Mediterranean diet; CVD, cardiovascular disease; HEI, Healthy Eating Index; hPDI, healthful Plant-based Diet Index.
Discussion
In this study, we evaluated adherence to 3 different dietary patterns recommended by the 2015–2020 DGAs, measured by 3 dietary scores (i.e., aMED, HEI-2015, and hPDI), in a large prospective cohort of Hispanic/Latino adults of diverse backgrounds living in the United States. Individuals of Mexican background had the highest scores for all 3 indexes, whereas those of Puerto Rican background had the lowest scores. In addition, non-mainland-US-born Hispanics/Latinos had greater adherence to these dietary patterns than mainland-US-born Hispanics/Latinos. Despite significant differences in these dietary scores across Hispanic/Latino backgrounds and immigrant generations, greater adherence to all 3 healthy dietary patterns was associated with lower risk of incident CVD over 6 y in US Hispanic/Latino adults overall.
Previous studies using NHANES data have shown greater adherence to the DGAs, measured by HEI scores, in US Hispanics/Latinos than in non-Hispanic whites and blacks (11, 12). For example, a recent analysis of the 2011–2018 NHANES data reported an unadjusted HEI-2015 of 54.4 in US Hispanic adults, which was higher than in non-Hispanic whites (53.8) and blacks (52.7) (12). Our data in this US Hispanic/Latino population showed a higher HEI-2015 (unadjusted mean: 58) than NHANES findings among non-Hispanic whites and non-Hispanic blacks. However, the large proportion of those of Mexican background, who were documented to have better dietary quality than other ethnic groups, in the NHANES and our study could bias the result toward favoring Hispanic diet quality. Because aMED and hPDI were calculated based on relative levels of dietary intake (e.g., quintiles) within a study sample, we were unable to compare our results with those reported in other racial/ethnic groups. Nevertheless, another study also showed relatively higher aMED and hPDI in US Hispanics than in other racial/ethnic groups, although participants included in the study were mainly non-Hispanic whites (5).
Despite commonly being aggregated as 1 ethnic group, the US Hispanic/Latino population is composed of diverse cultural backgrounds and its subgroups are noted to have distinct dietary patterns. Understanding each group's particular dietary habits and their effects on diseases can have considerable public health relevance. The present analysis showed differences in all 3 dietary scores, which measure alignment with the 2015–2020 DGAs, across 6 Hispanic/Latino background groups. This is consistent with previous analyses on individual foods and nutrients as well as the HEI-2010 in this US Hispanic/Latino study (10, 19). The 3 dietary scores, which showed an inverse association with CVD, provide an intuitive overall assessment of eating quality in each Hispanic/Latino background. For example, individuals of Puerto Rican background, who had the lowest score in all 3 healthy dietary patterns, were previously reported to have relatively higher intakes of total fat, saturated fat, sodium, refined carbohydrates, and red meats, while having lower intakes of fiber, folate, fish, and fruit (20). Prior studies also revealed that prevalence of CVD risk factors and self-reported CVD were highest among individuals of Puerto Rican background (15). These differences appeared to be consistent with our findings that unhealthy dietary components contributed to lower dietary scores in those of Puerto Rican background and corresponded to their higher risk of CVD than in other Hispanic/Latino background groups.
Another major finding of this study is that we found lower adherence to the 2015–2020 DGAs in mainland-US-born Hispanics/Latinos than in non-mainland-US-born Hispanics/Latinos (21–23). Compared with the non-mainland-US-born Hispanics/Latinos, those born in the mainland United States consumed more US-American style foods, as expected, which were associated with lower levels of all 3 dietary scores. Interestingly, a prior study has showed that individuals of Puerto Rican background may not follow this acculturation pattern (20), which is in line with our current results showing relatively small differences in the 3 dietary scores between mainland-US-born and non-mainland-US-born individuals of Puerto Rican background. Our analysis also showed that differences in dietary scores between the non-mainland-US-born and mainland-US-born Hispanics/Latinos were majorly driven by differences in dietary intakes of healthy plant-based foods (e.g., whole grains, fruits, vegetables, legumes, and nuts). This is in line with the NHANES data that the overall higher dietary quality in US Hispanics/Latinos might be due to higher consumption of healthy plant-based foods than among non-Hispanic whites and non-Hispanic blacks. Indeed, the unadjusted HEI-2015 in mainland-US-born Hispanics/Latinos (53.6) was much lower than in non-mainland-US-born Hispanics/Latinos (59.6) in this study, but was similar to those in non-Hispanic whites (53.8) and non-Hispanic blacks (52.7) reported in the NHANES.
To the best of our knowledge, this is the first study to examine prospective associations of different dietary pattern scores and risk of CVD in a population-based US Hispanic/Latino cohort of diverse backgrounds. In a previous study which examined the same dietary pattern scores in relation to CVD in 3 US cohorts of mostly non-Hispanic whites, there were no significant differences in the associations between these dietary scores and risk of CVD across different racial/ethnic groups, but the inverse associations between dietary scores and CVD were not significant in Hispanics/Latinos, which might be due to a relatively small number of Hispanic/Latino participants having been included in the analysis (5). Our results provide further evidence supporting similar beneficial effects of healthy dietary patterns on CVD risk in US Hispanics/Latinos despite their disproportionate health burden of CVD risk compared with non-Hispanic whites (13–15). The 3 dietary scores that measure alignment with the 2015–2020 DGAs share several similar components, such as higher consumption of whole grains, vegetables, fruits, nuts, and legumes, but some differences in specific dietary and nutritional components cannot be ignored (24–26). For example, higher fish intake is a positive contributor in aMED but a negative contributor in hPDI. Unlike aMED and HEI-2015, hPDI did not show a dose–response association with CVD in the tertile analysis. Individuals with a high hPDI score might have limited some animal-based foods (e.g., fish, dairy) which could be beneficial for cardiovascular health (27, 28). Nonetheless, higher scores in any of the score systems were associated with lower CVD risk, suggesting that it is unnecessary to conform to 1 specific dietary pattern to achieve better cardiovascular health (1). This might have a particularly important public health implication because US Hispanics/Latinos of different backgrounds may have distinct dietary patterns due to diverse food cultures.
This study has some limitations that need to be taken into consideration. First, dietary information and CVD incidence were collected via self-report. Measurement error is inevitable owing to misreporting, although the use of averages of two 24-h recalls could have helped to reduce measurement error. Because cause-specific mortality data are not yet available in the HCHS/SOL, participants with CVD-caused death were not included in the current analysis. Second, the HCHS/SOL only includes Hispanics/Latinos in 4 urban areas (Bronx, NY; Chicago, IL; Miami, FL; and San Diego, CA) and is not a representative sample of all Hispanics/Latinos living in all 50 states and territories in the United States. Finally, the average 6 y of follow-up time is relatively short and thus the number of incident CVD cases was relatively small, which may have limited our ability to detect significant associations within each subgroup analysis.
In summary, in a US Hispanic/Latino cohort of diverse background, we found that adherence to the healthy eating patterns suggested by the 2015–2020 DGAs varied by Hispanic/Latino backgrounds and immigrant generations, and higher compliance with healthy eating patterns was associated with lower CVD risk. Our findings are in line with previous results in other racial/ethnic groups and further support a beneficial role of healthy eating patterns in the prevention of CVD.
Supplementary Material
Acknowledgements
A complete list of HCHS/SOL staff and investigators can be found in Ann Epidemiol 2010;20:642–649 or at http://sites.cscc.unc.edu/hchs/.
The authors’ responsibilities were as follows—QQ, FBH, and RK: conceived the study; Y-YC, NA, and QQ: wrote the first draft; G-CC and JX: performed data analysis; YM-R, DS-A, JM, MD, CRI, FBH, and RK: commented on the manuscript; and all authors: contributed data to the study and read and approved the final manuscript.
Notes
Author disclosures: The authors report no conflicts of interest.
Supported by National Heart, Lung, and Blood Institute (NHLBI) grant R01HL060712 and National Institute of Diabetes and Digestive and Kidney Diseases (NIDDK) grant R01DK119268. Other funding sources for this study include NHLBI grants K01HL129892, R01HL140976, and R01HL136266; NIDDK grants R01DK112940, R01DK120870, and P30DK046200; and NIDDK grant P30 DK111022 (to the New York Regional Center for Diabetes Translation Research). The Hispanic Community Health Study/Study of Latinos (HCHS/SOL) is a collaborative study supported by contracts from the NHLBI to the University of North Carolina (HHSN268201300001I / N01-HC-65233), University of Miami (HHSN268201300004I / N01-HC-65234), Albert Einstein College of Medicine (HHSN268201300002I / N01-HC-65235), University of Illinois at Chicago (HHSN268201300003I / N01-HC-65236), Northwestern University, and San Diego State University (HHSN268201300005I / N01-HC-65237). The following Institutes/Centers/Offices have contributed to the HCHS/SOL through a transfer of funds to the NHLBI: National Institute on Minority Health and Health Disparities, National Institute on Deafness and Other Communication Disorders, National Institute of Dental and Craniofacial Research, NIDDK, National Institute of Neurological Disorders and Stroke, and NIH Institution-Office of Dietary Supplements.
Supplemental Tables 1–5 and Supplemental Figures 1–3 are available from the “Supplementary data” link in the online posting of the article and from the same link in the online table of contents at https://academic.oup.com/ajcn/.
Abbreviations used: aMED, Alternate Mediterranean diet; CHD, coronary heart disease; CVD, cardiovascular disease; DGAs, Dietary Guidelines for Americans; HCHS/SOL, Hispanic Community Health Study/Study of Latinos; HEI, Healthy Eating Index; hPDI, healthful Plant-based Diet Index; MET-h/d, metabolic equivalent-hours per day.
Contributor Information
Yi-Yun Chen, Jacobi Medical Center, Albert Einstein College of Medicine, Bronx, NY, USA.
Guo-Chong Chen, Department of Epidemiology and Population Health, Albert Einstein College of Medicine, Bronx, NY, USA.
Nathaniel Abittan, Jacobi Medical Center, Albert Einstein College of Medicine, Bronx, NY, USA.
Jiaqian Xing, Department of Epidemiology and Population Health, Albert Einstein College of Medicine, Bronx, NY, USA.
Yasmin Mossavar-Rahmani, Department of Epidemiology and Population Health, Albert Einstein College of Medicine, Bronx, NY, USA.
Daniela Sotres-Alvarez, Department of Biostatistics, Gillings School of Global Public Health, University of North Carolina at Chapel Hill, Chapel Hill, NC, USA.
Josiemer Mattei, Department of Nutrition, Harvard TH Chan School of Public Health, Boston, MA, USA.
Martha Daviglus, Institute for Minority Health Research, University of Illinois at Chicago, Chicago, IL, USA.
Carmen R Isasi, Department of Epidemiology and Population Health, Albert Einstein College of Medicine, Bronx, NY, USA.
Frank B Hu, Department of Nutrition, Harvard TH Chan School of Public Health, Boston, MA, USA; Department of Epidemiology, Harvard TH Chan School of Public Health, Boston, MA, USA; Channing Division of Network Medicine, Department of Medicine, Brigham and Women's Hospital and Harvard Medical School, Boston, MA, USA.
Robert Kaplan, Department of Epidemiology and Population Health, Albert Einstein College of Medicine, Bronx, NY, USA; Public Health Sciences Division, Fred Hutchinson Cancer Research Center, Seattle, WA, USA.
Qibin Qi, Department of Epidemiology and Population Health, Albert Einstein College of Medicine, Bronx, NY, USA; Department of Nutrition, Harvard TH Chan School of Public Health, Boston, MA, USA.
Data Availability
Data described in the article, code book, and analytic code will be made available upon request pending application and approval.
References
- 1. Dietary Guidelines Advisory Committee . Dietary guidelines for Americans 2015–2020. [Internet]. Washington (DC): Government Printing Office; 2015. [Accessed 2022 Jul 1]. Available from: https://health.gov/our-work/food-nutrition/previous-dietary-guidelines/2015. [Google Scholar]
- 2. Fung TT, Hu FB, McCullough ML, Newby PK, Willett WC, Holmes MD. Diet quality is associated with the risk of estrogen receptor–negative breast cancer in postmenopausal women. J Nutr. 2006;136(2):466–72. [DOI] [PubMed] [Google Scholar]
- 3. Krebs-Smith SM, Pannucci TE, Subar AF, Kirkpatrick SI, Lerman JL, Tooze JAet al. Update of the Healthy Eating Index: HEI-2015. J Acad Nutr Diet. 2018;118(9):1591–602. [DOI] [PMC free article] [PubMed] [Google Scholar]
- 4. Satija A, Bhupathiraju SN, Rimm EB, Spiegelman D, Chiuve SE, Borgi Let al. Plant-based dietary patterns and incidence of type 2 diabetes in US men and women: results from three prospective cohort studies. PLoS Med. 2016;13(6):e1002039. [DOI] [PMC free article] [PubMed] [Google Scholar]
- 5. Shan Z, Li Y, Baden MY, Bhupathiraju SN, Wang DD, Sun Qet al. Association between healthy eating patterns and risk of cardiovascular disease. JAMA Intern Med. 2020;180(8):1090–100. [DOI] [PMC free article] [PubMed] [Google Scholar]
- 6. George SM, Ballard-Barbash R, Manson JE, Reedy J, Shikany JM, Subar AFet al. Comparing indices of diet quality with chronic disease mortality risk in postmenopausal women in the Women's Health Initiative Observational Study: evidence to inform national dietary guidance. Am J Epidemiol. 2014;180(6):616–25. [DOI] [PMC free article] [PubMed] [Google Scholar]
- 7. Reedy J, Krebs-Smith SM, Miller PE, Liese AD, Kahle LL, Park Yet al. Higher diet quality is associated with decreased risk of all-cause, cardiovascular disease, and cancer mortality among older adults. J Nutr. 2014;144(6):881–9. [DOI] [PMC free article] [PubMed] [Google Scholar]
- 8. Harmon BE, Boushey CJ, Shvetsov YB, Ettienne R, Reedy J, Wilkens LRet al. Associations of key diet-quality indexes with mortality in the Multiethnic Cohort: the Dietary Patterns Methods Project. Am J Clin Nutr. 2015;101(3):587–97. [DOI] [PMC free article] [PubMed] [Google Scholar]
- 9. US Census Bureau . Profile America Facts For Features: CB16-FF.16. [Internet]. Suitland (MD): US Census Bureau; 2016. [Accessed 2022 Jul 1]. Available from: https://www.census.gov/content/dam/Census/newsroom/facts-for-features/2016/cb16-ff16.pdf. [Google Scholar]
- 10. Siega-Riz AM, Pace ND, Butera NM, Van Horn L, Daviglus ML, Harnack Let al. How well do U.S. Hispanics adhere to the Dietary Guidelines for Americans? Results from the Hispanic Community Health Study/Study of Latinos. Health Equity. 2019;3(1):319–27. [DOI] [PMC free article] [PubMed] [Google Scholar]
- 11. Rehm CD, Monsivais P, Drewnowski A. Relation between diet cost and Healthy Eating Index 2010 scores among adults in the United States 2007–2010. Prev Med. 2015;73:70–5. [DOI] [PMC free article] [PubMed] [Google Scholar]
- 12. Ma Y, Weng X, Gao X, Winkels R, Cuffee Y, Gupta Set al. Healthy Eating Index scores differ by race/ethnicity but not hypertension awareness status among US adults with hypertension: findings from the 2011–2018 National Health and Nutrition Examination Survey. J Acad Nutr Diet. 2022;122(5):1000–12. [DOI] [PubMed] [Google Scholar]
- 13. Go AS, Mozaffarian D, Roger VL, Benjamin EJ, Berry JD, Blaha MJet al. Executive summary: heart disease and stroke statistics—2014 update: a report from the American Heart Association. Circulation. 2014;129(3):399–410. [DOI] [PubMed] [Google Scholar]
- 14. Rodriguez CJ, Allison M, Daviglus ML, Isasi CR, Keller C, Leira ECet al. Status of cardiovascular disease and stroke in Hispanics/Latinos in the United States: a science advisory from the American Heart Association. Circulation. 2014;130(7):593–625. [DOI] [PMC free article] [PubMed] [Google Scholar]
- 15. Daviglus ML, Talavera GA, Avilés-Santa ML, Allison M, Cai J, Criqui MHet al. Prevalence of major cardiovascular risk factors and cardiovascular diseases among Hispanic/Latino individuals of diverse backgrounds in the United States. JAMA. 2012;308(17):1775–84. [DOI] [PMC free article] [PubMed] [Google Scholar]
- 16. Caldera YM, Lindsey EW. Mexican American children and families: multidisciplinary perspectives. New York (NY): Routledge, Taylor & Francis Group; 2015. [Google Scholar]
- 17. LaVange LM, Kalsbeek WD, Sorlie PD, Avilés-Santa LM, Kaplan RC, Barnhart Jet al. Sample design and cohort selection in the Hispanic Community Health Study/Study of Latinos. Ann Epidemiol. 2010;20(8):642–9. [DOI] [PMC free article] [PubMed] [Google Scholar]
- 18. Isasi CR, Ayala GX, Sotres-Alvarez D, Madanat H, Penedo F, Loria CMet al. Is acculturation related to obesity in Hispanic/Latino adults? Results from the Hispanic Community Health Study/Study of Latinos. J Obes. 2015:186276. [DOI] [PMC free article] [PubMed] [Google Scholar]
- 19. Siega-Riz AM, Sotres-Alvarez D, Ayala GX, Ginsberg M, Himes JH, Liu Ket al. Food-group and nutrient-density intakes by Hispanic and Latino backgrounds in the Hispanic Community Health Study/Study of Latinos. Am J Clin Nutr. 2014;99(6):1487–98. [DOI] [PMC free article] [PubMed] [Google Scholar]
- 20. Mattei J, Sotres-Alvarez D, Daviglus ML, Gallo LC, Gellman M, Hu FBet al. Diet quality and its association with cardiometabolic risk factors vary by Hispanic and Latino ethnic background in the Hispanic Community Health Study/Study of Latinos. J Nutr. 2016;146(10):2035–44. [DOI] [PMC free article] [PubMed] [Google Scholar]
- 21. Lin H, Bermudez OI, Tucker KL. Dietary patterns of Hispanic elders are associated with acculturation and obesity. J Nutr. 2003;133(11):3651–7. [DOI] [PubMed] [Google Scholar]
- 22. Gray VB, Cossman JS, Dodson WL, Byrd SH. Dietary acculturation of Hispanic immigrants in Mississippi. Salud Publica Mex. 2005;47(5):351–60. [DOI] [PubMed] [Google Scholar]
- 23. Maldonado LE, Adair LS, Sotres-Alvarez D, Mattei J, Mossavar-Rahmani Y, Perreira KMet al. Dietary patterns and years living in the United States by Hispanic/Latino heritage in the Hispanic Community Health Study/Study of Latinos (HCHS/SOL). J Nutr. 2021;151(9):2749–59. [DOI] [PMC free article] [PubMed] [Google Scholar]
- 24. Wang X, Ouyang Y, Liu J, Zhu M, Zhao G, Bao Wet al. Fruit and vegetable consumption and mortality from all causes, cardiovascular disease, and cancer: systematic review and dose-response meta-analysis of prospective cohort studies. BMJ. 2014;349:g4490. [DOI] [PMC free article] [PubMed] [Google Scholar]
- 25. Guasch-Ferré M, Liu X, Malik VS, Sun Q, Willett WC, Manson JEet al. Nut consumption and risk of cardiovascular disease. J Am Coll Cardiol. 2017;70(20):2519–32. [DOI] [PMC free article] [PubMed] [Google Scholar]
- 26. Aune D, Keum N, Giovannucci E, Fadnes LT, Boffetta P, Greenwood DCet al. Whole grain consumption and risk of cardiovascular disease, cancer, and all cause and cause specific mortality: systematic review and dose-response meta-analysis of prospective studies. BMJ. 2016;353:i2716. [DOI] [PMC free article] [PubMed] [Google Scholar]
- 27. Jiang L, Wang J, Xiong K, Xu L, Zhang B, Ma A. Intake of fish and marine n-3 polyunsaturated fatty acids and risk of cardiovascular disease mortality: a meta-analysis of prospective cohort studies. Nutrients. 2021;13(7):2342. [DOI] [PMC free article] [PubMed] [Google Scholar]
- 28. Soedamah-Muthu SS, Ding EL, Al-Delaimy WK, Hu FB, Engberink MF, Willett WCet al. Milk and dairy consumption and incidence of cardiovascular diseases and all-cause mortality: dose-response meta-analysis of prospective cohort studies. Am J Clin Nutr. 2011;93(1):158–71. [DOI] [PMC free article] [PubMed] [Google Scholar]
Associated Data
This section collects any data citations, data availability statements, or supplementary materials included in this article.
Supplementary Materials
Data Availability Statement
Data described in the article, code book, and analytic code will be made available upon request pending application and approval.