Abstract
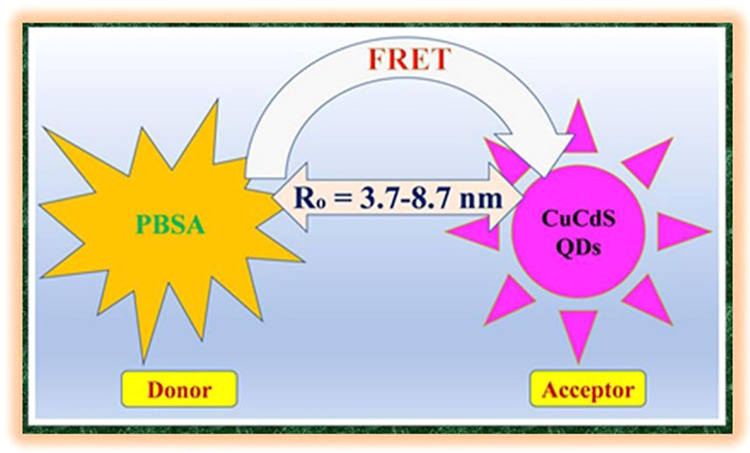
Quantum dots (QDs) are semiconducting nanocrystals that exhibit size- and composition-dependent optical and electronic properties. Recently, Cu-based II–VI ternary CuxCd1–xS (CCS) QDs have emerged as a promising class of QDs as compared to their binary counterparts (CuS and CdS). Herein, a series of ternary CCS QDs are synthesized by changing the molar concentration of Cu2+ ions only keeping the 1:1 ratio of the stoichiometric mixture of Cd2+ and S2–. These CCS QDs are attached to 2-phenylbenzimidazole-5-sulfonic acid (PBSA), an eminent UV-B filter widely used in many commercial sunscreen products to avoid skin erythema and DNA mutagenic photolesions. The photoinduced Förster resonance energy transfer (FRET) is investigated from PBSA to CCS QDs as a function of Cu concentration in CCS QDs using the steady-state photoluminescence and time-resolved photoluminescence measurements. A 2-fold increase in the magnitude of non-radiative energy transfer rate (KT(r)) is observed as the molar concentration of Cu in CCS QDs increases from 2 to 10 mM. Our findings suggest that in PBSA-CCS QD dyads, the FRET occurrence from PBSA to QDs is dictated by the dynamic mode of photoluminescence (PL) quenching. The bimolecular PL quenching rate constants (kq) estimated by Stern–Volmer’s plots for PBSA-CCS QD dyads are of the order of 1010 M–1 s–1, which signifies that in the PBSA-CCS QD dyad FRET system, the process of PL quenching is entirely diffusion-controlled.
1. Introduction
Quantum dots (QDs) are semiconducting nanocrystals having a size in the range of 1.5–10.0 nm with three-dimensional confinement of electrons and exhibit size-dependent optical and electronic properties.1,2 They also demonstrate several distinguishable features including size-dependent luminescence,3 a high quantum yield,4 long fluorescence lifetimes,5 photobleaching stability,6 a large absorption coefficient, broad absorption spectra,7 and narrow emission spectra.8 Owing to the distinct and unique properties of QDs, they are widely used in fluorescence biosensors,9 photocatalysts,10 drug delivery,11 bioimaging,12 and optoelectronic devices, such as solar cells,13 light-emitting diodes,14 and lasers.13 Although the binary semiconductor QDs are widely used,15 recently, alloyed (ternary and quaternary) QDs have been at the prime focus because of their potential applications that can be tuned by controlling the constituent stoichiometries and internal structure.8,9,16 More recently, Cu-based II–VI semiconductor nanocrystals such as CuxCd1−xS (CCS) have emerged as promising candidates due to their specific advantages relative to their corresponding binary counterparts CuS and CdS, which allow tuning the desirable optoelectronic properties.17 In addition, Cu chalcogenide QDs are inexpensive, stabilized under photoirradiation, moisture and oxygen, biocompatible, and durable.18−20
In parallel in the past two decades, there has been growing interest to prepare the biocompatible semiconductor QDs containing sunscreen systems to filter the ultraviolet (UV) radiations.21 Contemplating human health risks, the extremely pertinent and concerning section of the solar spectrum is the UV radiations that are further subdivided into UV-A (320–400 nm), UV-B (280–320 nm), and UV-C (below 280 nm) radiations.22 The more energetic UV-C radiations are entirely absorbed by ozone in the stratosphere, while less energetic UV-B (1–10%) and UV-A (80–90%) reach the earth’s surface.23 Tanning and photoaging are linked with UV-A exposure.24 UV-B radiations are genotoxic radiations that directly cause skin erythema and DNA mutagenic photolesions.25 The adjacent DNA bases through various molecular rearrangements form dimeric photoproducts such as cyclobutene dimers and pyrimidine (6-4 photoproducts) after direct absorption of UV-B radiations.26,27 These mutations in DNA are self-repaired by the excision repair mechanism.28 The UV-B radiations have 1000 times more damaging effects than UV-A.22 An ever-increasing worldwide utilization of sunblock components has been noticed in the global sun care market of net worth up to 11.6 billion USD in 2018, and it is estimated that it will achieve a globally 24.4 billion USD by 2029.29 2-Phenylbenzimidazole-5-sulfonic acid (PBSA), also recognized as “ensulizole”, is a renowned UV-B-type artificial sunscreen filter.30 Previously, this compound was analyzed extensively as an environmental pollutant in the treatment of wastewater.31−34
Herein, we attach PBSA with ternary CCS QDs and investigate the photoinduced FRET from PBSA donor coupled with CCS QD acceptor for the first time to the best of our knowledge. The optical properties of CCS QDs are not only size-dependent but also composition-dependent and can be tailored by changing the ratios of their constituent elements Cu, Cd, and S.16 In alloyed ternary CCS QDs, the band gap, absorption edge, and the position of the valence band (VB) and conduction band (CB) can be regulated by changing Cu2+/Cd2+ ratios.35 In this study, a series of ternary CCS QDs are synthesized by changing the molar concentration of Cu only in the 1:1 stoichiometric mixture of Cd and S. After synthesis, the CCS QDs are mixed with PBSA in an aqueous solution, and the effect of the molar ratio of Cu on FRET in terms of PL quenching is investigated by SSPL and TRPL analysis. In PBSA-CCS QD dyads, the mercaptoacetic acid (MAA)-functionalized CCS QDs interact with PBSA through H-bonding and PBSA exhibits a diffusion-controlled dynamic mode of PL quenching that is inferred from the magnitude of bimolecular quenching rate constant.
2. Experimental Section
2.1. Chemicals
All the chemicals used for experimental work were purchased from Sigma-Aldrich and used as received from the company without any further purification. These included copper nitrate (Cu(NO3)2·3H2O, ≥98%), cadmium chloride (CdCl2·2.5H2O, ≥99%), sodium hydroxide (NaOH, 99%), mercaptoacetic acid (MAA, ≥98%), sodium sulfide (Na2S·9H2O, ≥99.9%), anhydrous methanol (99.8%), and absolute ethanol (99.8%). All the solutions were prepared in doubly deionized water during the experiments.
2.2. Synthesis of CCS QDs and Association with PBSA
The colloidal synthesis method was used to synthesize ternary CCS QDs. Briefly, 20 mL of 2 mM (x = 2) aqueous solution of Cu(NO3)2·3H2O and 20 mL of 2 mM aqueous solution of CdCl2·2.5H2O were added to a three-necked round-bottom flask. Nitrogen gas purging was performed to create an oxygen-free environment for the reaction. A turbid solution was formed after the addition of a 10 mL aqueous solution of 0.5 M MAA (as a stabilizing agent) into the above solution. Afterward, 0.1 M aqueous NaOH was added dropwise with stirring to adjust the pH value between 9 and 11, and the turbid solution turned clear. In the end, 20 mL of an aqueous solution of 2 mM sodium sulfide (as a sulfur source) was injected into the reaction mixture. After the addition of sodium sulfide, the color of the solution became brown. The reaction mixture was heated at 80 °C with constant magnetic stirring at 300 rpm for 1 h. Afterward, the reaction mixture was cooled to room temperature. Then ethanol was added to the above mixture to precipitate out CCS QDs powder. The obtained solution was centrifuged at the speed of 5000 rpm for 4 min. To remove unreacted species, washing with different solvents (double-deionized water and methanol) was carried out repeatedly. The final product was dried in an oven at 60 °C for 4–6 h, and the QDs obtained in the form of powder were dispersed in deionized water and analyzed. The same synthetic scheme was followed for 4 mM (x = 4), 6 mM (x = 6), 8 mM (x = 8), and 10 mM (x = 10) concentrations of Cu precursor, without changing the concentration of Cd and S ingredients. Then, 5 mL of each CCS QDs were re-dispersed in deionized water and mixed separately with 5 mL of aqueous solution of PBSA and stirred for 60 min at 50 °C to prepare the PBSA-CCS QD dyads. The intermolecular hydrogen bonding between PBSA and MAA-functionalized CCS QDs was responsible for the association of these dyads.
3. Characterization
FTIR spectroscopy analysis of CCS QDs was carried out in the region of 4000–500 cm–1 by using a Bruker TENSOR-II FT-IR spectrometer. The crystal structure of CCS QDs was determined by using a PANalytical X-ray diffractometer model 3040/60 X’Pert PRO operating at 45 kV and 40 mA with a source having Cu Kα (λ = 1.5406 Å) radiation over an angle range of 10–80°. The UV–vis absorption measurements of CCS QDs were carried out by dispersing QDs in double-deionized water using a Shimadzu spectrophotometer UV-1601. Energy-dispersive X-ray analysis (EDX) and high-resolution transmission electron microscopy (TEM) analysis of QDs were made by utilizing a JSM-6460 LV and Philips CM 30, JEOL, JEM-2100F, respectively. The SSPL and TRPL measurements were performed by using a Pico-Quant Fluo Time 300 (FT-300) spectrometer. The samples were excited with a pulsed LED laser source at 306 nm, and the PL was measured at room temperature as described in our previously reported work.30
4. Results and Discussion
The CCS QDs having 2 mM (x = 2), 4 mM (x = 4), 6 mM (x = 6), 8 mM (x = 8), and 10 mM (x = 10) concentrations of Cu without any change in molar concentration of Cd, S, and MAA precursor are labeled as CCS-1, CCS-2, CCS-3, CCS-4, and CCS-5, respectively, throughout the Results and Discussion section. Figure 1a illustrates the as-measured absorption spectra of QDs and the normalized PL emission spectrum of PBSA. Figure 1b demonstrates the as-measured absorption spectrum of PBSA that exhibits λmax at 303 nm, which is just in resonance with the excitation wavelength of 306 nm. It is evident from Figure 1a,b that the QDs exhibit a very low optical density (approximately 5 times less) as inferred from Beer–Lambert’s law at the given concentration corresponding to the excitation wavelength in comparison to PBSA. Hence, it can be inferred that after excitation, the light in-coupling with PBSA would be higher than the CCS QDs. The molar concentration of QDs is estimated by dividing the total volume per liter of the QDs by the volume of a single QD which is determined from TEM measurements, Figure 4b. For the calculation of total volume per liter of QDs, it is assumed that both the nanomaterial and bulk material have the same density.36 Subsequently, the molar absorption coefficient of QDs is evaluated from the slope of the line by plotting absorption versus concentrations. The appearance of absorption features of both PBSA and QDs in the same spectrum (Figure 1c) is an obvious indication of the presence of both PBSA and QDs in the solution. The existence of H-bonding between the polar groups of PBSA and MAA-functionalized QDs is responsible for their association. To calculate the average number of PBSA molecules surrounding a definite CCS QDs, Beer–Lambert’s law is used. It can be inferred from Figure 1c that the magnitude of absorption of PBSA at 303 nm is 0.9, which corresponds to ∼8.61 × 10¹⁵ PBSA molecules, and that of CCS-1 at 401 nm is 0.2, which corresponds to ∼1.86 × 10¹⁵ CCS-1 QDs. Thus, the average number of experimentally determined PBSA molecules that surround one QD is ∼4.6.
Figure 1.
(a) As-measured absorption spectra of CCS QDs and normalized PL emission spectrum of PBSA, (b) as-measured absorption spectrum of PBSA, and (c) absorption spectrum of association of PBSA with QDs.
Figure 4.
(a) EDX analysis, (b) TEM micrograph, and (c) HRTEM micrograph of MAA-functionalized CCS QDs.
The relationship between the molar concentration of Cu and the respective band gap energy values is given in Table 1. A red shift is observed in UV–vis spectra of ternary CCS QDs with increasing amount of Cu content. The excitonic peaks appear at 401, 410, 417, 421, and 426 nm for CCS QDs with Cu concentrations of 2, 4, 6, 8, and 10 mM, respectively. This bathochromic shift is attributed to an increase in the molar concentration of Cu in ternary CCS QDs (Table 1).
Table 1. Effect of the Molar Concentration of Cu2+ Ions on the Optical Band Gap of CCS QDs.
| sample code | molar conc. of Cu2+ ions (mM) | optical band gap (eV) |
|---|---|---|
| CCS-1 | 2 | 3.09 |
| CCS-2 | 4 | 3.02 |
| CCS-3 | 6 | 2.97 |
| CCS-4 | 8 | 2.94 |
| CCS-5 | 10 | 2.91 |
The gradual increase in molar concentration of Cu from 2 to 10 mM results in the decrease of band gap energy from 3.09 to 2.91 eV of CCS QDs. Therefore, the optical properties of copper-based ternary alloyed CCS QDs can greatly be tuned by changing the ratio of Cu.
Moreover, in ternary copper chalcogenides, VB is composed of 3d orbitals of Cu that are hybridized with the p-orbitals of the chalcogen element, while CB is composed of 4s-orbitals of Cu with some p-character mixing from the chalcogen element. In this way, the composition-dependent band gap can be tuned with the increase in Cu content since VB is pushed toward a higher energy, and thereby, the band gap is decreased.19,37,38 In CCS QDs, as the Cu content increases from 2 to 10 mM, the band gap decreases from 3.09 to 2.91 eV, as shown in Figure 1c.
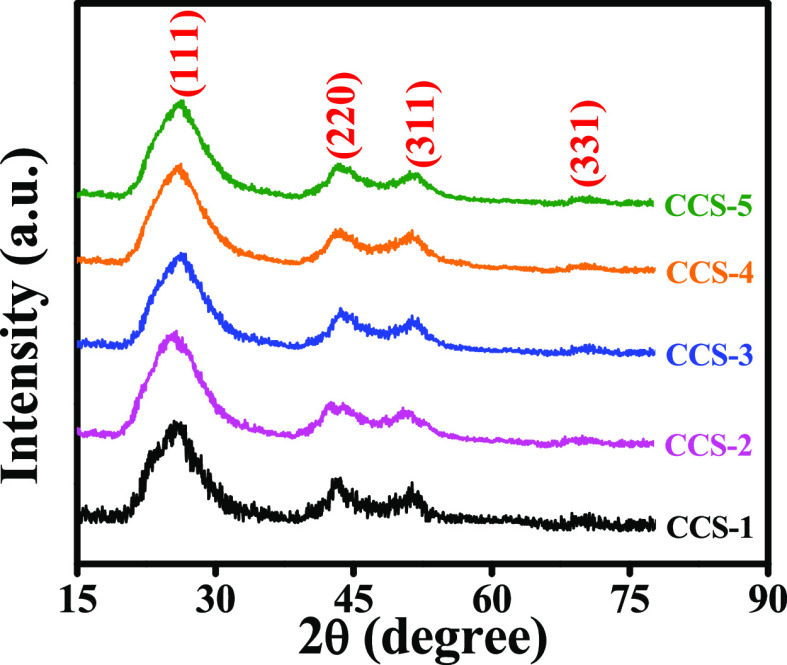
The XRD patterns of all the synthesized samples of CCS QDs are presented in Figure 2. These patterns match with the crystal structure of the cubic zinc blende and are verified by JCPDS-10-0454. The four peaks are observed at 2θ values of 26.0, 43.2, 51.5, and 71.2° corresponding to (111), (220), (311), and (331) crystal planes, respectively. The plane with (111) index is the most intense peak, and the appearance of two closely spaced reflections (220) and (311) confirm the crystalline nature of CCS QDs.
Figure 2.
XRD patterns of synthesized CCS QDs.
These fairly broad peaks suggest the small nature of QDs. No remarkable difference is detected in the lattice parameters of CCS QDs with a change in the concentration of Cu2+ ions. This is anticipated because of comparable ionic radius of the Cu2+ ion (0.72 Å) with Cd2+ ion (0.97 Å).39 The average crystallite size of all the samples is evaluated using Scherrer’s equation40 corresponding to the full width at half-maximum of the most intense peak. The estimated crystallite size range is 4.4–5.1 nm, suggesting a very slight change in particle size with the change in molar concentration of Cu2+ ions in CCS QDs.
To verify the successful anchoring of the capping ligand on the surface of as-synthesized CCS QDs, FTIR analysis is performed over the range of 400–4000 cm–1. The characteristic vibrational modes appear at 3330, 2974, 1650, 1375, and 561 cm–1, as displayed in Figure 3. A broad peak centered at 3330 cm–1 is attributed to the stretching vibration of the O–H bond of MAA. The peak that appeared at 2974 cm–1 is assigned to the stretching vibration of C–H.41 The peak that occurred at 1650 cm–1 is ascribed to stretching vibrations of the C=O bond of MAA. The peak at 1375 cm–1 is attributed to the bending vibration of the C–H bond. The absence of a S–H bond peak in the region between 2550 and 2700 cm–1 is an indication of attachment of the MAA capping ligand to the surface of CCS QDs through metal–sulfur (M–S) linkage. This illustrates that a coordinate bond is formed between the metal cations present at the surface of QDs and the sulfur atom that comes from the thiol group (S–H) of MAA by losing a proton.42,43 The weak IR vibrational peaks in the region of 500–600 cm–1 are attributed to the metal–sulfur bond vibrations (561 cm–1).44
Figure 3.
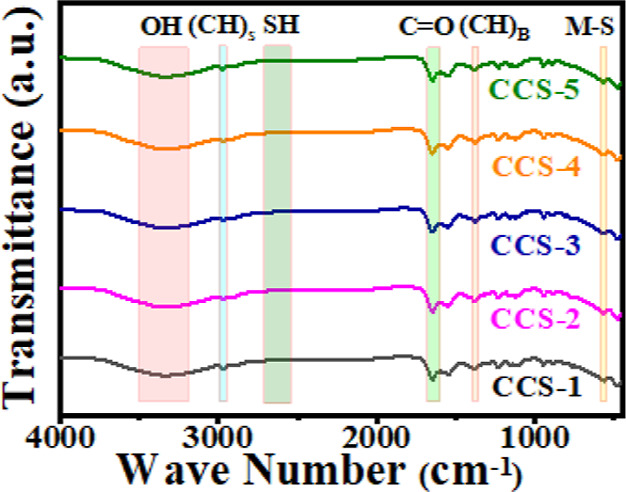
FTIR spectra of MAA-functionalized CCS QDs.
To further confirm the synthesis of MAA-functionalized CCS QDs, EDX, TEM, and HRTEM analyses are performed. The purity of the synthesized samples of QDs and the incorporation of Cu in the lattice are confirmed by EDX analysis due to the presence of peaks of Cu, Cd, and S, as depicted in Figure 4a. The average size of synthesized QDs is also investigated from the TEM micrograph (Figure 4b) by using ImageJ software, which is ∼5 nm. This measurement is in good agreement with the crystallite size obtained from XRD data (Figure 2). The HRTEM micrograph (Figure 4c) reveals the crystallinity of the synthesized sample of MAA-functionalized QDs. The inter-planar distance of 0.34 nm corresponds to the (111) crystal plane of the QDs, which is in good agreement with the aforementioned Figure 2 with the XRD pattern.
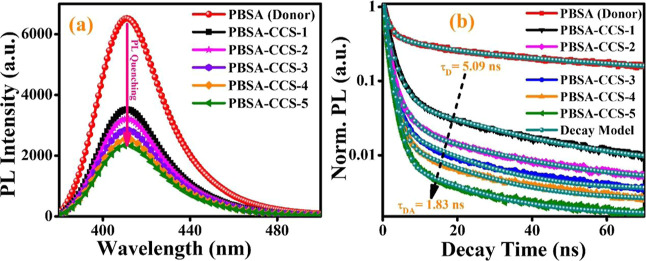
To investigate the interactions between PBSA and various types of synthesized CCS QDs in the solution phase, SSPL and TRPL measurements are performed. Following the excitation at 306 nm, the PL spectra of PBSA in the absence and presence of CCS QDs with varying concentrations of Cu+2 ions are displayed in Figure 5a. The PL of PBSA peaks at 411 nm, which gradually reduces with an increase in the concentration of Cu+2 ions in CCS QDs without any substantial wavelength shift. The decrease in PL intensity of PBSA upon progressive addition of 5 mM of each CCS QD into PBSA solution is an obvious indication of PL quenching that strongly depends on the Cu2+ ion concentration. The various MAA-functionalized CCS QDs are noticed to be proficient quenchers for PBSA with up to 64% decline in PL intensity in the case of CCS-5. This suggests an efficient energy-transfer process that can be attributed to the overlapping between the absorption spectrum of CCS-5 and the emission spectrum of PBSA (Figure 1a), prerequisite for an effective FRET process to occur. Here, PBSA acts as the FRET donor and CCS QDs act as the FRET acceptor. However, it is an open fact that the semiconductor QDs exhibit large absorption UV cross-section. However, at the given concentration, PBSA and the CCS QDs in PBSA-CCS QD dyads and their absorption (Figure 1a,b) suggest that PBSA with higher absorption at 306 nm works as the FRET donor and the CCS QDs work as the acceptor. The fluorescence quenching efficiency or energy-transfer efficiency (E) of different donor–acceptor pairs are estimated using eq 1
| 1 |
where τD and τDA are the PL decay lifetimes of the donor in the absence and presence of the acceptor, respectively. The PL decay lifetime is an intrinsic feature of a luminescent species that confers a significant insight into excited-state dynamics. The TRPL measurements demonstrate a remarkable trend of PL quenching of PBSA in conjunction with various MAA-functionalized CCS QDs as depicted in Figure 5b. The measured PL kinetics is best fitted by bi- and triexponential decay functions. To assess the average PL decay lifetime, eq 2 is employed
| 2 |
Figure 5.
(a) SSPL spectra and (b) PL decay kinetics of PBSA in the absence and presence of CCS QDs.
The estimated average PL decay lifetime of the sole donor (PBSA) is 5.09 ns, which drops to 2.75, 2.51, 2.22, 1.99, and 1.83 ns for PBSA-CCS-1, PBSA-CCS-2, PBSA-CCS-3, PBSA-CCS-4, and PBSA-CCS-5 donor–acceptor pairs, respectively, for a constant concentration of all the acceptor’s moieties.
To develop an understanding of the origin of PL quenching, the FRET model is applied to the PBSA-CCS QD system. FRET is a non-radiative energy-transfer process that occurs due to dipole–diploe interactions of the excited donor molecules (PBSA) and the ground-state acceptors (CCS QDs).45 The Förster or critical distance (Ro) is the distance at which the energy-transfer efficiency is 50% and is determined using eq 3, and the spectral overlapping region by using the integral (J(λ)) between the PL spectrum of PBSA sunscreen and the absorption spectra of CCS QDs is computed, eq 4
| 3 |
| 4 |
where ϕD, k2, ϵA(λ), n, and FD(λ) denote the
fluorescence quantum yield
of the donor in the absence of the acceptor, the orientation factor  for the randomly oriented PBSA-CCS
system,
the molar extinction coefficient (M–1 cm–1) of the acceptor, the refractive index of the medium (n = 1.4), and the corrected emission intensity of PBSA in the wavelength
range of λ to λ + Δλ with the total intensity
normalized to 1, respectively. The quantum yield of PBSA (ϕD = 0.315) is estimated by a relative method46 employing fluorescein (in 0.1 M aqueous NaOH) as a reference
fluorophore47
| 5 |
| 6 |
where KT(r) and “r” in the above equations are the rate constant for the non-radiative energy-transfer process and the actual distance between donor and acceptor moieties, respectively. Different types of FRET parameters mentioned in Table 2 are appraised by using equations from 1 to 6.
Table 2. FRET Parameters for Various PBSA-CCS QD Dyads.
| sample I.D. | τav (ns) | E (%) | J(λ) (M–1 cm–1 nm4) | Ro (nm) | KT(r) (s–1) | ||
|---|---|---|---|---|---|---|---|
| PBSA-CCS-1 | 2.75 | 45.97 | 5.52 × 10¹⁴ | 3.73 | 1.03 | 1.68 × 10⁸ | |
| PBSA-CCS-2 | 2.51 | 50.69 | 2.09 × 10¹⁵ | 4.65 | 0.99 | 2.02 × 10⁸ | |
| PBSA-CCS-3 | 2.22 | 56.39 | 6.16 × 10¹⁵ | 5.57 | 0.96 | 2.53 × 10⁸ | |
| PBSA-CCS-4 | 1.99 | 60.91 | 1.05 × 10¹⁶ | 6.09 | 0.93 | 3.05 × 10⁸ | |
| PBSA-CCS-5 | 1.83 | 64.05 | 9.15 × 10¹⁶ | 8.73 | 0.91 | 3.50 × 10⁸ |
Figure 1a clearly reveals a spectral overlap between PBSA emission and CCS QDs absorption spectra. This is an indication of the occurrence of FRET between these two moieties. For the scope of an effective FRET process, besides spectral overlapping, there must be a decrease in the PL decay lifetime of the donor in the presence of the acceptor and the magnitude of Förster distance should be within the permissible limit of 1–10 nm. The current scenario satisfies all these three prerequisites for the existence of FRET between PBSA and CCS QDs. The data of various parameters presented in Table 2 further corroborate the aforementioned statement. The assessed values of spectral overlapping integral by using eq 4 for various PBSA-CCS QD dyads are depicted in Table 2. This trend in the magnitude of J(λ) is in accordance with Figure 1a, that is, the lowest for CCS-1 and the highest for CCS-5. The values of Ro mentioned in Table 2 are evaluated with the help of eq 3. These values of distance Ro are 3.73, 4.65, 5.57, 6.09, and 8.73 nm for PBSA-CCS-1, PBSA-CCS-2, PBSA-CCS-3, PBSA-CCS-4, and PBSA-CCS-5 FRET pairs, respectively. The FRET efficiency (E) of all the donor–acceptor pairs is calculated by eq 1. For the FRET pairs PBSA-CCS-1, PBSA-CCS-2, PBSA-CCS-3, PBSA-CCS-4, and PBSA-CCS-5, the value of E comes out to be 45.97, 50.69, 56.39, 60.91, and 64.05%, respectively. The magnitude of the non-radiative rate constant displayed in Table 2 increases with an increase in Ro values. The KT(r) values are of the order of 108 s–1 for various PBSA-CCS dyads. This increasing trend in KT(r) values for various donor–acceptor pairs can be attributed to the increasing concentration of Cu2+ ions in the QD acceptors. This is because of the diffused nature of Cu2+ orbitals that changed the position of VB and CB as compared to Cd2+ in the QDs. It is observed that the value of KT(r) becomes approximately double as the concentration of Cu2+ ions increases from 2 to 10 mM in the PBSA-CCS QD dyad. In our case, we believe that by increasing the amount of Cu2+, it replaces the Cd2+ in the QDs, thus causing a slight change in the diameter of the QDs, although the colloidal properties remain the same. However, this slight change in the size of the QDs cannot be assessed in these experiments. We speculate that this slight change in the size of QDs is responsible for the change in actual donor–acceptor distance “r” as a slight change in the “r” hugely affects the energy-transfer efficiency and the rate (eqs 5 and 6). Based on the above discussion, we can conclude that an increase in the concentration of Cu2+ ions escalates the non-radiative energy-transfer process between PBSA donors and various CCS QDs acceptors. This can be attributed to a decrease in band gap width of CCS QDs with an increase in the concentration of Cu2+ ions that facilitate the resonance phenomenon of energy transfer.
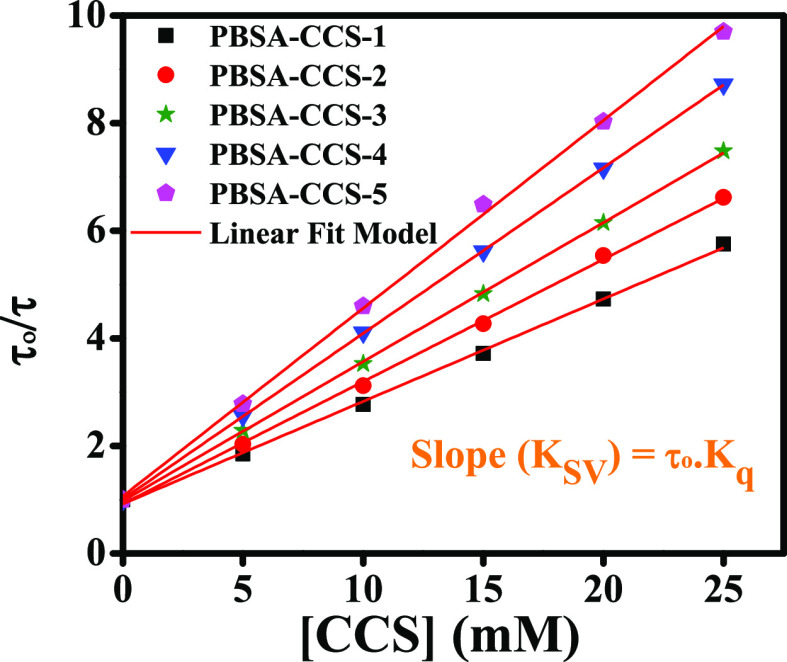
To further understand the FRET process, the PL quenching analysis of PBSA is performed by measuring its PL intensity and PL decay kinetics in both the absence and presence of various concentrations of CCS QDs (5, 10, 15, 20, and 25 mM) in phosphate buffer. To determine the mechanism of PL quenching, the well-known Stern–Volmer’s (SV) equation30 is used (eq 7)
| 7 |
where τo and τ are the PL decay lifetimes of the donor in the absence and presence of the acceptor, respectively. KSV (= kq·τo) is the Stern–Volmer’s constant, kq is the bimolecular quenching rate constant, and [Q] is the molar concentration of the quencher (CCS QDs here), and the estimated values of kq are given in Table 3. The PL intensity or the PL decay lifetime can be employed to evaluate the kq from the slope of the linear plot as both the parameters give the same outcomes. However, the usage of average lifetime gives an insight into the nature of PL quenching, that is, static or dynamic, which is why we use lifetime to estimate the PL quenching.
Table 3. PL Quenching Parameters for Various PBSA-CCS QD Dyads.
| sample I.D. | slope (Ksv) (M–1) | kq (M–1 s–1) |
|---|---|---|
| PBSA-CCS-1 | 190.51 | 3.74 × 10¹⁰ |
| PBSA-CCS-2 | 227.31 | 4.47 × 10¹⁰ |
| PBSA-CCS-3 | 258.74 | 5.08 × 10¹⁰ |
| PBSA-CCS-4 | 308.06 | 6.05 × 10¹⁰ |
| PBSA-CCS-5 | 349.37 | 6.86 × 10¹⁰ |
In the current study, the amount of PBSA is fixed (1 mmol) and the concentration of all the samples of CCS QDs (quencher) varies from 5, 10, 15, 20, and 25 mM.
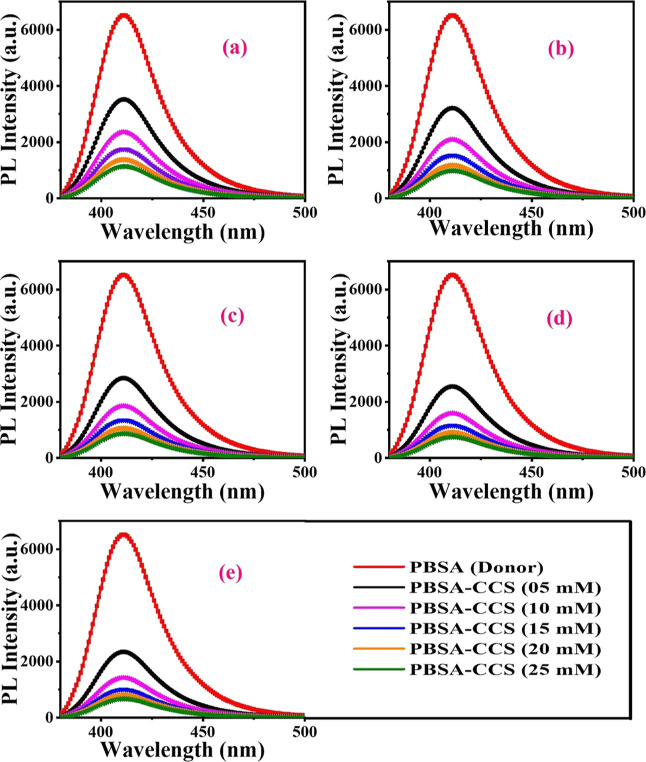
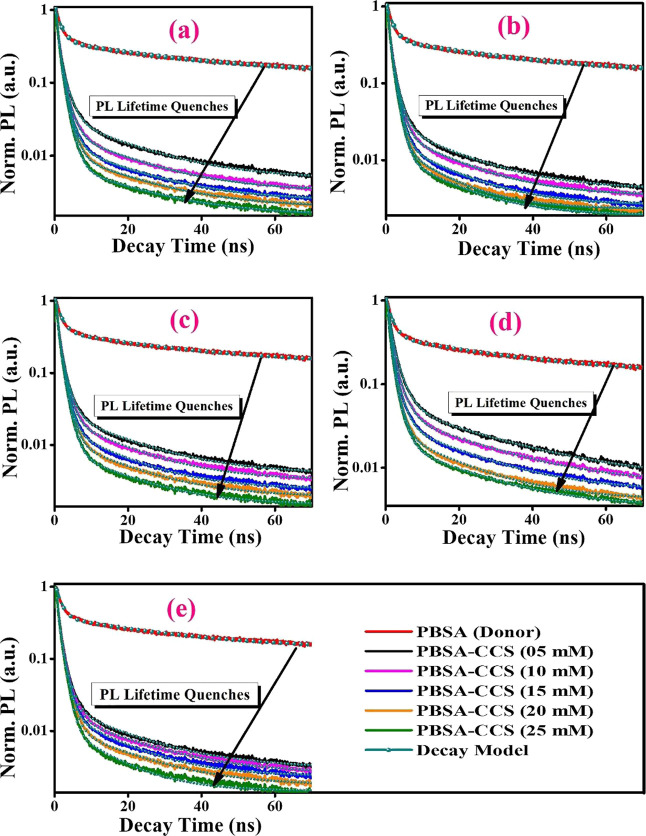
In the first instance, 1 mmol of PBSA is mixed with 5, 10, 15, 20, and 25 mM concentrations of CCS-1 (quencher) and a consequent decline in PL intensity is measured for the PBSA-CCS-1 system (Figure 6a). The same protocol is adopted for PBSA-CCS-2, PBSA-CCS-3, PBSA-CCS-4, and PBSA-CCS-5 systems (Figure 6b–e). Figure 6a–e demonstrates PL quenching upon a gradual increase in concentration of the respective quencher. To ascertain the accurate mechanism of PL quenching, TRPL measurements are performed (Figure 7a–e). This analysis helps to specify the operative static or dynamic mode of fluorescence quenching precisely. In the static mode of PL quenching, the average PL decay lifetime of the fluorophore does not change; however, the PL intensity decreases upon increasing the concentration of the quencher due to ground-state complex formation. Herein, the PL decay lifetime of the fluorophore is changed upon varying the concentration of the quencher in the dynamic mode of quenching owing to excited-state complex formation between the fluorophore and the quencher. This leads to the conclusion that an increase in concentration of CCS QDs from CCS-1 to CCS-5 in all the samples has a linear effect on PL quenching of PBSA. The PL decay kinetics of all the samples are plotted in Figure 7a–e.
Figure 6.
SSPL spectra exhibiting PL quenching of (a) PBSA-CCS-1, (b) PBSA-CCS-2, (c) PBSA-CCS-3, (d) PBSA-CCS-4, and (e) PBSA-CCS-5 at various quencher concentrations. The figure legend is displayed in section (e) of the figure panel with a similar color scheme.
Figure 7.
PL decay kinetics in (a) PBSA-CCS-1, (b) PBSA-CCS-2, (c) PBSA-CCS-3, (d) PBSA-CCS-4, and (e) PBSA-CCS-5 dyads at various CCS QDs concentrations. The figure legends are displayed in section (e) of the figure panel with a similar color scheme.
The Stern–Volmer plots for all these systems are depicted in Figure 8, which show straight lines with the vertical intercept equal to 1. The slope of all these linear plots (Ksv) is used to calculate the respective bimolecular quenching rate constant. The numerical value of kq is an indication of quenching efficiency. The assessed values of kq for different concentrations of PBSA-CCS-1, PBSA-CCS-2, PBSA-CCS-3, PBSA-CCS-4, and PBSA-CCS-5 evaluated from slopes of linear plots of Figure 8 are presented in Table 3. It is believed that if the magnitude of kq is of the order of ∼1010 M–1 s–1, the process is assumed to be fully diffusion-controlled.48 The observed values of kq suggest here that the process of PL quenching is entirely diffusion-controlled. Also, from Table 3 and Figure 8 (slopes of linear plots), it is inferred that the quenching efficiency is the highest for PBSA-CCS-5 and the lowest for PBSA-CCS-1, which is attributed to the respective variation in the concentration of CCS QDs present in each sample from CCS-1 to CCS-5, where QDs act as potential quenchers and the increase in the Cu2+ content in the CCS QDs increases the overlap integral F(λ).
Figure 8.
Stern–Volmer plots of various PBSA-CCS QD dyads.
Figure 8 reveals that our findings are consistent as depicted by eq 7 for all the concentration ranges of different quenchers examined here. These Stern–Volmer plots do not exhibit any deviation from straight line behavior toward the ordinate (y-axis) within the investigated limit of quenchers. This rules out any possibility of occurrence of both static and dynamic quenching simultaneously.
These findings obtained from Figure 8 and Table 4 comprising the data of average PL decay lifetimes confirm that the dynamic mode of PL quenching is operative as the PL lifetime of PBSA varies with the change in the quencher’s (CCS QDs) concentration.
Table 4. Average PL Lifetime Calculated from the Extracted Fitting Parameters of Measured PL Kinetics using eq 2.
| [CCS] (mM) | PBSA-CCS-1 τav (ns) | PBSA-CCS-2 τav (ns) | PBSA-CCS-3 τav (ns) | PBSA-CCS-4 τav (ns) | PBSA-CCS-5 τav (ns) |
|---|---|---|---|---|---|
| 0 | 5.09 | 5.09 | 5.09 | 5.09 | 5.09 |
| 5 | 2.75 | 2.51 | 2.22 | 1.99 | 1.83 |
| 10 | 1.84 | 1.63 | 1.44 | 1.24 | 1.11 |
| 15 | 1.37 | 1.19 | 1.05 | 0.91 | 0.8 |
| 20 | 1.08 | 0.94 | 0.83 | 0.71 | 0.63 |
| 25 | 0.89 | 0.77 | 0.68 | 0.58 | 0.52 |
5. Conclusions
We observed a meticulous PL analysis of PBSA as the FRET donor and CCS QDs as acceptors as well as PL quenching on the basis of measured PL spectra and PL decay kinetics. The estimated various parameters like E, J(λ), Ro, r, and KT(r) confirmed the existence of an efficient FRET process between PBSA and CCS QDs. The estimated values of KT(r) were of the order of 108 s–1 for different PBSA-CCS dyads. This increasing trend in KT(r) values for various donor–acceptor dyads was attributed to the increasing concentration of Cu2+ ions in the QD acceptors due to the diffused nature of Cu2+ orbitals that changed the position of VB and CB as compared to Cd2+. It was noticed that the value of KT(r) became approximately double as the concentration of Cu2+ ions changed from 2 to 10 mM in the PBSA-CCS QD dyad. Therefore, it can be concluded that an increase in the concentration of Cu2+ ions escalated the non-radiative energy-transfer process between PBSA donor and various CCS QDs acceptors. This could be ascribed to a decrease in band gap width of CCS QDs with an increase in the concentration of Cu2+ ions that facilitated the resonance phenomenon of energy transfer. The change in PL decay, average lifetime values, and estimated bimolecular quenching rate constant suggested the dynamic and diffusion-controlled nature of PL quenching in PBSA-CCS QD dyads. In future, this work can be extended to gauge the fluorescence properties of DNA and other molecular proteins.
Acknowledgments
The authors are highly thankful for the financial support of Higher Education Commission (HEC) Pakistan through the equipment/research grants 6976/Federal/NRPU/R&D/HEC/2017 and 20-3071/NRPU/R&D/HEC/13.
Author Contributions
All authors contributed to the writing of the manuscript and have approved the final version of the manuscript.
The authors declare no competing financial interest.
References
- Maxwell T.; Nogueira Campos M. G. N.; Smith S.; Doomra M.; Thwin Z.; Santra S.. Quantum Dots. Nanoparticles for Biomedical Applications; Elsevier, 2020; pp 243–265. [Google Scholar]
- Sławski J.; Białek R.; Burdziński G.; Gibasiewicz K.; Worch R.; Grzyb J. Competition between Photoinduced Electron Transfer and Resonance Energy Transfer in an Example of Substituted Cytochrome c–Quantum Dot Systems. J. Phys. Chem. B 2021, 125, 3307–3320. 10.1021/acs.jpcb.1c00325. [DOI] [PMC free article] [PubMed] [Google Scholar]
- Cinteza L. O. Quantum dots in biomedical applications: advances and challenges. J. Nanophotonics 2010, 4, 042503. 10.1117/1.3500388. [DOI] [Google Scholar]
- Conroy E. M.; Li J. J.; Kim H.; Algar W. R. Self-quenching, dimerization, and homo-FRET in hetero-FRET assemblies with quantum dot donors and multiple dye acceptors. J. Phys. Chem. C 2016, 120, 17817–17828. 10.1021/acs.jpcc.6b05886. [DOI] [Google Scholar]
- Kairdolf B. A.; Smith A. M.; Stokes T. H.; Wang M. D.; Young A. N.; Nie S. Semiconductor quantum dots for bioimaging and biodiagnostic applications. Annu. Rev. Anal. Chem. 2013, 6, 143–162. 10.1146/annurev-anchem-060908-155136. [DOI] [PMC free article] [PubMed] [Google Scholar]
- Reineke S. Complementary LED technologies. Nat. Mater. 2015, 14, 459–462. 10.1038/nmat4277. [DOI] [PubMed] [Google Scholar]
- Pokutnyi S. I.; Kulchin Y. N. Special section guest editorial: optics, spectroscopy, and nanophotonics of quantum dots. J. Nanophotonics 2016, 10, 033501–033508. 10.1117/1.jnp.10.033501. [DOI] [Google Scholar]
- Ca N.; Van H.; Do P.; Thanh L.; Tan P.; Truong N.; Oanh V.; Binh N.; Hien N. Influence of precursor ratio and dopant concentration on the structure and optical properties of Cu-doped ZnCdSe-alloyed quantum dots. RSC Adv. 2020, 10, 25618–25628. 10.1039/d0ra04257a. [DOI] [PMC free article] [PubMed] [Google Scholar]
- Adegoke O.; Park E. Y. Size-confined fixed-composition and composition-dependent engineered band gap alloying induces different internal structures in L-cysteine-capped alloyed quaternary CdZnTeS quantum dots. Sci. Rep. 2016, 6, 27288. 10.1038/srep27288. [DOI] [PMC free article] [PubMed] [Google Scholar]
- Bajorowicz B.; Kobylański M. P.; Gołąbiewska A.; Nadolna J.; Zaleska-Medynska A.; Malankowska A. Quantum dot-decorated semiconductor micro-and nanoparticles: A review of their synthesis, characterization and application in photocatalysis. Adv. Colloid Interface Sci. 2018, 256, 352–372. 10.1016/j.cis.2018.02.003. [DOI] [PubMed] [Google Scholar]
- Girma W. M.; Fahmi M. Z.; Permadi A.; Abate M. A.; Chang J.-Y. Synthetic strategies and biomedical applications of I–III–VI ternary quantum dots. J. Phys. Chem. B 2017, 5, 6193–6216. 10.1039/c7tb01156c. [DOI] [PubMed] [Google Scholar]
- Jia H.-R.; Zhu Y.-X.; Wu F.-G.. Introduction: Fluorescent Materials for Cell Imaging; Springer, 2020; pp 1–15. [Google Scholar]
- Zhou W.; Coleman J. J. Semiconductor quantum dots. Curr. Opin. Solid State Mater. Sci. 2016, 20, 352–360. 10.1016/j.cossms.2016.06.006. [DOI] [Google Scholar]
- Shen H.; Gao Q.; Zhang Y.; Lin Y.; Lin Q.; Li Z.; Chen L.; Zeng Z.; Li X.; Jia Y.; Wang S.; Du Z.; Li L. S.; Zhang Z. Visible quantum dot light-emitting diodes with simultaneous high brightness and efficiency. Nat. Photonics 2019, 13, 192–197. 10.1038/s41566-019-0364-z. [DOI] [Google Scholar]
- Mubeen M.; Khalid M. A.; Mukhtar M.; Sumreen P.; Gul T.; ul Ain N.; Shahrum S.; Tabassum M.; Ul-Hamid A.; Iqbal A. Elucidating the Size dependent FRET Efficiency in Interfacially Engineered Quantum Dots Attached to PBSA Sunscreen. Photochem. Photobiol. 2022, 98, 1017–1024. 10.1111/php.13599. [DOI] [PubMed] [Google Scholar]
- Wang N.-X.; Wang Y.-Q.; He X.-W.; Li W.-Y. One-step and rapid synthesis of composition-tunable and water-soluble ZnCdS quantum dots. J. Nanosci. Nanotechnol. 2011, 11, 4039–4045. 10.1166/jnn.2011.3878. [DOI] [PubMed] [Google Scholar]
- Masab M.; Muhammad H.; Shah F.; Yasir M.; Hanif M. Facile synthesis of CdZnS QDs: Effects of different capping agents on the photoluminescence properties. Mater. Sci. Semicond. Process. 2018, 81, 113–117. 10.1016/j.mssp.2018.03.023. [DOI] [Google Scholar]
- Amaral-Júnior J. C.; Mansur A. A.; Carvalho I. C.; Mansur H. S. Tunable luminescence of Cu-In-S/ZnS quantum dots-polysaccharide nanohybrids by environmentally friendly synthesis for potential solar energy photoconversion applications. Appl. Surf. Sci. 2021, 542, 148701. 10.1016/j.apsusc.2020.148701. [DOI] [Google Scholar]
- van der Stam W.; Berends A. C.; de Mello Donega C. Prospects of colloidal copper chalcogenide nanocrystals. ChemPhysChem 2016, 17, 559–581. 10.1002/cphc.201500976. [DOI] [PubMed] [Google Scholar]
- Bai X.; Purcell-Milton F.; Gun’ko Y. K. Optical properties, synthesis, and potential applications of Cu-based ternary or quaternary anisotropic quantum dots, polytypic nanocrystals, and core/shell heterostructures. Nanomaterials 2019, 9, 2–36. 10.3390/nano9010085. [DOI] [PMC free article] [PubMed] [Google Scholar]
- Hu G.; Lei B.; Jiao X.; Wu S.; Zhang X.; Zhuang J.; Liu X.; Hu C.; Liu Y. Synthesis of modified carbon dots with performance of ultraviolet absorption used in sunscreen. Opt. Express 2019, 27, 7629–7641. 10.1364/oe.27.007629. [DOI] [PubMed] [Google Scholar]
- Brenner M.; Hearing V. J. The protective role of melanin against UV damage in human skin†. Photochem. Photobiol. 2008, 84, 539–549. 10.1111/j.1751-1097.2007.00226.x. [DOI] [PMC free article] [PubMed] [Google Scholar]
- Raffa R. B.; Pergolizzi J. V. Jr.; Taylor R. Jr.; Kitzen J. M.; Group N. R. Sunscreen bans: Coral reefs and skin cancer. J. Clin. Pharm. Ther. 2019, 44, 134–139. 10.1111/jcpt.12778. [DOI] [PubMed] [Google Scholar]
- D’Orazio J.; Jarrett S.; Amaro-Ortiz A.; Scott T. UV radiation and the skin. Int. J. Mol. Sci. 2013, 14, 12222–12248. 10.3390/ijms140612222. [DOI] [PMC free article] [PubMed] [Google Scholar]
- Ng’etich W. K.; Martincigh B. S. A critical review on layered double hydroxides: Their synthesis and application in sunscreen formulations. Appl. Clay Sci. 2021, 208, 106095. 10.1016/j.clay.2021.106095. [DOI] [Google Scholar]
- Bhattacharjee D.; Preethi S.; Patil A. B.; Jain V. A comparison of Natural and Synthetic Sunscreen Agents: A Review. Int. J. Pharm. Res. 2021, 13, 3494–3505. 10.31838/ijpr/2021.13.01.524. [DOI] [Google Scholar]
- Rodrigues N. D.; Staniforth M.; Stavros V. G. Photophysics of sunscreen molecules in the gas phase: a stepwise approach towards understanding and developing next-generation sunscreens. Proc. Math. Phys. Eng. Sci. 2016, 472, 20160677. 10.1098/rspa.2016.0677. [DOI] [PMC free article] [PubMed] [Google Scholar]
- Kolbanovskiy M.; Aharonoff A.; Sales A. H.; Geacintov N. E.; Shafirovich V. Base and Nucleotide Excision Repair Pathways in DNA Plasmids Harboring Oxidatively Generated Guanine Lesions. Chem. Res. Toxicol. 2021, 34, 154–160. 10.1021/acs.chemrestox.0c00463. [DOI] [PMC free article] [PubMed] [Google Scholar]
- Ma Y.; Yoo J. History of sunscreen: An updated view. J. Cosmet. Dermatol. 2021, 20, 1044–1049. 10.1111/jocd.14004. [DOI] [PubMed] [Google Scholar]
- Mubeen M.; Khalid M. A.; Mukhtar M.; Shahrum S.; Zahra S.; Shabbir S.; Iqbal A. Elucidating the Photoluminescence Quenching in Ensulizole: an Artificial Water Soluble Sunscreen. J. Fluoresc. 2021, 31, 1055–1063. 10.1007/s10895-021-02736-x. [DOI] [PubMed] [Google Scholar]
- Kyzas G. Z.; Mitropoulos A. C. Nanomaterials and Nanotechnology in Wastewater Treatment. Nanomaterials 2021, 11, 1539. 10.3390/nano11061539. [DOI] [PMC free article] [PubMed] [Google Scholar]
- Ji Y.; Zhou L.; Zhang Y.; Ferronato C.; Brigante M.; Mailhot G.; Yang X.; Chovelon J. M. Photochemical degradation of sunscreen agent 2-phenylbenzimidazole-5-sulfonic acid in different water matrices. Water Res. 2013, 47, 5865–5875. 10.1016/j.watres.2013.07.009. [DOI] [PubMed] [Google Scholar]
- Zhang S.; Chen J.; Qiao X.; Ge L.; Cai X.; Na G. Quantum chemical investigation and experimental verification on the aquatic photochemistry of the sunscreen 2-phenylbenzimidazole-5-sulfonic acid. Environ. Sci. Technol. 2010, 44, 7484–7490. 10.1021/es101131h. [DOI] [PubMed] [Google Scholar]
- Inbaraj J. J.; Bilski P.; Chignell C. F. Photophysical and Photochemical Studies of 2 Phenylbenzimidazole and UVB Sunscreen 2 Phenylbenzimidazole 5 sulfonic Acid. Photochem. Photobiol. 2002, 75, 107–116. . [DOI] [PubMed] [Google Scholar]
- Jiang Z.; Lei Y.; Zhang Z.; Hu J.; Lin Y.; Ouyang Z. Nitrogen-doped graphene quantum dots decorated ZnxCd1-xS semiconductor with tunable photoelectric properties. J. Alloys Compd. 2020, 812, 152096. 10.1016/j.jallcom.2019.152096. [DOI] [Google Scholar]
- Yeltik A.; Delikanli S.; Olutas M.; Kelestemur Y.; Guzelturk B.; Demir H. V. Experimental Determination of the Absorption Cross-Section and Molar Extinction Coefficient of Colloidal CdSe Nanoplatelets. J. Phys. Chem. C 2015, 119, 26768–26775. 10.1021/acs.jpcc.5b09275. [DOI] [Google Scholar]
- Saravanan K.; Selladurai S.; Ananthakumar S.; Suriakarthick R. Solvothermal synthesis of copper cadmium sulphide (CuCdS2) nanoparticles and its structural, optical and morphological properties. Mater. Sci. Semicond. Process. 2019, 93, 345–356. 10.1016/j.mssp.2019.01.024. [DOI] [Google Scholar]
- Varghese R. J.; Oluwafemi O. S. The Photoluminescence and Biocompatibility of CuInS2-Based Ternary Quantum Dots and Their Biological Applications. Chemosensors 2020, 8, 101. 10.3390/chemosensors8040101. [DOI] [Google Scholar]
- Madejová J.; Arvaiová B.; Komadel P. FTIR spectroscopic characterization of thermally treated Cu2+, Cd2+, and Li+ montmorillonites. Spectrochim. Acta, Part A 1999, 55, 2467–2476. 10.1016/s1386-1425(99)00039-6. [DOI] [Google Scholar]
- Dirany N.; Hallaoui A.; Valmalette J. C.; Arab M. Effect of morphology and temperature treatment control on the photocatalytic and photoluminescence properties of SrWO4 crystals. Photochem. Photobiol. Sci. 2020, 19, 235–250. 10.1039/c9pp00331b. [DOI] [PubMed] [Google Scholar]
- Wang Z.; Xing X.; Yang Y.; Zhao R.; Zou T.; Wang Z.; Wang Y. One-step hydrothermal synthesis of thioglycolic acid capped CdS quantum dots as fluorescence determination of cobalt ion. Sci. Rep. 2018, 8, 8953. 10.1038/s41598-018-27244-0. [DOI] [PMC free article] [PubMed] [Google Scholar]
- Zikalala N.; Parani S.; Tsolekile N.; Oluwafemi O. S. Facile green synthesis of ZnInS quantum dots: temporal evolution of their optical properties and cell viability against normal and cancerous cells. J. Mater. Chem. C 2020, 8, 9329–9336. 10.1039/d0tc02098b. [DOI] [Google Scholar]
- Kaur G.; Tripathi S. Size tuning of MAA capped CdSe and CdSe/CdS quantum dots and their stability in different pH environments. Mater. Chem. Phys. 2014, 143, 514–523. 10.1016/j.matchemphys.2013.09.003. [DOI] [Google Scholar]
- Murugadoss G.; Thangamuthu R.; Jayavel R.; Rajesh Kumar M. R. Narrow with tunable optical band gap of CdS based core shell nanoparticles: Applications in pollutant degradation and solar cells. J. Lumin. 2015, 165, 30–39. 10.1016/j.jlumin.2015.03.036. [DOI] [Google Scholar]
- Díaz S. A.; Lasarte-Aragones G.; Lowery R. G.; Vranish J. N.; Klein W. P.; Susumu K.; Medintz I. L. Quantum Dots as Förster Resonance Energy Transfer Acceptors of Lanthanides in Time-Resolved Bioassays. ACS Appl. Nano Mater. 2018, 1, 3006–3014. 10.1021/acsanm.8b00613. [DOI] [Google Scholar]
- Würth C.; Grabolle M.; Pauli J.; Spieles M.; Resch-Genger U. Relative and absolute determination of fluorescence quantum yields of transparent samples. Nat. Protoc. 2013, 8, 1535–1550. 10.1038/nprot.2013.087. [DOI] [PubMed] [Google Scholar]
- Mubeen M.; Khalid M. A.; Shahrum S.; Mukhtar M.; Sumreen P.; Tabassum M.; Ul-Hamid A.; Nadeem M. A.; Iqbal A. Exploring the photoexcited electron transfer dynamics in artificial sunscreen PBSA-coupled biocompatible ZnO quantum dots. New J. Chem. 2022, 46, 9526–9533. 10.1039/d2nj01153k. [DOI] [Google Scholar]
- Pal A.; Srivastava S.; Gupta R.; Sapra S. Electron transfer from CdSe–ZnS core–shell quantum dots to cobalt (III) complexes. Phys. Chem. Chem. Phys. 2013, 15, 15888–15895. 10.1039/c3cp51834e. [DOI] [PubMed] [Google Scholar]


