Abstract
DNA methylation dynamics emerged as a promising biomarker of mammalian aging, with multivariate machine learning models (‘epigenetic clocks’) enabling measurement of biological age in bulk tissue samples. However, intrinsically sparse and binarized methylation profiles of individual cells have so far precluded the assessment of aging in single-cell data. Here, we introduce scAge, a statistical framework for epigenetic age profiling at single-cell resolution, and validate our approach in mice. Our method recapitulates the chronological age of tissues, while uncovering heterogeneity among cells. We show accurate tracking of the aging process in hepatocytes, demonstrate attenuated epigenetic aging in muscle stem cells, and track age dynamics in embryonic stem cells. We also use scAge to reveal, at the single-cell level, a natural and stratified rejuvenation event occurring during early embryogenesis. We provide our framework as a resource to enable exploration of epigenetic aging trajectories at single-cell resolution.
Aging is characterized by several canonical hallmarks, including epigenetic alterations at CG dinucleotides (CpG sites)1,2. Changes in CpG methylation with age can now be assayed using a variety of approaches, ranging from hybridization arrays to genome-wide or targeted next-generation sequencing methods3–7. These techniques enable quantitative examination of the dynamic DNA methylation landscape at single-base resolution in tissues of organisms, such as mammals, that evolved this type of regulation.
Since their inception in the last decade, predictive multivariate machine learning models based on DNA methylation (DNAm) levels, termed ‘epigenetic clocks’ have revolutionized the aging field4,8–12. First built strictly as estimators of chronological age, clocks can now also integrate and predict various measures of biological aging and disease risk, underscoring their clinical relevance13–15. Excitingly, several pan-tissue mammalian clocks have been recently developed that can profile epigenetic age in virtually any tissue across eutherians with remarkable precision, suggesting strong conservation of epigenetic aging patterns across species16. Epigenetic clocks are also of keen interest within the scopes of lifespan extension and cell reprogramming, as many of these models detect changes in biological age resulting from these interventions11,12,17–21.
However, while individual cells are the units of life, all existing epigenetic clocks rely on measurements derived from bulk samples (i.e., samples containing many cells), both for the creation and application of these models19. Historically, the use of bulk samples for DNA methylation analysis has been an inherent requirement of the methodologies available, which demanded large amounts of input DNA material due to degradation of nucleic acids during bisulfite conversion22. While using bulk samples enables analyses of average methylation patterns in tissues, it simultaneously obscures the epigenetic heterogeneity that exists among individual cells19,23. A recent study characterized the transcriptomic changes in murine aging at single-cell resolution, but age-associated CpG methylation changes in single cells of mammals remain mostly unexplored24.
Advances in epigenomic sequencing methods have now made it possible to evaluate limited methylation profiles in single cells. Since the inception of these techniques in the previous decade, a variety of methods have surfaced, including single-cell whole genome (scWGBS/scBS)23,25 and reduced representation bisulfite sequencing (scRRBS)26. Excitingly, approaches for measuring gene expression, DNA methylation, and chromatin accessibility in the same single cell have recently surfaced, allowing for robust integration of multi-omic analyses and comprehensive characterization of individual cell states27–30.
Despite this remarkable progress in single-cell omics, intrinsic issues of sparsity remain. In the case of whole-genome methylation profiling, only a small fraction of CpGs covered with bulk sequencing methods can be currently assayed at once in any single cell25. Furthermore, the most widespread protocols for single-cell methylome profiling—those involving genome-wide interrogation of DNA methylation patterns—suffer additionally from effectively random coverage of reads22. Several robust imputation and clustering strategies have been developed to address this constraint, employing Bayesian or deep learning approaches to fill-in missing methylation states for CpGs not covered in any given cell31,32. However, these tools require building complex, time-intensive dataset-specific models, which may introduce some bias.
This sparsity in single-cell DNAm profiles poses profound limitations for the creation of single-cell epigenetic clocks. Building these predictive models traditionally relied on collecting methylation levels of CpGs covered consistently across samples of different ages4,11,12,33,34. In bulk tissue, this enables the assembly of large methylation matrices that can be directly harnessed for machine learning, particularly elastic net regularization35. Currently, however, sparse and binarized methylation profiles of single cells severely complicate the use of this conventional approach19.
Here, we report scAge, a novel epigenetic clock framework capable of profiling biological age at single-cell resolution. Due to inconsistent CpG coverage between cells, our approach instead employs a ranked intersection algorithm that is independent of which CpGs are covered in each cell. By harnessing the relationship of methylation levels with age in a subset of CpGs, we compute a likelihood profile that quantifies the epigenetic age of a cell. Our method recapitulates the chronological age of tissues, while also uncovering the intrinsic epigenetic heterogeneity that exists among individual cells. We anticipate that the use of these novel epigenetic clock approaches may open up exciting new avenues for ultra-low-input organismal age profiling as well as research on biological aging at the previously elusive level of individual cells.
RESULTS
Designing scAge: a single-cell epigenetic clock framework
Major challenges in assessing epigenetic age in single cells are their sparse and binarized methylation profiles. Contrary to bulk samples, sequence reads typically cover different parts of the genome of each single cell (Fig. 1a). This results in limited overlap among cell profiles, particularly with genome-wide methods, precluding the use of conventional elastic net approaches that rely on consistent CpG coverage across samples (Supplementary Fig. 1). To overcome these limitations, we introduce scAge, a framework for profiling epigenetic age using single-cell methylation data (Fig. 1b–e). To develop this single-cell clock approach, we first assumed that the methylation levels of highly covered CpG sites in bulk sequencing or DNAm array profiling of a tissue offer an estimation of the probability of binary methylation at these particular CpG sites in any single cell coming from this tissue. Hence, if we measure a bulk methylation level of 0.7 at a single CpG and pick a random single cell from this tissue, we can assume that there is a 70% chance this particular cell will be methylated at this locus. Using training data derived from highly-covered bulk RRBS, we generated reference datasets of deterministic linear models that estimate the average change in methylation levels based on chronological age for each CpG.
Figure 1: Designing the scAge framework.
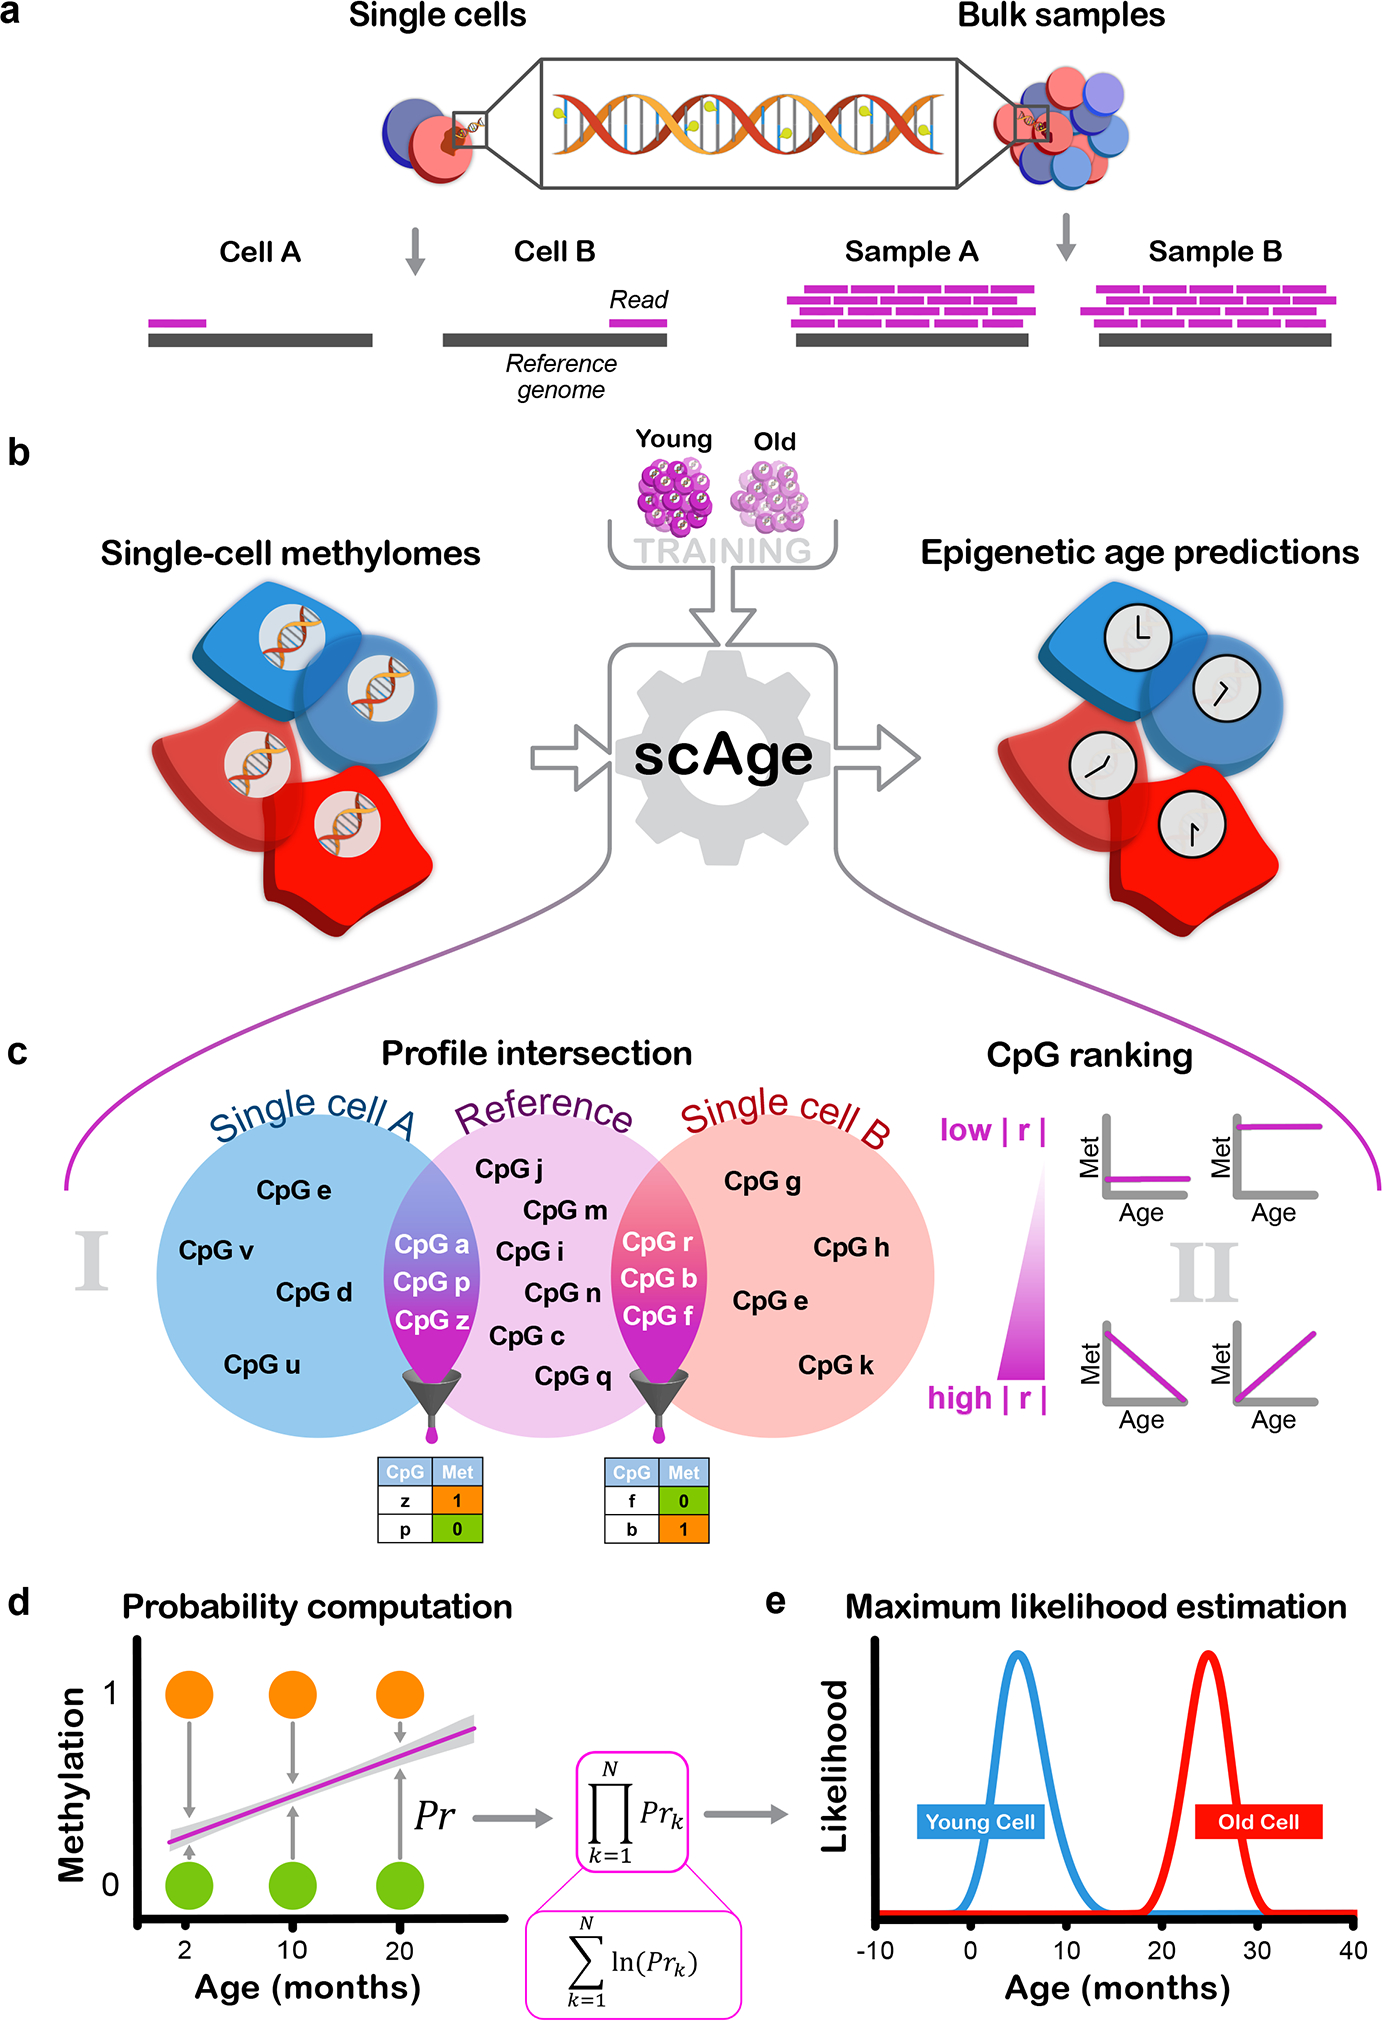
a) Schematic representation of the distinction between single-cell and bulk methylation sequencing outputs. With bulk approaches (right), read coverage is high and consistent between samples. In single cells (left), read coverage is low (often 1) and inconsistent between single cells, resulting in limited, distinct methylome profiles.
b) Schematic representation of the scAge framework. The input (left) consists of binary single-cell methylome profiles, coupled with a training reference dataset constructed from bulk samples across a wide age range (top). In turn, the algorithm outputs epigenetic age predictions for each single cell (right).
c) Schematic of the intersection and ranking components of the framework. In (i), binary single-cell profiles are intersected with a bulk reference, and only CpGs that are common between a particular single-cell and the reference data are retained. In (ii), a ranking step is implemented that orders and selects CpGs based on their absolute Pearson correlation |r| with age. Common CpGs are filtered depending on the chosen parameter, producing binary matrices of age-associated CpG sites for each single cell (bottom).
d) Schematic of the probability computation step of the framework. Linear regression equations relating methylation and age are computed based on bulk data (purple line). Using the observed methylation status of a cell (methylated, orange; unmethylated, green), the probability of observing a particular state is computed as 1 minus the distance between the binary methylation status and the regression line estimate for a particular age.
e) Schematic of the maximum likelihood estimation step of the framework. In theory, the product of individual CpG probabilities (left) is taken (assuming independence between CpGs), generating a single probability value for each age. Practically, these fractional products are replaced by logarithmic sums to circumvent underflow errors in computation. An age-likelihood distribution is then obtained for every cell (right), and the age of maximum likelihood is interpreted as the epigenetic age of the cell (young cell in blue, old cell in red).
Next, to overcome the intrinsic sparsity of single-cell methylomes, we designed a ranked intersection algorithm that isolates the common CpG sites between any single-cell profile and a reference dataset (Fig. 1c). From this common set of sites, we selected the most age-associated CpGs, ranking them based on the absolute magnitude of their Pearson correlation with age in the bulk training data. Since different CpG sites are covered in each cell, a distinct collection of age-associated CpGs is chosen by the algorithm per individual cell. For each selected age-associated CpG site, we computed the probability of observing a methylated or unmethylated state in a single cell for each age within a wide range (Fig. 1d). In essence, we compare the methylation status (0, unmethylated vs. 1, methylated) of the single cell with the estimate from the bulk-derived linear regression model, and use the difference between the model’s prediction and the single-cell methylation value as a probability estimate. Our method inherently leverages the notion that if bulk methylation at a certain CpG increases with age, we expect to find more cells methylated at this locus in aged tissues compared to young ones, and conversely if methylation shows an opposing trend.
To obtain a single probability value for each age assessed by our algorithm, we first assume that binary methylation states of all CpGs in a single-cell are independent, and multiply the CpG-wise probabilities together to obtain the overall likelihood of observing the entire filtered age-associated methylation profile. Practically, we calculate this via logarithmic sums instead of fractional products to circumvent underflow errors. Finally, upon generation of an age-likelihood distribution for each cell, we assign the age of maximum likelihood as the predicted epigenetic age for this cell (Fig. 1e). We found that this framework, which we designated scAge, permitted accurate epigenetic age profiling in single cells with dramatically different and sparse methylome profiles. To assess epigenetic age in murine single cells, we trained linear model reference datasets using filtered bulk RRBS methylation matrices from C56BL/6J mice of different ages in 3 individual tissues (liver, blood and muscle), as well as with a multi-tissue matrix (Fig. 2a, Extended Data Fig. 1, 2)34.
Figure 2: scAge tracks aging in hepatocytes and embryonic fibroblasts.
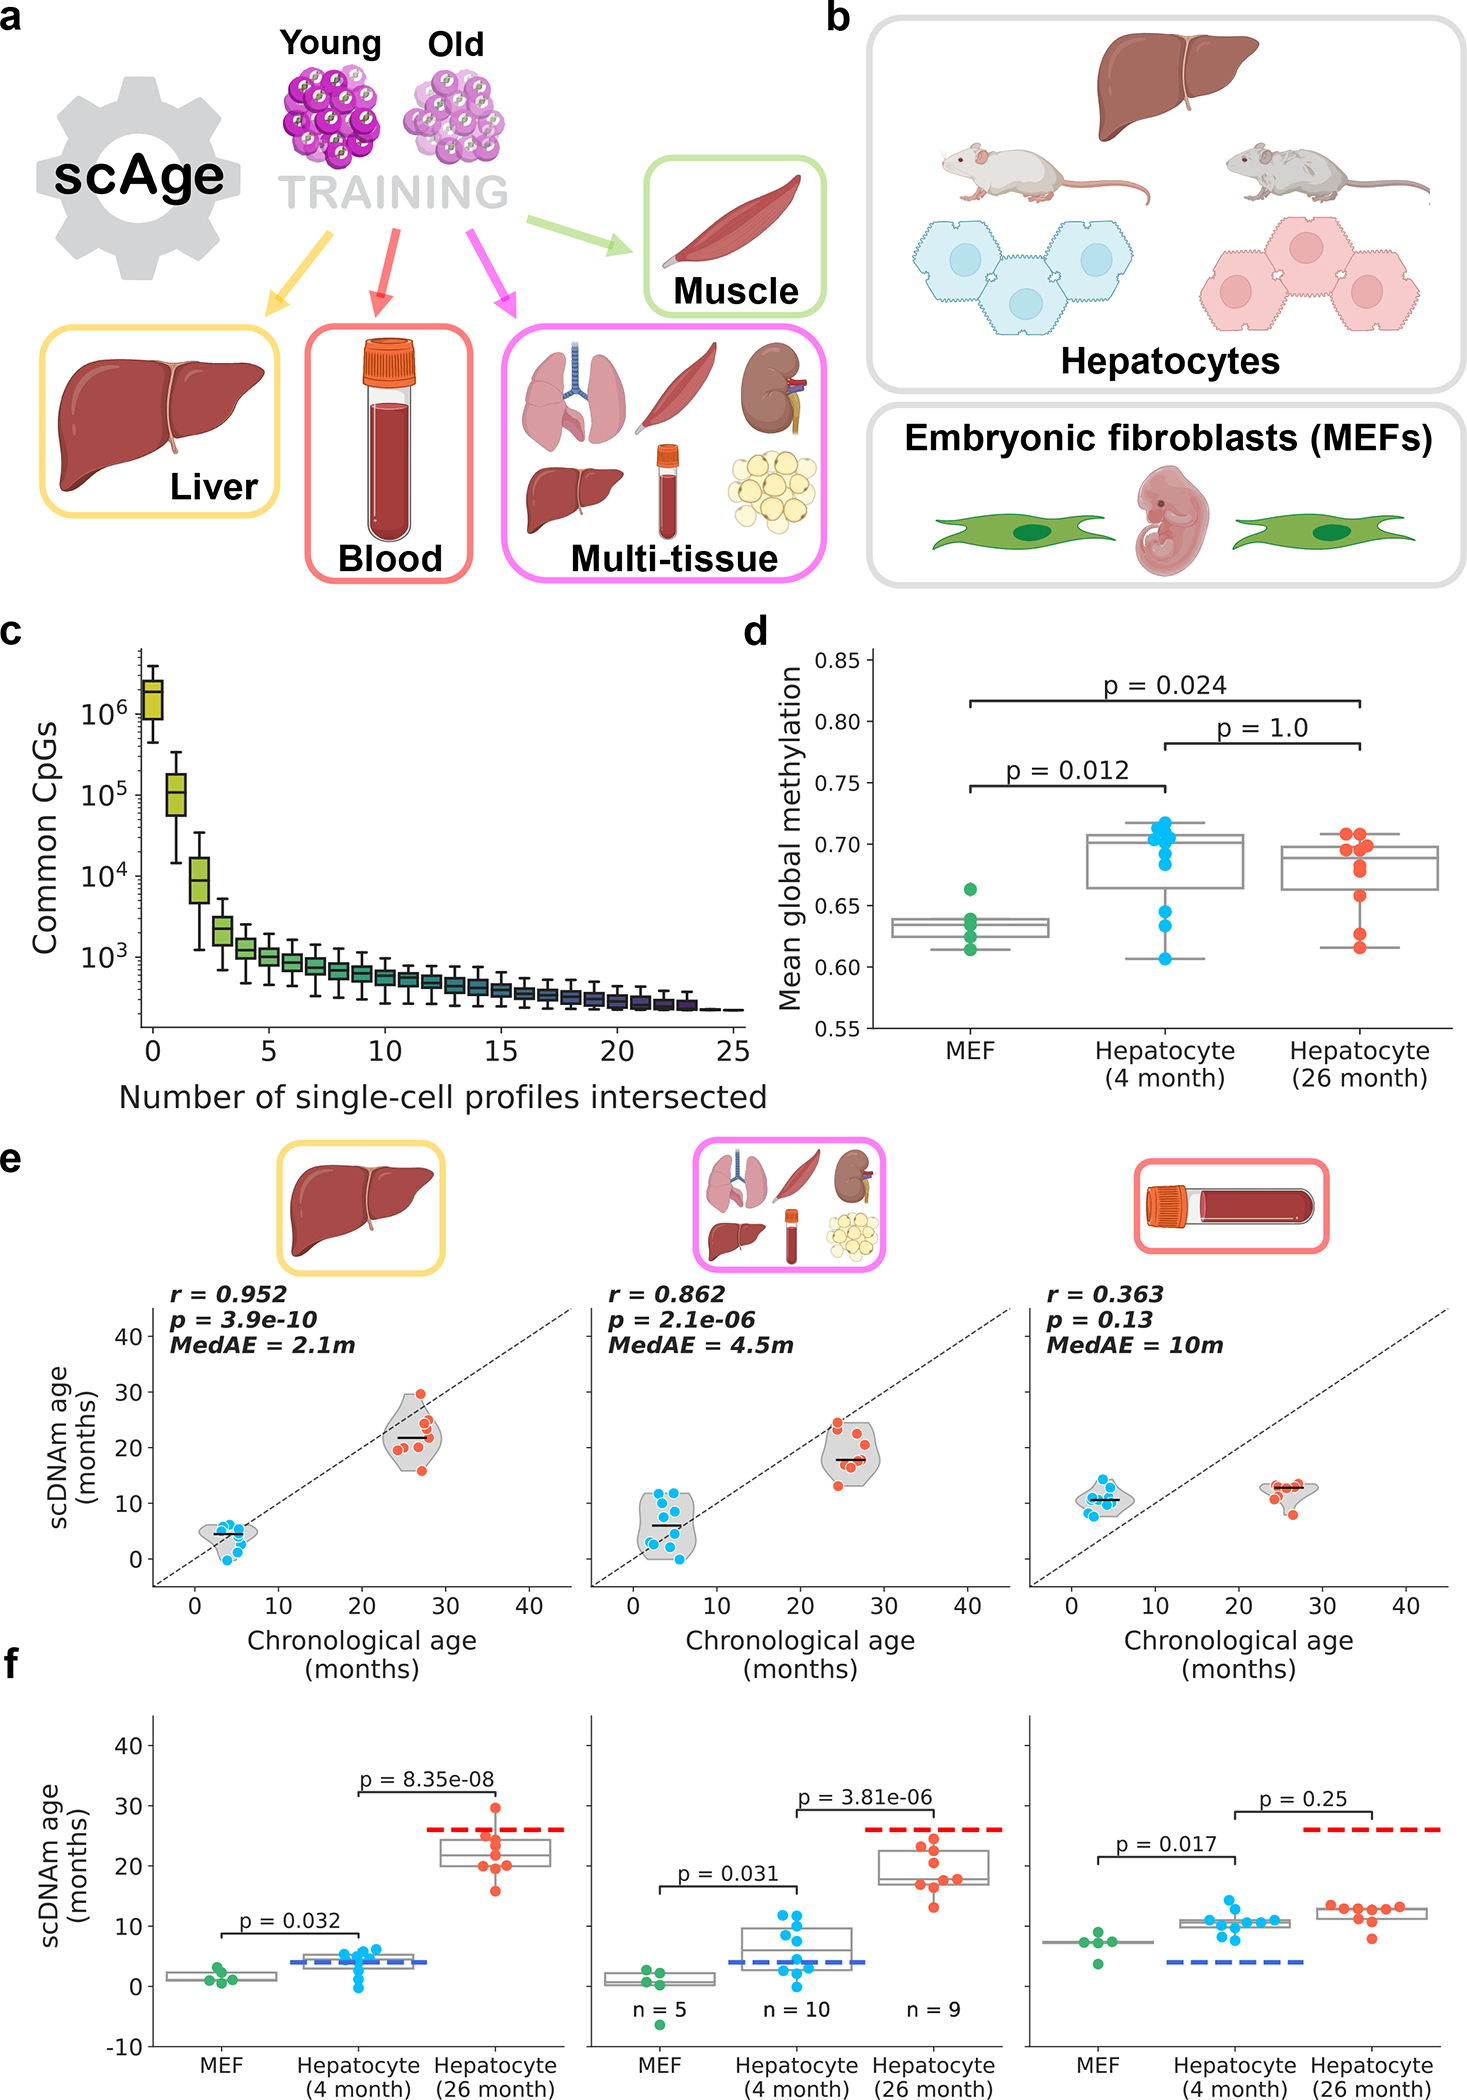
a) Schematic representation of the training scheme for the framework. scAge linear regression models were trained on three tissue-specific methylation matrices (liver, muscle, and blood) and a multi-tissue matrix. More information on training dataset composition can be found in Extended Data Fig. 1.
b) Schematic representation of cells analyzed in this figure. The dataset23 consisted of 26 cells, including 5 embryonic fibroblasts, 11 hepatocytes from young animals (4-months-old) and 10 hepatocytes from old animals (26-months-old).
c) Boxplots depicting progressive intersection of all single cell profiles from Gravina et al.23 (n = 26 single cells). Y-axis is the number of common CpGs between a certain number of profiles, shown here in log-scale. The order of intersection of single-cell profiles was permuted 100 times to generate a distribution for each additional cell added (n = 100 intersection sets/box). Color reflects a gradient of the x-axis, from few intersections (yellow) to many intersections (purple).
d) Mean global methylation in all embryonic fibroblasts (green, n = 5), young hepatocytes (blue, n = 11), and old hepatocytes (red, n = 10). Two-tailed Welch’s t-test with Bonferroni correction was used for statistical testing.
e) Predicted epigenetic age versus chronological age in young hepatocytes (blue, n = 10) and old hepatocytes (red, n = 9) across liver (left), multi-tissue (middle) and blood (right) models. Jitter was applied to chronological age strictly for visualization purposes. Two outliers, one from each group, were removed based on aberrant PCA clustering in the original study23. Plots and metrics with outliers are shown in Extended Data Fig. 3b. Pearson correlation (r), the associated p-value (p), and the median absolute error (MedAE) are shown. Two-tailed Pearson correlation analysis was applied for statistical testing, with statistics for each model computed independently without correction. Violin plots depict kernel density estimations, with the median value highlighted by a black line. Dashed lines depict the identity line between scDNAm age and chronological age.
f) Predicted epigenetic age for MEFs (green, n = 5), young hepatocytes (blue, n = 10), and old hepatocytes (red, n = 9) across liver (left), multi-tissue (middle) and blood (right) models. Dashed lines represent the chronological age of animals (blue, 4-months-old; red, 26-months-old). Two-tailed Welch’s t-test with Bonferroni correction was used for statistical testing. Throughout this figure, box plots highlight median levels and the first and third quartile, with whiskers depicting observations up to 1.5× the interquartile range. Dots depict individual cells.
scAge tracks aging in hepatocytes and embryonic fibroblasts
We first applied scAge to a dataset of 26 single cells, consisting of 11 hepatocytes from 4-month-old mice, 10 hepatocytes from 26-month-old mice, and 5 mouse embryonic fibroblasts (MEFs) (Fig. 2b)23. Due to inherently random and sparse coverage, single-cell methylome profiles contained limited common CpGs between any given pair of cells; in fact, this effect was greatly accentuated when sites in all cells were progressively intersected, leading to minimal final overlap (Fig. 2c).
Coverage varied widely among the cells, ranging from 0.4 to over 8 million CpGs per cell (Extended Data Fig. 3a). Mean methylation was consistent between young and old hepatocytes, but MEFs showed nominally decreased global methylation compared to both groups of hepatocytes (Fig. 2d). We applied our scAge framework, trained on liver, blood or multi-tissue datasets to profile epigenetic age in all 26 cells (Extended Data Fig. 3b, c). Our tool produced distinct likelihood distributions for each cell, enabling quantification of predicted epigenetic age and confidence intervals in a cell-specific manner (Extended Data Fig. 4, Supplementary Fig. 2). As expected, the liver-trained model showed the highest accuracy, with a Pearson correlation coefficient of 0.88 based on the hepatocyte data. The multi-tissue model showed a significant difference between young and old hepatocytes, but was less robust, with a Pearson r of 0.63. Interestingly, applying scAge trained exclusively on blood samples to this data showed no significant difference in the predicted ages of both groups of hepatocytes. This suggests the presence of tissue-specific methylation trajectories, and indicates that scAge is likely to be most accurate when trained on the tissue from which the single cells of interest originate. With all models, MEFs displayed the lowest predicted epigenetic age, trending towards 0 in both liver and multi-tissue clocks.
Interestingly, the highly accurate liver scAge model predicted the epigenetic age of one hepatocyte in the young group to be around 20 months old. This hepatocyte, along with another cell in the old group, were identified as outliers in the original paper23. Both cells are also identified as “very old” outliers using the multi-tissue model. Since coverage was relatively high in these cells, we hypothesized that our results may be reflective of an accelerated aging trajectory (i.e., senescence) (Extended Data Fig. 5a). This is supported by the global hypomethylation observed in these cells compared to others in the study, which is known to be a factor of senescence progression (Extended Data Fig. 5b)36. While senescence may explain the aberrant epigenetic age predictions for these cells, dimensionality reduction performed in the original study23 classifies these two cells as clear outliers, which may simply suggest that these predictions result from aberrant methylation profiles caused by technical artefacts during isolation or sequencing.
When these two outliers were removed from the analysis, the accuracy of the liver and multi-tissue clocks increased drastically, with Pearson r of 0.95 (median absolute error = 2.1m) and 0.86 (median absolute error = 4.5m), respectively (Fig. 2e). Outlier removal also induced a marginally significant difference between MEFs and young hepatocytes across both models (Fig. 2f). Regardless of whether these outlier cells are included or not, we observed no significant relationship between predicted epigenetic age computed by any of the three models and either mean global methylation or total CpG coverage (Extended Data Fig. 5c, d). Recent liver-specific and multi-tissue clocks built using elastic-net regression on bulk murine samples displayed an average error of 2–4 months, comparable to or greater than what we observe with our single-cell method12,37. In turn, these findings suggest that our prediction framework is accurate and generally robust to the technical variability that can arise from single-cell methylome sequencing.
One of the main parameters of our algorithm is the fraction of age-associated CpGs included in the likelihood profile that scAge computes to output a predicted epigenetic age for every cell (Fig. 1c–e). We benchmarked results of the algorithm across two methods for CpG selection. In both cases, we first rank CpGs based on their absolute Pearson correlation with age. Then, the algorithm picks either a defined number n of highly-ranked CpGs or the top x% age-associated CpGs for every cell. Although the results between both selection methods are comparable, we find that the latter method (based on percentiles) better accounts for technical differences in coverage frequently observed in single-cell methylome profiling (Extended Data Fig. 6). Interestingly, with either mode, we find that increasing the number or fraction of CpGs taken as input to the algorithm results in poorer performance when using the liver model, wherein predictions for old hepatocytes progressively decrease in accuracy (Extended Data Fig. 7). For the multi-tissue model, we observed a gain in precision as more CpGs were taken as input to the algorithm. We attribute this difference primarily to the distinct distributions of linear association metrics in single-tissue vs. multi-tissue training datasets: correlation and regression coefficients are much weaker in multi-tissue datasets compared to single-tissue ones (Extended Data Fig. 8).
Muscle stem cells display attenuated epigenetic aging
To investigate the unique applicability of our approach to rare cell populations, we applied scAge to young and old muscle stem cell (MuSC) data38. This dataset consisted of 136 and 139 MuSCs from 1.5-month-old and 26-month-old B6D2F1/JRj mice, respectively (Fig. 3a). As was done in the original study, we omitted cells with less than 500,000 CpGs covered to discard low-quality dropout cells; this resulted in a final filtered dataset of 116 young and 89 old MuSC methylation profiles (Extended Data Fig. 9a). Mean methylation was slightly elevated in old cells (Fig. 3b). We computed epigenetic age predictions in these MuSCs using three training models, including muscle, blood, and multi-tissue datasets. The muscle and multi-tissue clocks showed a slim but significant increase in epigenetic age between both groups, while the blood clock demonstrated no difference between young and old MuSCs (Fig. 3c). As expected, the muscle-trained model was the most accurate, with the lowest median absolute error compared to the other models. Analysis of the relationship between global methylation and predicted epigenetic age uncovered a small positive correlation between both variables using the muscle and multi-tissue training datasets (Fig. 3d). Furthermore, inclusion of all 275 unfiltered cells for predictions revealed that scAge is a robust profiling tool for cells with modest to high coverage, but outputs aberrant and highly variable predictions when coverage is dramatically low (Extended Data Fig. 9b).
Figure 3: Muscle stem cells display attenuated epigenetic aging.
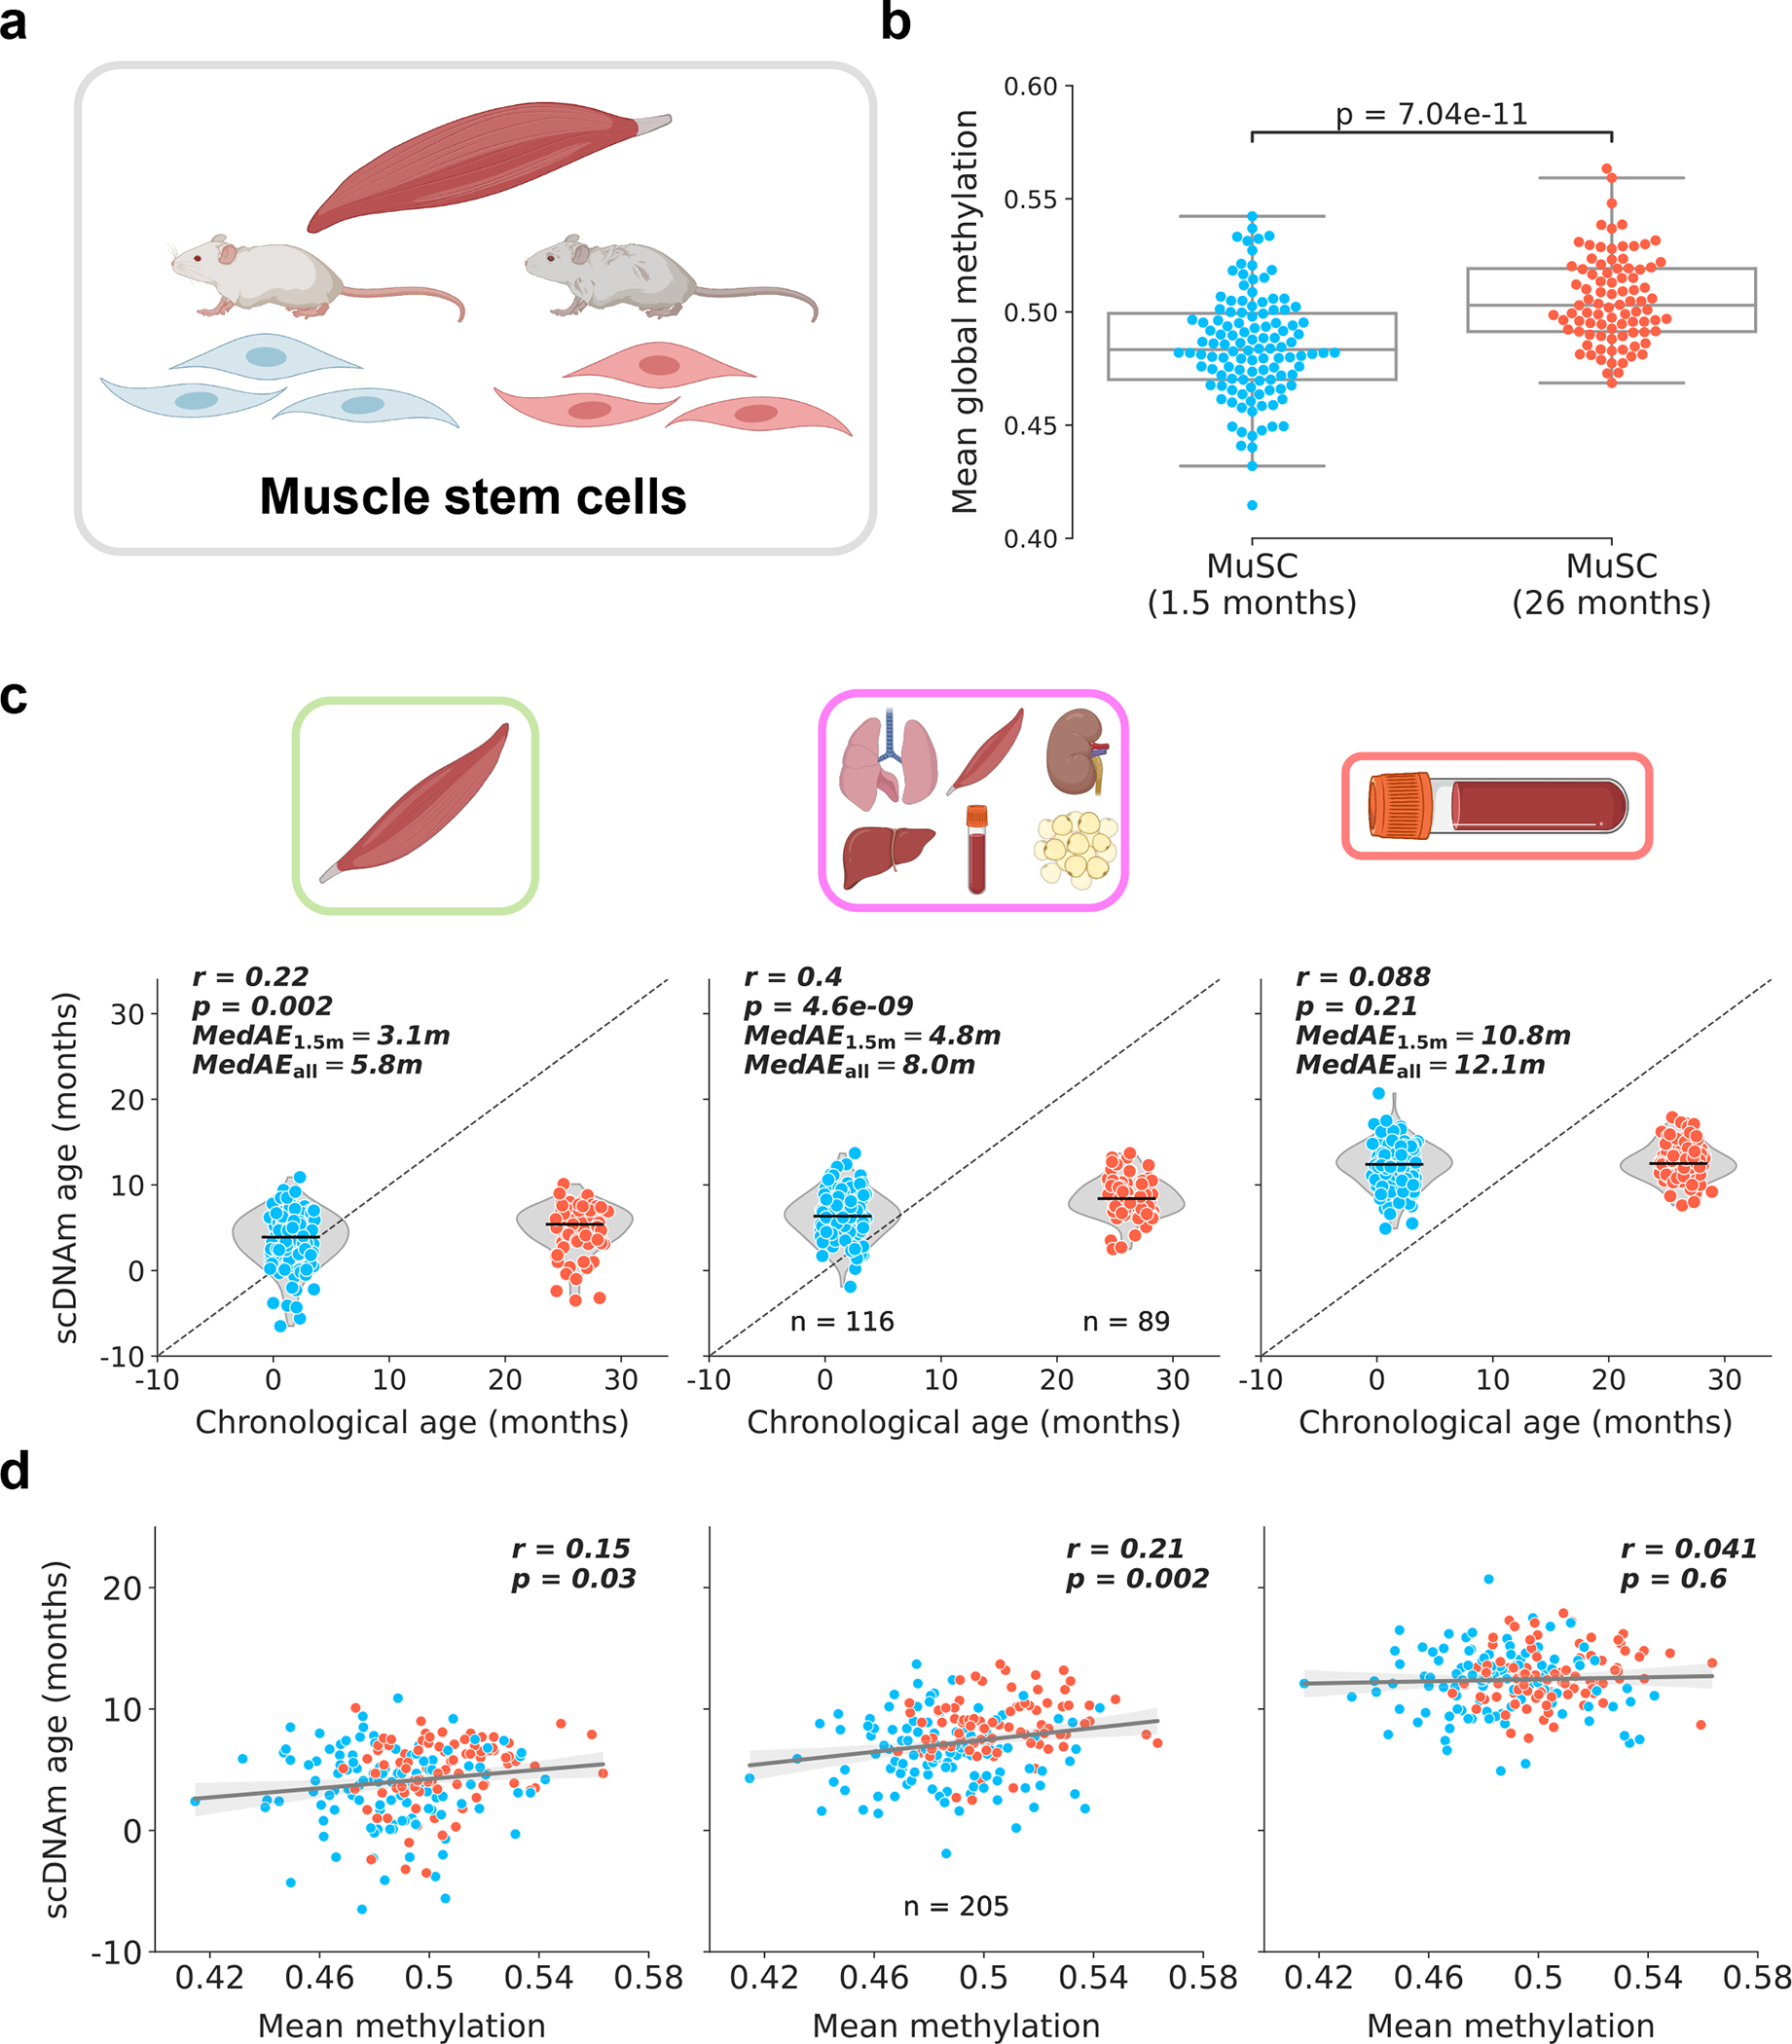
a) Schematic representation of cells analyzed in this figure38. Muscle stem cells were isolated from skeletal muscle tissue of young (1.5-months-old) and old mice (26-months-old). Only cells with >500,000 CpGs covered were retained for further analysis. See Extended Data Fig. 9a for additional information.
b) Mean global methylation in young (blue, n = 116) and old (red, n = 89) filtered cells. Box plots highlight median levels and the first and third quartile, with whiskers depicting observations up to 1.5× the interquartile range. Dots depict individual cells. A single two-tailed Welch’s t-test was used for statistical testing.
c) Predicted epigenetic age versus chronological age in young (blue, n = 116) and old (red, n = 89) muscle stem cells across muscle (left), multi-tissue (middle), and blood (right) models. Median absolute error is shown considering all cells (MedAEall: both 1.5-months-old and 26-months-old cells) or just considering young cells (MedAE1.5m: only 1.5-month-old cells). Jitter on the x-axis was applied purely for visualization purposes. Pearson correlation (r) and the associated p-value (p) are shown. Violin plots depict the kernel density estimations of the data, and inner black lines show the median predictions. Two-tailed Pearson correlation analysis was used for statistical testing, with statistics for each model computed independently without correction.
d) Predicted epigenetic age versus mean global methylation for both young (blue) and old (red) muscle stem cells (n = 205) across muscle (left), multi-tissue (middle), and blood (right) models. Regression lines (grey) are shown with 95% confidence intervals (light grey). Two-tailed Pearson correlation analysis was used for statistical testing, with statistics for each model treated independently without correction. Pearson correlation coefficient (r) and the associated two-tailed p-value (p) are shown.
Individual dots depict single cells throughout the figure.
Our results are remarkably coherent with previous analysis that employed a pseudo-bulk grouping approach to overcome the coverage sparsity in single-cell MuSC methylomes38. This analysis similarly found a slim increase in epigenetic age on the order of a few weeks, far lower than the ~24-month chronological age difference between the two groups of mice. In turn, both methods employed independently suggest that muscle stem cells display minimal aging as measured by DNA methylation patterns. It is however known that muscle stem cells lose functionality and regenerative capacity with age, partly as a result of autophagy-mediated shifts from prolonged quiescence to irreversible senescence and Hoxa9-dependent activation39,40. It was also recently suggested that human muscle stem cells are refractory to aging, hinting that these cell populations likely have distinct biological aging patterns across mammals compared to differentiated muscle cells41. Integrating these functional data with our epigenetic age results may shed light into the complex temporal trajectories that govern muscle stem cell biology. Overall, our results agree with the previously reported epigenetic aging dynamics of mouse muscle stem cells, but offer enhanced single-cell resolution to the data.
Culture conditions impact embryonic stem cell epigenetic age
We next sought to evaluate scAge on single-cell methylation datasets profiling pluripotent embryonic stem cells (ESCs). Using conventional clock approaches, bulk ESC samples and their induced pluripotent stem cell (iPSC) counterparts generally show very low predicted epigenetic ages trending towards zero4,11,12,20,42. Of note, ESCs may be cultured in a variety of conditions: most commonly in media supplemented with LIF and serum, or in serum-free “2i” media supplemented with LIF and two small-molecule inhibitors of the MEK and GSK3β pathways (Fig. 4a). Culturing cells in “2i” medium was previously shown to drive rapid global hypomethylation in ESCs, producing epigenetic profiles concordant with migratory primordial germ cells43.
Figure 4: Culture conditions influence epigenetic age in single embryonic stem cells.
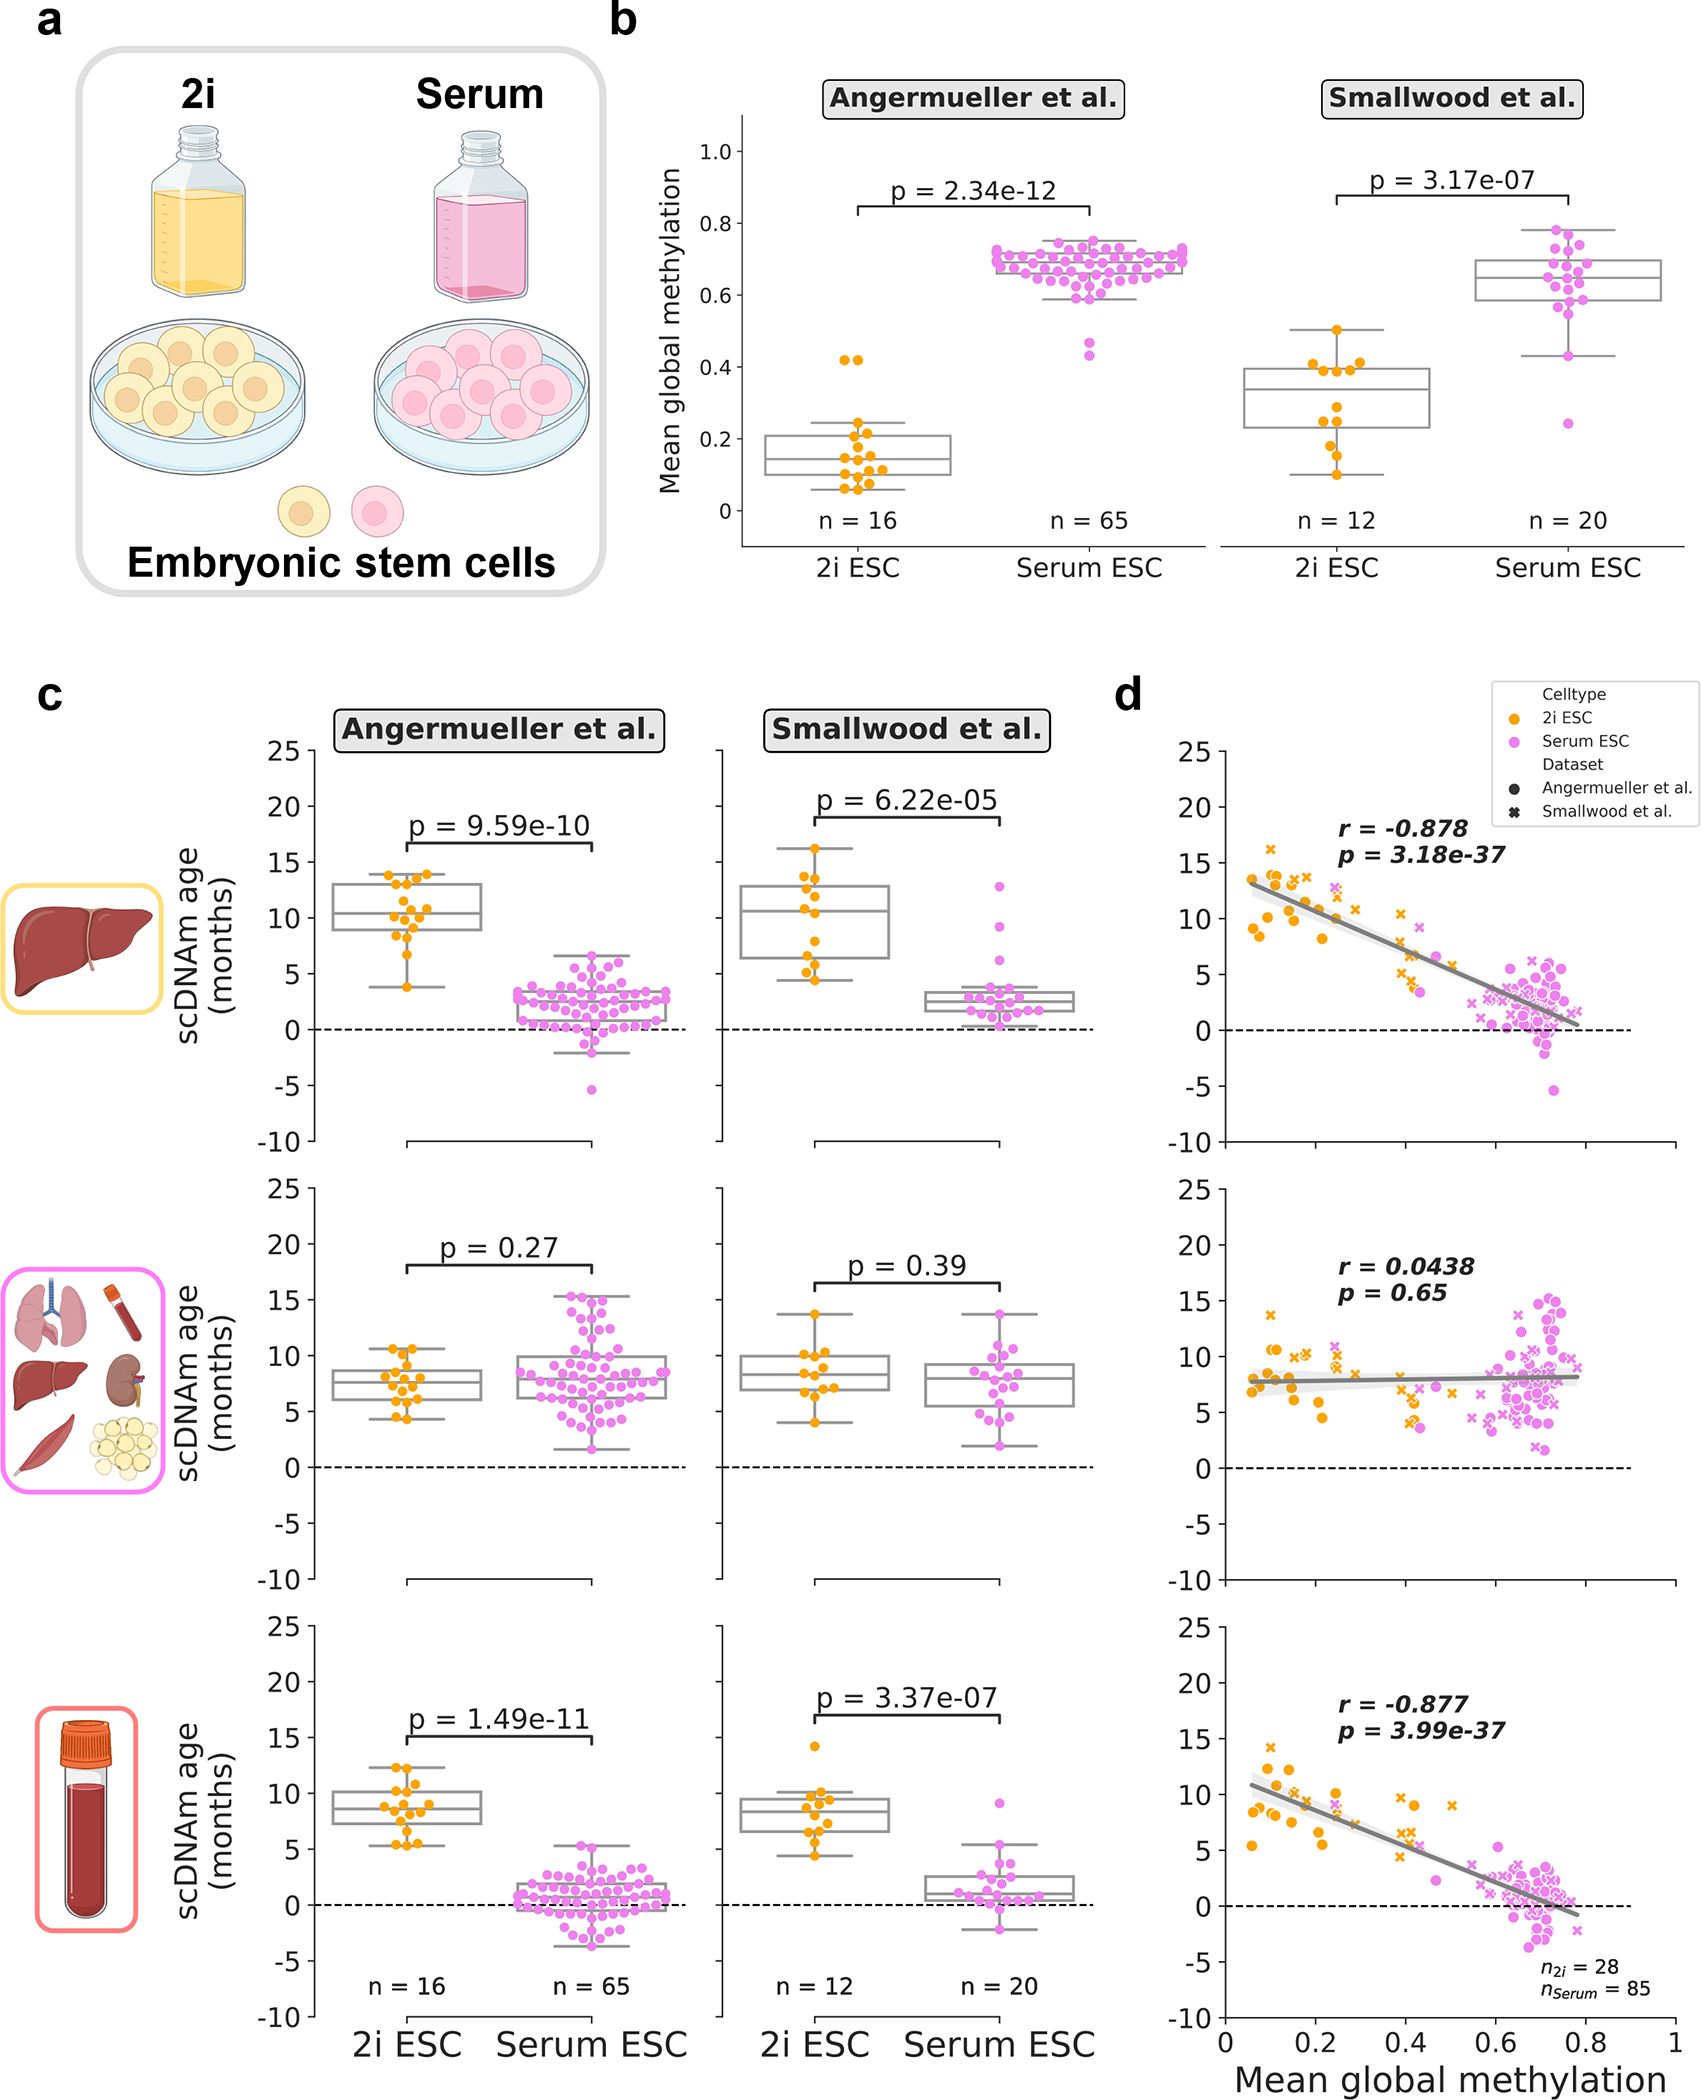
a) Schematic representation of single cells analyzed in this figure25,27. Cells were grown in media supplemented with serum, or in serum-free media with the addition of two small-molecule inhibitors (“2i”) for the MEK and GSK3β pathways.
b) Mean global methylation profiles of single embryonic stem cells grown in 2i (yellow; nAngermueller = 16, nSmallwood = 12) or serum culture conditions (purple; nAngermueller = 65, nSmallwood = 20). Two-tailed Welch’s t-test was used for statistical testing, with statistics for each dataset treated independently without correction. Box plots highlight median levels and the first and third quartile, with whiskers depicting observations up to 1.5× the interquartile range. Dots depict individual cells.
c) Predicted epigenetic ages in 2i (yellow; nAngermueller = 16, nSmallwood = 12) and serum-grown ESCs (purple; nAngermueller = 65, nSmallwood= 20) across liver (top), multi-tissue (middle), and blood (bottom) models. Two-tailed Welch’s t-test was used for statistical testing, with statistics for each model and dataset treated independently without correction. Box plots highlight median levels and the first and third quartile, with whiskers depicting observations up to 1.5× the interquartile range. Dots depict individual cells.
d) Scatterplot relationship between predicted epigenetic age and mean global methylation among all embryonic stem cells (n2i = 28, yellow; nserum = 85, purple). Regression lines (grey) are depicted with 95% confidence intervals (light grey). Pearson correlation (r), and the associated p-value (p) are shown. Two-tailed Pearson correlation analysis was used for statistical testing, with statistics for each model and dataset treated independently without correction. Box plots show median levels and the first and third quartile, and whiskers show 1.5× the interquartile range. Dots depict individual cells, with the symbol denoting study of origin.
As expected, we observed significant global hypomethylation among 2i cells upon reanalysis of two datasets25,27 (Fig. 4b). We profiled epigenetic age in 28 2i ESCs and 85 serum ESCs from these studies with scAge trained on liver, blood, and multi-tissue datasets. We selected these particular training models for embryonic cells, based on the notion that conventional mouse clocks built on these sets of tissues have previously shown the capacity to accurately profile epigenetic age in ESCs and iPSCs near zero and/or discern the effect of longevity/reprogramming interventions11,12,33,37. Interestingly, we observed remarkably coherent results across the liver and blood clocks, which showed a low epigenetic age close to zero for serum-grown ESCs and significantly increased epigenetic age in 2i ESCs (Fig. 4c). This trend is consistent with recent analysis of epigenetic aging patterns in ESCs at the bulk level42. We observed a strong negative correlation between mean methylation and predicted ages with both of these models, suggesting that large-scale global methylation shifts likely play a role in the predicted epigenetic age of the cell as assayed by our method (Fig. 4d). The multi-tissue clock profiled low epigenetic ages in both culture conditions but did not detect a significant difference between 2i and serum ESCs.
A stratified rejuvenation event during mouse gastrulation
We then investigated a dataset profiling mouse gastrulation at single-cell resolution, consisting of 758 cells isolated from murine C57BL/6Babr embryos ranging from embryonic day (E) 4.5 to 7.5 (Fig. 5a)28. To remove dropout cells with low quality data, we again discarded cells with fewer than 500,000 CpGs covered, resulting in a final dataset of 495 single cells across four developmental stages (Extended Data Fig. 9a). Mean global methylation varied drastically during this early period of mouse embryogenesis, with E4.5 cells characterized by global hypomethylation compared to the three subsequent developmental stages (Fig. 5b).
Figure 5: An epigenetic rejuvenation event during mouse embryogenesis.
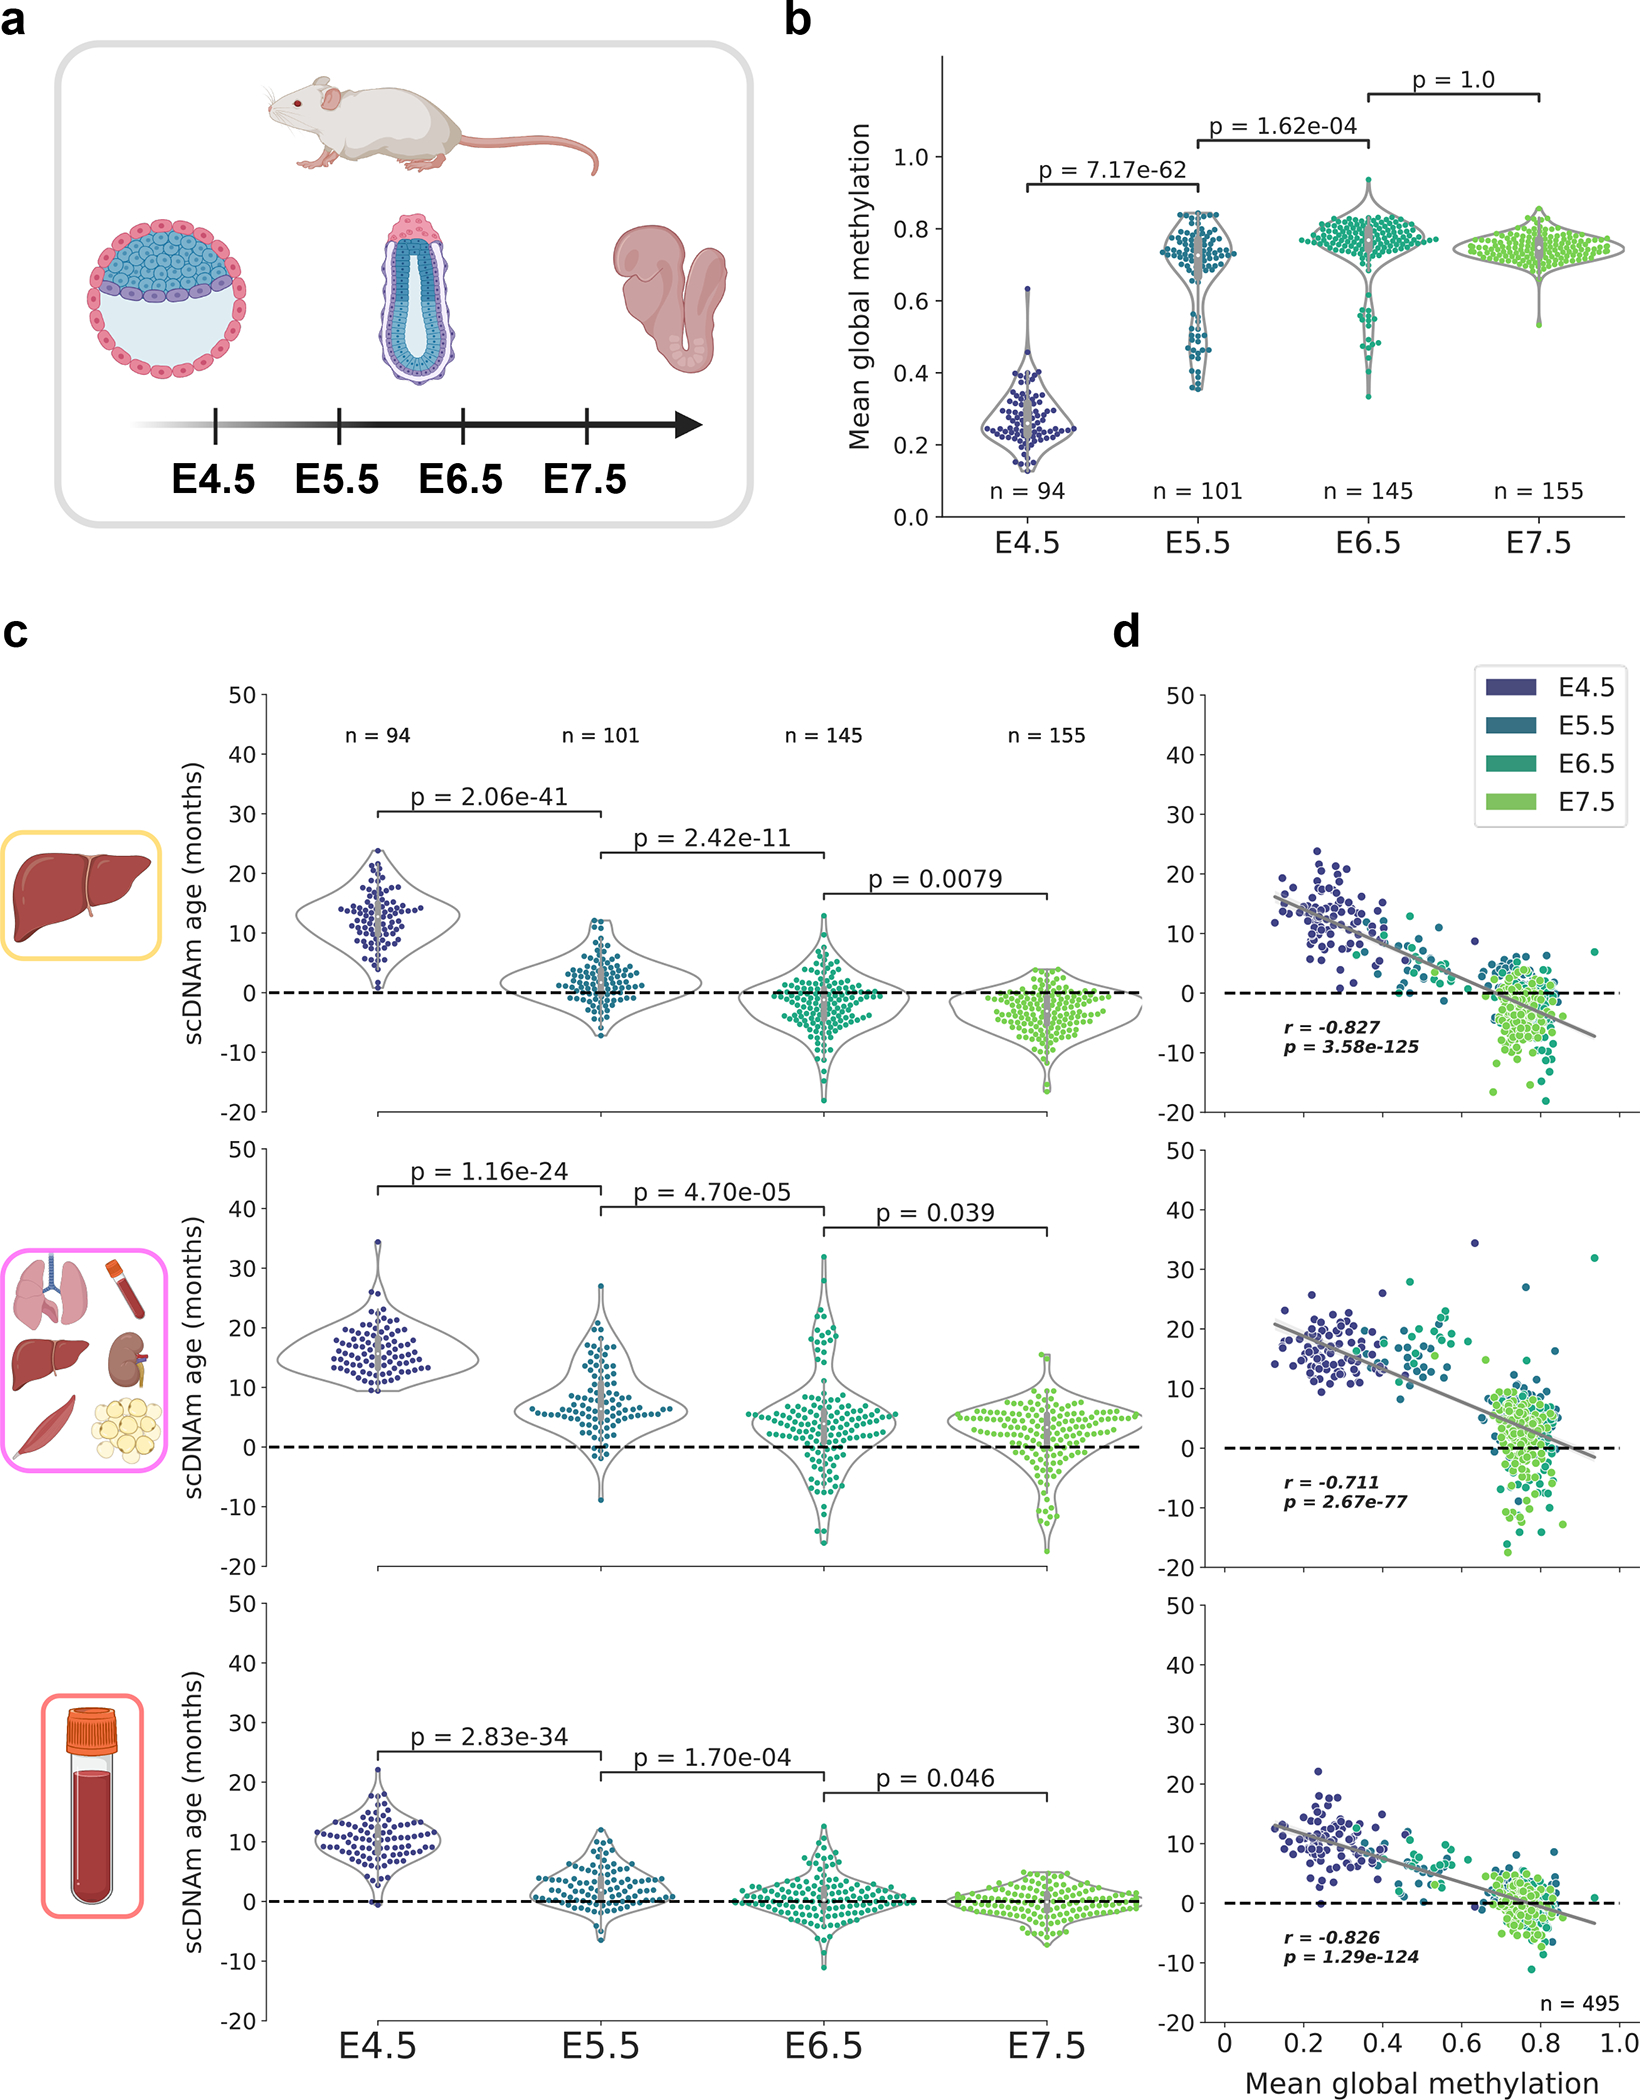
a) Schematic representation of cells analyzed in this figure28. Single cells from mouse embryos at four developmental stages (E4.5, E5.5, E6.5, and E7.5) were isolated and sequenced. Only cells with at least 500,000 CpGs covered were retained for downstream analysis (see Extended Data Fig. 9a for additional details).
b) Mean global methylation profiles in single cells across all four developmental stages assayed (nE4.5 = 94, purple; nE5.5 = 101, dark blue; nE6.5 = 145, dark green; nE7.5 = 155, light green). Two-tailed Welch’s t-test was used for statistical testing, and Bonferroni corrections were applied to correct for multiple testing. Violin plots depict the kernel density estimations of the data, and inner boxplots (grey) depict median levels and the first and third quartile, with whiskers extending up to 1.5× the interquartile range. Dots depict individual cells.
c) Predicted epigenetic ages for cells in all four developmental stages (nE4.5 = 94; nE5.5 = 101, nE6.5 = 145; nE7.5 = 155), across the liver (top), multi-tissue (middle), and blood (bottom) scAge models. Colors correspond to those detailed in (b). Two-tailed Welch’s t-test was used for statistical testing, with Bonferroni corrections applied to correct for multiple testing. Violin plots depict the kernel density estimate of the data, and inner boxplots (grey) depict median levels and the first and third quartile, with whiskers extending up to 1.5× the interquartile range. Dots depict individual cells.
d) Scatterplot depicting the relationship between mean global methylation and predicted epigenetic age across all cells (n = 495) in liver (top), multi-tissue (middle), and blood (bottom) models. Colors correspond to those in (b) and in the legend in the top right. Regression lines (grey) are depicted with 95% confidence intervals (light grey). Pearson correlation (r), and the associated p-value (p) are shown. Two-tailed Pearson correlation analysis was used for statistical testing, with statistics for each dataset treated independently without correction.
It was recently suggested that embryogenesis may be characterized by an initial decrease in biological age to a point termed the “ground zero,” after which organismal aging formally begins44. Consistent with this idea, recent application of epigenetic clocks to bulk samples revealed a significant reduction in biological age (i.e., rejuvenation) during early stages of embryogenesis, followed by an increase in later stages42. This finding also agrees with the notion that damage accumulation inevitably occurs during the lifespan of an organism, even in germ cells. Thus, a rejuvenation event is thought to take place during embryogenesis to ensure the continuous generation of new biologically young individuals.
To investigate this hypothesis at single-cell resolution, we applied the same scAge models used on ESCs to individual embryonic cells from the four developmental stages assayed. We observed across all models a steady and significant reduction in the predicted age from E4.5 to E7.5, consistent with the notion of a rejuvenation event (Fig. 5c). Interestingly, there was a strong negative correlation across all three models between mean global methylation and predicted epigenetic age (Fig. 5d). This suggests an important association between the de novo methylation event that occurs during embryogenesis and the apparent decrease in biological age.
To further refine the resolution of this rejuvenation event, we integrated lineage information for each cell in the dataset based on pre-computed assignments derived from mapping gene expression patterns of single embryonic cells to a recent atlas of mouse gastrulation (Fig. 6a, b)28,45. This increase in resolution revealed that cells mapped to the epiblast lineage accounted for the majority of the rejuvenation signal, showing a strong initial decrease in biological age trending towards or below zero during gastrulation (Fig. 6c). Moreover, newly formed germ layers (endoderm, mesoderm, and ectoderm) showed a low biological age near 0. Interestingly, extra-embryonic ectoderm and visceral endoderm cells showed significantly higher predicted ages compared to other embryonic cell types of the same developmental stage. These findings may suggest spatiotemporal stratification of the rejuvenation event; this process may be specific to cells that predominantly go on to form the embryo proper and excludes cells fated to supportive extra-embryonic lineages. Cells failing to show evidence of rejuvenation also retain partially unmethylated profiles (Fig. 6d). This further suggests a deep link between differential demethylation, de novo methylation, and the observed lineage-resolved epigenetic age decreases.
Figure 6: Lineage-specific resolution reveals stratification in the epigenetic rejuvenation event.
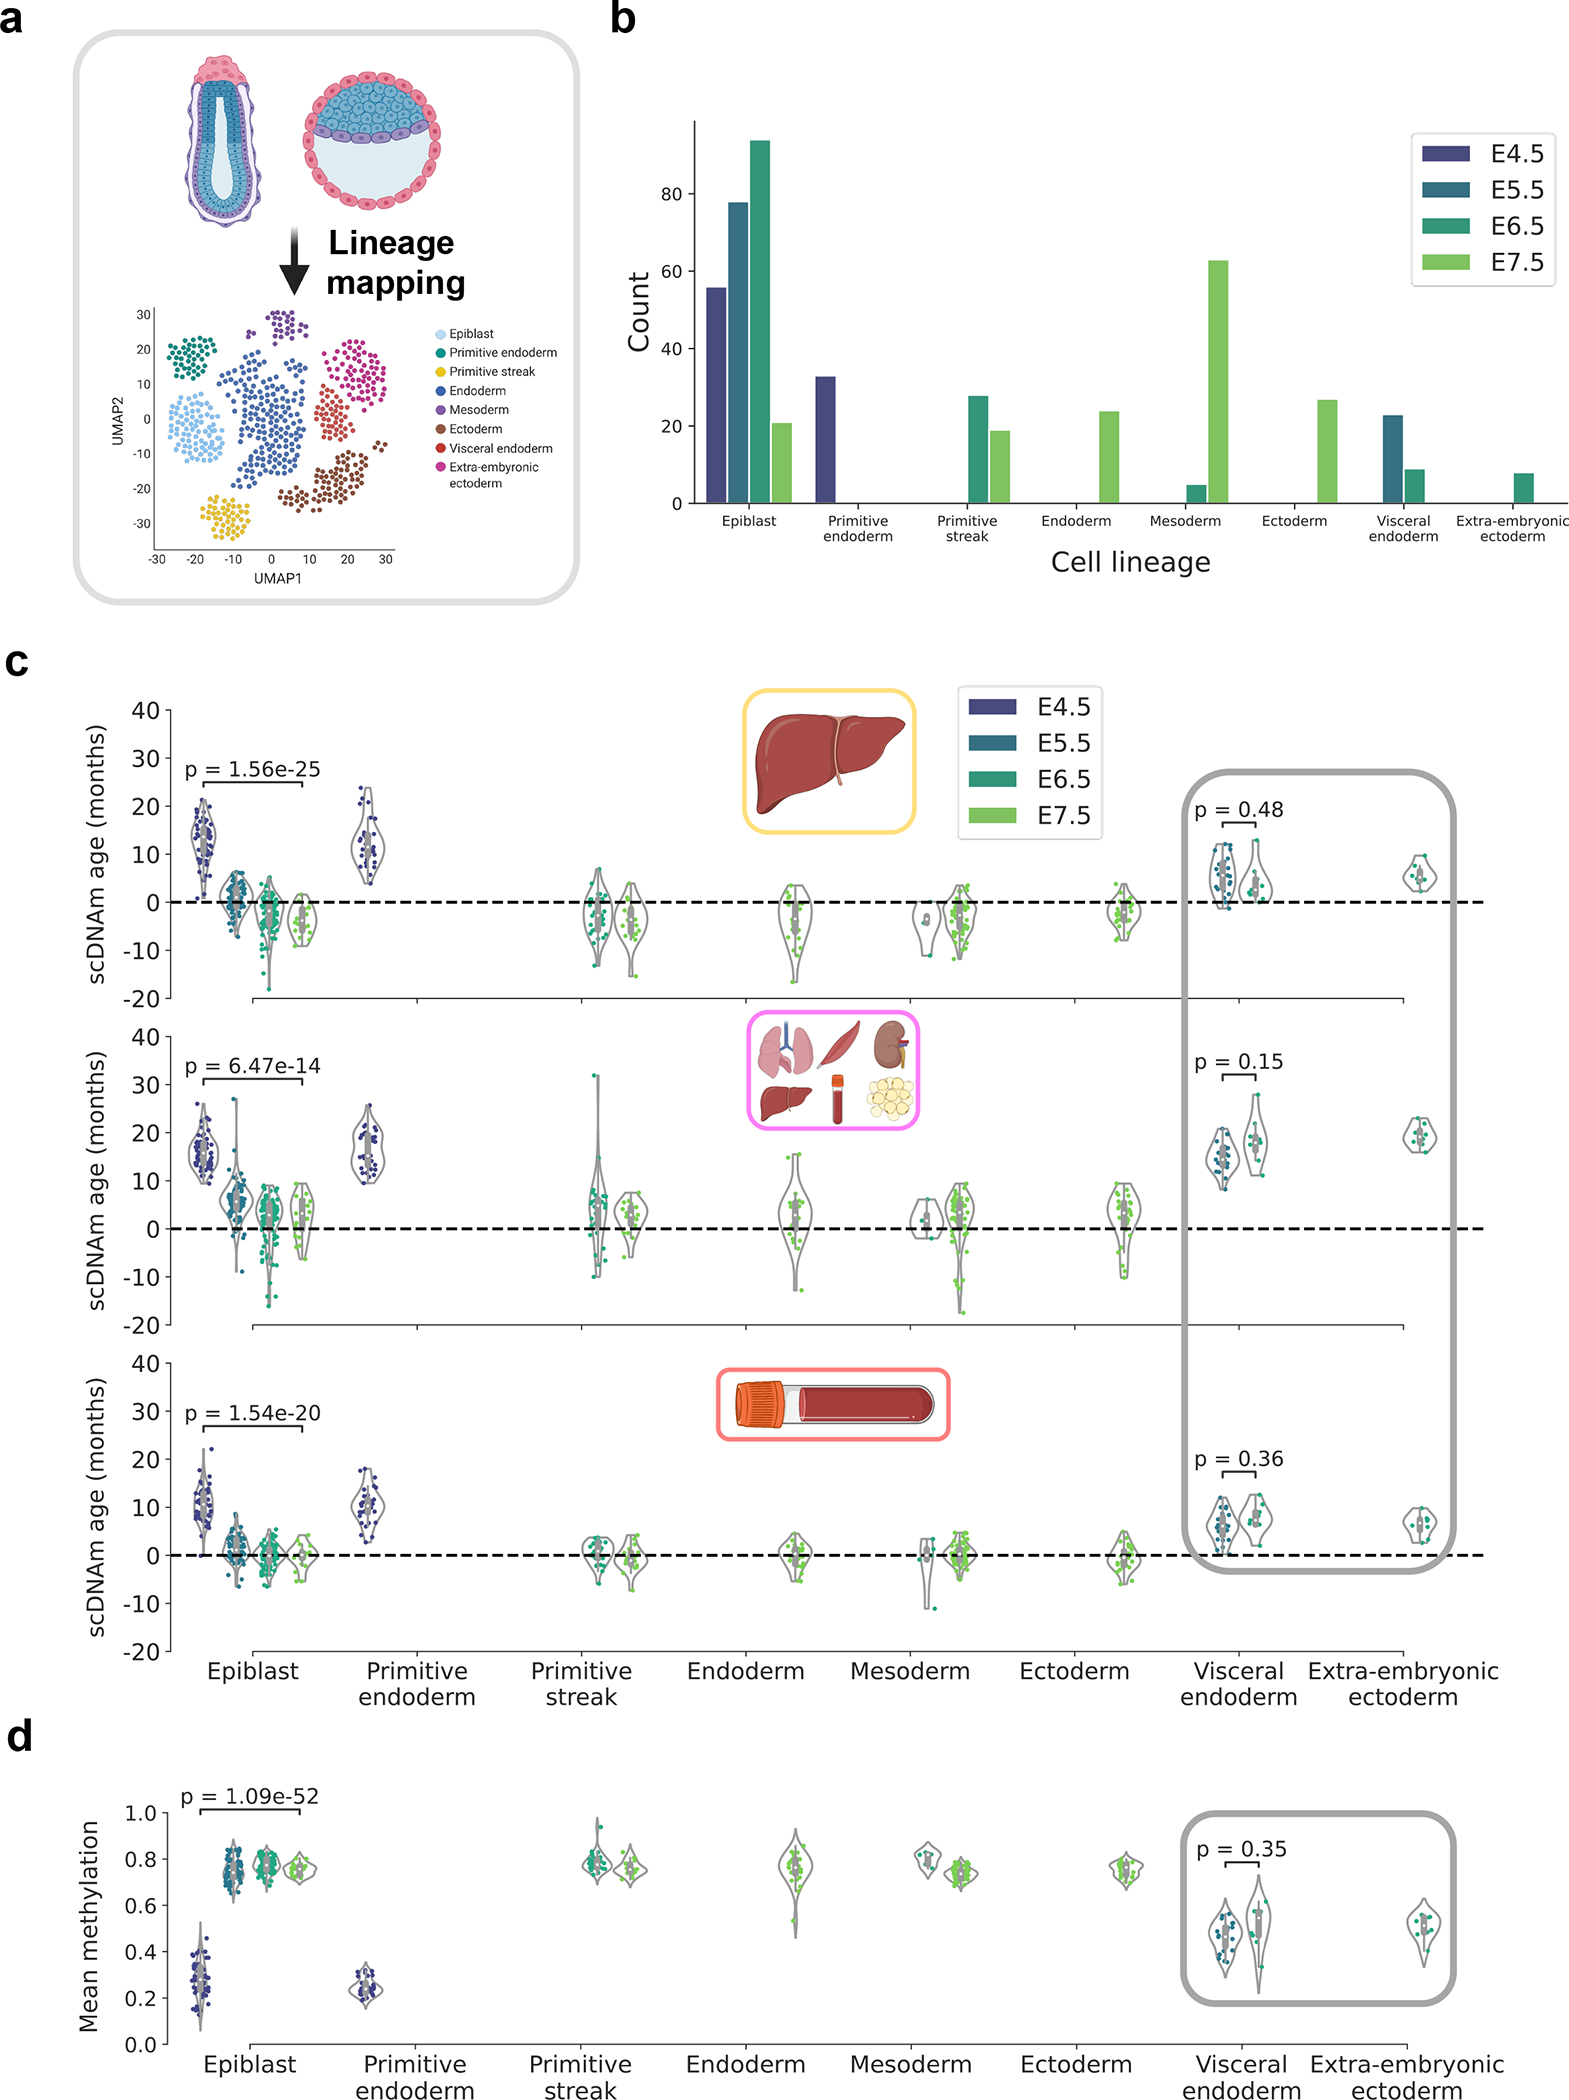
a) Schematic representation of the transcriptomic mapping procedure used to assign lineage annotations to individual cells, based on multimodal omics data obtained in this study28 and a reference single-cell gene expression atlas of mouse gastrulation45.
b) Bar plot of the count of different cell lineages across the four developmental stages, based on lineage annotations provided by the authors28. Color scale defines the developmental stage (E4.5, purple; E5.5, dark blue; E6.5, dark green; E7.5, light green).
c) Predicted epigenetic ages for single embryonic cells across liver (top), multi-tissue (middle), and blood (bottom) datasets, grouped by assigned lineage and colored by developmental stage (as detailed in (b)). Number of cells for each lineage-stage pair is shown graphically in panel (b): Epiblast — nE4.5 = 56, nE5.5 = 78, nE6.5 = 94, nE7.5 = 21; Primitive endoderm — nE4.5 = 33; Primitive streak — nE6.5 = 28, nE7.5 = 19, Endoderm — nE7.5 = 24 ; Mesoderm — nE6.5 = 5, nE7.5 = 63 ; Ectoderm — nE7.5 = 27; Visceral endoderm — nE5.5 = 23, nE6.5 = 9; Extra-embryonic endoderm — nE6.5 = 8.
Gray rectangle denotes supportive extra-embryonic tissues that appear not to undergo rejuvenation. Two-tailed Welch’s t-test was used for statistical testing, and Bonferroni corrections were applied to account for multiple testing. Violin plots depict the kernel density estimate of the data, and inner boxplots (grey) depict median levels and the first and third quartile, with whiskers extending up to 1.5× the interquartile range. Dots depict individual cells.
d) Mean global methylation for single embryonic cells grouped by assigned lineage and colored by developmental stage (as in (b)). Number of cells for each lineage-stage pair is shown graphically in panel (b) and is the same as described in (c). Gray rectangle denotes supportive extra-embryonic tissues. Two-tailed Welch’s t-test was used for statistical testing, and Bonferroni corrections were applied to account for multiple testing. Violin plots depict the kernel density estimation of the data, and inner boxplots (grey) depict median levels and the first and third quartile, with whiskers extending up to 1.5× the interquartile range. Dots depict individual cells.
Together, these striking results suggest a stratified rejuvenation event occurs during mid-embryogenesis and that individual cells may be rejuvenated through natural means. The lowest single-cell epigenetic age approximately corresponds to the stage of gastrulation and is associated with de novo hypermethylation, hinting that to rejuvenate cells it may be important to first carefully demethylate and subsequently remethylate the genome.
DISCUSSION
In this work, we report scAge, an approach enabling single-cell epigenetic age predictions. Our framework leverages bulk methylation data to train linear models that predict methylation levels from age across a large number of CpG sites. An intersection and ranking algorithm selects informative CpGs covered jointly in a single cell and a reference dataset, followed by computation of a cell-specific likelihood profile across a range of ages. We then assign the age of maximum likelihood as the final epigenetic age of a cell. This method solves the complex challenges of sparse and binarized methylation profiles in single cells, which previously precluded attempts to estimate epigenetic age in individual cells. Indeed, all bulk epigenetic clocks to date require defined sets of CpG sites for their application, an approach which is currently not feasible to employ in the case of single cells.
This method enables accurate age prediction of single hepatocytes and mouse embryonic fibroblasts with high resolution on models trained on liver or multi-tissue datasets. We find that age predictions are most accurate and precise when scAge is trained on the tissue from which a particular cell belongs to, and that training exclusively on certain other tissues may preclude robust assessment of biological aging; this highlights the importance of tracking tissue or cell type-specific epigenetic aging patterns. We also demonstrate that multi-tissue datasets, despite depicting much weaker linear associations with age, are still able to estimate biological age in single cells with fair accuracy. This provides utility in the case where cell type is unknown or if no tissue specific reference data is available, and may also track tissue-independent CpG methylation trajectories.
Additionally, we show consistency between predictions from our model and previous work in mouse muscle stem cells, which display attenuated epigenetic aging in comparison to their chronological age. This result and our single-cell method offer exciting future avenues for dissecting the role of epigenetic aging and differentiation across mammalian tissues. Particularly, this framework may prove useful to quantify biological aging in complex differentiation hierarchies and to uncover the impact of cell state on epigenetic age predictions. We also find that while ESCs are generally predicted to have low epigenetic age, the age differs depending on the culture condition and its downstream effect on global methylation patterns. Finally, our data provide further evidence for the recently proposed “ground zero” hypothesis of aging by showing a strongly significant decrease in the epigenetic age of single cells at the time of gastrulation. We find that this rejuvenation event is stratified, wherein only cells fated for intra-embryonic lineages display a significant reduction in epigenetic age.
Despite its utility for single-cell profiling, scAge presently has important limitations that need to be acknowledged. For one, binary methylation states of CpGs were here assumed to be completely independent of each other, as prior work suggested that this was the case when analyzing single reads from bulk samples3,7. However, a more thorough analysis of this behavior specifically in single cells may reveal biological insights suggesting a more complex inter-CpG relationship. Additionally, the exclusive use of linear regression may be suboptimal when considering the potentially vast set of mathematical relationships that best model CpG methylation levels and age. In tandem, we observe that some bulk methylation distributions are truncated as a result of their location near the edges of the unit interval, which may have an impact on the creation of linear models and downstream age predictions (Extended Data Fig. 2). Our method also makes use of observed methylation values in bulk data in a deterministic manner to construct linear models, as opposed to random probabilistic modeling of methylation distributions. Despite these limitations, we find that our approach is nevertheless an accurate tool enabling robust epigenetic age profiling in single cells, based both on real single-cell data as well as simulation analyses (Extended Data Fig. 10).
We note also that we have not explored the effect of cell composition when creating bulk reference datasets. This may be important, as cell composition is known to change with age in many tissues1,24. However, to our knowledge, there is currently no cell type specific RRBS mouse methylation datasets with a wide age range that we could use as the input reference dataset of our scAge approach, or as input to reference-based cell-type deconvolution algorithms46. Reference-free deconvolution algorithms may hold promise in this regard, but in our testing the lack of definitive cell-type labels combined with the large influence of age on methylation patterns at critical CpGs currently precludes the robust use of these techniques47. It also remains to be explored how epigenetic age interfaces with differentiation at the cellular level, how individual aging trajectories of cells change with time, how biological age is transferred during events such as mitosis, and finally how these predictions reflect the fundamental biological state of cells.
Taken together, we find that the aggregation of multiple single-cell predictions provides an accurate average measure of the age of a particular tissue. However, our single-cell clock framework concurrently uncovers some heterogeneity in the aging trajectories of individual cells. It was previously suggested that current bulk epigenetic clocks may function partly by tracking changes in tissue composition with age, and this new approach may serve to elucidate to what extent this occurs at single-cell resolution4,38. Our current results hint that some cells may undergo accelerated or decelerated epigenetic aging, which was previously impossible to ascertain. Nevertheless, the age of the majority of differentiated cells was consistent with the age of the tissue, arguing against the idea of an altered tissue composition as the sole basis for existing bulk clocks. Thus, scAge revealed that individual cell lineages within organisms indeed age.
These findings are particularly in line with recent work that uncovered bulk and single-cell cross-tissue gene expression changes with age in mice24,48, and with the notions of asynchronous and digital aging recently put forth49. scAge further showed that certain cells, which are destined to become part of the embryo during the process of gastrulation, are naturally rejuvenated. It would be of particular interest to uncover the mechanisms underlying this process, which may form the basis of putative rejuvenation therapies.
Our single-cell approach, scAge, may have profound clinical applications for mammalian somatic, germline, and cancer cells, as it may be possible to epigenetically discriminate and map “young” and “old” cells within heterogeneous tissues via this approach. Additionally, our method may be instrumental in assessing the rejuvenation process upon epigenetic reprogramming, as well as in other processes that generate extensive cell-to-cell heterogeneity. We present here a framework to profile epigenetic age in single cells, with exciting applications at the interface of aging, rejuvenation, and emerging single-cell technologies.
METHODS
Ethics and animals
Our study complies with all relevant ethical regulations. We used publicly available datasets of murine single-cells, which were isolated by the original authors of the studies, each certifying compliance with local ethical committees and regulations. In the Gravina et al. study23, hepatocytes were isolated from 6 C57BL/6J mice (three 4-months-old mice and three 26-months-old mice). In the Hernando-Herraez et al. study38, muscle stem cells were isolated from 6 C57BL/6;DBA2 F1/JRj mice (three 1.5-months-old mice, and three 26-months-old mice). In the Argelaguet et al. study28, embryos were collected from several female C57BL/6Babr mice.
Single-cell data processing
For the Gravina et al. study, sequence data was downloaded from the SRA with sratoolkit 2.10.8 under accession number SRA34404523. FASTQ files were pre-trimmed prior to deposition to the SRA. Trimmed sequences were mapped to the mm10/GRCm38.p6 genome using Bismark 0.22.3 with the option –non_directional, as suggested by the Bismark User Guide v0.21.0 for Zymo Pico-Methyl scWGBS library preparations. Reads were deduplicated and methylation levels for CpG sites were extracted with Bismark50.
For the Hernando-Herraez et al.38, Angermueller et al27, Smallwood et al.25, and Argelaguet et al. studies28, processed coverage files containing extracted methylation levels generated by Bismark were downloaded directly from the GEO database with GNU wget 1.17.1 under accession numbers GSE12143638, GSE6864227, GSE5687925, and GSE12169028, respectively.
All coverage files were then further processed to scale methylation level to a ratio between [0, 1]. While single-cell methylation profiles were almost entirely binary, technical considerations such as PCR amplification bias resulted in the presence of some intermediate methylation values. To address this, uncertain methylation calls of 0.5 were removed prior to downstream analysis, and remaining methylation values were rounded to 0 or 1. Only genomic positions on the 19 mouse autosomes were retained for analysis. Coverage was interpreted as the total number of covered methylated and unmethylated cytosines in a CpG context on both DNA strands. Average global methylation in single cells was computed as the mean of all binary methylation states observed.
Due to the technical considerations of single-cell methylome sequencing, the number of CpGs covered in each cell is highly variable (Extended Data Fig. 9a). In order to maximize the numbers of cells to include in our analysis while also filtering out low-quality dropout cells, we applied a coverage filter of at least 500,000 CpGs covered per cell, as was previously done by others38. A summary of the single-cell datasets used, their accessions, and the final cell types and numbers analyzed is provided in Supplementary Table 1.
Bulk data processing
To power the predictive capacity of scAge, we created bulk reference datasets that estimate the relationship between age and methylation level for a large set of CpGs. We downloaded processed bulk RRBS data from the Thompson et al. study deposited in the GEO database under accession number GSE12013234. This dataset consisted of 549 total samples from liver, lung, blood, kidney, adipose and muscle tissues with ages ranging from 1 month to 21 months across three strains of mice. Since most single-cell datasets we analyzed were composed of cells from C57BL/6J or related mice, we exclusively isolated samples from this strain, resulting in 196 samples across 6 tissues with roughly equal tissue and age distributions. These samples formed the basis of the multi-tissue reference dataset. From this group, we selected tissue-specific samples for liver, blood, and muscle, each with a consistent age distribution from young to old (Extended Data Fig. 1).
Methylation fractions in the bulk data were taken as the number of reads supporting a methylated status for a CpG over the total number of reads that covered this cytosine. To maximize the accuracy of bulk methylation levels while also preserving as many sites as possible, only CpG sites for which 90% of samples had at least 5× coverage in were retained33. This resulted in a final multi-tissue matrix of 196 samples across 748,955 positive strand CpGs on autosomic chromosomes, with some missing values. Of note, the authors of the Thompson et al.34 study concatenated negative strand CpG information to the positive strand, explaining why only positive strand CpGs formed the basis of our training datasets. From this multi-tissue dataset, we created tissue-specific matrices for liver, blood, and muscle tissues. We applied dimensionality reduction via principal component analysis (PCA) on all CpG sites to identify and remove outlier samples in the single-tissue datasets. This also confirmed that tissue identity is the main component of variance in bulk methylation data (Extended Data Fig. 1b). We created filtered liver, blood and muscle-specific DNA methylation matrices containing 29 liver samples, 50 blood samples, and 24 muscle samples with ages ranging from 2 months to 21 months based on the same set of 748,955 positive-strand CpGs, as well as a multi-tissue matrix based on 196 samples across 6 tissues.
The scAge framework
To devise an algorithm to ascertain epigenetic age in single cells, we were inspired by recently published age predictors of individual bisulfite-barcoded-amplicon sequencing (BBA-seq) reads from bulk samples3,7. To begin, we used multi-tissue and tissue-specific methylation matrices to compute linear regression equations and Pearson correlations between methylation level and age for each CpG. These equations were in the form:
where age is treated as the independent variable predicting methylation, and m and b are the slope and intercept of the CpG-specific regression line, respectively. This enabled the creation of reference linear association metrics between methylation level and age for each CpG covered in the training datasets (Fig. 1c).
Next, we intersected binarized methylation profiles of single cells with the reference data, producing a set of N common CpGs shared across both datasets (Fig. 1c). For each cell, we filtered these N CpGs based on the absolute value of their Pearson correlation with age, selecting the most age-associated CpGs in every cell. We evaluated several options to perform this selection. On one hand, a specific number n of CpGs sites can be chosen for every cell. However, since coverage can vary widely among single cells, we instead opted to use a percentile-based approach: the top x% age-associated CpGs are selected per cell. We found that this enabled more consistent correlation distributions among single-cell profiles compared to an arbitrary number n of CpGs for every cell (Extended Data Fig. 6). Benchmarking revealed that single-tissue scAge clocks are most accurate when few, strongly age-associated CpGs are profiled (top 1%), while multi-tissue clocks improve in precision as slightly more CpGs are included (top 10%) (Extended Data Fig. 7). Due to this, we opted to use a top-1% age-associated CpGs cutoff in single-tissue predictions, and top 10% age-associated CpGs cutoff with multi-tissue predictions.
For each selected CpG per cell, we iterated through age in steps of 0.1 months from a minimum age to a maximum age parameter. In this work, we picked −20 months and 60 months as the minimum and maximum values, respectively, to cover well past the lifespan of a typical mouse in both directions and to prevent any computation bias in our predictions. These parameters may be changed when running the algorithm to any desired resolution and age range. Using the linear regression formula calculated per individual CpG in a training set, we computed the predicted methylation, fCpG(age), which by the nature of the data normally lies between 0 or 1. If this predicted value was outside of the range (0, 1), it was instead replaced by 0.001 or 0.999 depending on the proximity to either value. This ensured that predicted bulk methylation values were bounded in the unit interval, corresponding to a range between fully unmethylated (0) and fully methylated (1). Next, we assumed that the probability of observing a methylated single cell coming from a tissue of a given age was approximately equal to fCpG(age), that is, PrCpG(age) = fCpG(age). As an example, if a particular bulk tissue is 70% methylated (methylation = 0.7) at one CpG site, we expect that any random single cell from this tissue has a 70% chance of being methylated at that same CpG locus. Thus, the probability that a single cell was methylated at that CpG is fCpG(age), and conversely the probability that a single cell was not methylated at that CpG is 1 − fCpG(age) (Fig. 1d). This provided an age-dependent probability for every common CpG retained in the algorithm. An important limitation to consider with this approach is that methylation distributions for some CpGs lie close to the boundaries of the unit interval, revealing truncated Gaussian distributions (Extended Data Fig. 2).
Assuming that all CpGs are independent from each other, the product of each of these probabilities will be the overall probability of the observed methylation pattern:
where k represents individual CpGs (Fig. 1d, e). Our goal is then to find the maximum of that product among different ages (i.e., to find the most probable age for observing a particular methylation pattern). Practically, we compute the sum across CpGs of the natural logarithm of the individual age-dependent probabilities, preventing underflow errors that result from large-scale fractional products. This gave us:
for each age step. By harnessing the relationship of methylation level and age at many CpGs, these logarithmic sums ultimately provide a single likelihood metric for every age that a single cell comes from a bulk tissue of that age. Finally, we pick the age of maximum likelihood as our predictor of epigenetic age for a single cell (Fig. 1e).
Single-cell profile simulations
To corroborate our findings, we investigated the capacity of scAge to profile epigenetic age in simulated single-cell profiles. For this, we used the 29 filtered bulk liver samples described above (Extended Data Fig. 1), and created 10 simulated binary single-cell methylome profiles for each sample using a random Bernoulli distribution, with the probability parameter set to the bulk methylation level (Extended Data Fig. 10a). We observed that mean methylation patterns between simulated profiles and bulk data were consistent, despite shifting from a continuous to a binary data modality (Extended Data Fig. 10b). When we applied scAge to simulated profiles consisting of the entire set of 748,955 CpGs in the bulk data, we observed strong predictive performance (r = 0.96) across all age groups, with minimal variation between simulated cells (mean standard deviation = 0.78) (Extended Data Fig. 10c). To better account for the low and differential coverage observed in real single-cell profiles, we randomly downsampled these simulated profiles by a factor of 10 and reran the scAge algorithm with identical parameters. This simulation similarly showed very strong predictive accuracy (r = 0.96), although prediction variance was increased as a result of random down-sampling (mean standard deviation = 1.36) (Extended Data Fig. 10d).
Computational and statistical analyses
All analyses were performed using Python 3.9.2, running with numpy 1.20.2 and pandas 1.2.4 for mathematical computing. Figures were generated using matplotlib 3.4.1 in combination with seaborn 0.11.1. Welch’s two-tailed t-test assuming unequal variances, implemented in statannot 0.2.3 and scipy 1.6.3, was used to perform statistical tests between groups. Two-tailed Pearson correlation analysis was also used for statistical tests. Bonferroni corrections were employed to correct for multiple testing where indicated.
Extended Data
Extended Data Figure 1: Bulk training data characteristics and dimensionality reduction.
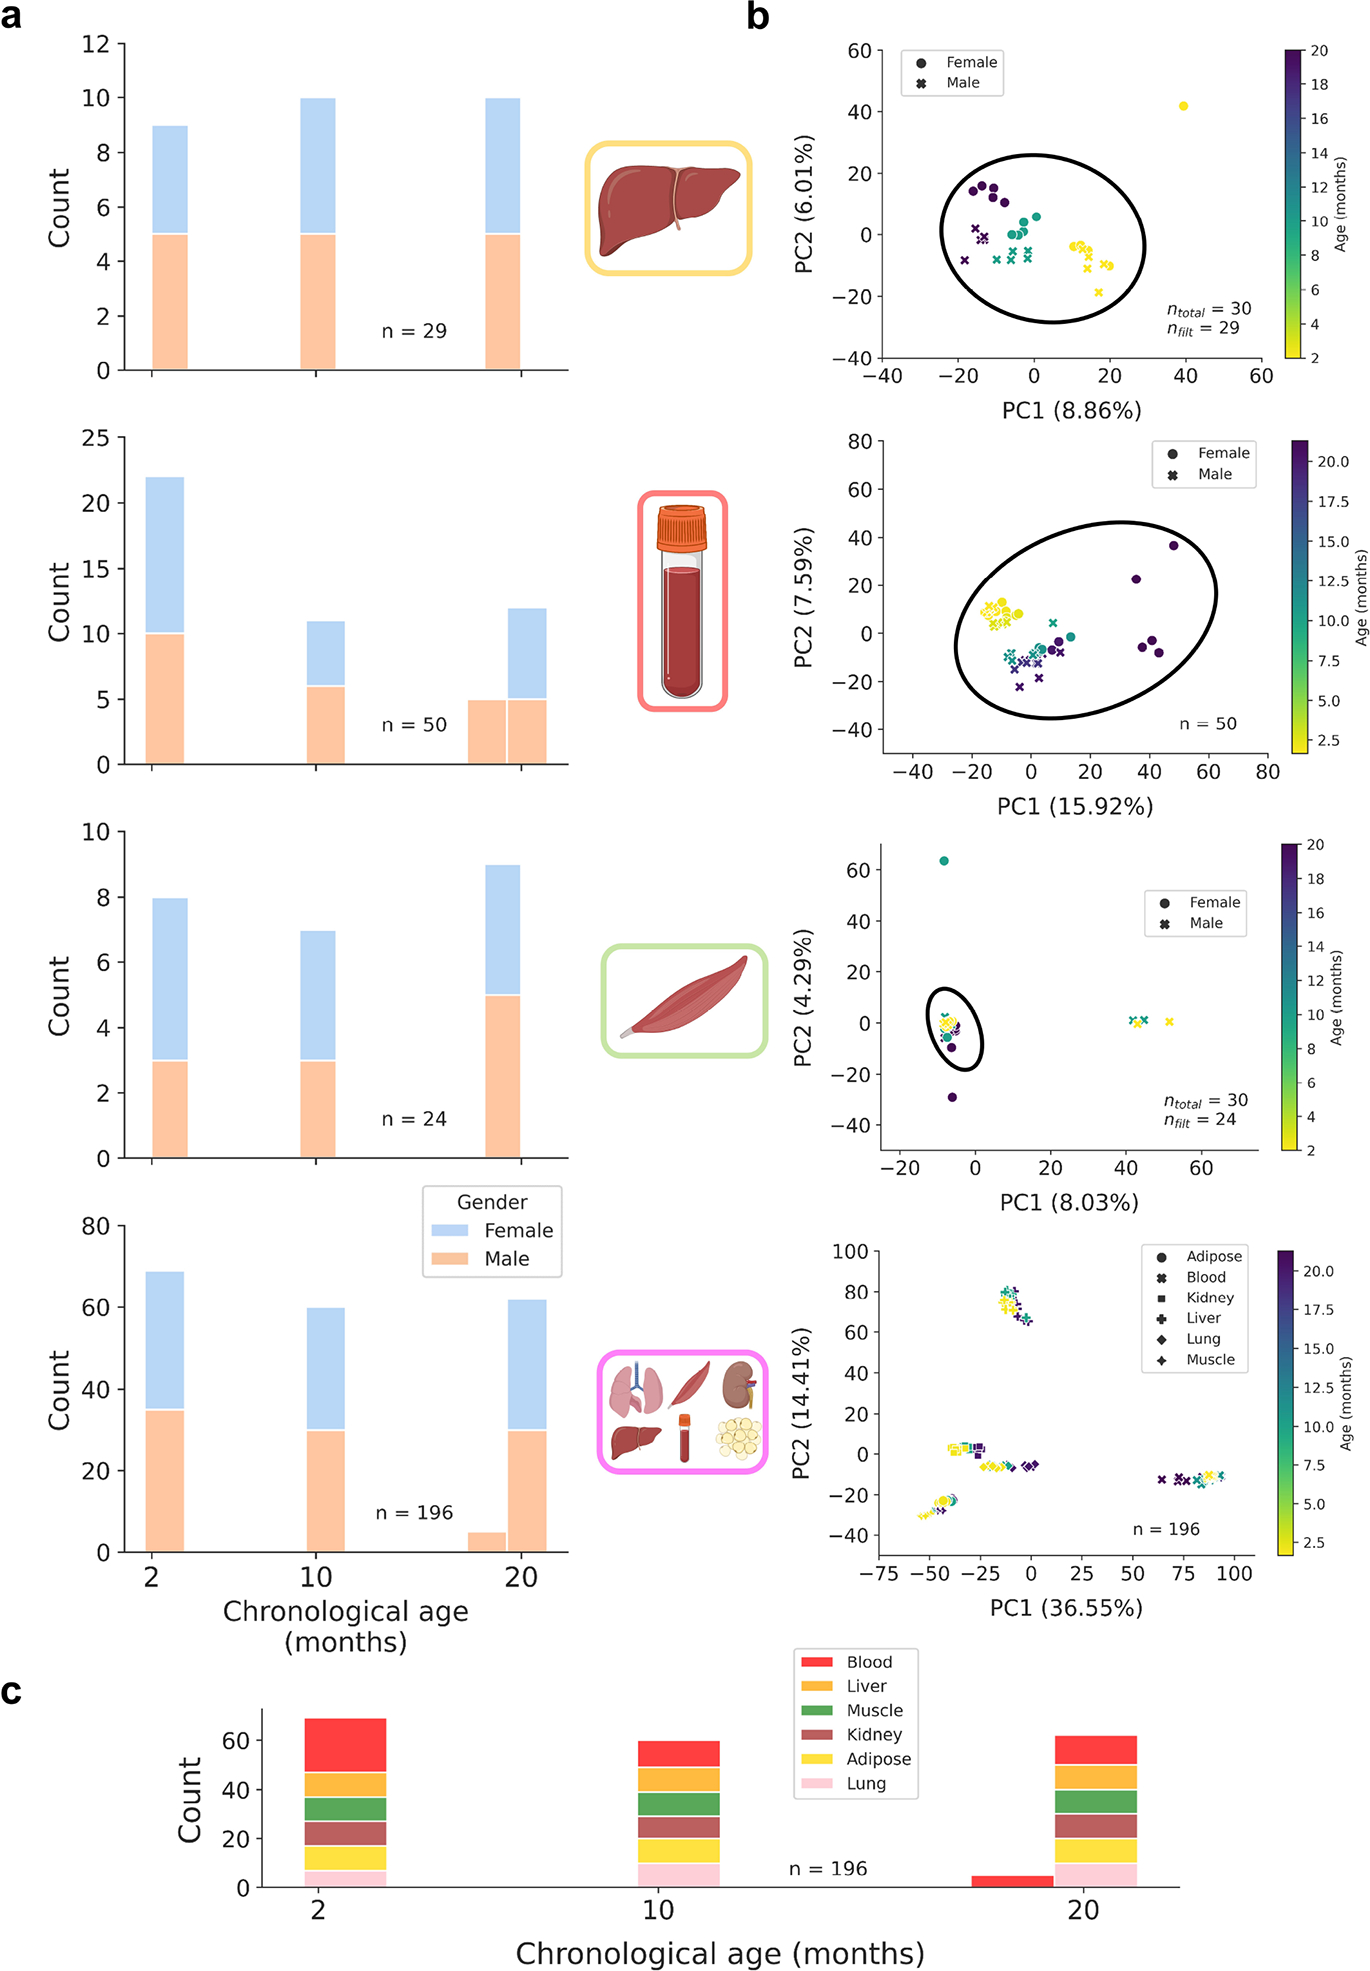
a) Age distributions for bulk training data in liver (n = 29), blood (n = 50), muscle (n = 24), and multi-tissue (n = 196) datasets, stratified by gender (female, blue; male, orange).
b) Principal component analyses (PCA) across 748,955 CpG sites in liver, blood, muscle, and multi-tissue methylation matrices. For single-tissue datasets, black circles encompass samples that were retained for linear model training to exclude outliers and improve model accuracy. The number of samples before and after filtration is shown in the bottom right of each panel. Color scales depict the age in months of the animal (from young, yellow to old, purple).
c) Age distribution in the multi-tissue dataset (n = 196), stratified by tissue type (blood, red; liver, orange; muscle, green; kidney, brown; adipose, yellow; lung, pink).
Extended Data Figure 2: Relationship between age and bulk methylation level in age-associated CpG sites in liver.
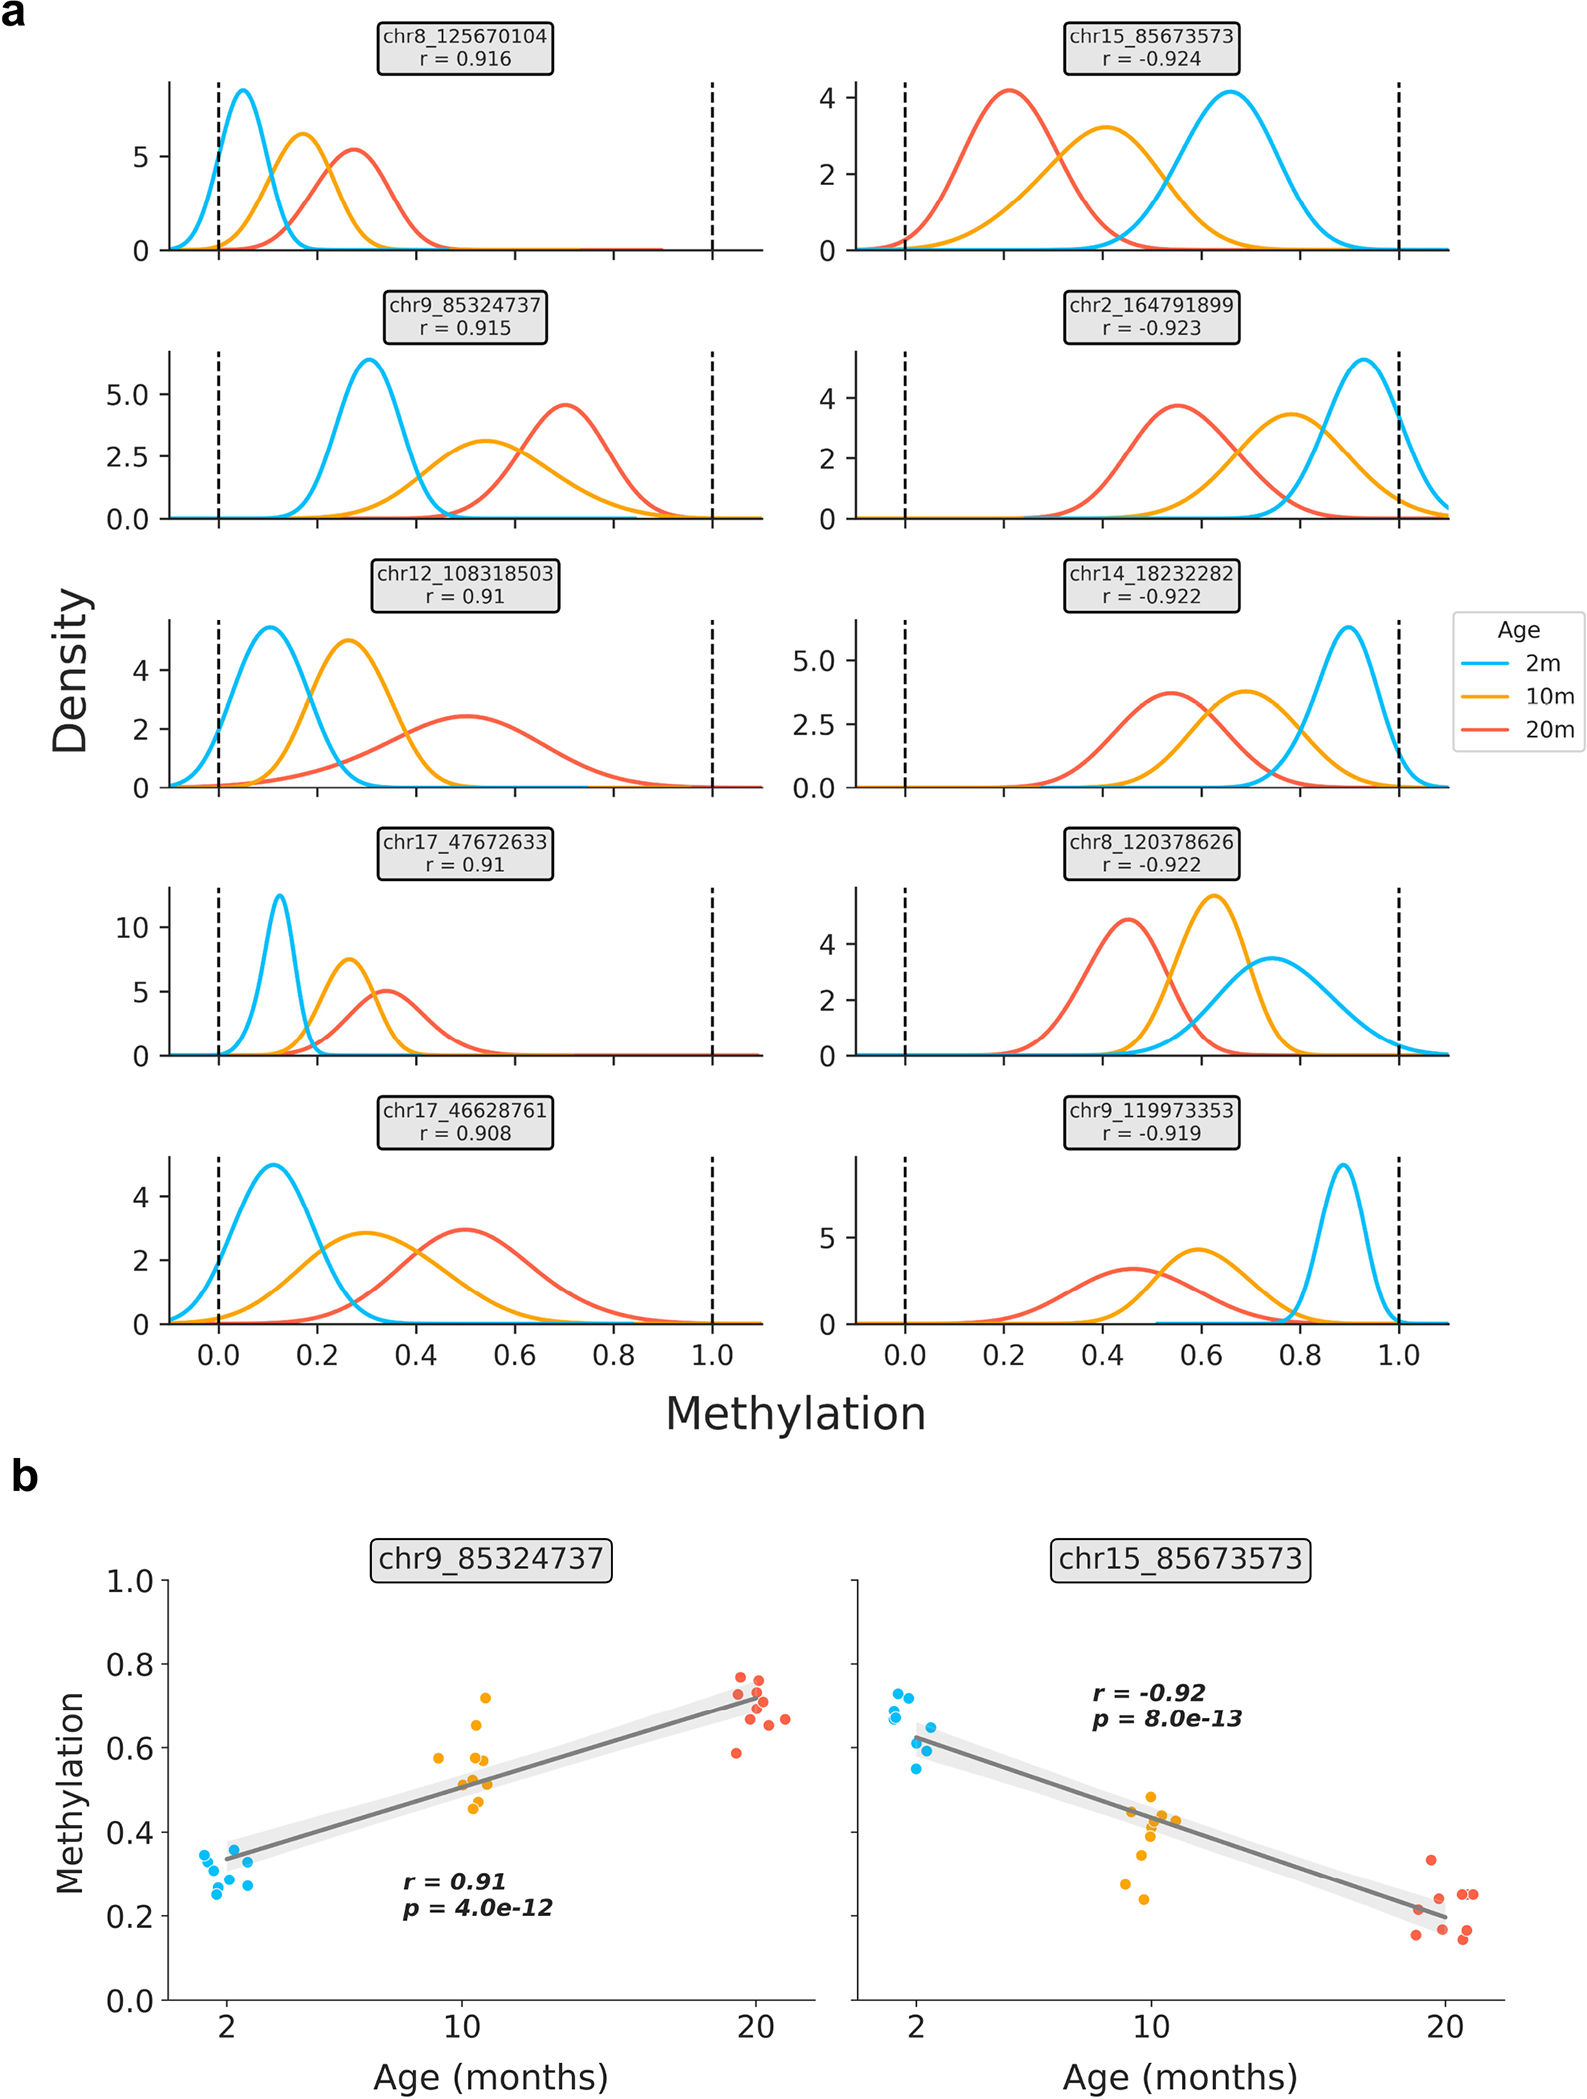
a) Kernel density estimation plots for the top 5 positively and negatively age-correlated CpG sites in the bulk liver data (based on n = 29 samples). CpG genomic positions are shown above each panel, along with the Pearson correlation coefficient (r) between methylation level and age. Colors correspond to the ages of mice (2m, blue; 10m, orange; 20m, red).
b) Representative scatterplots showing the relationship between age and methylation level in strongly positively (left) and negatively (right) age-associated CpG sites. Jitter was applied to the x-axis (age) purely for visualization purposes. Regression lines (grey) with 95% confidence intervals (light grey) are shown. Pearson correlation coefficients (r) and associated p-values (p) are shown. Two-tailed Pearson correlation analysis was employed for statistical testing, with statistics for each model treated independently without correction. Colors correspond to the ages of mice (2m, blue; 10m, orange; 20m, red).
Extended Data Figure 3: Global methylation, coverage, and scDNAm predictions in embryonic fibroblasts and hepatocytes with outliers.
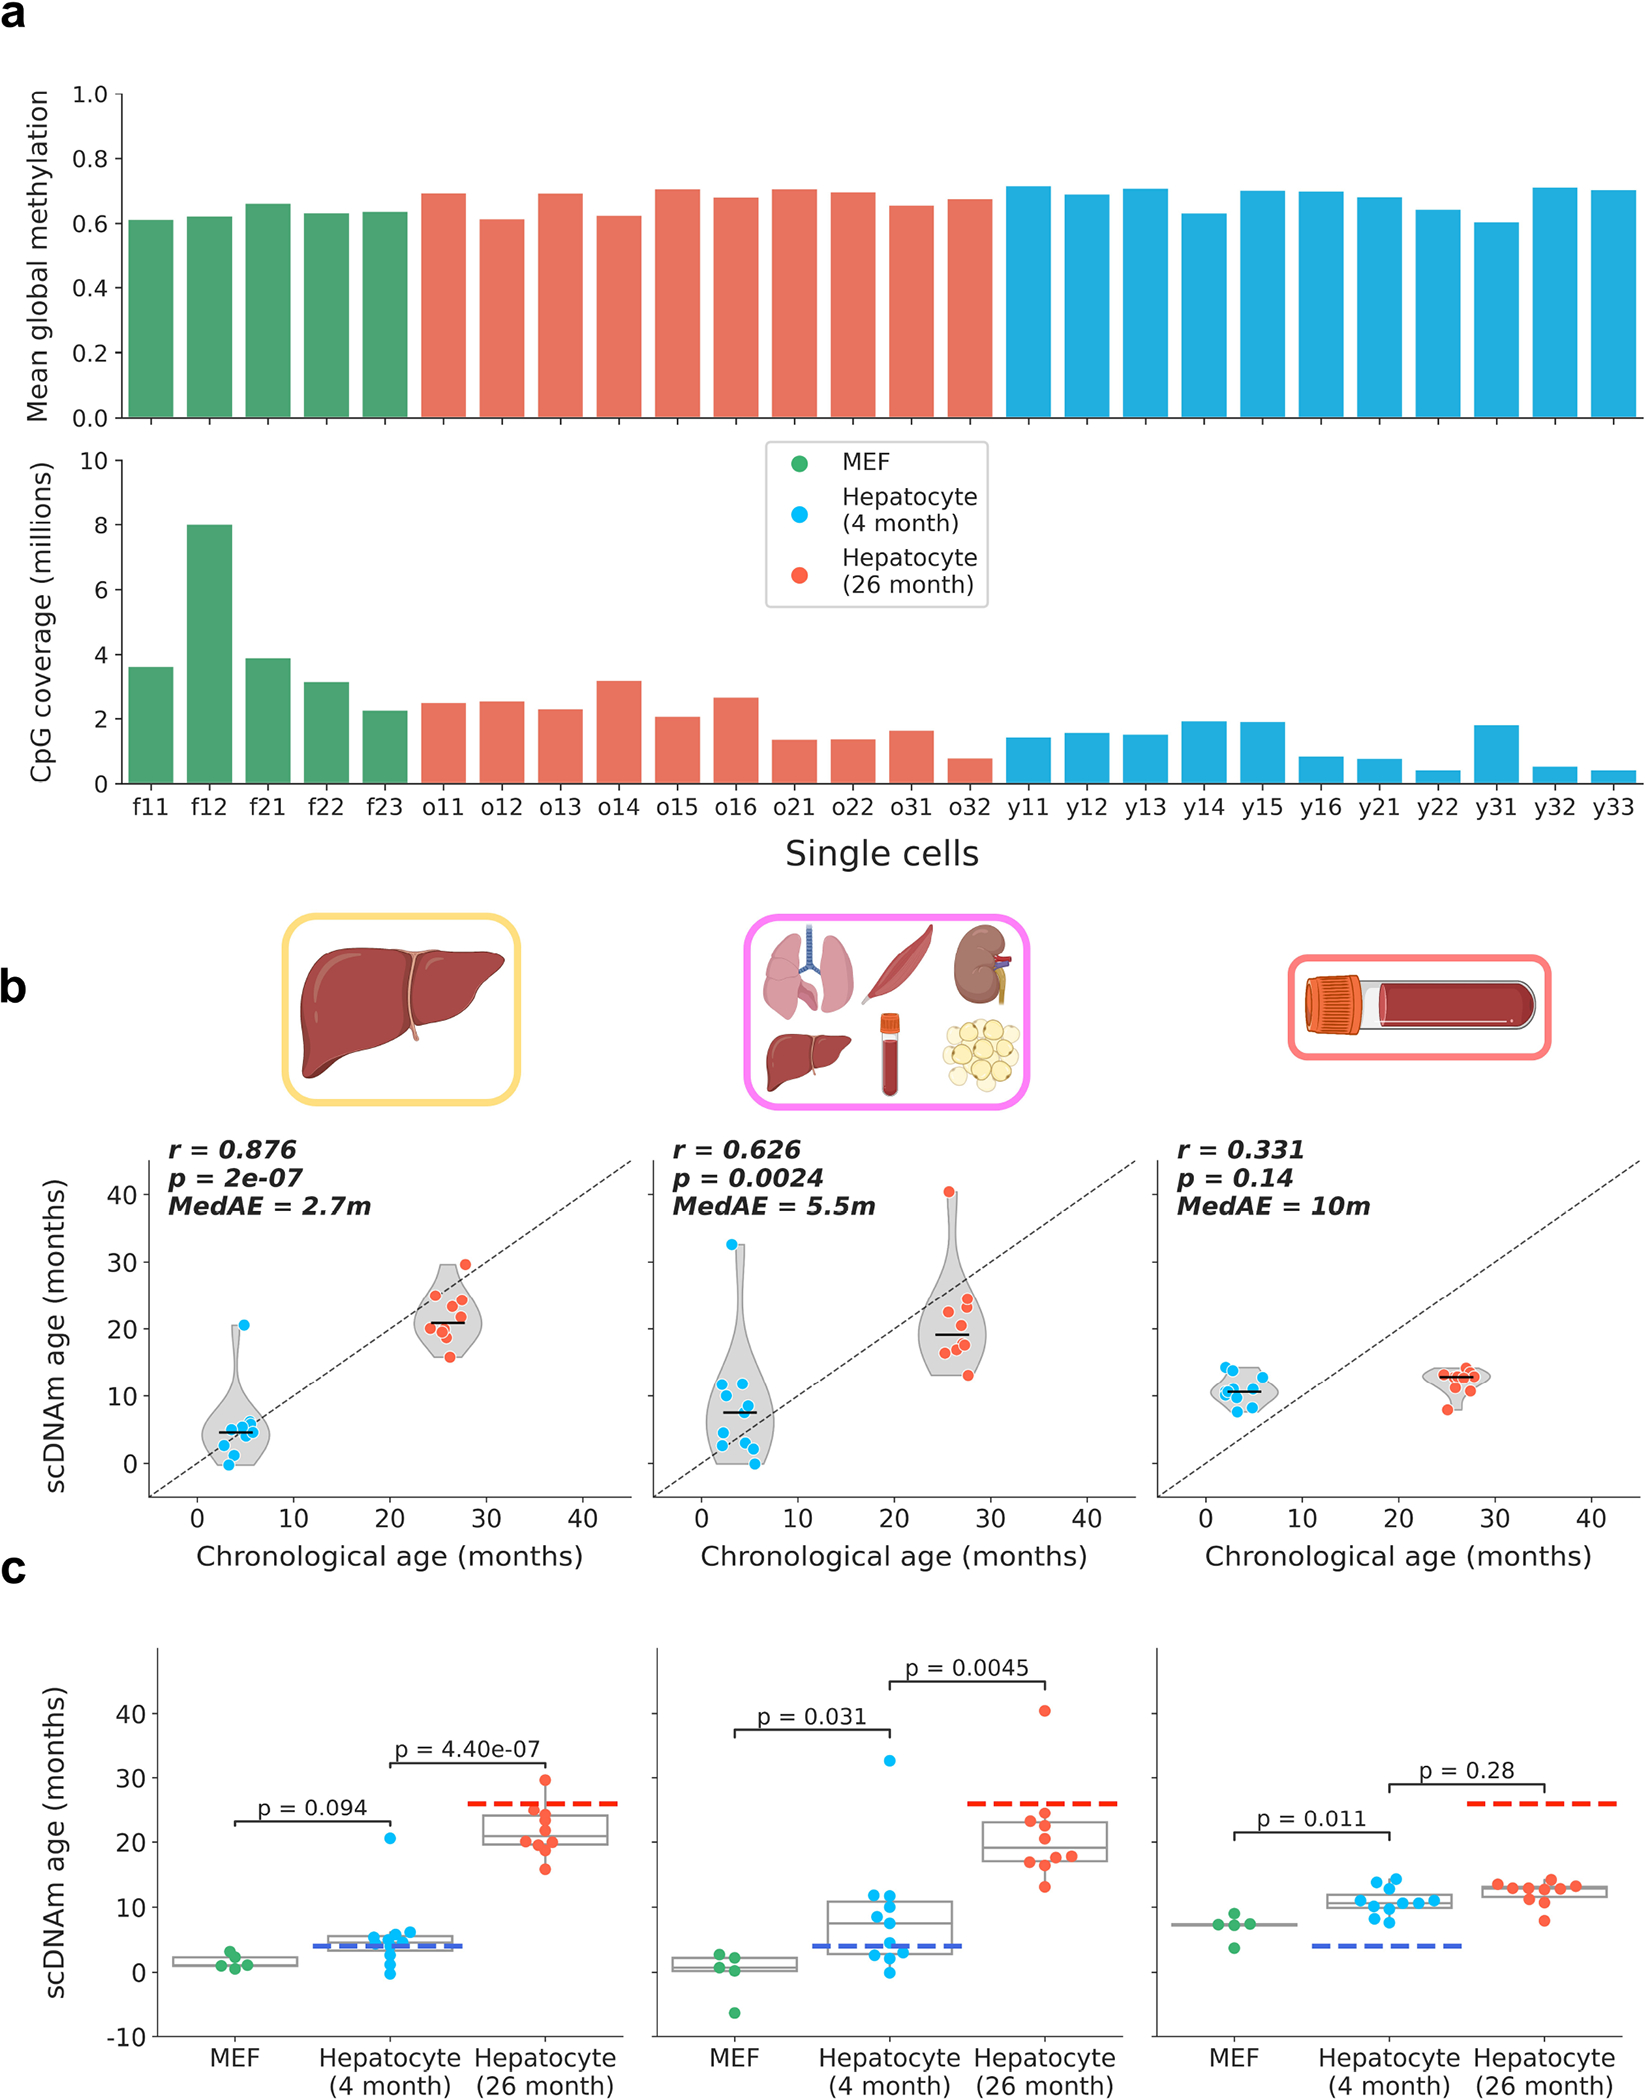
a) Bar plot of mean global methylation (top) and CpG coverage (bottom) in single mouse embryonic fibroblasts and hepatocytes. Each bar represents one cell. MEFs are shown in green, young hepatocytes in blue, and old hepatocytes in red.
b) Predicted epigenetic age versus chronological age (top) in all young hepatocytes (blue, n = 11) and old hepatocytes (red, n = 10) across liver (left), multi-tissue (middle) and blood (right) models. Jitter was applied to x-axis (chronological age) strictly for visualization purposes. Pearson correlation (r), the associated p-value (p) and the median absolute error (MedAE) are shown. Two-tailed Pearson correlation analysis was employed for statistical testing with statistics for each model treated independently without correction. Violin plots show kernel density estimation of the data, with the median displayed by a black line. Further analysis of outliers is shown in Extended Data Fig. 7. Dots depict individual cells.
c) Predicted epigenetic age, grouped by cell type, across liver (left), multi-tissue (middle) and blood (right) models for MEFs (n = 5, green), young hepatocytes (n = 11, blue), and old hepatocytes (n = 10, red). Two-tailed Welch’s t-test was used for statistical testing, and Bonferroni correction was applied to correct for multiple testing. Box plots show median levels and the first and third quartile, whiskers show up to 1.5× the interquartile range. Dots depict individual cells.
Extended Data Figure 4: Likelihood distributions in young and old hepatocytes.
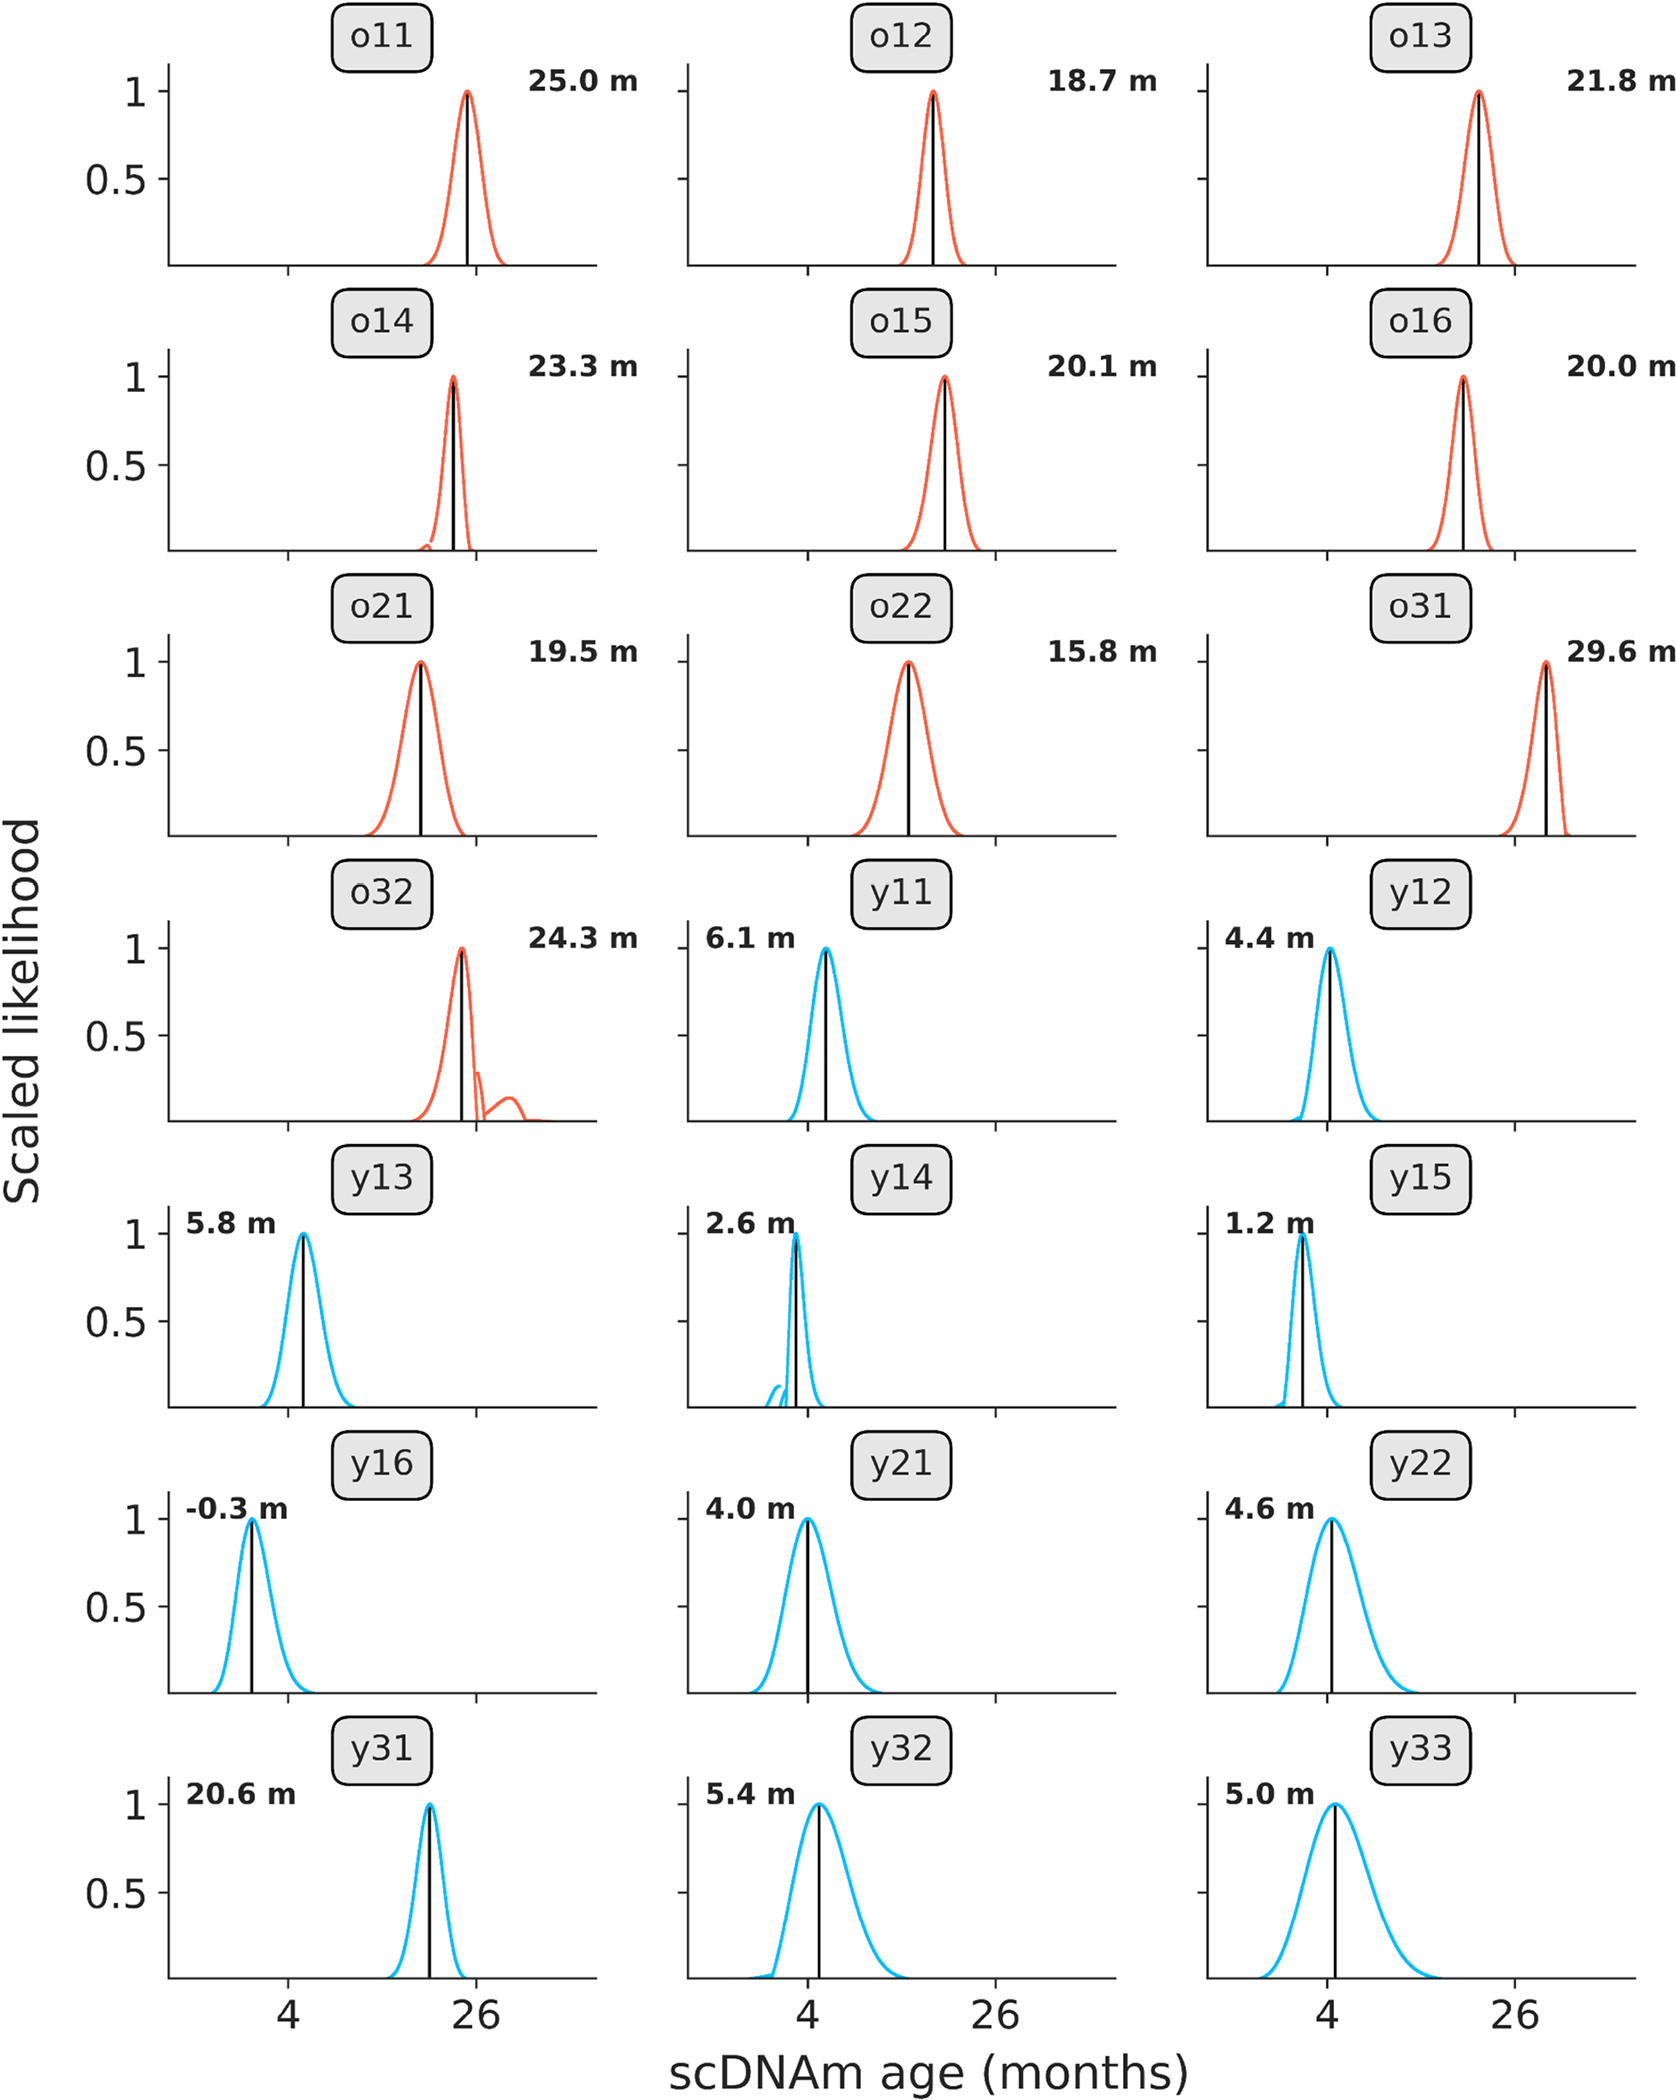
Likelihood distributions for all young (blue, n = 11) and old (red, n = 10) hepatocytes, based on scDNAm results from the liver model sampling the top 1% age-associated CpGs per cell. Black lines indicate age of maximum likelihood (predicted epigenetic age), which is depicted numerically in the right or left corners of each panel. Labels indicate cell identifier, as given in the study metadata on the SRA. Likelihood was calculated by taking the exponential of the log-likelihood profiles, which was subsequently scaled between 0 and 1 to normalize distributions between cells.
Extended Data Figure 5: Outlier analysis and lack of relationship between scDNAm age and technical covariates in hepatocytes and fibroblasts.
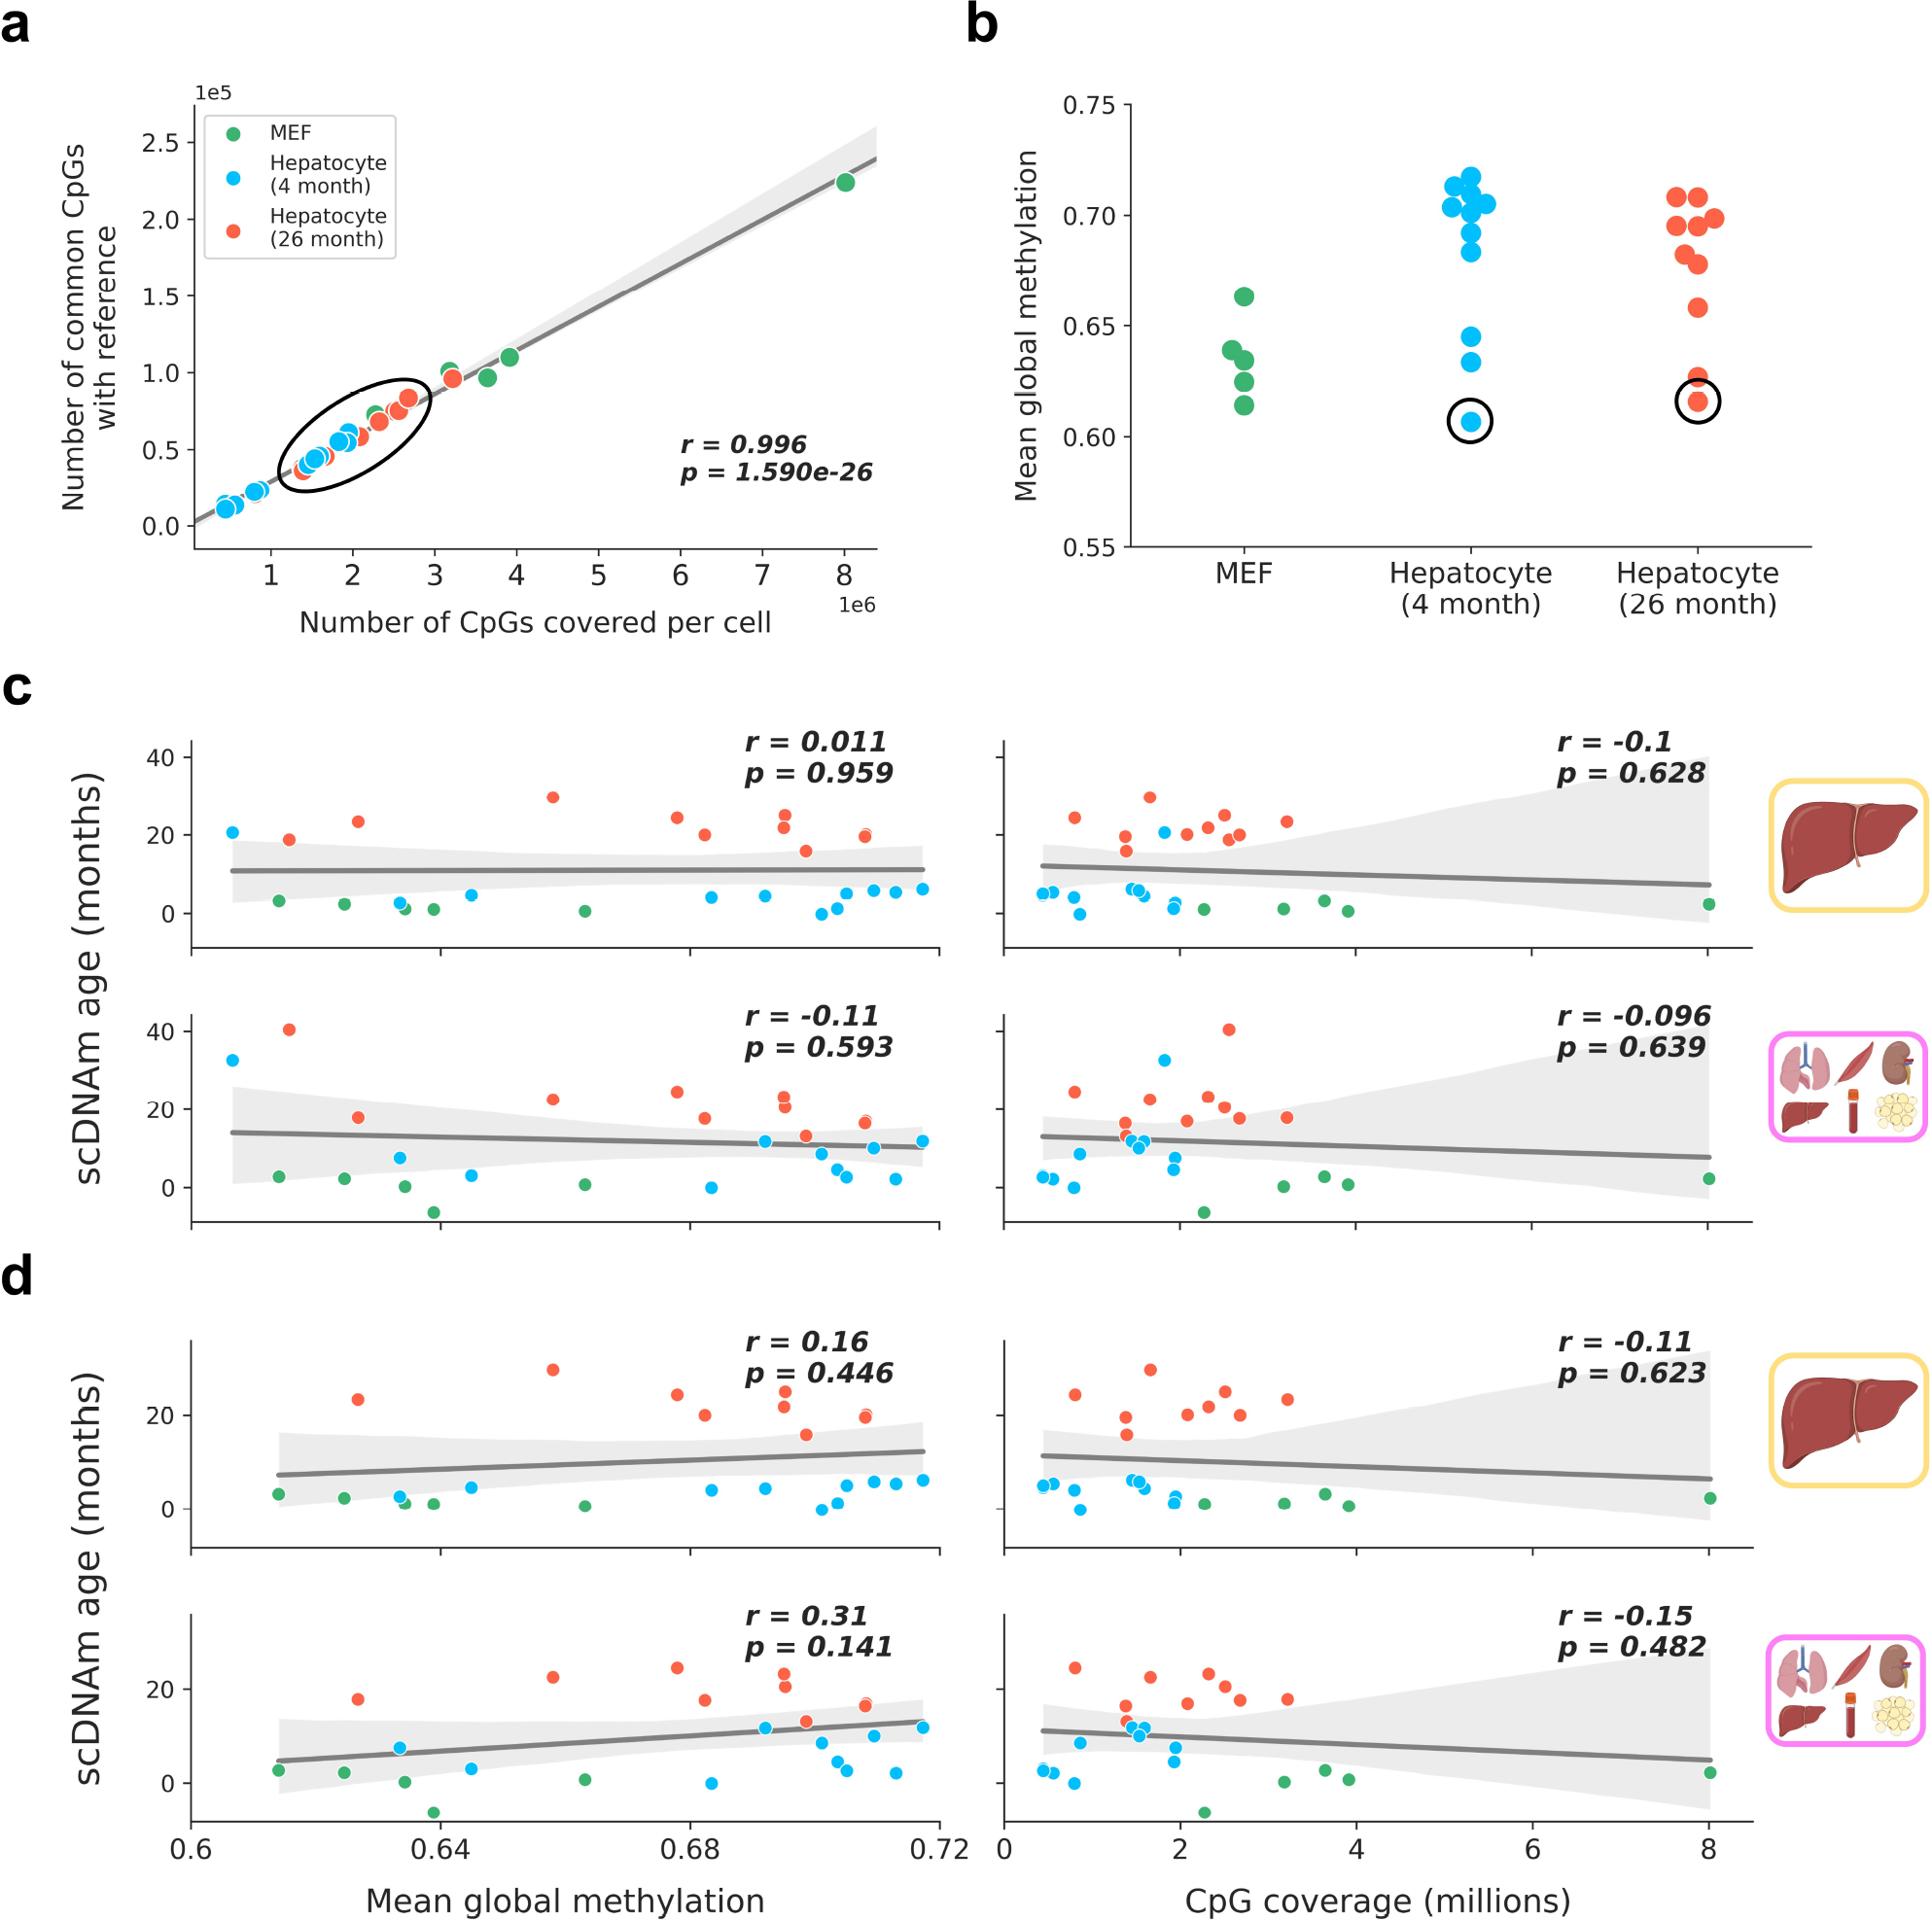
a) Scatterplot depicting the strongly linear relationship between CpG coverage in a single cell (x-axis) and the number of CpGs intersecting with the liver training dataset (y-axis) for embryonic fibroblasts (green, n = 5), young hepatocytes (blue, n = 11) and old hepatocytes (red, n = 10). Regression line (grey) is shown with a 95% confidence interval (light grey). Outlier samples based on scDNAm predictions and PCA analysis in the original study are within the black circle, highlighting these cells are not outliers in regard to CpG coverage. Pearson correlation coefficient (r) and the associated two-tailed p-value (p) are shown.
b) Mean global methylation of embryonic fibroblasts (green, n = 5), young (blue, n = 11) and old hepatocytes (red, n = 10). Outlier samples detected during dimensionality reduction and age predictions are circled in black.
c, d) Scatterplots depicting the relationship of mean global methylation (left) and CpG coverage (right) with predicted epigenetic age (scDNAm age) for single embryonic fibroblasts (n = 5, green) and hepatocytes (young, n = 11, blue; old, n = 10, red) across liver and multi-tissue datasets with the two outliers included (c) and with the two outliers excluded (d). Regression lines (grey) are shown with a 95% confidence interval (light grey). Two-tailed Pearson correlation analysis was used for statistical testing, with each analysis treated independently without correction. Pearson correlation coefficients (r) and associated two-tailed p-values (p) are shown. No significant relationship is observed in any comparison. The legend in panel (a) applies to all of the panels in this figure.
Extended Data Figure 6: Pearson correlation distributions and predicted ages in single cells based on various CpG selection parameters.
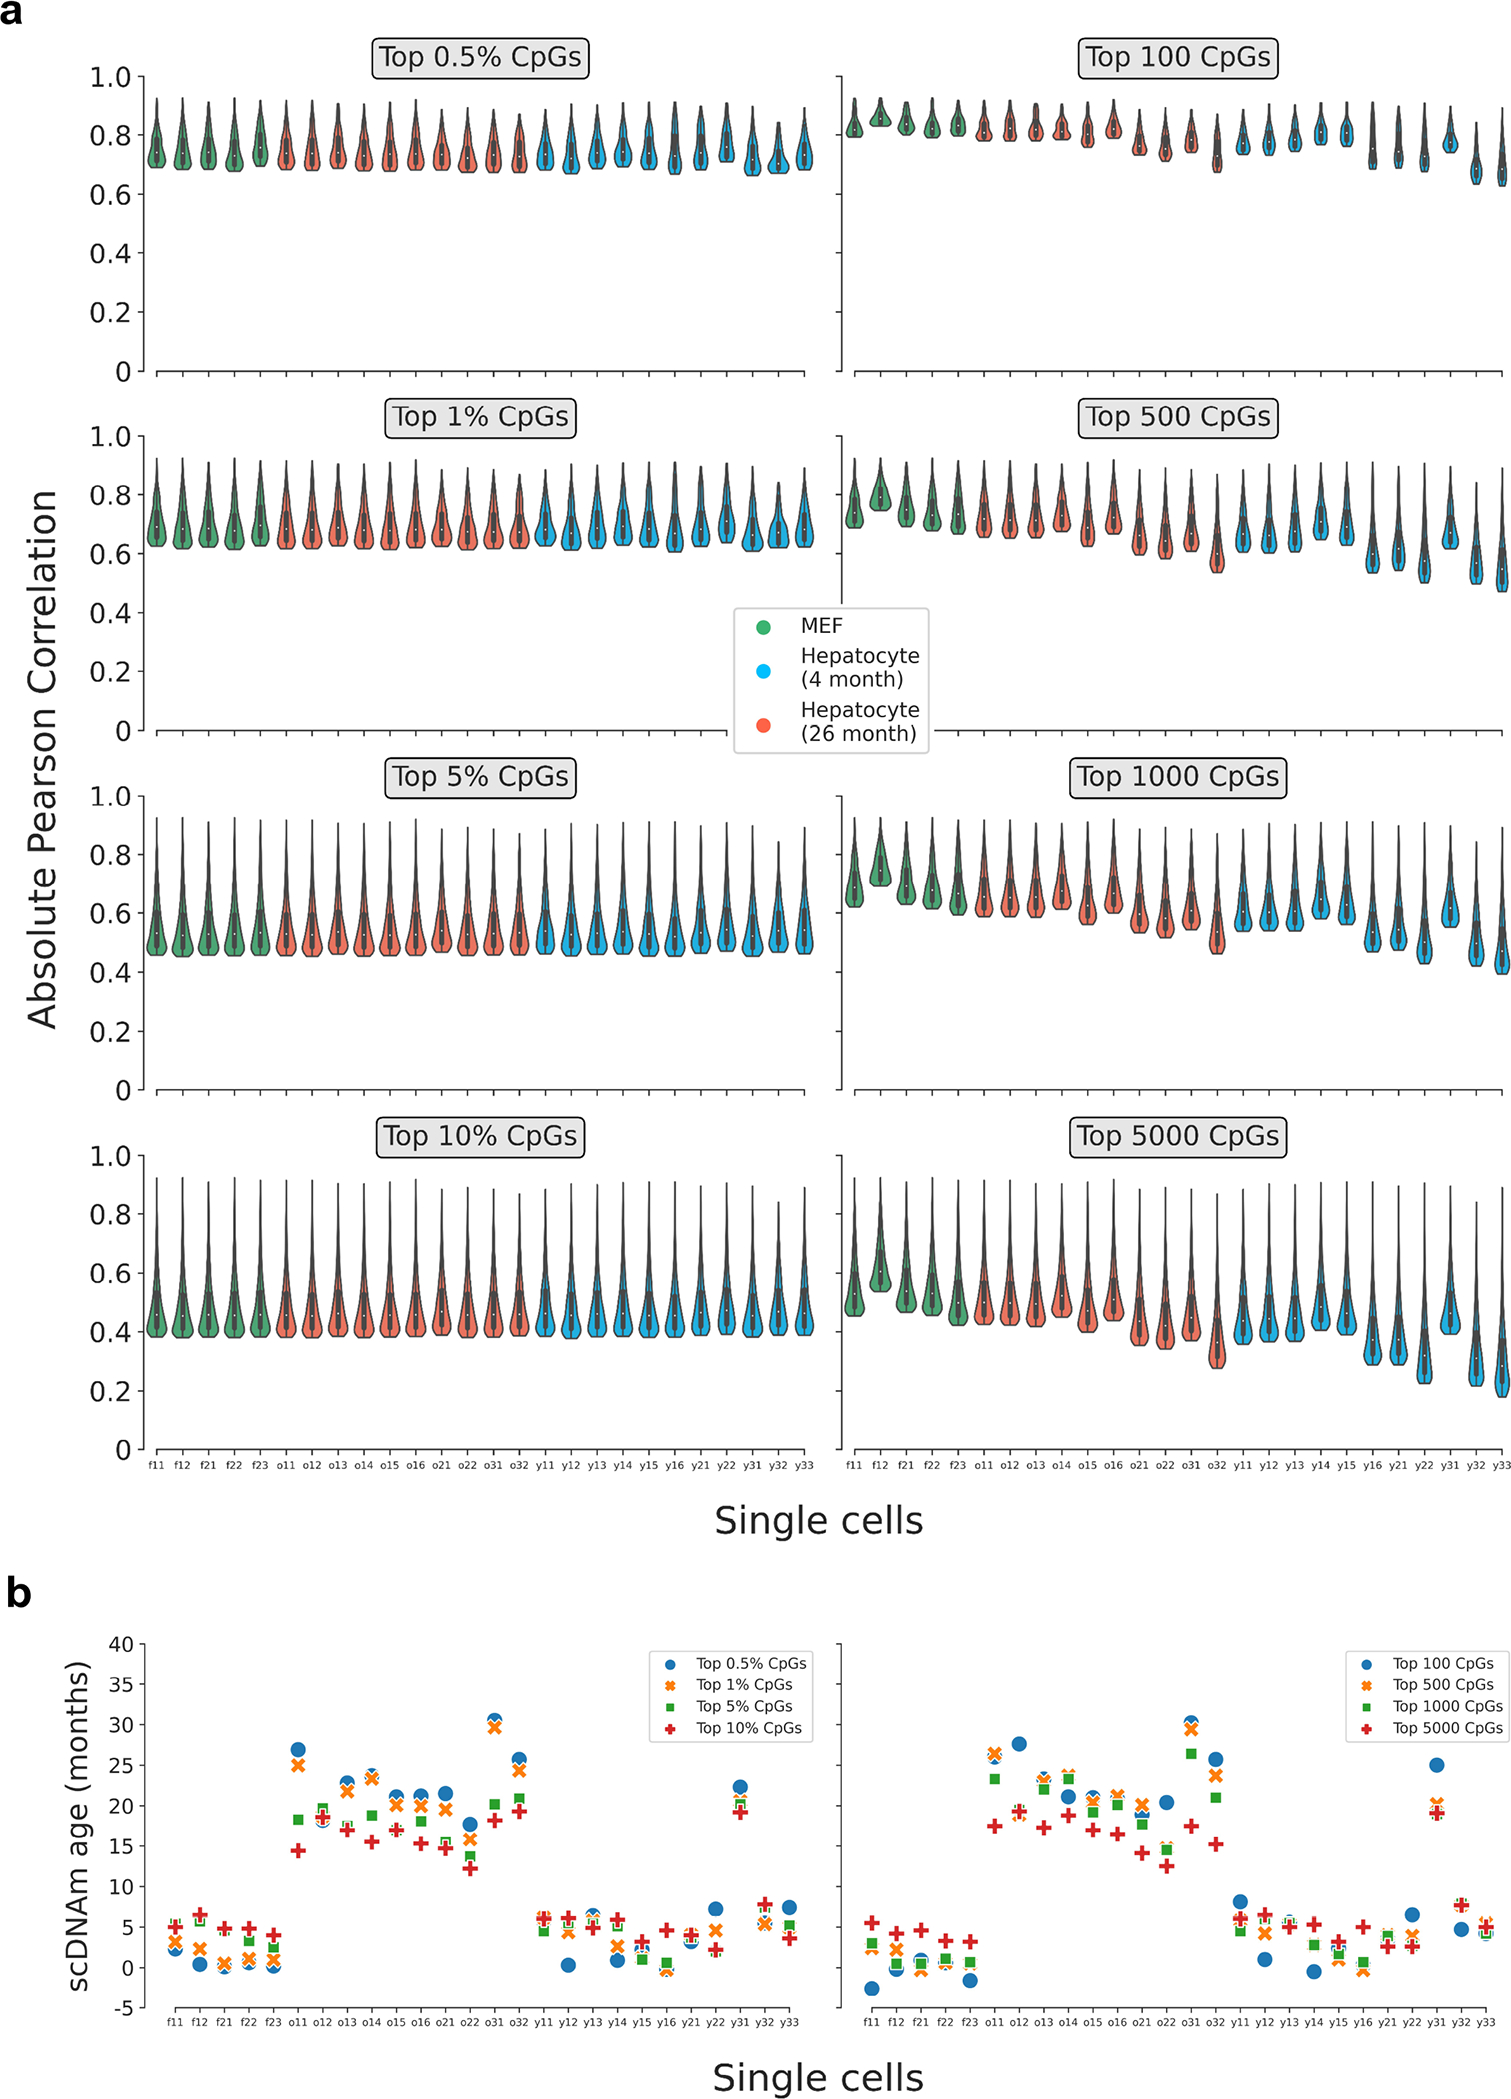
a) Violin plots depicting the distribution of the Pearson correlation coefficient of scAge-chosen CpGs in embryonic fibroblasts (n = 5, green) and hepatocytes (young, n = 11, blue; old, n = 10, red) based on the selection method. On the left, a percentile-based method is employed, whereby the top x% absolute age-associated CpGs are chosen in every cell. On the right, a defined number of CpGs is chosen across every cell, leading to more uneven distributions due to differential cell CpG coverage. Various parameters for both methods (grey boxes) and their effects on the distributions are shown. Violin plots depict kernel density estimations of the data. Inner boxplots depict median levels (white dot) and first and third quartiles, with whiskers extending up to 1.5× the interquartile range. The central legend applies to all subpanels in this panel.
b) Predicted epigenetic ages using the liver model for all embryonic fibroblasts (n = 5) and hepatocytes (young, n = 11; old, n = 10), based on the selection method (left, percentile; right, defined number of CpGs) and parameter. Colors depict the % or number of CpGs chosen for scAge computations (top 0.5% or 100 CpGs, blue; top 1% or 500 CpGs, orange; top 5% or 1,000 CpGs, green; top 10% or 5,000 CpGs, red).
Extended Data Figure 7: Single-cell epigenetic age predictions differ based on selection mode and training dataset.
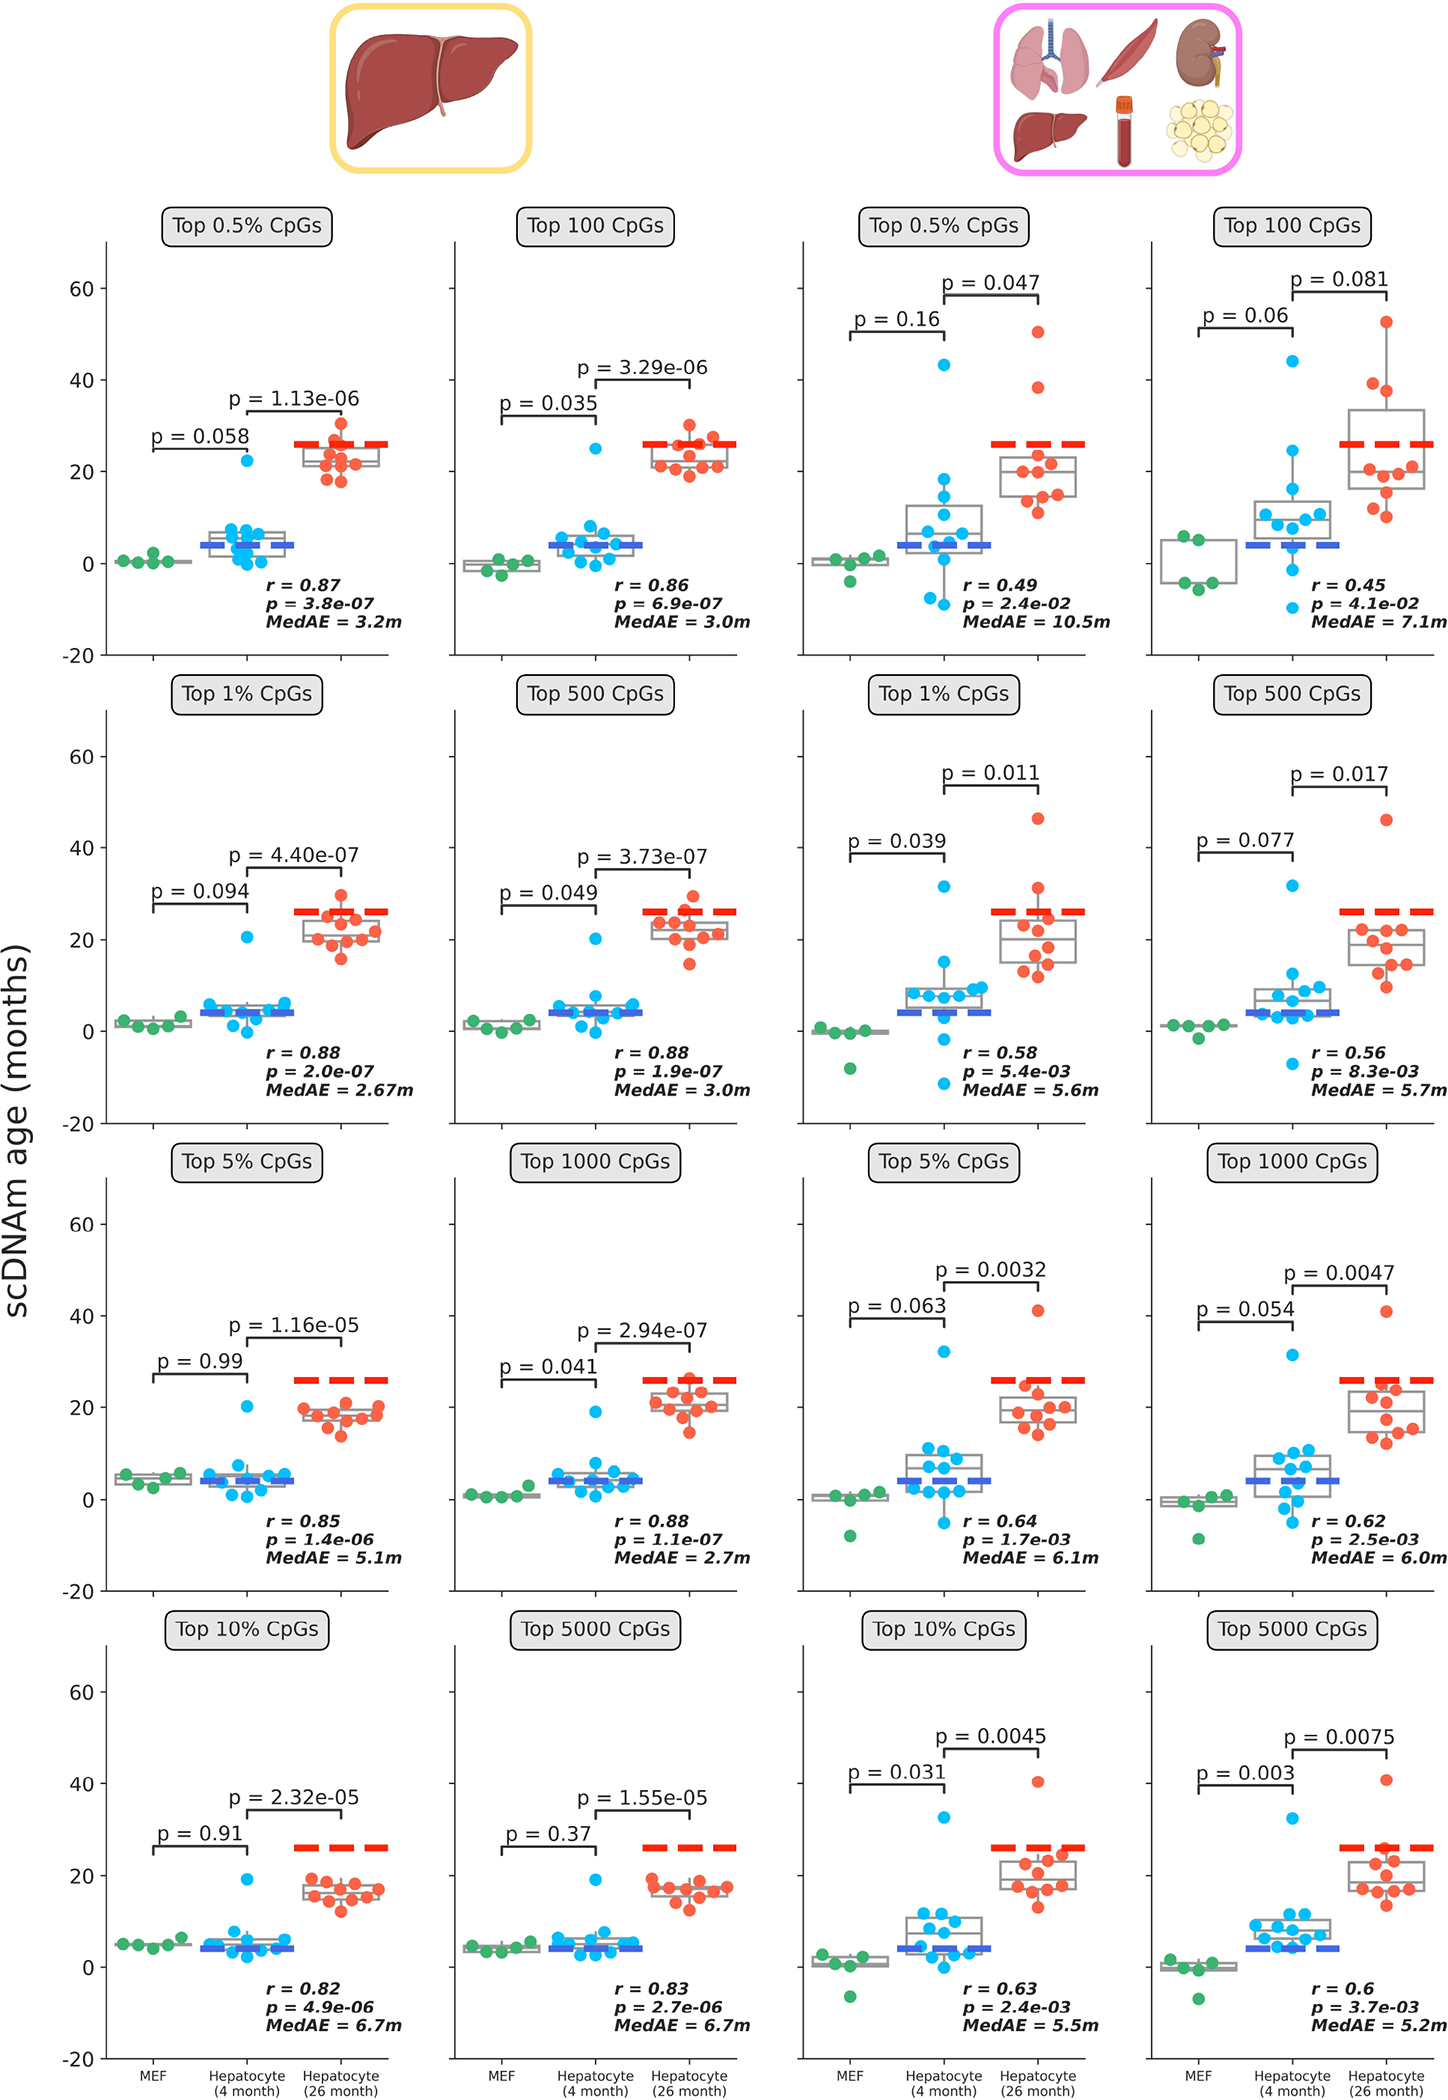
Predicted epigenetic ages in all embryonic fibroblasts (green, n = 5), young hepatocytes (blue, n = 11) and old hepatocytes (red, n = 10) using the liver model (left two columns) and multi-tissue models (right two columns) across different CpG selection modes and parameters. Parameters are labeled in grey boxes above the plots. Bonferroni corrections were applied to account for multiple testing. Pearson correlation (r), its associated p-value (p), and the median absolute error (MedAE) are shown for each panel. Two-tailed Pearson correlation analysis was employed for statistical testing. Dashed lines represent the chronological age of animals from which hepatocytes were obtained (4-months-old, dark blue; 26-months-old, dark red). Boxplots depict median levels and the first/third quartile, with whiskers extending up to 1.5× the interquartile range. Individual cells are depicted as points.
Extended Data Figure 8: Distribution of Pearson correlation coefficients and linear association metrics across training datasets.
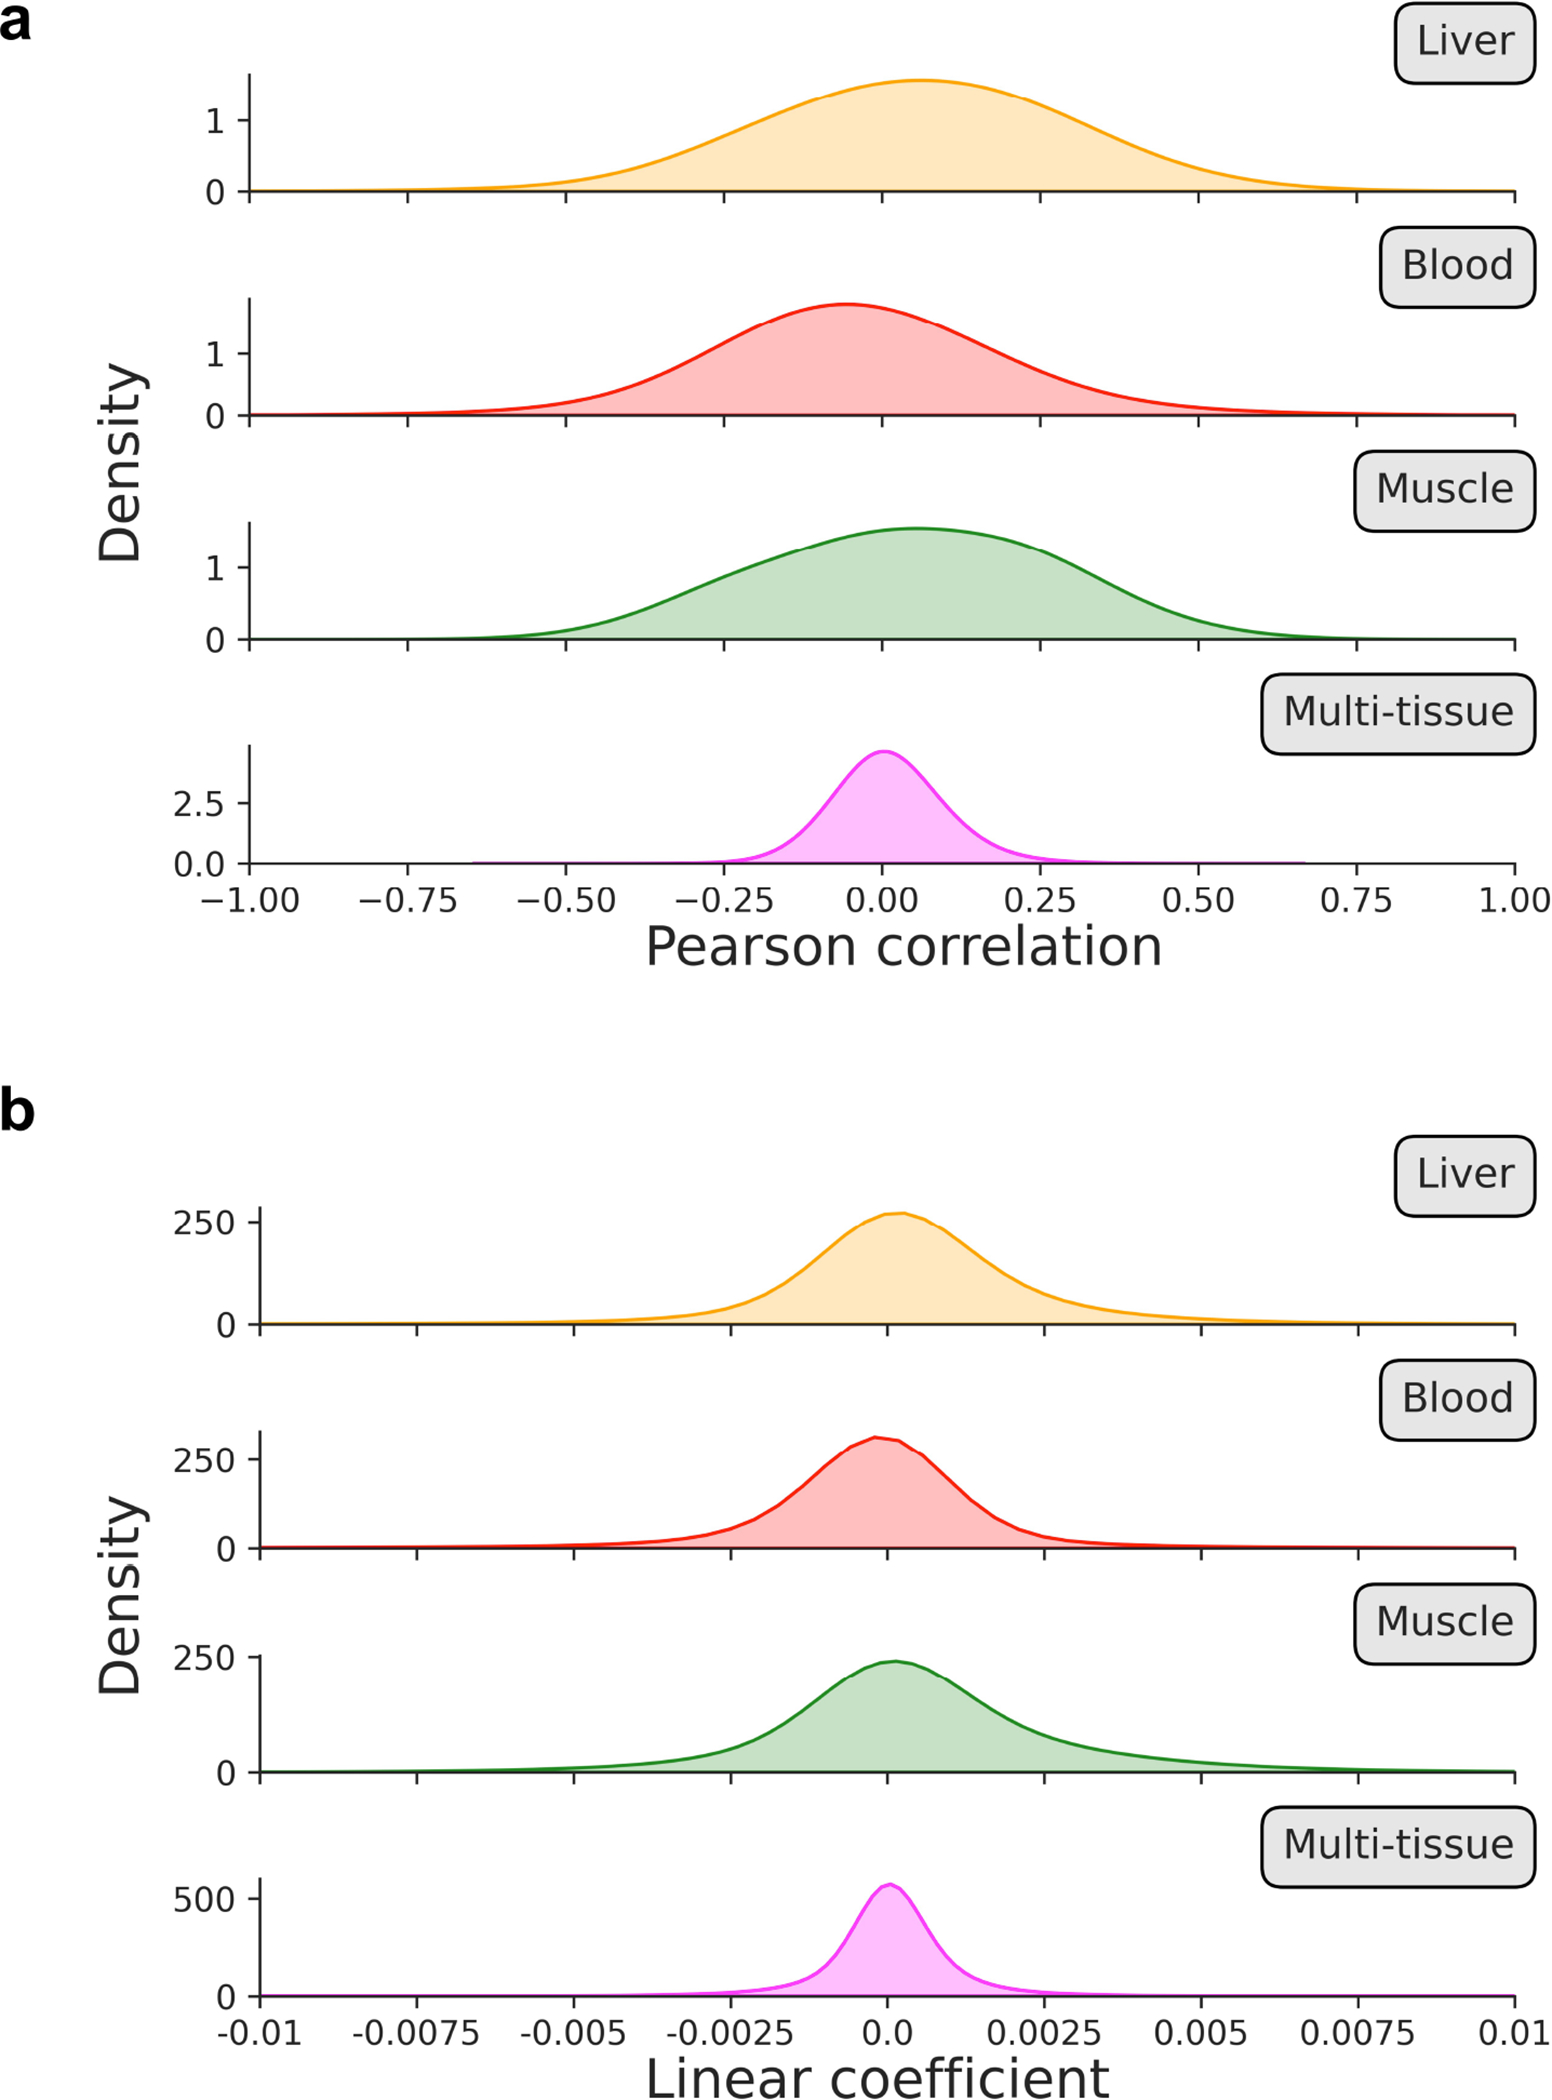
a, b) Kernel density estimation plots for (a) Pearson correlation coefficients and (b) linear regression coefficients in processed training reference data for liver (orange), blood (red), muscle (green), and multi-tissue (magenta) datasets. Individual distributions are labeled on the upper right side to indicate which tissue is depicted.
Extended Data Figure 9: Single-cell coverage distributions and the effect of coverage on scAge predictions.
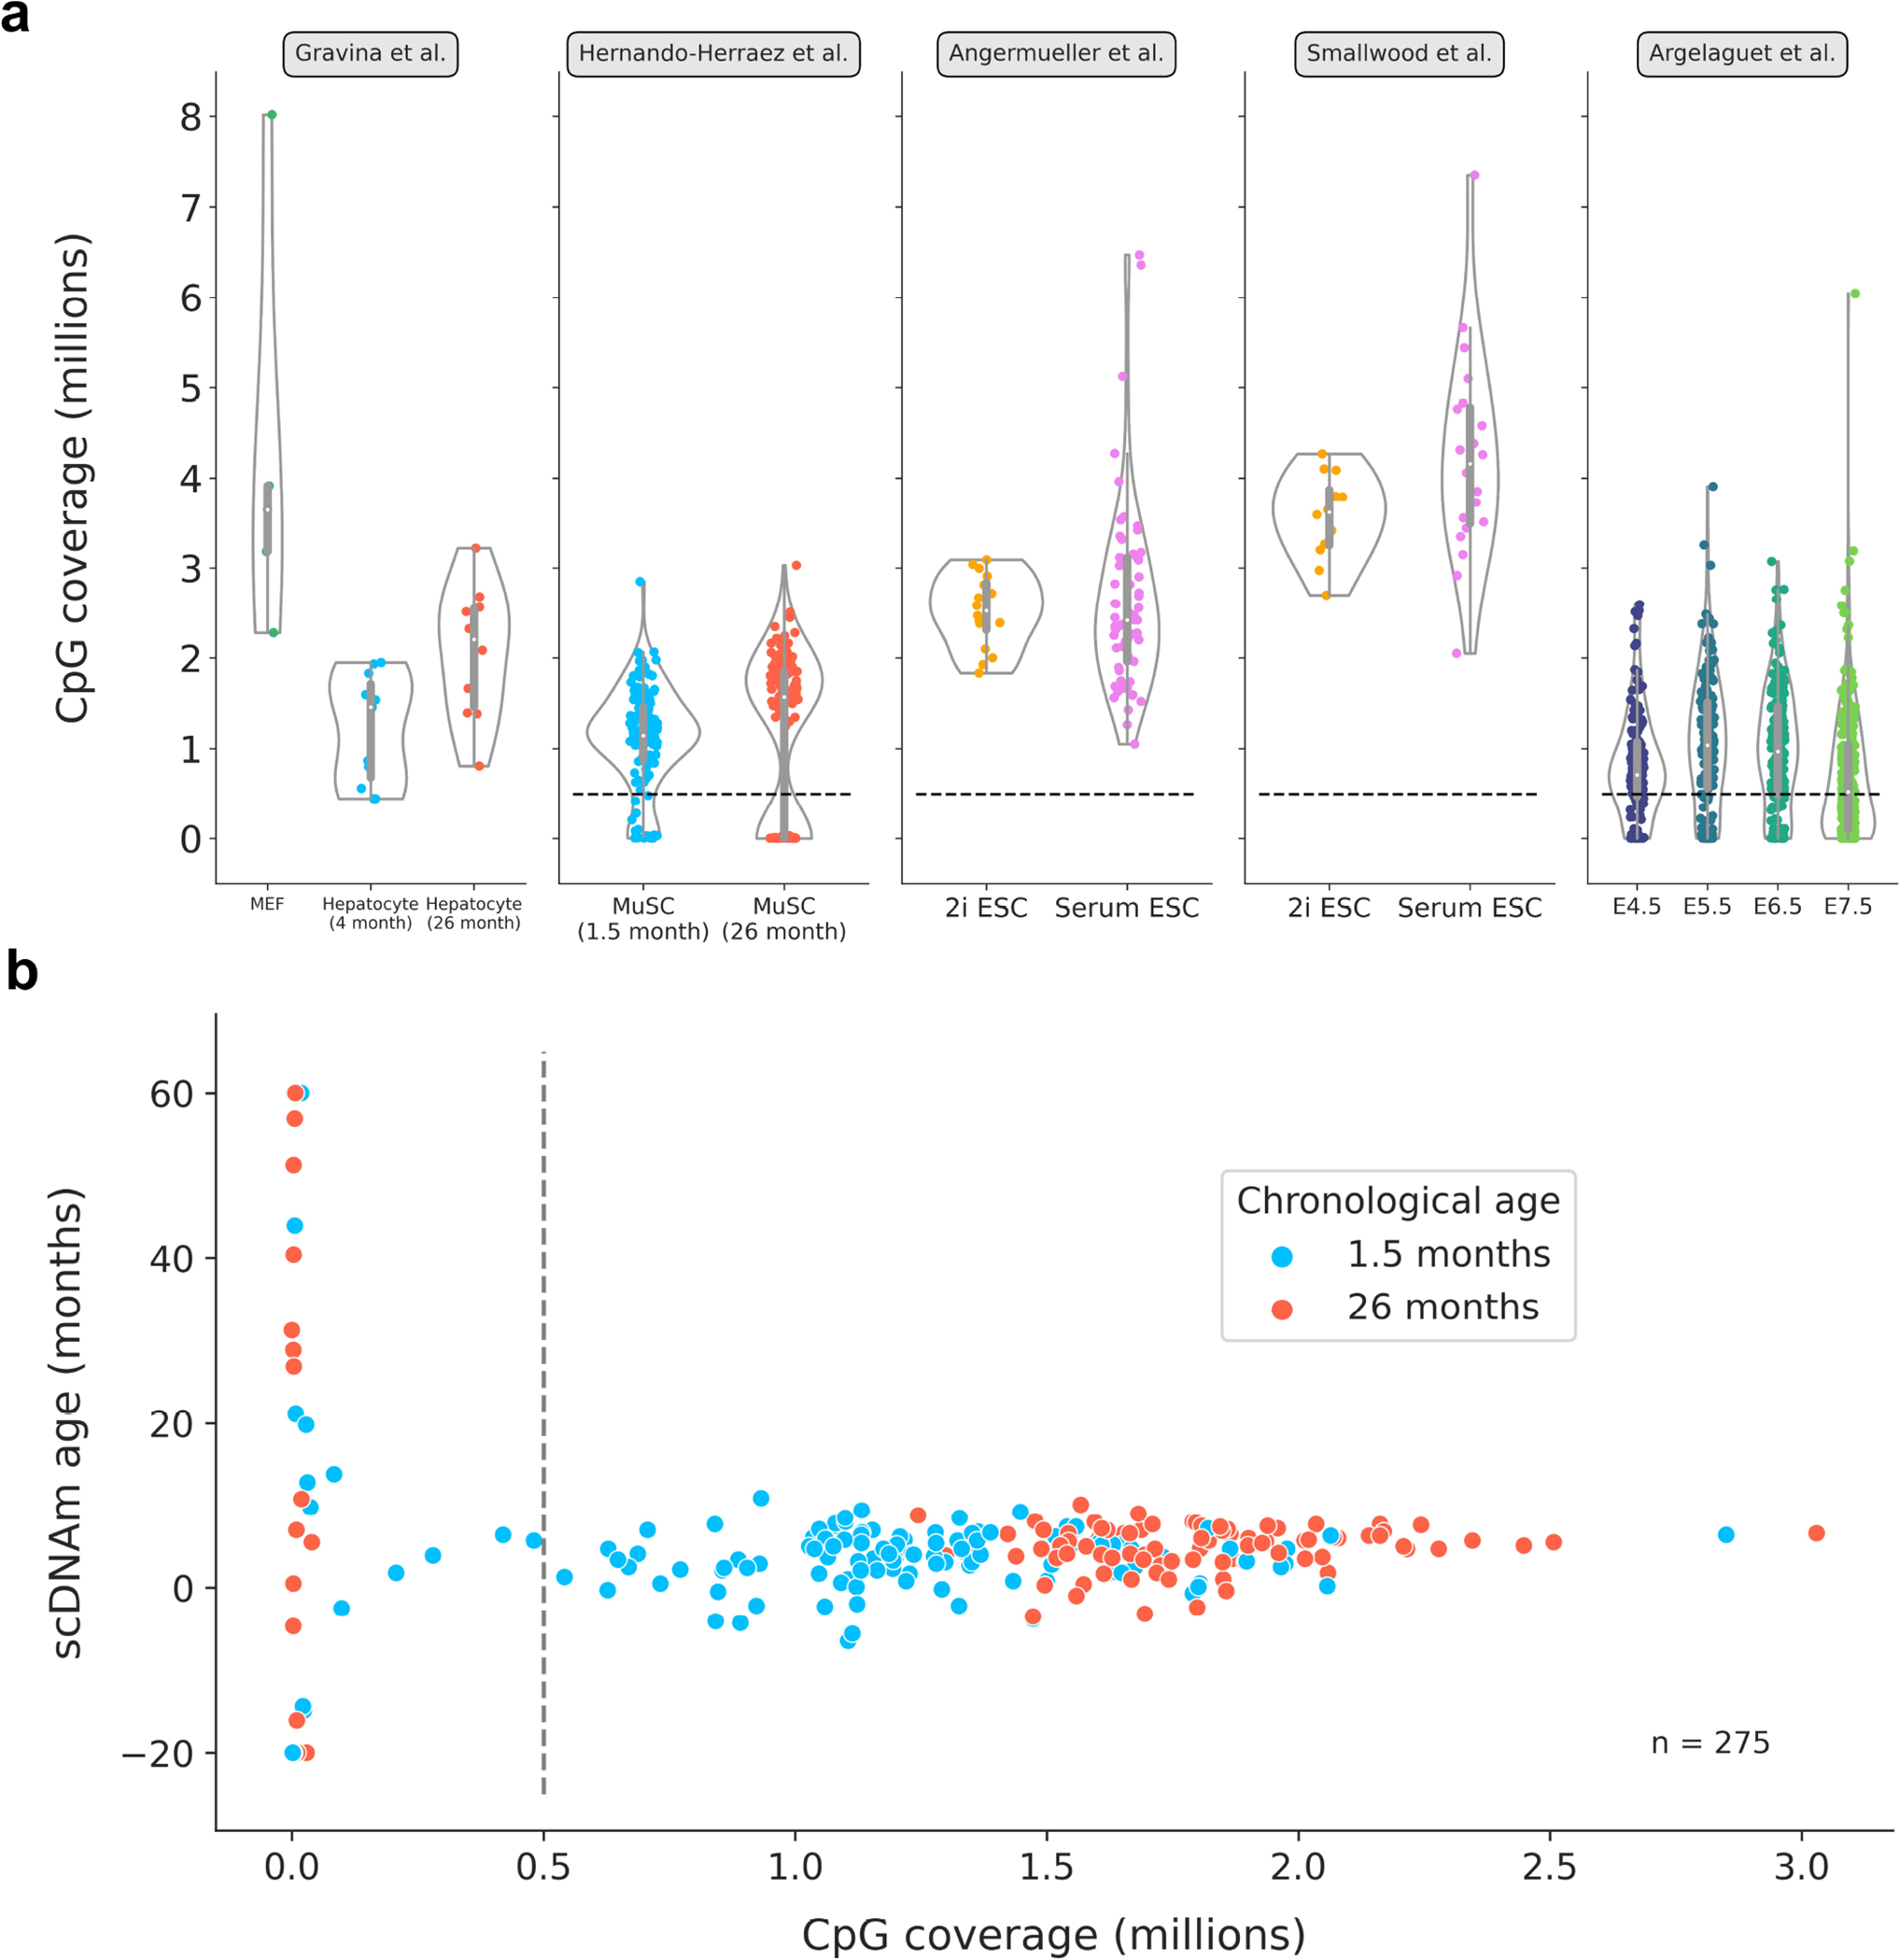
a) Distributions of single-cell CpG coverage across all 5 datasets analyzed in this study. Dotted lines represent the cutoff value that was used for downstream analysis (at least 500,000 CpGs per cell), in line with previous work38. Given the low sample size and relatively high coverage, no filtration was applied to cells from the Gravina et al. study23. The number of cells passing the filtration cutoff in each dataset is further detailed in Supplementary Table 1. Violin plots depict the kernel density estimation of the data. Inner boxplots depict the median (white dot), as well as the first/third quartile (grey box), with whiskers extending up to 1.5× the interquartile range. Individual dots depict single cells. Colors align with those presented in main figures (Gravina et al: MEFs in green; young hepatocytes in blue; old hepatocytes in red; Hernando-Herraez et al: young MuSCs in blue, old MuSCs in red; Angermueller et al and Smallwood et al: 2i ESCs in yellow, serum ESCs in pink; Argelaguet et al: E4.5 cells in purple, E5.5 cells in dark blue, E6.5 cells in dark green, E7.5 cells in light green).
b) Scatterplot depicting the relationship between CpG coverage and predicted epigenetic ages in all unfiltered muscle stem cells38 (n = 275). Dotted black line represents the cutoff of 500,000 CpGs per cell, after which predictions greatly stabilize. MuSCs from young animals are shown in blue, and those from old animals are shown in red.
Extended Data Figure 10: Single-cell profile simulations and epigenetic age predictions.
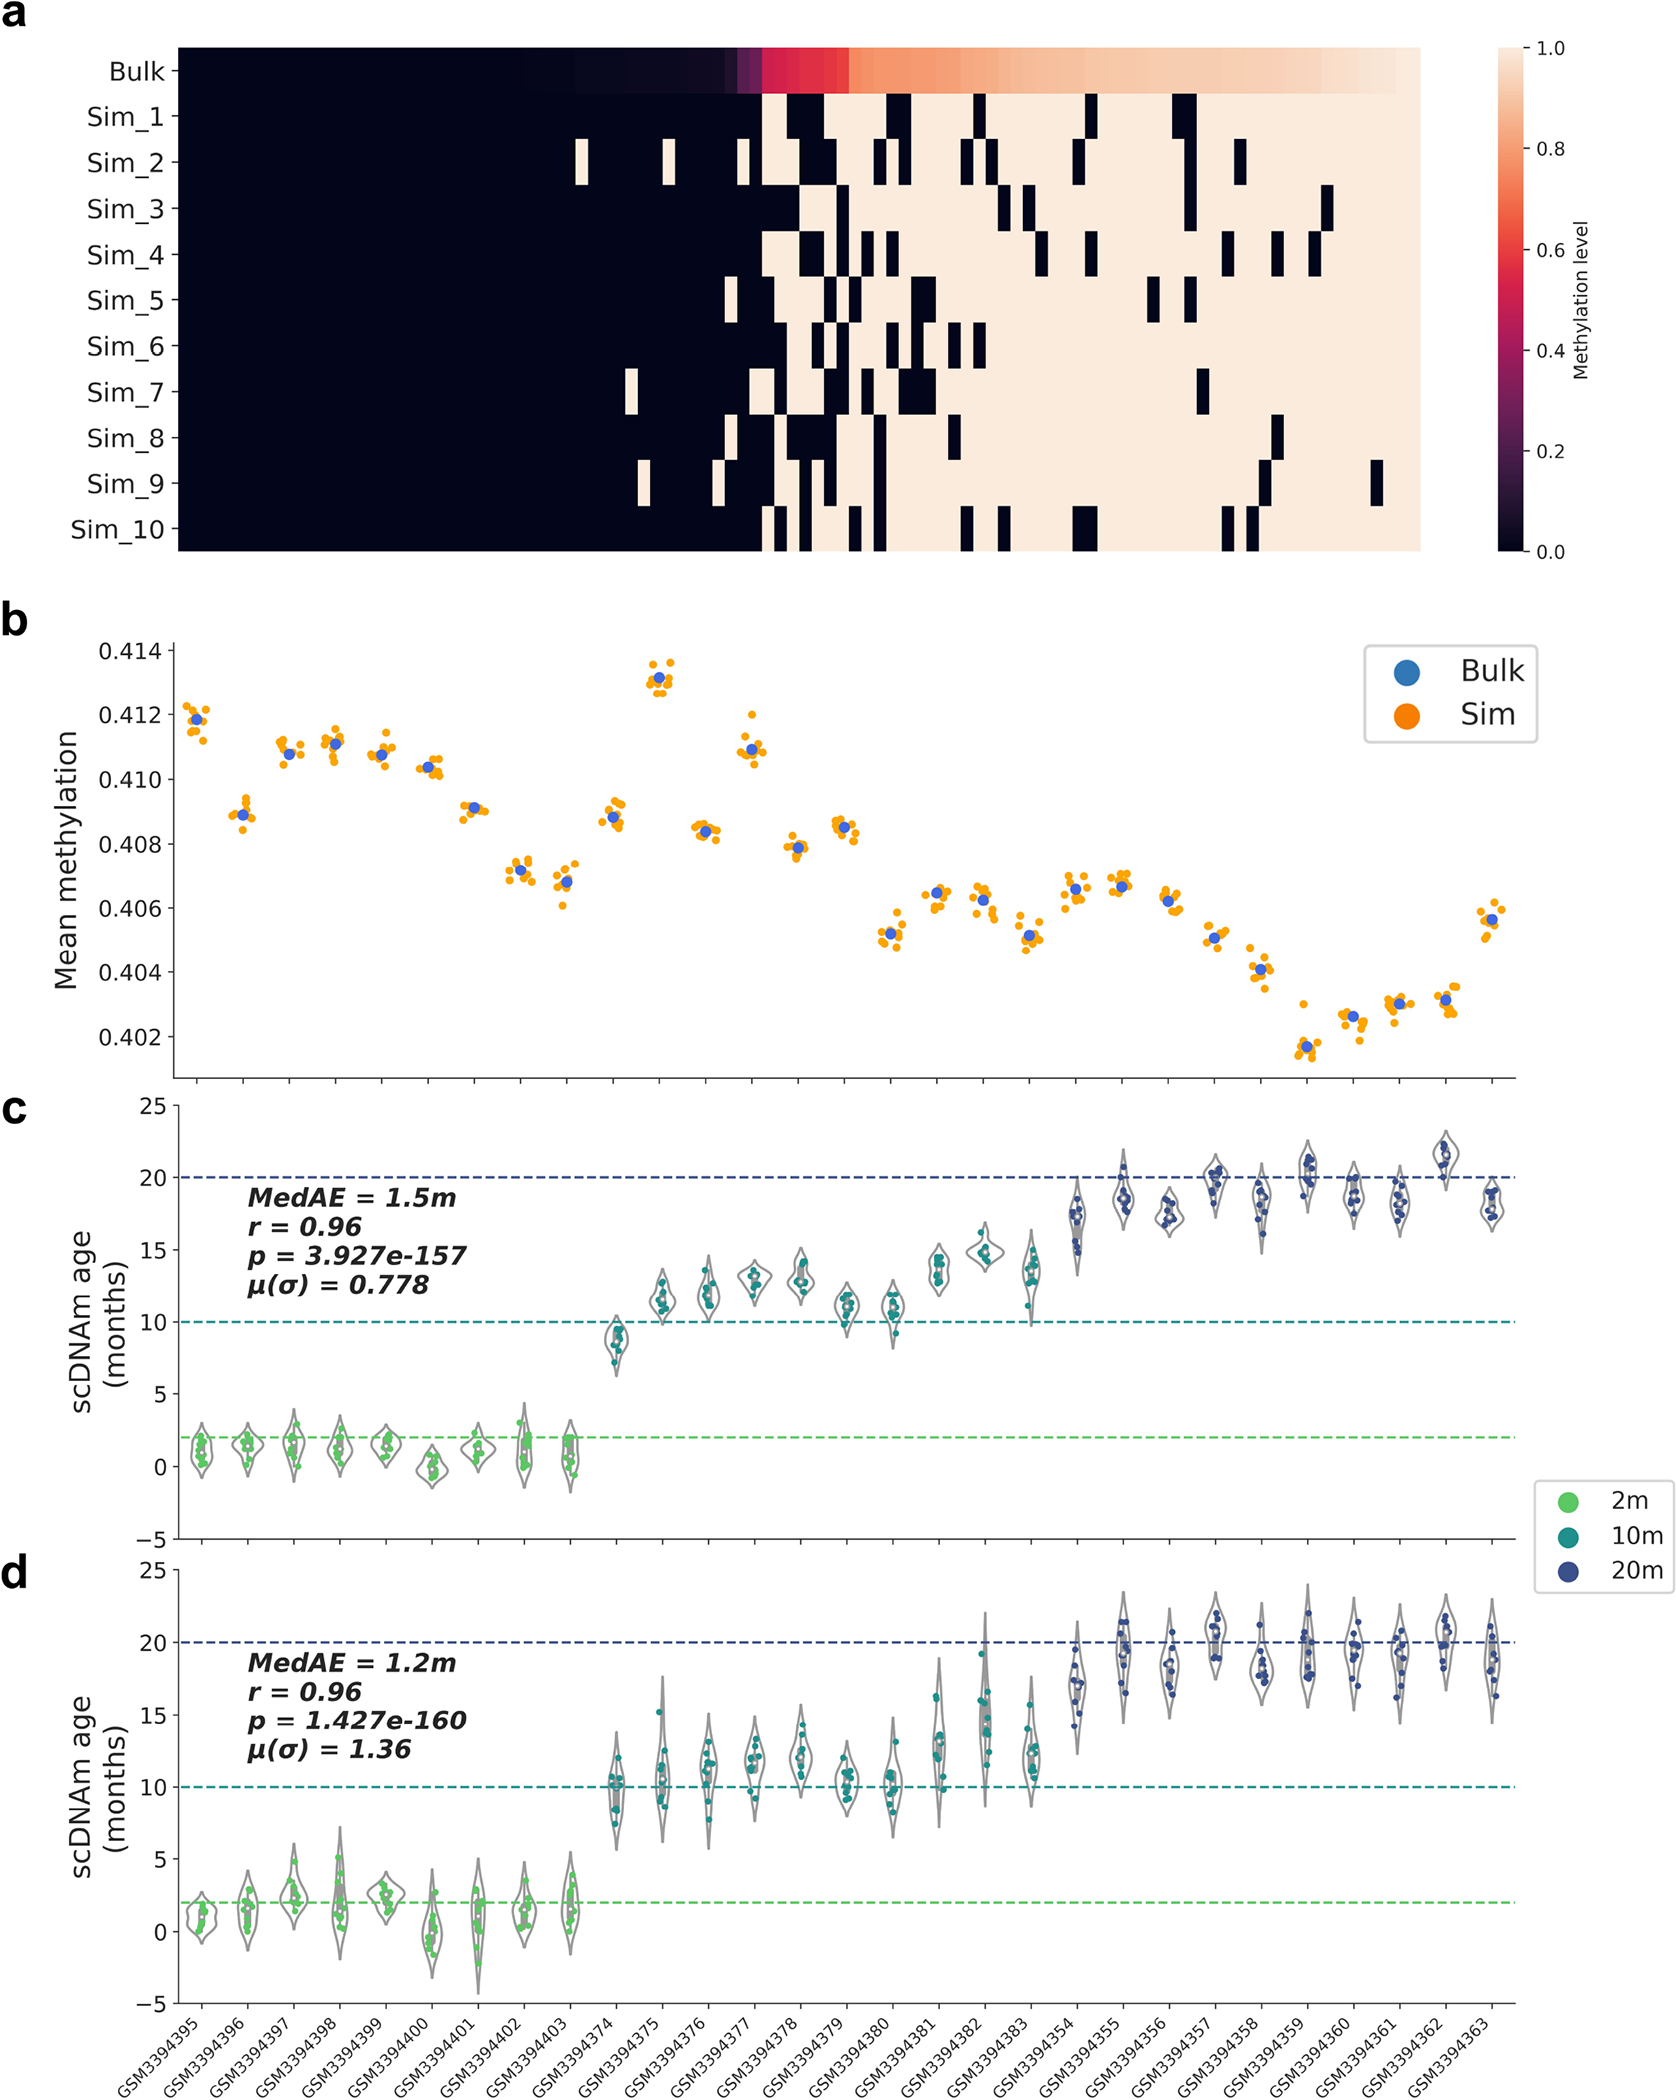
a) Heatmap of methylation values in bulk and simulated single-cell profiles. 100 CpGs were randomly selected from a bulk liver sample34, and random Bernoulli distributions were used to generate 10 simulated binary profiles per bulk sample. As the bulk methylation level (top) of CpGs increases from left to right, more simulated single-cell profiles are methylated as opposed to unmethylated. Color scale depicts methylation level from unmethylated (0, black) to methylated (1, white).
b) Mean global methylation of bulk samples (blue) and 10 simulated full binary profiles per sample (orange) across 29 bulk liver RRBS samples, arranged from young (left) to old (right). Simulated binary profiles cluster with their bulk source, despite shifting from a fractional to a binary data modality.
c, d) Predicted epigenetic age for each simulated binary profile with (c) full coverage of 748,955 CpGs per simulated profile and (d) randomly 10x downsampled coverage of 74,896 distinct CpGs per simulated profile. Profiles are arranged from young (left) to old (right). Age of the animals is denoted by the color of the points (2m, light green; 10m, dark green; 20m, dark blue). Two-tailed Pearson correlation analysis was employed for statistical testing, with statistics for each simulation treated independently without correction. The Pearson correlation coefficient (r), the associated two-tailed p-value (p), median absolute error (MedAE) and mean of the standard deviations for each sample (μ(σ)) are shown. Violin plots in (c) and (d) depict the kernel density estimation of the data. Inner boxplots depict the median (white dot), as well as the first/third quartile (grey box), with whiskers extending up to 1.5× the interquartile range. Individual dots depict simulated single cells.
Supplementary Material
ACKNOWLEDGMENTS
We are grateful to Tiamat Fox and Adit Ganguly for help with schematic figures. We also thank Marco Mariotti, Anastasia Shindyapina, Sun Hee Yim, Sang-Goo Lee, Didac Santesmasses, Patrick Griffin and Yan Hu for helpful discussion. This work was supported by NIA grants to Vadim N. Gladyshev. The funders had no role in study design, data collection and analysis, decision to publish or preparation of the manuscript. Some figures were created with BioRender.com.
Footnotes
COMPETING INTERESTS
Brigham and Women’s Hospital is the sole owner of a provisional patent application directed at this invention in which all authors, Alexandre Trapp, Csaba Kerepesi, and Vadim N. Gladyshev, are named inventors.
CODE AVAILABILITY
The scAge framework is publicly available at https://github.com/alex-trapp/scAge.
DATA AVAILABILITY
All data used in this work was obtained from publicly available repositories. Processed single-cell coverage matrices were downloaded from GEO under the following accessions: GSE6864227, GSE12143638, GSE5687925, GSE12169028. Trimmed sequencing files for the hepatocyte/MEF study were downloaded from the SRA, under accession SRA34404523. Bulk, processed methylation data used for model training was downloaded from GEO under accession GSE12013234.
REFERENCES
- 1.Horvath S & Raj K DNA methylation-based biomarkers and the epigenetic clock theory of ageing. Nat. Rev. Genet. 19, 371–384 (2018). [DOI] [PubMed] [Google Scholar]
- 2.López-Otín C, Blasco MA, Partridge L, Serrano M & Kroemer G The Hallmarks of Aging. Cell 153, 1194–1217 (2013). [DOI] [PMC free article] [PubMed] [Google Scholar]
- 3.Han Y et al. New targeted approaches for epigenetic age predictions. BMC Biol. 18, 71 (2020). [DOI] [PMC free article] [PubMed] [Google Scholar]
- 4.Horvath S DNA methylation age of human tissues and cell types. Genome Biol. 14, 3156 (2013). [DOI] [PMC free article] [PubMed] [Google Scholar]
- 5.Lister R et al. Human DNA methylomes at base resolution show widespread epigenomic differences. Nature 462, 315–322 (2009). [DOI] [PMC free article] [PubMed] [Google Scholar]
- 6.Meissner A et al. Reduced representation bisulfite sequencing for comparative high-resolution DNA methylation analysis. Nucleic Acids Res. 33, 5868–5877 (2005). [DOI] [PMC free article] [PubMed] [Google Scholar]
- 7.Han Y et al. Targeted methods for epigenetic age predictions in mice. Sci. Rep. 10, 22439 (2020). [DOI] [PMC free article] [PubMed] [Google Scholar]
- 8.Bocklandt S et al. Epigenetic Predictor of Age. PLOS ONE 6, e14821 (2011). [DOI] [PMC free article] [PubMed] [Google Scholar]
- 9.Han Y et al. Epigenetic age-predictor for mice based on three CpG sites. eLife 7, e37462 (2018). [DOI] [PMC free article] [PubMed] [Google Scholar]
- 10.Hannum G et al. Genome-wide methylation profiles reveal quantitative views of human aging rates. Mol. Cell 49, 359–367 (2013). [DOI] [PMC free article] [PubMed] [Google Scholar]
- 11.Petkovich DA et al. Using DNA Methylation Profiling to Evaluate Biological Age and Longevity Interventions. Cell Metab. 25, 954–960.e6 (2017). [DOI] [PMC free article] [PubMed] [Google Scholar]
- 12.Meer MV, Podolskiy DI, Tyshkovskiy A & Gladyshev VN A whole lifespan mouse multi-tissue DNA methylation clock. eLife 7, e40675 (2018). [DOI] [PMC free article] [PubMed] [Google Scholar]
- 13.Levine ME et al. An epigenetic biomarker of aging for lifespan and healthspan. Aging 10, 573–591 (2018). [DOI] [PMC free article] [PubMed] [Google Scholar]
- 14.Lu AT et al. DNA methylation GrimAge strongly predicts lifespan and healthspan. Aging 11, 303–327 (2019). [DOI] [PMC free article] [PubMed] [Google Scholar]
- 15.Belsky DW et al. Quantification of the pace of biological aging in humans through a blood test, the DunedinPoAm DNA methylation algorithm. eLife 9, e54870 (2020). [DOI] [PMC free article] [PubMed] [Google Scholar]
- 16.Consortium MM et al. Universal DNA methylation age across mammalian tissues. bioRxiv 2021.01.18.426733 (2021) doi: 10.1101/2021.01.18.426733. [DOI] [Google Scholar]
- 17.Lu Y et al. Reprogramming to recover youthful epigenetic information and restore vision. Nature 588, 124–129 (2020). [DOI] [PMC free article] [PubMed] [Google Scholar]
- 18.Gill D et al. Multi-omic rejuvenation of human cells by maturation phase transient reprogramming. bioRxiv 2021.01.15.426786 (2021) doi: 10.1101/2021.01.15.426786. [DOI] [PMC free article] [PubMed] [Google Scholar]
- 19.Bell CG et al. DNA methylation aging clocks: challenges and recommendations. Genome Biol. 20, 249 (2019). [DOI] [PMC free article] [PubMed] [Google Scholar]
- 20.Olova N, Simpson DJ, Marioni RE & Chandra T Partial reprogramming induces a steady decline in epigenetic age before loss of somatic identity. Aging Cell 18, e12877 (2019). [DOI] [PMC free article] [PubMed] [Google Scholar]
- 21.Sarkar TJ et al. Transient non-integrative expression of nuclear reprogramming factors promotes multifaceted amelioration of aging in human cells. Nat. Commun. 11, 1545 (2020). [DOI] [PMC free article] [PubMed] [Google Scholar]
- 22.Karemaker ID & Vermeulen M Single-Cell DNA Methylation Profiling: Technologies and Biological Applications. Trends Biotechnol. 36, 952–965 (2018). [DOI] [PubMed] [Google Scholar]
- 23.Gravina S, Dong X, Yu B & Vijg J Single-cell genome-wide bisulfite sequencing uncovers extensive heterogeneity in the mouse liver methylome. Genome Biol. 17, 150 (2016). [DOI] [PMC free article] [PubMed] [Google Scholar]
- 24.Almanzar N et al. A single-cell transcriptomic atlas characterizes ageing tissues in the mouse. Nature 583, 590–595 (2020). [DOI] [PMC free article] [PubMed] [Google Scholar]
- 25.Smallwood SA et al. Single-cell genome-wide bisulfite sequencing for assessing epigenetic heterogeneity. Nat. Methods 11, 817–820 (2014). [DOI] [PMC free article] [PubMed] [Google Scholar]
- 26.Guo H et al. Single-cell methylome landscapes of mouse embryonic stem cells and early embryos analyzed using reduced representation bisulfite sequencing. Genome Res. 23, 2126–2135 (2013). [DOI] [PMC free article] [PubMed] [Google Scholar]
- 27.Angermueller C et al. Parallel single-cell sequencing links transcriptional and epigenetic heterogeneity. Nat. Methods 13, 229–232 (2016). [DOI] [PMC free article] [PubMed] [Google Scholar]
- 28.Argelaguet R et al. Multi-omics profiling of mouse gastrulation at single-cell resolution. Nature 576, 487–491 (2019). [DOI] [PMC free article] [PubMed] [Google Scholar]
- 29.Clark SJ et al. scNMT-seq enables joint profiling of chromatin accessibility DNA methylation and transcription in single cells. Nat. Commun. 9, 781 (2018). [DOI] [PMC free article] [PubMed] [Google Scholar]
- 30.Argelaguet R et al. MOFA+: a statistical framework for comprehensive integration of multi-modal single-cell data. Genome Biol. 21, 111 (2020). [DOI] [PMC free article] [PubMed] [Google Scholar]
- 31.Angermueller C, Lee HJ, Reik W & Stegle O DeepCpG: accurate prediction of single-cell DNA methylation states using deep learning. Genome Biol. 18, 67 (2017). [DOI] [PMC free article] [PubMed] [Google Scholar]
- 32.Kapourani C-A & Sanguinetti G Melissa: Bayesian clustering and imputation of single-cell methylomes. Genome Biol. 20, 61 (2019). [DOI] [PMC free article] [PubMed] [Google Scholar]
- 33.Stubbs TM et al. Multi-tissue DNA methylation age predictor in mouse. Genome Biol. 18, 68 (2017). [DOI] [PMC free article] [PubMed] [Google Scholar]
- 34.Thompson MJ et al. A multi-tissue full lifespan epigenetic clock for mice. Aging 10, 2832–2854 (2018). [DOI] [PMC free article] [PubMed] [Google Scholar]
- 35.Zou H & Hastie T Regularization and variable selection via the elastic net. J. R. Stat. Soc. Ser. B Stat. Methodol. 67, 301–320 (2005). [Google Scholar]
- 36.Xie W, Baylin SB & Easwaran H DNA methylation in senescence, aging and cancer. Oncoscience 6, 291–293 (2019). [DOI] [PMC free article] [PubMed] [Google Scholar]
- 37.Wang T et al. Epigenetic aging signatures in mice livers are slowed by dwarfism, calorie restriction and rapamycin treatment. Genome Biol. 18, 57 (2017). [DOI] [PMC free article] [PubMed] [Google Scholar]
- 38.Hernando-Herraez I et al. Ageing affects DNA methylation drift and transcriptional cell-to-cell variability in mouse muscle stem cells. Nat. Commun. 10, 4361 (2019). [DOI] [PMC free article] [PubMed] [Google Scholar]
- 39.García-Prat L et al. Autophagy maintains stemness by preventing senescence. Nature 529, 37–42 (2016). [DOI] [PubMed] [Google Scholar]
- 40.Schwörer S et al. Epigenetic stress responses induce muscle stem-cell ageing by Hoxa9 developmental signals. Nature 540, 428–432 (2016). [DOI] [PMC free article] [PubMed] [Google Scholar]
- 41.Novak JS et al. Human muscle stem cells are refractory to aging. Aging Cell 20, e13411 (2021). [DOI] [PMC free article] [PubMed] [Google Scholar]
- 42.Kerepesi C, Zhang B, Lee S-G, Trapp A & Gladyshev VN Epigenetic clocks reveal a rejuvenation event during embryogenesis followed by aging. Sci. Adv. 7, eabg6082 (2021). [DOI] [PMC free article] [PubMed] [Google Scholar]
- 43.Ficz G et al. FGF Signaling Inhibition in ESCs Drives Rapid Genome-wide Demethylation to the Epigenetic Ground State of Pluripotency. Cell Stem Cell 13, 351–359 (2013). [DOI] [PMC free article] [PubMed] [Google Scholar]
- 44.Gladyshev VN The Ground Zero of Organismal Life and Aging. Trends Mol. Med. 27, 11–19 (2021). [DOI] [PMC free article] [PubMed] [Google Scholar]
- 45.Pijuan-Sala B et al. A single-cell molecular map of mouse gastrulation and early organogenesis. Nature 566, 490–495 (2019). [DOI] [PMC free article] [PubMed] [Google Scholar]
- 46.Titus AJ, Gallimore RM, Salas LA & Christensen BC Cell-type deconvolution from DNA methylation: a review of recent applications. Hum. Mol. Genet. 26, R216–R224 (2017). [DOI] [PMC free article] [PubMed] [Google Scholar]
- 47.Houseman EA et al. Reference-free deconvolution of DNA methylation data and mediation by cell composition effects. BMC Bioinformatics 17, 259 (2016). [DOI] [PMC free article] [PubMed] [Google Scholar]
- 48.Schaum N et al. Ageing hallmarks exhibit organ-specific temporal signatures. Nature 583, 596–602 (2020). [DOI] [PMC free article] [PubMed] [Google Scholar]
- 49.Rando TA & Wyss-Coray T Asynchronous, contagious and digital aging. Nat. Aging 1, 29–35 (2021). [DOI] [PMC free article] [PubMed] [Google Scholar]
- 50.Krueger F & Andrews SR Bismark: a flexible aligner and methylation caller for Bisulfite-Seq applications. Bioinforma. Oxf. Engl. 27, 1571–1572 (2011). [DOI] [PMC free article] [PubMed] [Google Scholar]
Associated Data
This section collects any data citations, data availability statements, or supplementary materials included in this article.
Supplementary Materials
Data Availability Statement
All data used in this work was obtained from publicly available repositories. Processed single-cell coverage matrices were downloaded from GEO under the following accessions: GSE6864227, GSE12143638, GSE5687925, GSE12169028. Trimmed sequencing files for the hepatocyte/MEF study were downloaded from the SRA, under accession SRA34404523. Bulk, processed methylation data used for model training was downloaded from GEO under accession GSE12013234.


