Figure 8.
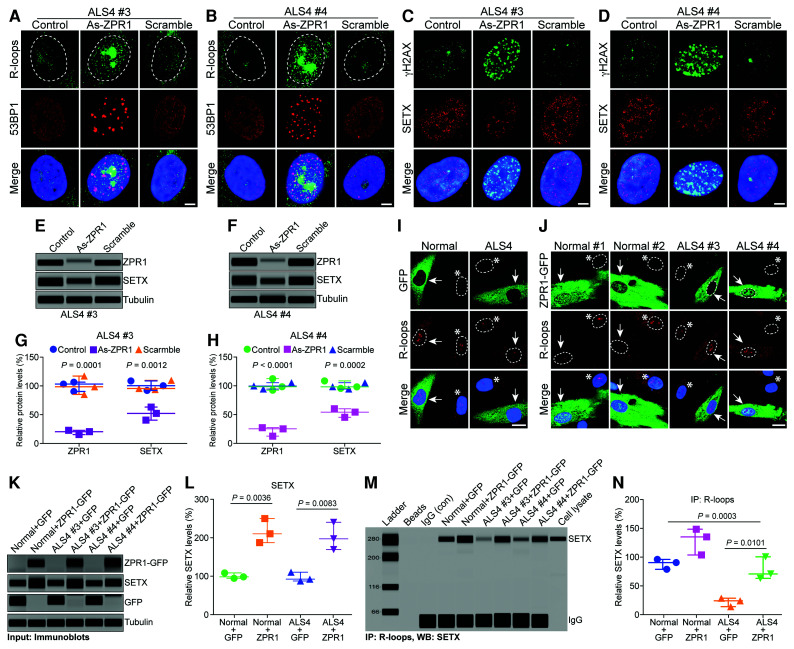
Modulation of ZPR1 levels regulates R-loop accumulation and rescues pathogenic R-loop phenotype in ALS4 patient cells. (A–D) Knockdown of ZPR1 in ALS4 patient cells increases R-loop accumulation and causes activation of DNA damage response. ALS4 cells were untransfected (Control) or transfected with (100 nM) antisense oligos (As-ZPR1) or scrambled sequence oligo (Scramble) (100 nM). Representative images are presented for double-labelled immunostainings: (A) ALS4 #3 patient cells stained for R-loops (green) and 53BP1 (red) and (B) ALS4 #4 patient cells stained for R-loops (green) and 53BP1 (red) show marked increase in R-loop accumulation in ZPR1-deficient ALS4 patient cells (As-ZPR1) compared to control and scramble oligo treated cells, which causes DNA damage response and accumulation of 53BP1. ZPR1-deficiency causes downregulation of SETX and DNA damage. (C) ALS4 #3 patient cells stained for SETX (red) and γH2AX (green) and (D) ALS4 #4 patient cells stained for SETX (red) and γH2AX (green) show marked increase γH2AX foci in the nucleus of ZPR1-deficient ALS4 patient cells (As-ZPR1) compared to control and scramble oligo treated cells. Scale bar = 5.0 μm. Quantitation (mean ± SEM, n = 3) of immunoblots from ALS4 #3 (E, G) and ALS4 #4 (F and H) control, As-ZPR1 and scramble samples show KD of ZPR1 to (19.69 ± 2.13%, P = 0.0001) in ALS4 #3 and (21.7 ± 4.614%, P < 0.0001) in ALS4 #4. ZPR1 KD decreases SETX level to (52.06 ± 6.55%, P = 0.0012) in ALS4 #3 and (53.28 ± 4.33%, P = 0.0002) in ALS4 #4. (G) Quantitation of changes in ZPR1 and SETX levels with ZPR1 knockdown in ALS4 #3 patient cells is shown as a scatter plot with median and range (min, median, max). ZPR1: ALS4 #3 Control (90.32, 103.30, 106.60), ALS4 #3 – As-ZPR1 (15.64, 20.54, 22.89), ALS4 #3 – Scramble (85.24, 98.54, 117.3); SETX: ALS4 #3 Control (92.21, 100.30, 108.60), ALS4 #3 – As-ZPR1 (40.56, 52.36, 63.25), ALS4 #3 – Scramble (93.68, 95.47, 109.60). (H) Quantitation of changes in ZPR1 and SETX levels with ZPR1 knockdown in ALS4 #4 patient cells is shown as a scatter plot with median and range. ZPR1: ALS4 #4 Control (92.31, 98.32, 112.40), ALS4 #4 – As-ZPR1 (12.54, 25.31, 27.25), ALS4 #4 – Scramble (94.32, 99.65, 105.3); SETX: ALS4 #4 Control (95.45, 98.24, 108.6), ALS4 #4 – As-ZPR1 (45.32, 54.32, 60.21), ALS4 #4 – Scramble (94.32, 98.32, 105.3). (I and J) Overexpression of ZPR1 in ALS4 patient cells rescues disease phenotype and improves accumulation of R-loops. (I) Control experiment with Normal and ALS4 patient cells infected with adenovirus Ad5-GFP (100 MOI) expressing GFP (green) and stained with antibody against R-loops (red) did not show any change in the normal levels of R-loop fluorescence intensity in the nucleus. (J) Normal and ALS4 cells infected with Ad5-ZPR1-GFP expressing ZPR1-GFP (green) and stained for R-loops (red) show that ZPR1 overexpression decreases R-loop accumulation in the Normal (arrows) and rescues R-loop accumulation in ALS4 patient cells (arrows). Nuclei were stained with DAPI (blue). Scale bar = 20 μm. Arrows show infected cells and asterisks indicate non-infected cells. Dotted circular lines indicate nuclei. (K–N) ZPR1 overexpression improves in vivo association of SETX with R-loops in ALS4 patient cells. (K) Immunoblots of ZPR1-GFP, SETX, GFP and tubulin proteins in Normal and ALS4 patient cells overexpressing GFP and ZPR1-GFP. (L) Quantitation of SETX levels in Normal and ALS4 patient cells overexpressing GFP and ZPR1-GFP is presented as a scatter plot with median and range. Normal-GFP (94.65, 98.36, 108.70); Normal-ZPR1-GFP (187.40, 210.40, 250.00); ALS4-GFP (87.65, 92.35, 110.30); ALS4-ZPR1-GFP (169.40, 197.30, 240.30). (M) Immunoprecipitation of R-loops from Normal and ALS4 cells overexpressing GFP and ZPR1-GFP shows increase in in vivo binding of SETX with R-loops. (N) Quantitation of SETX protein levels co-IP with R-loops in Normal and ALS4 patient cells overexpressing GFP and ZPR1-GFP is presented as a scatter plot with median and range. Normal-GFP (90.76, 102.50, 107.90); Normal-ZPR1-GFP (115.60, 147.00, 160.30); ALS4-GFP (25.98, 36.10, 40.53); ALS4-ZPR1-GFP (74.98, 82.76, 112.40). Quantitation and comparison of SETX levels in co-IP with R-loops show increase in SETX binding with R-loops (90.03 ± 11.39%) compared to (34.24 ± 4.30%, P = 0.0101) in ALS4 expressing ZPR1-GFP and GFP, respectively. All full-length blots are included in Supplementary Fig. 14. Enlarged images for (I) and (J) are included in Supplementary Figs 15 and 16.

