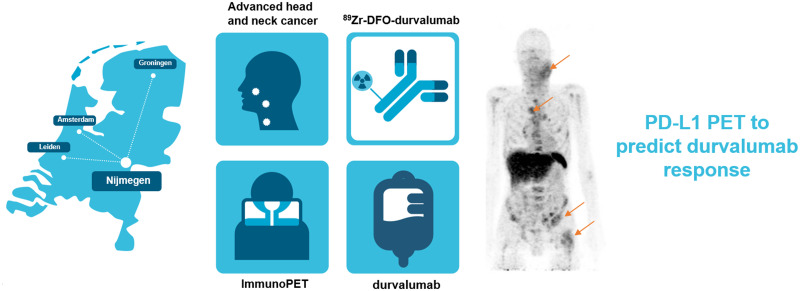
Visual Abstract
Keywords: PD-L1, immuno-PET, head and neck cancer, immune checkpoint inhibitors, durvalumab
Abstract
In this PD-L1 ImagiNg to prediCt durvalumab treatment response in SCCHN (PINCH) study, we performed 89Zr-DFO-durvalumab (anti–PD-L1 [programmed death ligand 1]) PET/CT in patients with recurrent or metastatic (R/M) squamous cell carcinoma of the head and neck (SCCHN) before monotherapy durvalumab treatment. The primary aims were to assess safety and feasibility of 89Zr-DFO-durvalumab PET imaging and predict disease control rate during durvalumab treatment. Secondary aims were to correlate 89Zr-DFO-durvalumab uptake to tumor PD-L1 expression, 18F-FDG uptake, and treatment response of individual lesions. Methods: In this prospective multicenter phase I–II study (NCT03829007), patients with incurable R/M SCCHN underwent baseline 18F-FDG PET and CT or MRI. Subsequently, PD-L1 PET imaging was performed 5 d after administration of 37 MBq of 89Zr-DFO-durvalumab. To optimize imaging conditions, dose finding was performed in the first 14 patients. For all patients (n = 33), durvalumab treatment (1,500 mg/4 wk, intravenously) was started within 1 wk after PD-L1 PET imaging and continued until disease progression or unacceptable toxicity (maximum, 24 mo). CT evaluation was assessed according to RECIST 1.1 every 8 wk. PD-L1 expression was determined by combined positive score on (archival) tumor tissue. 89Zr-DFO-durvalumab uptake was measured in 18F-FDG–positive lesions, primary and secondary lymphoid organs, and blood pool. Results: In total, 33 patients with locoregional recurrent (n = 12) or metastatic SCCHN (n = 21) were enrolled. 89Zr-DFO-durvalumab injection was safe. A dose of 10 mg of durvalumab resulted in highest tumor-to-blood ratios. After a median follow-up of 12.6 mo, overall response rate was 26%. The disease control rate at 16 wk was 48%, with a mean duration of 7.8 mo (range, 1.7–21.1). On a patient level, 89Zr-DFO-durvalumab SUVpeak or tumor-to-blood ratio could not predict treatment response (hazard ratio, 1.5 [95% CI, 0.5–3.9; P = 0.45] and 1.3 [95% CI, 0.5–3.3; P = 0.60], respectively). Also, on a lesion level, 89Zr-DFO-durvalumab SUVpeak showed no substantial correlation to treatment response (Spearman ρ, 0.45; P = 0.051). Lesional 89Zr-DFO-durvalumab uptake did not correlate to PD-L1 combined positive score but did correlate to 18F-FDG SUVpeak (Spearman ρ, 0.391; P = 0.005). Conclusion: PINCH is the first, to our knowledge, PD-L1 PET/CT study in patients with R/M SCCHN and has shown the feasibility and safety of 89Zr-DFO-durvalumab PET/CT in a multicenter trial. 89Zr-DFO-durvalumab uptake did not correlate to durvalumab treatment response.
Squamous cell carcinoma of the head and neck (SCCHN) is the seventh most common cancer worldwide, with up to 900,000 new diagnoses in 2020 (1). Patients with recurrent or metastatic (R/M) SCCHN with no curative options have a poor prognosis (2). However, a subset of patients derives durable responses from immune checkpoint inhibitors (ICI) targeting programmed cell death 1 (PD-1) or its ligand (PD-L1) (3–5), although selecting those patients up front remains challenging.
Patients who benefit most from ICI often express high levels of tumor PD-L1 as analyzed by immunohistochemistry, using different assays, scoring protocols, and cut-offs (5–8). Since June 2019, pembrolizumab has received Food and Drug Administration and European Medicines Agency approval as first-line treatment of R/M SCCHN patients with an immunohistochemistry combined positive score (CPS) of at least ≥1. Thus, pretreatment assessment of PD-L1 has major clinical implication, although there are also patients with a PD-L1–negative tumor biopsy who benefit from ICI (9–11).
Therefore, there is a clinical need to better understand ICI responses and the caveats that remain with selection based on PD-L1 expression in tumor biopsies. The role and expression of PD-L1 in anticancer immune responses is complex and warrants a biomarker that enables monitoring its heterogeneous and dynamic expression in different (tumor) tissues (12). Molecular imaging with radiolabeled tracers targeting PD-1 and PD-L1 allows noninvasive visualization of all accessible PD-1/PD-L1 (13,14). This approach overcomes important limitations of immunohistochemistry analyses, including invasive biopsies and sampling errors (15,16). It is a complementary tool for blood and tissue sampling, potentially providing relevant information for selecting patients and steering drug development (17).
The first clinical PD-1/PD-L1 imaging studies were performed with 89Zr-labeled atezolizumab (anti–PD-L1) and nivolumab (anti–PD-1) in patients with metastatic breast cancer, bladder cancer, and non–small cell lung cancer (NSCLC), demonstrating a correlation between tracer uptake and treatment response (18,19). To date, to our knowledge, no PD-L1 PET imaging studies have been performed in patients with R/M SCCHN.
The primary aim of this PD-L1 ImagiNg to prediCt durvalumab treatment response in SCCHN (PINCH) study was to assess the safety and feasibility of 89Zr-DFO-durvalumab PD-L1 PET imaging and to predict durvalumab disease control rate in patients with R/M SCCHN. Secondary aims were to investigate the correlation of 89Zr-DFO-durvalumab uptake to PD-L1 expression measured on tumor biopsies, 18F-FDG uptake, and treatment response of individual tumor lesions.
MATERIALS AND METHODS
Patients
Eligible patients were aged 18 y or older, had an Eastern Cooperative Oncology Group performance status of 0 or 1, and had a life expectancy of at least 12 wk. Patients had histologically or cytologically confirmed R/M SCCHN of the oral cavity, oropharynx, hypopharynx, or larynx not amenable to curative therapy, with no prior systemic treatment for R/M SCCHN. Patients with known leptomeningeal carcinomatosis, symptomatic or uncontrolled brain metastases requiring treatment, were excluded. Patient recruitment was performed at 4 university medical centers in The Netherlands (Radboudumc, UMC Groningen, Amsterdam UMC, and Leiden UMC). The study was performed in accordance with the Declaration of Helsinki and approved by the institutional review board of each participating center.
Procedures
Contrast-Enhanced (ce) CT or MRI, 18F-FDG PET/CT, and 89Zr-DFO-Durvalumab PET/CT
At baseline, all patients underwent ceCT or MRI of the head and neck, chest, and abdomen, combined with whole-body 18F-FDG PET/CT and 89Zr-DFO-durvalumab PET/CT. 18F-FDG PET/CT was performed according to European Association of Nuclear Medicine guidelines, version 1.0 (20), and the 89Zr-imaging procedure was harmonized between participating EARL (EANM Research GmbH)-accredited centers (PET/CT systems) (21). Patients underwent 89Zr-DFO-durvalumab PET/CT 5 d after intravenous injection of approximately 37 MBq of 89Zr-DFO-durvalumab. Details on the conjugation, radiolabeling, and quality control of 89Zr-DFO-durvalumab and image acquisition and reconstruction are described in the supplemental material (supplemental materials are available at http://jnm.snmjournals.org) (21–24).
After baseline imaging, all patients were planned for durvalumab treatment (fixed dose of 1,500 mg intravenously once every 4 wk) starting within 1 wk after PET imaging until disease progression or unacceptable toxicity, for a maximum of 24 mo. Data on adverse events were collected up to 90 d after the last treatment dose and graded according to the National Cancer Institute Common Terminology Criteria for Adverse Events (version 4.0). Treatment evaluation was performed with ceCT of the head and neck, chest, and abdomen at baseline and every 8 wk during treatment, using RECIST (version 1.1). Participants were contacted every 3 mo to assess survival after discontinuation of durvalumab treatment.
89Zr-DFO-Durvalumab PET/CT
Dose Finding
On the basis of prior dose-finding studies with 89Zr-labeled antibodies, we aimed to enroll a minimum of 3 patients per dose cohort (2, 10, or 50 mg of durvalumab) (25). All patients received an intravenous injection of 2 mg of 89Zr-DFO-durvalumab. For the 10- and 50-mg cohorts, 89Zr-DFO-durvalumab was complemented with 8 and 48 mg of unlabeled durvalumab, respectively. For pharmacokinetic purposes, blood plasma samples were drawn within 10 min after injection and 5 d later (day of the PET scan). Plasma radioactivity was measured in a γ-counter and reported as the percentage injected dose per gram (%ID/g). The optimal dose for 89Zr-DFO-durvalumab PET imaging was determined based on pharmacokinetic blood analyses and visual and quantitative PET analyses.
After dose finding, we aimed to include an additional 43 patients receiving the optimal dose of 89Zr-DFO-durvalumab. However, the study was closed early for enrollment in December 2020 due to the registration of pembrolizumab as first-line treatment for R/M SCCHN patients in The Netherlands (June 2020). In total, we enrolled an additional 19 patients who underwent the same procedures as described above, except for the collection of blood samples for pharmacokinetic analyses.
Imaging Assessment
ceCT or MRI and 18F-FDG PET/CT
Baseline ceCT/MRI and 18F-FDG PET/CT scans were centrally reviewed by 2 independent radiology and nuclear medicine physicians according to standard clinical practice. The evaluation of CT lesions was performed according to RECIST 1.1 (26). Lesion size was defined as the mean size in millimeters (mm) as determined by 2 reviewers.
The 18F-FDG PET/CT scans were assessed using PERCIST (27). A tumor lesion was defined as visually positive based on anatomic substrate on low-dose CT in combination with higher than surrounding 18F-FDG uptake and a diameter on ceCT or MRI of ≥10 or ≥15 mm in lymph nodes (26). The maximum and peak SUVs (SUVmax and SUVpeak) based on body weight were obtained, as well as metabolic tumor volume (MTV) and total lesion glycolysis (TLG).
89Zr-DFO-Durvalumab PET/CT
The quantification of tumor lesions was performed by placing a 3-dimensional sphere in an 18F-FDG–positive lesion using Accurate tool software developed in IDL [Interactive Data Language], version 8.4 (Harris Geospatial Solutions) (28). This was done for all 18F-FDG–positive lesions, irrespective of visual 89Zr-DFO-durvalumab uptake. This volume of interest was manually delineated around the entire lesion if this could be distinguished from the background. In tumor lesions without evident visual 89Zr uptake, a spheric volume of interest of 1 cm3 was drawn at the anatomic location of the tumor lesion, based on the low-dose CT, diagnostic CT, and 18F-FDG PET/CT. On a lesion level, the SUVpeak of individual lesions was determined to report tumor tracer uptake. For healthy organs and blood pool, SUVmean was reported. To correct for variable concentrations of circulating 89Zr-DFO-durvalumab, tumor-to-blood (TTB) ratios were reported as SUVpeak tumor/SUVmean blood. The blood-pool activity was measured in a spheric volume of interest in the descending aorta. To correct for differences in number of lesions per patient, the lesional SUVpeak and 18F-FDG TLG values of 1 individual patient were summarized as geometric mean (gm) values. This gm was used to correlate tracer accumulation to treatment response. Furthermore, to correct for partial-volume effect, subgroup analyses were performed for lesions ≥ 20m (reported in the supplemental material)
PD-L1 Immunohistochemistry
Fresh or archival cytologic or histologic samples suitable for PD-L1 staining were available for 27 patients. This involved tumor tissue from recurrent disease (n = 12) or metastases in lung (n = 7), lymph node (n = 7), or bone (n = 1). PD-L1 staining was performed using VENTANA (Roche) PD-L1 (SP263) assay and evaluated by a certified pathologist in head and neck cancer masked to clinical information. As an internal control, staining for PD-L1 was performed with the clinically validated 22C3 antibody using the Dako stainer in histologic samples of 8 patients (8). In all samples, PD-L1 expression was assessed according to the CPS, which describes the number of PD-L1–positive tumor cells plus immune cells per 100 tumor cells, showing positive cell membrane staining or a score of <1, 1–20, or >20.
Statistical Analysis
Clinical outcome was evaluated according to intention-to-treat analyses on a patient and lesion level and visualized in a waterfall plot. Furthermore, we assessed the disease control rate, overall response rate, progression-free survival (PFS), and overall survival. A log-rank test was performed to correlate PD-L1 CPS to PFS. A Cox regression model was used to report hazard ratios (HR) for progressive disease.
In the dose-finding study, we compared differences in tracer-uptake and TTB ratios between the 3 dose groups, testing for significance using a 2-sided Kruskal–Wallis test.
On a patient level, the relation between 89Zr-DFO-durvalumab, patient gm SUVpeak, and SUVpeak of the hottest lesion with durvalumab response was explored by Kaplan–Meier survival plots. Similar analyses were performed for gm 18F-FDG SUVpeak, TLG, and MTV. Patients were grouped in a below-median and above-median group to evaluate a difference in survival using the log-rank test. The relation between these groups was tested by additional Cox regression models, reporting HRs for progressive disease or survival.
We correlated 89Zr-DFO-durvalumab uptake with 18F-FDG SUVpeak and 18F-FDG TLG on a lesion level. Additional descriptive analyses were performed to evaluate the per-lesion PD-L1 expression to tracer accumulation. For these correlations, we report the Spearman correlation coefficient (ρ). Statistical analyses were performed using SPSS Statistics (IBM) for Windows, version 22.0. Differences with a P value of 0.05 or less were considered statistically significant.
RESULTS
Baseline Characteristics
Between April 2019 and December 2020, 37 patients were screened, 3 were considered ineligible, and 1 declined to participate. 89Zr-DFO-durvalumab PET dose finding was performed in 14 patients (Supplemental Fig. 1). Twenty-one of 33 (64%) patients presented with metastatic disease, most frequently located in lung (45%) and lymph nodes (39%). PD-L1 CPS could be determined in 27 patients (82%), including 17 patients with only archival tumor tissue available. Baseline characteristics are reported in Table 1.
TABLE 1.
Baseline Characteristics
| Parameter | Patients (n = 33) |
|---|---|
| Age (y) | Median, 64.5; range, 49–80 |
| Sex (n) | |
| Male | 26, 79% |
| ECOG PS (n) | |
| 0 | 10, 30% |
| 1 | 23, 70% |
| Smoking (n) | |
| Current | 4, 12% |
| Never or former | 29, 88% |
| Alcohol (n) | |
| Current | 24, 73% |
| Never or former | 9, 27% |
| Primary tumor location (n) | |
| Hypopharynx | 4, 13% |
| Larynx | 7, 22% |
| Oral cavity | 10, 30% |
| Oropharynx | 8, 24% |
| Unknown | 3, 10% |
| Disease extent at baseline (n) | |
| Loco/regional recurrence | 12, 36% |
| Metastatic disease | 21, 64% |
| Location metastases | |
| Lung | 28, 45% |
| Lymph node | 24, 39% |
| Bone | 5, 8% |
| Other (liver, adrenal gland, muscle) | 4, 8% |
| Prior treatments with curative intent* (n) | |
| Surgery alone | 3, 9% |
| Surgery with adjuvant radiation | 8, 24% |
| Surgery with adjuvant chemoradiation | 9, 27% |
| Radiation alone | 5, 15% |
| Chemoradiation | 8, 24% |
| Time from last platinum therapy (n) | |
| ≤6 mo | 1, 6% |
| >6 mo | 16, 94% |
| Histologic/cytologic biopsy† | |
| Archival | 17, 52% |
| Fresh | 16, 48% |
| PD-L1 status‡ (n) | |
| PD-L1 CPS < 1 | 13, 40% |
| PD-L1 CPS 1–20 | 8, 24% |
| PD-L1 CPS ≥ 20 | 6, 18% |
| No assessment possible | 6, 18% |
Chemotherapy regimen included monotherapy cisplatin or carboplatin, or combination regimens, for example, docetaxel, cisplatin and 5-fluorouracil or carboplatin and 5-fluorouracil.
†A fresh biopsy was defined as histologic or cytologic tumor biopsy performed at study enrollment up to < 1 mo before study enrollment.
‡PD-L1 assessment was performed on biopsy tissue from R/M disease. PD-L1 staining was performed using VENTANA SP263.
ECOG PS = Eastern Cooperative Oncology Group performance status.
Data are median and range, or n and %.
Durvalumab Treatment
In total, 31 of 33 patients started durvalumab treatment. Two patients showed rapid disease progression before treatment initiation and were offered best supportive care. One other patient showed rapid disease progression before first disease evaluation at 8 wk. After a median follow-up of 12.6 mo, the median time on durvalumab treatment was 5.3 mo (range, 1.2–26.5 mo).
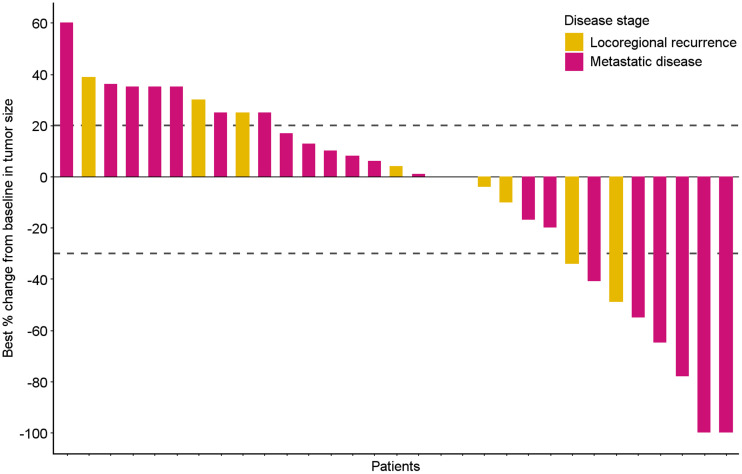
The median PFS was 5.3 mo (95% CI, 2.96–7.62 mo), and median overall survival was 13.1 mo (95% CI, 7.88–18.40 mo). The survival rate at 12 and 24 mo was 58% (95% CI, 8.82–11.28) and 45% (95% CI, 8.91–24.87), respectively (Supplemental Fig. 2). The overall response rate was 26%, including 3 patients with complete response and 5 patients with partial response. The best response to durvalumab treatment per patient is depicted in Figure 1. The disease control rate at 16 wk was 48%, with a mean response duration of 7.8 mo (range, 1.7–21.1 mo). The most frequent reported grade 3–4 treatment-related adverse events were elevated alanine transaminase and aspartate transaminase caused by hepatitis and pneumonitis (Supplemental Table 1). PD-L1 CPS showed no association with PFS (PFS of 4.6 vs. 12.9 vs. 3.5 mo with CPS < 1, 1–20 and > 20, respectively; P = 0.259; Supplemental Fig. 3).
FIGURE 1.
Each bar of waterfall plot depicts best response according to RECIST, version 1.1, of single patient during durvalumab treatment. Blue bars represent patients with metastatic disease, pink bars patients with locoregional recurrent disease. Dotted lines reflect RECIST for disease progression (+20% change) and partial response (−30%).
89Zr-DFO-Durvalumab PET/CT Dose Finding
In total, 14 patients were assigned to 1 of 3 dose cohorts: 2 mg (n = 4), 10 mg (n = 6), or 50 mg (n = 4) of durvalumab. No clinically relevant infusion-related reactions for the injection with 89Zr-DFO-durvalumab were reported.
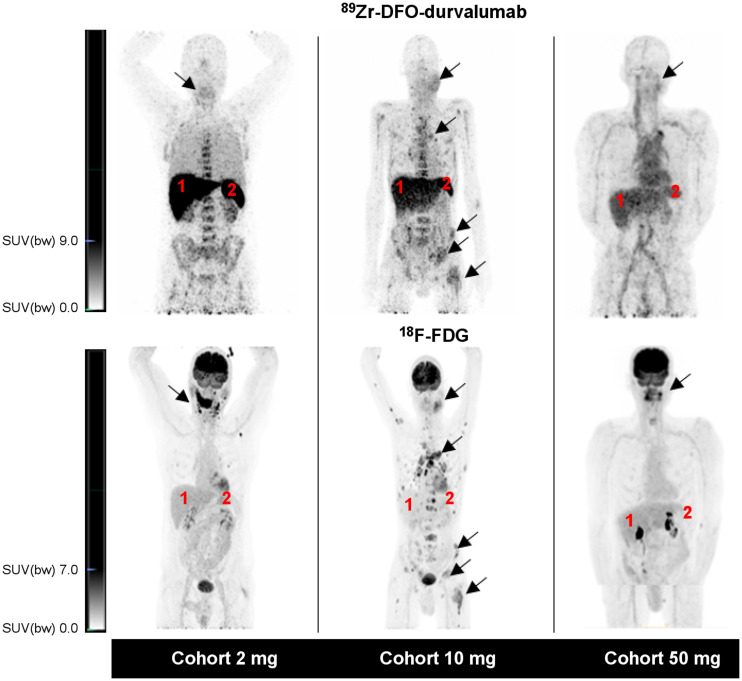
Example 89Zr-DFO-durvalumab PET/CT scans are shown in Figure 2. The pharmacokinetic analysis at day 5 showed the lowest 89Zr-DFO-durvalumab (%ID/g) plasma concentration in the 2-mg cohort (Supplemental Fig. 4), whereas highest concentrations were measured in the 50-mg cohort (P = 0.077). The 10-mg dose cohort showed variable plasma concentrations between patients. In the 2-mg cohort, tumor lesions could not be visualized properly and high tracer retention was observed in the liver and spleen. At higher antibody doses, liver and spleen uptake decreased and tumor uptake increased. Also, increasing antibody dose resulted in visually prolonged 89Zr-DFO-durvalumab circulation time. Quantitative analyses showed that the mean TTB ratio was highest in the 10-mg cohort and lowest in the 50-mg cohort (2-mg cohort: 2.28 ± 0.61; 10-mg cohort: 3.75 ± 0.93; 50-mg cohort: 1.48 ± 1.64; P = 0.019; Supplemental Fig. 5).
FIGURE 2.
Representative example images of 1 patient per dose cohort. For each cohort, 89Zr-DFO-durvalumab PET/CT (top) and 18F-FDG PET/CT (bottom) are presented. Physiologic 89Zr-DFO-durvalumab is visualized in lymphoid organs (e.g., liver [1], spleen [2]). Arrows identify tumor lesions. SUV(bw) = SUV based on body weight.
On the basis of the highest TTB ratios and tumor visualization, we selected 10 mg for subsequent 89Zr-DFO-durvalumab PET/CT imaging.
PET Imaging Analyses
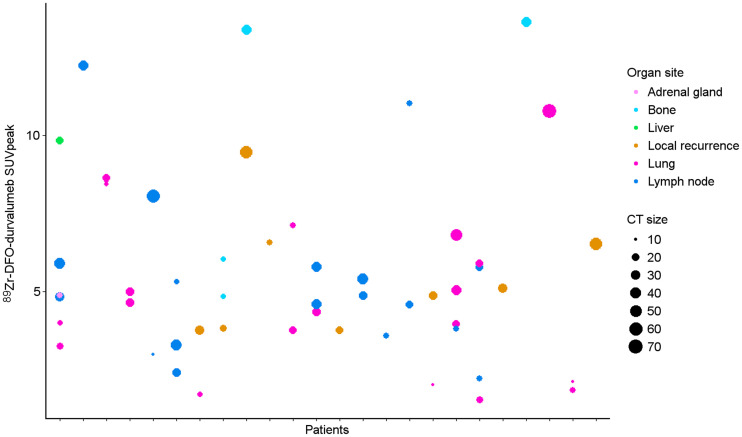
In total, 24 patients underwent 89Zr-DFO-durvalumab PET/CT imaging using an antibody dose of 10 mg. In these patients, 89Zr-DFO-durvalumab tumor accumulation was measured for all 18F-FDG–positive tumor lesions (n = 53). The 89Zr-DFO-durvalumab uptake, lesion size, and lesion location are displayed in Figure 3. An overview of all lesions can be found in Supplemental Table 2.
FIGURE 3.
Scatterplot of all 18F-FDG–positive lesions (n = 53) measuring ≥ 10 mm (or 15 mm in lymph node) and the lesions’ corresponding 89Zr-DFO-durvalumab uptake. Lesions were distributed over lung (n = 20), lymph nodes (n = 18), local recurrence (n = 8), bone (n = 5), and liver (n = 1).
89Zr-DFO-Durvalumab PET Imaging
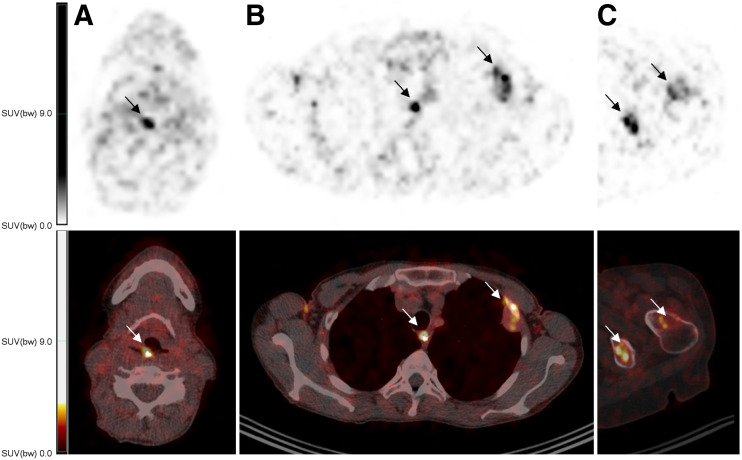
For quantitative analyses of 89Zr-DFO-durvalumab, 53 lesions were included. No significant differences were observed between lesions in different organ sites. However, accumulation of 89Zr-DFO-durvalumab was highly variable in tumor lesions within and between patients (Figs. 3 and 4. The largest heterogeneity in 1 patient was observed between a lung (SUVpeak, 3.3) and liver (SUVpeak, 9.8) metastasis. The highest SUVpeak was reported in 2 bone lesions (SUVpeak, 13.4 and 13.6) and 1 locoregional lymph node (SUVpeak, 12.2). 89Zr-DFO-durvalumab SUVpeak was correlated with lesion size (Spearman ρ, 0.359; P = 0.09) and 18F-FDG SUVpeak (Spearman ρ, 0.391; P = 0.005), but not with organ site (Spearman ρ, 0.15; P = 0.28). The overall mean gm 89Zr-DFO-durvalumab SUVpeak was 6.0 (95% CI, 4.6–7.3).
FIGURE 4.
Example fused images of 89Zr-DFO-durvalumab (10 mg) PET/CT images showing tracer uptake in known tumor locations. Axial sections in 2 different patients are displayed. Arrows highlight tumor lesions in local recurrence (A), lymph node and pleural lesion (B), and 2 other bone lesions (C). SUV(bw) = SUV based on body weight.
18F-FDG PET Imaging
In 33 patients, 70 18F-FDG–positive lesions were identified according to PERCIST used for quantitative analyses. The 18F-FDG uptake was highly variable within and between patients, with an overall gm 18F-FDG SUVpeak of 7.7 (range, 2.0–18.2) and 18F-FDG TLG of 70.3 mL (range, 2.7–659.0 mL).
Correlation Between Tracer Uptake and Treatment Response or PD-L1 Expression
89Zr-DFO-Durvalumab PET/CT
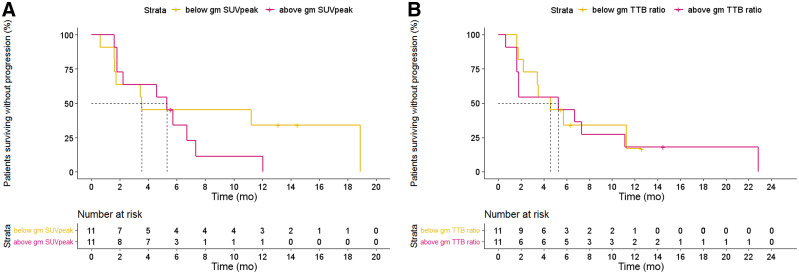
The median PFS of patients with an above-median 89Zr-DFO-durvalumab SUVpeak was 5.7 mo compared with 3.5 mo in the below-median group (HR, 1.5 [95% CI, 0.5–3.9; P = 0.45]; Fig. 5A). Also, gm 89Zr-DFO-durvalumab TTB ratio did not correlate with survival (HR, 1.3 [95% CI, 0.5–3.3; P = 0.60]; Fig. 5B). Patients grouped based on the hottest lesion showed a similar PFS of 5.7 mo (SUVpeak ≥ 6.22) versus 3.5 mo (SUVpeak < 6.22) (HR, 1.1 [95% CI, 0.4–3.0; P = 0.84]).
FIGURE 5.
Kaplan–Meier estimates of PFS based on 89Zr-DFO-durvalumab SUVpeak (A) and TTB ratios (B) dichotomized at median value.
To correct for partial-volume effect, the correlation of 89Zr-DFO-durvalumab SUVpeak and TTB ratio with PFS was also performed after correcting for lesions less than 20 mm, showing no essential differences between results described for all lesions (Supplemental Fig. 6).
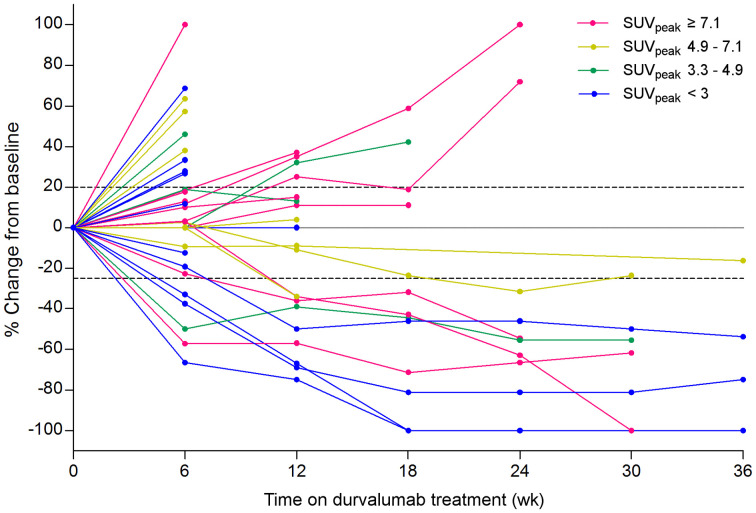
In total, 35 lesions were visible on evaluation CT scans during treatment. On a lesion level, 89Zr-DFO-durvalumab accumulation and treatment response was variable (Fig. 6). There was no substantial correlation between lesional 89Zr-DFO-durvalumab SUVpeak or TTB ratio with the change in lesion size at 12 wk (Spearman ρ, 0.45; P = 0.051 and Spearman ρ, −0.669; P = 0.78, respectively). A cutoff of the median SUVpeak of these lesions did not improve the correlation of 89Zr-DFO-durvalumab SUVpeak with treatment response (Spearman ρ, 0.67; P = 0.855).
FIGURE 6.
Spaghetti plot reporting lesional 89Zr-DFO-durvalumab SUVpeak and lesional response of 17 lesions where colors identify corresponding 89Zr-DFO-durvalumab uptake by distribution over quartiles.
18F-FDG PET/CT
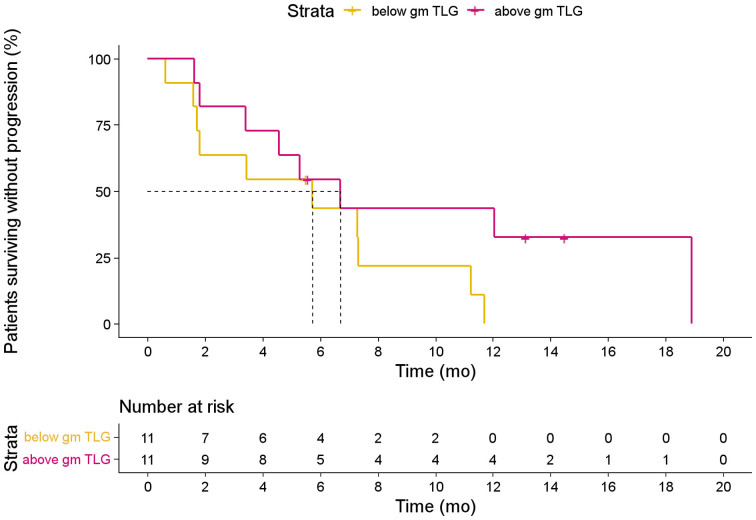
Patients with an above-median 18F-FDG TLG showed a significantly worse outcome than di patients with a low 18F-FDG TLG (median PFS, 1.8 vs. 7.3 mo; HR, 2.4 [95% CI, 1.1–5.4; P = 0.04; Fig. 7]). Patients with above-median 18F-FDG SUVpeak showed a median PFS of 5.3 compared with 5.7 mo in the below-median group (HR, 1.5 [95% CI, 0.7–3.4; P = 0.30]). The 18F-FDG MTV was not associated with PFS (P = 0.69; not shown).
FIGURE 7.
Kaplan–Meier estimates of PFS based on 18F-FDG TLG dichotomized at population median.
The correlation between 18F-FDG SUVpeak and 18F-FDG TLG ratio with PFS after correcting for lesions less than 20 mm is reported in the supplemental materials and showed similar results as described for all lesions (Supplemental Fig. 7).
On a lesion level, PD-L1 CPS did not correlate to 89Zr-DFO-durvalumab SUVpeak (Spearman ρ, 0.38; P = 0.20), 89Zr-DFO-durvalumab TTB ratio (Spearman ρ, −0.06; P = 0.85), 18F-FDG TLG (Spearman ρ, 0.40; P = 0.90), or 18F-FDG SUVpeak (Spearman ρ, −0.12; P = 0.70).
DISCUSSION
The PINCH study reported 89Zr-DFO-durvalumab PET/CT in R/M SCCHN patients treated with durvalumab to address current caveats in the predictive role of PD-L1 expression on tumor biopsies. 89Zr-DFO-durvalumab PET/CT was considered safe and feasible in a multicenter setting. Heterogeneous 89Zr-DFO-durvalumab tumor accumulation was detected within and between patients. 89Zr-DFO-durvalumab uptake could not predict durvalumab treatment response.
To achieve optimal tumor-to-background contrast, selection of proper antibody dose and imaging timing is essential. The PINCH study showed superior TTB ratios when performing PET/CT 5 d after 89Zr-DFO-durvalumab administration using 10 mg of durvalumab, compared with 2 and 50 mg. In agreement with previous studies, increasing the dose of unlabeled antibody saturates the spleen uptake and results in higher concentrations of circulating 89Zr-labeled antibodies and increased tumor uptake (24,25). At 50 mg, TTB ratio decreased, most likely explained by a decrease in available binding sites for 89Zr-DFO-durvalumab. In line with this, low or absent tumor accumulation was also reported for 89Zr-DFO-durvalumab PET imaging with 750 mg of unlabeled durvalumab (22).
Preclinical studies have demonstrated a relation between the accumulation of radiolabeled PD-1 and PD-L1 antibodies with PD-L1 expression, thereby distinguishing between tumors with different PD-L1 expression levels (13,14). The first 2 clinical trials also reported an association between radiolabeled PD-L1 antibody uptake and PD-L1 expression (18,19). However, we did not find such a correlation. Of note, our analysis was performed on a subset of patients using archival tissue biopsies, as fresh histologic proof was not mandatory for study inclusion. Besides sampling error due to small tumor samples, correlating (archival) biopsies to PET imaging remains challenging because of the heterogeneous and dynamic expression levels of PD-L1. Also, in comparison to previous studies, the PD-L1 staining and scoring procedures differed (29,30).
A previous study in 22 patients with metastatic NSCLC, triple-negative breast cancer, and bladder cancer treated with atezolizumab, above-median gm 89Zr-atezolizumab SUVmax was associated with improved overall survival and PFS (18). Furthermore, both 89Zr-nivolumab (anti–PD-1) and 18F-BMS-986192 (anti–PD-L1) SUVpeak were correlated to nivolumab treatment response in 13 NSCLC patients. However, 2 other studies using 89Zr-durvalumab and 89Zr-pembrolizumab in NSCLC patients showed a trend but no significant correlation between tracer uptake and durvalumab, respectively, and pembrolizumab treatment efficacy (22,31), which is more in line with our data. The early termination of the study resulted in a lower number of included patients. Potentially, more patients could have resulted in a significant correlation. We also evaluated the correlation between tumor metabolism and ICI response, as performed in previous studies (32,33). Our data suggest that, in particular,18F-FDG TLG may identify poor durvalumab responders upfront. A potential explanation could be that patients with more extensive disease have already undergone extra steps in the immune escape route.
Altogether, PET imaging with 89Zr-labeled PD-L1 antibodies has not consistently shown a correlation between tracer uptake and treatment response. Potential explanations are the different characteristics of the antibodies used, which include affinity for PD-L1, which could influence tumor retention; Fc-tail modification/glycosylation, which could affect circulation time and effector functions; and nonspecific antibody uptake due to enhanced permeability and retention (EPR) effect (34–36). As a result of the EPR effect, there is always a (low) PET signal in the tumor, although the PET signal is not PD-L1–mediated. This EPR effect may hamper the detection of small amounts of tumor PD-L1, which can be clinically relevant as low PD-L1 expression (1% positive cells) has been associated with ICI response. To limit the nonspecific uptake and thereby increase the potential to measure low PD-L1 expression levels, small molecules or peptides with rapid blood clearance can be used (37,38). Finally, other mechanisms within the immune suppressive microenvironment beyond PD-L1, such as the activation and promoting of CD8+ T cell priming in tumor-draining lymph nodes, determining ICI response could have influenced the correlation between tracer uptake and ICI response (39).
Despite the fact that 89Zr-DFO-durvalumab did not correlate to treatment outcome, we do see potential of 89Zr-labeled antibodies in optimizing the ICI treatment efficacy in patients with R/M SCCHN (40). Besides a unique insight into antibody biodistribution, the in vivo visualization of 89Zr-labeled antibodies highlights essential local effector mechanisms, reveals the complexity of dose–response relations, and may shed a new light on the role of nontumor located PD-L1 expression in the anticancer immune responses (39). Ultimately, this teaches us how to use (and combine) these drugs to improve response rates, an essential step in early drug development suitable for phase 1 and 2 clinical trials.
CONCLUSION
The PINCH study is the first, to our knowledge, to perform PD-L1 PET/CT in patients with R/M SCCHN. It has shown that 89Zr-DFO-durvalumab PET/CT imaging is feasible and safe. However, 89Zr-DFO-durvalumab uptake did not correlate to PD-L1 expression on a patient level and could not predict durvalumab treatment response.
DISCLOSURE
This study was supported by AstraZeneca, Radboud Institute for Health Sciences, and NWO (91617039, KWF [10099]). This study was supported by Astrazeneca. Carla M.L. van Herpen received research grants from AstraZeneca, Bristol-Myers Squibb, MSD, Merck, Ipsen, Novartis, and Sanofi and has been on advisory boards for Bayer, Bristol-Myers Squibb, Ipsen, MSD, and Regeneron. Erik H.J.G. Aarntzen received a research grant from AstraZeneca. No other potential conflict of interest relevant to this article was reported.
KEY POINTS
QUESTION: Can 89Zr-DFO-durvalumab PET/CT predict durvalumab treatment response in patients with R/M head and neck cancer?
PERTINENT FINDINGS: This multicenter clinical trial studies the feasibility and safety of 89Zr-DFO-durvalumab PET/CT and its ability to predict durvalumab treatment response. 89Zr-DFO-durvalumab PET/CT was safe and feasible but was unable to predict durvalumab treatment response.
IMPLICATIONS FOR PATIENT CARE: Our findings indicate that an approach other than radiolabeled antibody–based PET imaging to predict treatment response to ICIs using molecular imaging is needed.
REFERENCES
- 1. Sung H, Ferlay J, Siegel RL, et al. Global cancer statistics 2020: GLOBOCAN estimates of incidence and mortality worldwide for 36 cancers in 185 countries. CA Cancer J Clin. 2021;71:209–249. [DOI] [PubMed] [Google Scholar]
- 2. Ferlay J, Colombet M, Soerjomataram I, et al. Estimating the global cancer incidence and mortality in 2018: GLOBOCAN sources and methods. Int J Cancer. 2019;144:1941–1953. [DOI] [PubMed] [Google Scholar]
- 3. Harrington KJ, Ferris RL, Blumenschein G, Jr, et al. Nivolumab versus standard, single-agent therapy of investigator’s choice in recurrent or metastatic squamous cell carcinoma of the head and neck (CheckMate 141): health-related quality-of-life results from a randomised, phase 3 trial. Lancet Oncol. 2017;18:1104–1115. [DOI] [PMC free article] [PubMed] [Google Scholar]
- 4. Cohen EEW, Bell RB, Bifulco CB, et al. The Society for Immunotherapy of Cancer consensus statement on immunotherapy for the treatment of squamous cell carcinoma of the head and neck (HNSCC). J Immunother Cancer. 2019;7:184. [DOI] [PMC free article] [PubMed] [Google Scholar]
- 5. Burtness B, Harrington KJ, Greil R, et al. Pembrolizumab alone or with chemotherapy versus cetuximab with chemotherapy for recurrent or metastatic squamous cell carcinoma of the head and neck (KEYNOTE-048): a randomised, open-label, phase 3 study. Lancet. 2019;394:1915–1928. [DOI] [PubMed] [Google Scholar]
- 6. Fridman WH, Pagès F, Sautès-Fridman C, Galon J. The immune contexture in human tumours: impact on clinical outcome. Nat Rev Cancer. 2012;12:298. [DOI] [PubMed] [Google Scholar]
- 7. Cohen EEW, Soulières D, Le Tourneau C, et al. Pembrolizumab versus methotrexate, docetaxel, or cetuximab for recurrent or metastatic head-and-neck squamous cell carcinoma (KEYNOTE-040): a randomised, open-label, phase 3 study. Lancet. 2019;393:156–167. [DOI] [PubMed] [Google Scholar]
- 8. de Ruiter EJ, Mulder FJ, Koomen BM, et al. Comparison of three PD-L1 immunohistochemical assays in head and neck squamous cell carcinoma (HNSCC). Mod Pathol. 2021;34:1125–1132. [DOI] [PubMed] [Google Scholar]
- 9. Reck M, Rodriguez-Abreu D, Robinson AG, et al. Pembrolizumab versus chemotherapy for PD-L1-positive non-small-cell lung cancer. N Engl J Med. 2016;375:1823–1833. [DOI] [PubMed] [Google Scholar]
- 10. Rittmeyer A, Barlesi F, Waterkamp D, et al. Atezolizumab versus docetaxel in patients with previously treated non-small-cell lung cancer (OAK): a phase 3, open-label, multicentre randomised controlled trial. Lancet. 2017;389:255–265. [DOI] [PMC free article] [PubMed] [Google Scholar]
- 11. Siu L, Even C, Mesía R, et al. A randomized, open-label, multicenter, global phase 2 study of durvalumab (D), tremelimumab (T), or D plus T, in patients with PD-L1 low/negative recurrent or metastatic head and neck squamous cell carcinoma: CONDOR. Int J Radiat Oncol Biol Phys. 2018;100:1307. [Google Scholar]
- 12. Verhoeff SR, van den Heuvel MM, van Herpen CML, Piet B, Aarntzen E, Heskamp S. Programmed cell death-1/ligand-1 PET imaging: a novel tool to optimize immunotherapy? PET Clin. 2020;15:35–43. [DOI] [PubMed] [Google Scholar]
- 13. Heskamp S, Wierstra PJ, Molkenboer-Kuenen JDM, et al. PD-L1 microSPECT/CT imaging for longitudinal monitoring of PD-L1 expression in syngeneic and humanized mouse models for cancer. Cancer Immunol Res. 2019;7:150–161. [DOI] [PubMed] [Google Scholar]
- 14. Hettich M, Braun F, Bartholoma MD, Schirmbeck R, Niedermann G. High-resolution PET imaging with therapeutic antibody-based PD-1/PD-L1 checkpoint tracers. Theranostics. 2016;6:1629–1640. [DOI] [PMC free article] [PubMed] [Google Scholar]
- 15. Hofman P. The challenges of evaluating predictive biomarkers using small biopsy tissue samples and liquid biopsies from non-small cell lung cancer patients. J Thorac Dis. 2019;11:S57–S64. [DOI] [PMC free article] [PubMed] [Google Scholar]
- 16. Kluger HM, Zito CR, Turcu G, et al. PD-L1 studies across tumor types, its differential expression and predictive value in patients treated with immune checkpoint inhibitors. Clin Cancer Res. 2017;23:4270–4279. [DOI] [PMC free article] [PubMed] [Google Scholar]
- 17. Waaijer SJH, Kok IC, Eisses B, et al. Molecular imaging in cancer drug development. J Nucl Med. 2018;59:726–732. [DOI] [PubMed] [Google Scholar]
- 18. Bensch F, van der Veen EL, Lub-de Hooge MN, et al. 89Zr-atezolizumab imaging as a non-invasive approach to assess clinical response to PD-L1 blockade in cancer. Nat Med. 2018;24:1852–1858. [DOI] [PubMed] [Google Scholar]
- 19. Niemeijer AN, Leung D, Huisman MC, et al. Whole body PD-1 and PD-L1 positron emission tomography in patients with non-small-cell lung cancer. Nat Commun. 2018;9:4664. [DOI] [PMC free article] [PubMed] [Google Scholar]
- 20. Boellaard R, Delgado-Bolton R, Oyen WJ, et al. FDG PET/CT: EANM procedure guidelines for tumour imaging: version 2.0. Eur J Nucl Med Mol Imaging. 2015;42:328–354. [DOI] [PMC free article] [PubMed] [Google Scholar]
- 21. Makris NE, Boellaard R, Visser EP, et al. Multicenter harmonization of 89Zr PET/CT performance. J Nucl Med. 2014;55:264–267. [DOI] [PubMed] [Google Scholar]
- 22. Smit J, Borm FJ, Niemeijer A-LN, et al. PD-L1 PET/CT imaging with radiolabeled durvalumab in patients with advanced stage non-small cell lung cancer. J Nucl Med. 2022;63:686–693. [DOI] [PubMed] [Google Scholar]
- 23. Verel I, Visser GW, Boellaard R, Stigter-van Walsum M, Snow GB, van Dongen GA. 89Zr immuno-PET: comprehensive procedures for the production of 89Zr-labeled monoclonal antibodies. J Nucl Med. 2003;44:1271–1281. [PubMed] [Google Scholar]
- 24. Jauw YW, Menke-van der Houven van Oordt CW, Hoekstra OS, et al. Immuno-positron emission tomography with zirconium-89-labeled monoclonal antibodies in oncology: what can we learn from initial clinical trials? Front Pharmacol. 2016;7:131. [DOI] [PMC free article] [PubMed] [Google Scholar]
- 25. Dijkers EC, Oude Munnink TH, Kosterink JG, et al. Biodistribution of 89Zr-trastuzumab and PET imaging of HER2-positive lesions in patients with metastatic breast cancer. Clin Pharmacol Ther. 2010;87:586–592. [DOI] [PubMed] [Google Scholar]
- 26. Eisenhauer EA, Therasse P, Bogaerts J, et al. New response evaluation criteria in solid tumours: revised RECIST guideline (version 1.1). Eur J Cancer. 2009;45:228–247. [DOI] [PubMed] [Google Scholar]
- 27. Pinker K, Riedl C, Weber WA. Evaluating tumor response with FDG PET: updates on PERCIST, comparison with EORTC criteria and clues to future developments. Eur J Nucl Med Mol Imaging. 2017;44:55–66. [DOI] [PMC free article] [PubMed] [Google Scholar]
- 28. Boellaard R. Quantitative oncology molecular analysis suite: ACCURATE. J Nucl Med. 2018;59(suppl 1):1753. [Google Scholar]
- 29. Madore J, Vilain RE, Menzies AM, et al. PD-L1 expression in melanoma shows marked heterogeneity within and between patients: implications for anti-PD-1/PD-L1 clinical trials. Pigment Cell Melanoma Res. 2015;28:245–253. [DOI] [PubMed] [Google Scholar]
- 30. Ilie M, Long-Mira E, Bence C, et al. Comparative study of the PD-L1 status between surgically resected specimens and matched biopsies of NSCLC patients reveal major discordances: a potential issue for anti-PD-L1 therapeutic strategies. Ann Oncol. 2016;27:147–153. [DOI] [PubMed] [Google Scholar]
- 31. Niemeijer AN, Oprea Lager DE, Huisman MC, et al. First-in-human study of 89Zr-pembrolizumab PET/CT in patients with advanced stage non-small-cell lung cancer. J Nucl Med. July 16, 2021. [Epub ahead of print]. [DOI] [PubMed] [Google Scholar]
- 32. Dall’Olio FG, Calabro D, Conci N, et al. Baseline total metabolic tumour volume on 2-deoxy-2-[18F]fluoro-d-glucose positron emission tomography-computed tomography as a promising biomarker in patients with advanced non-small cell lung cancer treated with first-line pembrolizumab. Eur J Cancer. 2021;150:99–107. [DOI] [PubMed] [Google Scholar]
- 33. Ito K, Schoder H, Teng R, et al. Prognostic value of baseline metabolic tumor volume measured on 8F-fluorodeoxyglucose positron emission tomography/computed tomography in melanoma patients treated with ipilimumab therapy. Eur J Nucl Med Mol Imaging. 2019;46:930–939. [DOI] [PMC free article] [PubMed] [Google Scholar]
- 34. Boussiotis VA. Molecular and biochemical aspects of the PD-1 checkpoint pathway. N Engl J Med. 2016;375:1767–1778. [DOI] [PMC free article] [PubMed] [Google Scholar]
- 35. Arce Vargas F, Furness AJS, Litchfield K, et al. Fc effector function contributes to the activity of human anti-CTLA-4 antibodies. Cancer Cell. 2018;33:649–663.e4. [DOI] [PMC free article] [PubMed] [Google Scholar]
- 36. Shi Y, van der Meel R, Chen X, Lammers T. The EPR effect and beyond: strategies to improve tumor targeting and cancer nanomedicine treatment efficacy. Theranostics. 2020;10:7921–7924. [DOI] [PMC free article] [PubMed] [Google Scholar]
- 37. Stutvoet TS, van der Veen EL, Kol A, et al. Molecular imaging of PD-L1 expression and dynamics with the adnectin-based PET tracer 18F-BMS-986192. J Nucl Med. 2020;61:1839–1844. [DOI] [PubMed] [Google Scholar]
- 38. Leung D, Bonacorsi S, Smith RA, Weber W, Hayes W. Molecular imaging and the PD-L1 pathway: from bench to clinic. Front Oncol. 2021;11:698425. [DOI] [PMC free article] [PubMed] [Google Scholar]
- 39. Borst J, Busselaar J, Bosma DMT, Ossendorp F. Mechanism of action of PD-1 receptor/ligand targeted cancer immunotherapy. Eur J Immunol. 2021;51:1911–1920. [DOI] [PMC free article] [PubMed] [Google Scholar]
- 40. Canning M, Guo G, Yu M, et al. Heterogeneity of the head and neck squamous cell carcinoma immune landscape and its impact on immunotherapy. Front Cell Dev Biol. 2019;7:52. [DOI] [PMC free article] [PubMed] [Google Scholar]


