Abstract
In the present paper, our model consists of deep learning approach: DenseNet201 for detection of COVID and Pneumonia using the Chest X‐ray Images. The model is a framework consisting of the modeling software which assists in Health Insurance Portability and Accountability Act Compliance which protects and secures the Protected Health Information . The need of the proposed framework in medical facilities shall give the feedback to the radiologist for detecting COVID and pneumonia though the transfer learning methods. A Graphical User Interface tool allows the technician to upload the chest X‐ray Image. The software then uploads chest X‐ray radiograph (CXR) to the developed detection model for the detection. Once the radiographs are processed, the radiologist shall receive the Classification of the disease which further aids them to verify the similar CXR Images and draw the conclusion. Our model consists of the dataset from Kaggle and if we observe the results, we get an accuracy of 99.1%, sensitivity of 98.5%, and specificity of 98.95%. The proposed Bio‐Medical Innovation is a user‐ready framework which assists the medical providers in providing the patients with the best‐suited medication regimen by looking into the previous CXR Images and confirming the results. There is a motivation to design more such applications for Medical Image Analysis in the future to serve the community and improve the patient care.
Keywords: bio‐medical innovation, CNN classification, COVID detection, deep learning, medical imaging, public health information (PHI), transfer learning, X‐ray imaging
Abbreviations
- ACE2, angiotensin‐converting enzyme 2; AI
artificial intelligence
- CDC
center for disease control and prevention
- CNN
convolutional neural network
- CO2
carbon dioxide
- CONV
convolution
- COVID
corona virus disease
- CT
computerized tomography
- CXR
chest X‐ray
- DICOM
digital imaging and communications in medicine
- O2
oxygen
- PANGO
phylogenetic assignment of named global outbreak lineages
- RT‐PCR
reverse transcription polymerase chain reaction
- SAR‐CoV
severe acute respiratory syndrome coronavirus
- WHO
world health organization
1. INTRODUCTION
World Health Organization (WHO) 1 has confirmed the first official case of Coronavirus which was reported in Wuhan, Hubei in the province in China in December 2019. Since then, millions of patients were diagnosed with COVID infection which is known as SARS‐CoV‐2 that has caused a cataclysmic effect on health and wellbeing of the global population. WHO has characterized COVID‐19 as a pandemic because of the increase in reported cases from a large number of countries across the world. 2 Coronaviruses are a family of viruses which causes mild to severe upper respiratory tract illness similar to the common cold in humans. SARS‐CoV‐2 (SARS‐severe acute respiratory syndrome) which belongs to the Coronavirus family can cause severe diseases. Around 180 million people suffered from COVID‐19‐COVID infection and over 4 million people died due to complications associated with severe COVID‐19 infection based on the data provided by WHO by June 2021. 3 The transmission of COVID‐19 also occurs through respiratory droplets which are exhaled by afflicted patients. There are various other symptoms that are observed in COVID‐19, and the common presenting symptoms of the corona virus infection include fever (98%), cough (76%), anosmia (12%), and other non‐specific symptoms like fatigue (44%), headache (8%), and dyspnea (3%). 4 , 5 , 6
Pneumonia is a lung disease that affects either one or both lungs. Pneumonia can be caused by various microbes or by exposure to various chemicals. Microbes that can cause pneumonia are bacteria, virus, and fungi. Pneumonia is characterized by inflammation of lung alveoli which leads to filling of alveolar space with fluids and pus. This response decreases the available surface area for O2 and CO2 gas exchange between alveoli and blood. 7 Pneumonia can present with mild symptoms such as fever and cough or severe symptoms such as chest pain, breathlessness, and severe respiratory failure. Certain populations are more prone to suffer from pneumonia and are more likely to present with severe symptoms especially elderly people with comorbidities and immunocompromised adults. There are different methods to diagnose pneumonia which includes computed tomography. Chest X‐rays are generally used as a confirmatory tool. 8 Different types of pneumonia present with different symptoms and show different radiological features on chest X‐ray and computerized tomography (CT) scan. Depending on the causative organism, radiographs can be used to make initial diagnoses and differentiate various etiological agents. To make the exact diagnosis of causative organism sputum culture, blood culture, thoracentesis, or bronchoscopy is used. Antibiotics are used to treat bacterial pneumonia; antiviral medications are used to treat viral pneumonia and antifungal medications are used to treat fungal pneumonia.
SARS‐CoV‐2 variant Omicron has been rapidly mutating the spike protein and the first case was reported by WHO from South Africa on November 24, 2021. The samples of the Omicron variant have been collected and the first sample was collected on November 8, 2021, according to the reports of Center for Disease Control and Prevention (CDC). 9 After the reports the variant has been named Omicron (WHO nomenclature) and B.1.1.529 (PANGO lineage). As advised by Technical Advisory Group on SARS‐CoV‐2, the evolution of the virus and categorization of Omicron as a variant of interest by the WHO has accelerated well‐timed epidemiological observation. Omicron has been detected in over 20 countries across six continents. 10
The first step in comprehending Omicron's common or unmistakable clinical aggregation, affectability, or protection from existing vaccinations is to fully describe its mutational profile. It does not matter whether future Omicron‐like variants are more dangerous. To be sure, SARS‐CoV‐2 has developed into variants of concern and variations of interest through a mix of missense, deletion, inclusion, and additional mutations. 11 In the Spike (S) protein that connects with the ACE2 receptor on human cells to work with viral passage, missense transformations (for example E484K) have prompted critical changes in the Spike‐ACE2 restricting partiality, and omission (for example ΔY144) have adjusted the impact of reducing the effect of Spike antibodies. 12 Insertion mutations have been less common in SARS‐CoV‐2 evolution. However, one of the most practically important transformations in the developmental history of SARS‐CoV‐2 till date was the “PRRA” Spike protein 13 inclusion in the S1/S2 cleavage site, which presented the polybasic FURIN cleavage site that mirrors the RRARSVAS peptide in human ENAC‐alpha. The accessibility of 5.4 million SARS‐CoV‐2 genomes covering 1523 lineages from more than 200 nations/domains in the GISAID information base from the start of the pandemic offers a chance to describe the mutational profile of the Omicron variation in contrast with other SARS‐CoV‐2 variations.
There are various types of tests available for viruses such as Zika, Spanish Flu, COVID‐19, COVID‐19 Delta Variant, COVID‐19‐Omicron, and Pneumonia. As described by the CDC molecular tests which search for the genetic material of the Zika viruses in the human body or serological test which identifies antibodies which allows the body to fight against infection. As mentioned in the reports, 14 there are various symptoms of Spanish Flu (sudden and high fever, dry cough, headache, sore throat, chills, runny nose, loss of appetite, fatigue) through which it has been diagnosed. Rapid Antigen tests and Reverse Transcription Polymerase Chain Reaction (RT‐PCR) tests are the main modalities being used to detect the COVID variants and diagnoses infection in suspected patients. RT‐PCR is expensive has long turnaround times and require an advanced laboratory setup with a trained individual to perform the test. These factors make it difficult to conduct in remote or unprivileged areas with limited resources. Rapid tests are economical but are not as reliable at detecting COVID‐19 infection due to lower sensitivity. Chest X‐rays and chest CT scan are ordered in patients suffering from severe COVID‐19 infection to estimate the lung damage caused by the SARS‐CoV‐2 virus infection. There is a substantial burden on radiologists as a huge number of patients were admitted into the hospital in very short span of time. Considering all these factors the best technique is radiography scanning in which the radiographs could be automatically analyzed to detect the disease. As mentioned in Reference [15] compared to PCR Tests, the radiographic images (X‐rays) can give more accurate results. It has lower turnaround times and are more cost‐effective. In early detection of this infectious disease which could prevent community spread. Compared to the CT‐Scan images X‐ray machines are more readily available in healthcare facilities, even in remote areas.
For the medical diagnosis of COVID‐19 variants, the most common challenge in remote areas is trained doctors are not available in healthcare facilities. Due to the increasing number of cases, there is a substantial burden on testing facilities to perform RT‐PCR tests. X‐rays can be used as a reliable modality to make diagnosis of COVID‐19 variants. Due to the widespread availability of X‐ray machines in remote areas, chest X‐ray can be used as a reliable modality to make initial diagnosis of COVID‐19 variants which can be further supported by artificial intelligence (AI) that can provide reliable feedback to radiologists while making the diagnosis.
In recent years, deep learning methods have made remarkable progress in solving these issues due to increasing amount of data and high computational power. There has been a huge increase in deep learning methods and its algorithms. 16 Much of the focus on deep learning applications has been in the field of medical image analysis. 17 , 18 Analysis requires experience and proficiency and includes a variety of different algorithms to improve, speed up and provide an accurate diagnosis. 19 , 20 There is a high accuracy reported in analyzing the pneumonia. To effectively treat pneumonia, doctors must differentiate between the many causes of pneumonia which include seasonal flu, bacterial infection, COVID‐19 infection, and other viral infection.
There have been many applications of machine learning to analyze chest X‐ray Images. Various methods of machine learning such as transfer learning, regression, reinforcement learning clustering, classification, and natural language processing have assisted in treating the virus. Methods such as decision tree have also been used in predicting the symptoms of viruses. 21 , 22
In this paper, we have proposed a model which uses a simple and cost‐effective software which runs on approach based on deep learning, which is used to classify the viruses using the Chest X‐ray (CXR) Images. The software is framed taking care of the Health Insurance Portability and Accountability Act (HIPAA) Compliance. This system is used to give feedback to the radiologists about the possibilities of viruses by analyzing the CXR Images. In this method, we have used a dataset from Kaggle (https://www.kaggle.com/preetviradiya/covid19-radiography-dataset) through which we have shown the effectiveness of the proposed model in terms of classification, accuracy, and sensitivity. We have compared our results with other methods like VGG, ResNet, SqeezeNet, CoVXNet, Inception, DarkNet used to interpret the CXR Images. The model proposed in this paper is based on the state‐of‐the‐art deep learning model to achieve better accuracy.
The novelty of the work includes the training of the model by quantifying weights and in order to get more accuracy. In the present work, composite learning factor strategy and data augmentation are included in the developed model. The innovation in the work is graphical user interface (GUI) which is developed will assist the radiology centers in computational experience and shall take care of the HIPAA Compliance. The parameters are tuned, and the model complexity is calculated. The present work is validated by the medical community.
The paper is described as follows:
Section 2: Related Works/Literature review, their approaches, and methodology.
Section 3: The Proposed Model along with state‐of‐the‐art models which we have used.
Section 4: Materials and methods which contains Dataset, Preprocessing, Performance Metrics, and Compared Benchmark.
Section 5: Experiments and results which includes the classification accuracy, sensitivity, F1 Score.
Section 6: The prototype tool which we developed. The paper concluded along with a summary of the result of our research.
2. RELATED WORK
It is observed that computer vision has leading usage in the medical image diagnosis. One of the applications of medical image analysis is in dermatology. Computer Vision is being utilized as a tool to diagnose whether a part of skin is unusually a primary potential indicator of skin cancer. To improve the analysis of the viruses in the lungs, CXR Image, CT scans, Magnetic Resonance Imaging (MRI), Positron Emission Tomography scan (PET scan), and Ultrasound scans are some of the methods used. There is a huge application of the deep learning‐based methods to identify pneumonia as well as the different classes of thoracic diseases and skin cancer. 23 , 24 In the literature, it is researched that these medical images have aided in expanding the analysis and detection of viral infection in lungs. To identify pneumonia, 25 , 26 various deep learning methods have been designed.
D.Singh et.al, 2020 used convolutional neural network (CNN) to identify the patients who have viral pneumonia, bacterial pneumonia, and COVID‐19 using CT Scan Images. 27 F Shan et.al, 2020 and Lin Li, 2020 designed AI Models that have been developed for diagnosing the SARS‐CoV‐2 infection in human lungs with the aid of CT Scan Images. As discussed in References [28, 29] automatic segmentation and quantification of the lungs is done which illustrates fully automatic framework to detect the coronavirus impacted lungs from chest CT Scan Images and segregated from other lung diseases. Albahi S, et.al, 2021 discussed that there were three profound CNN approaches to identify COVID‐19 dependent on CXR pictures. 30
There are numerous works performed by researchers to identify the group of viruses using CXR Images. In the study, 31 to categorize viral pneumonia, bacterial pneumonia, COVID‐19 and normal CXR Images, transfer learning methods with Inception‐v3 have been used. Concentrated Xception and ResNet50V2 are the methods used to detect the viruses from the CXR Images. 32 A custom architecture (COVIDNet) has been developed for the classification of COVID‐19 patients, pneumonia patients, and normal patients. 33 It is commonly observed that ResNet, DenseNet, Xception, and other deep learning models have been developed to detect the virus from CXR Images. 23 , 34 In the study 35 similar approaches like ResNet and VGG‐19 algorithms were used for detecting the melanoma.
A deep learning model was developed for detecting the viruses from CXR Images to support vector machine for classification through extracting the deep features and transferring them. The accuracy obtained through this method was 95.38% obtained from the proposed model. 36 Based on this comprehensive review 37 it has been observed that chest CT images play an important role for the early detection of COVID‐19 and other viruses. The comparison of the previous works which classifies pneumonia, COVID and normal chest X‐ray Images are described in Table 1.
TABLE 1.
Comparison of previous work in determining Pneumonia, COVID, and Normal Chest X‐ray Images
| References | Method used | Dataset utilized | Sensitivity | Accuracy | Specificity | Proposed approach | Summary |
|---|---|---|---|---|---|---|---|
| Proposed method | Train: Test = 3200:1600 | Total = 16 000, COVID = 3616, Non‐COVID = 12 384 | 98.5% | 99.1% | 98.95% | DenseNet‐201 | More Accuracy, Sensitivity and Specificity. Includes the GUI Tool |
| [38] | Train: Test = 2084:3100 | Total = 5148 Images (COVID‐184, Normal‐5000) | 98% | 90.89% | 87.1% | ResNet18, ResNet50, SqueezeNet and DenseNet‐121 | Results in very high on sensitivity; compares state‐of the‐ art‐ CNN models |
| [39] | 5 Fold Cross Validation | Total = 610 Images (COVID‐305, Normal ‐ 305) | 97.80% | 97.40% | 94.70% | Multiresolution CovXNet | CovXNet Proposed. Demonstartes high sensitivity, specificity, accuracy. Images used is low |
| [40] | 4 Fold Cross Validation | Total = 594 Images (COVID‐284, Normal‐310) | 97.5% | 95.3% | 98.60% | CoroNet (Xception) | Demonstrates high accuracy, sensitivity and specificity |
| [41] | Train: Test = 5467:965 | Total = 6432 Images (COVID‐576, Normal‐1583, Pneumonia ‐ 4273) | 92.7% | 95.3% | 98.2% | Inception V3, Xception, ResNeXt |
Comparison of state‐of‐the‐art CNN Models High accuracy, sensitivity, specificity |
| [35] | 5 Fold Cross Validation | Total = 6926 Images (Normal‐4337, COVID‐2589) | 92.35% | 94.43% | 96.33% | COVID X‐Net | High accuracy, sensitivity, specificity. Number of images is quite low |
| [42] | 10 Fold Cross Validation | Total = 1428 Images (Normal‐504, COVID‐224, Pneumonia ‐ 700) | 41% | 90.5% | 99% | VGG19, Inception, Xception, MobileNet v2, Resnetv2 |
Comparison of state‐of‐the‐art CNN Models High accuracy, sensitivity, specificity. Some error found in reporting data |
| [23] | 5 Fold Cross Validation | Total = 625 Images (COVID‐125, Normal‐500) | 95.13% | 98.08% | 95.30 | DarkNet | High accuracy, sensitivity, specificity. Number of images is low |
| [43] | Train: Test = 50:1 | Total = 13 975 Images (COVID‐5338, Normal‐8066) | 95% | 93.30% | 95% | COVIDNet | High accuracy, sensitivity, specificity |
| [34] | 5 Fold Cross Validation | Total = 1006 Images (COVID‐538, non‐COVID‐468) | 95.09% | 91.62% | 88.33% | Combining InceptionV3, Resnet50V2 and DenseNet201 | Ensemble based technique. High accuracy, sensitivity, specificity |
Table 1 describes different methods used which includes the most common 5‐Fold Cross Validation, 10‐Fold Cross Validation and others. Looking to the previous studies which have been conducted so far to detect Pneumonia, COVID and normal chest X‐ray images it can be said that these studies show us various classifications and authors have worked on increasing the Accuracy as seen in Table 1. Various other factors like number of radiological images in training, testing, and validation affects the result classification such as Sensitivity, Specificity. Table 1 demonstrates the methods which have been used so far, the dataset, accuracy, sensitivity, specificity, proposed approach, and the summary. The simulation study results are as shown in Table 2.
TABLE 2.
Simulation study results
| Reference No. | Algorithms used | Trained parameters | Computational complexity |
|---|---|---|---|
| [39] |
ResNet18 ResNet50 SqueezeNet DenseNet‐121 Dataset 5 k images Transfer Learning (Training of 2 k images) |
Weights, Layer of neurons | It is possible to reduce the number of channels in a DenseNet Architecture since each layer receives feature mappings from all preceding layers (so, it have higher computational efficiency and memory efficiency) |
| [40] | COVXNET | Kernels, Dilation Rate, Weights, Fine Tuning Layers | Traditional convolution can also be divided into depth wise and pointwise convolutions, which greatly reduces the amount of time and calculation required to perform the operation |
| [41] | CORONET | Fine Tuning Layers, Batch Size, Optimizer | There were promising results on the dataset supplied for CoroNet. When more training data is provided, the performance can be further enhanced |
| [35] | Compared 3 models Inception v3 Xception ResNeXt | Layers, Weights, Bias | The XCeption net provides the best performance and is best suited for use. We were able to correctly classify covid‐19 images, demonstrating the potential of such systems for automating diagnostic activities in the near future |
| [42] | COVID‐XNETS | Layers, Kernel Size, Optimizer | This unique model was selected by way of an Exhaustive Grid Search over the number of layers and kernel's sizes, prioritizing accuracy, and computational complexity |
| [23] | VGG19 MobileNet V2 Inception Xception Inception ResNet V2 | Layers, Classifier | This technique is widely used to avoid the computational costs of starting from scratch when training a very deep network or to keep the important feature extractors learned during the initial step |
| [43] | DarkNet Model Provides binary classification (Covid vs. non‐findings) Multiclass Classification (Covid vs. Non‐finding vs. Pneumonia) | Layers | With the filters it applies, a convolution layer captures features from the input, and a pooling layer reduces the size for computational performance, as is typical in CNN structures |
| [34] | Experiment Model usedVGG19 ResNet‐50 COVID‐Net | Batch Size, Epochs, Learning Rate, Factor, Patience | The VGG‐19 and ResNet‐50 architectures were far more sophisticated, whereas COVID‐Net was significantly simpler. The COVID‐Net network architecture outperformed the VGG‐19 and ResNet‐50 in terms of test accuracy and COVID‐19 sensitivity |
Table 2 represents a comparison of simulation study results with existing CNN methods along with the trained parameters and computational complexity.
3. METHODOLOGY AND DATASET
The purpose of this research is to use DenseNet‐201, a new transfer learning framework, to diagnose COVID‐19. The work done thus far with the Dense Net model has produced more accurate findings than any other model. The proposed model includes a composite learning factor technique, data augmentation, and a web console that assists the system's end users in simplifying their tasks. The new method was compared to others that had previously been created, and the proposed model produced more accurate findings. The dataset consists of the chest X‐ray Images from Kaggle Open Data source (https://www.kaggle.com/datasets/preetviradiya/covid19‐radiography‐dataset). The dataset consists of the CXR images of individuals infected with pneumonia, patients with other infectious diseases, and healthy subjects. The dataset has the CXR frontal images, and the lateral images are rejected. This dataset includes a total of 15 153 images that are classified as either tested COVID‐19 positive (3616), Viral Pneumonia positive (1345), or Normal (10 192). The images are labeled as Pneumonia, Normal, COVID‐19. Figure 1 represents the CXR of the patients with Pneumonia and Figure 2 represents the CXR of the patient without Pneumonia.
FIGURE 1.
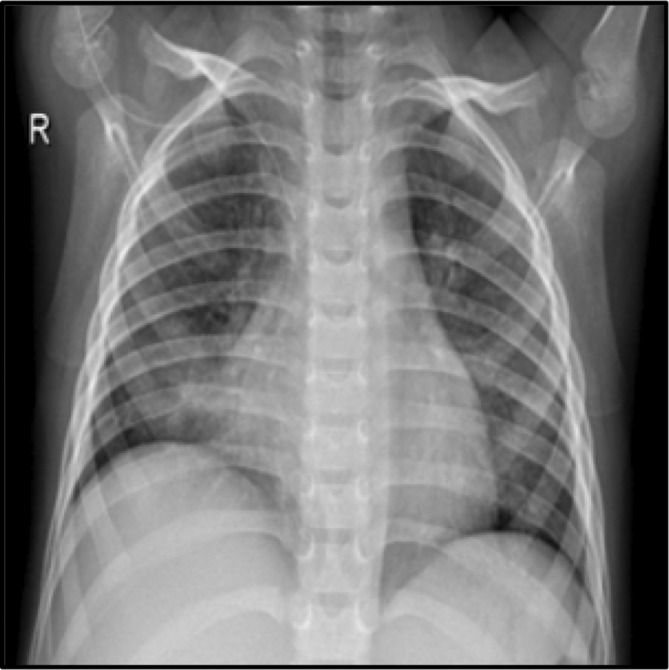
Chest X‐ray radiograph with Pneumonia
FIGURE 2.
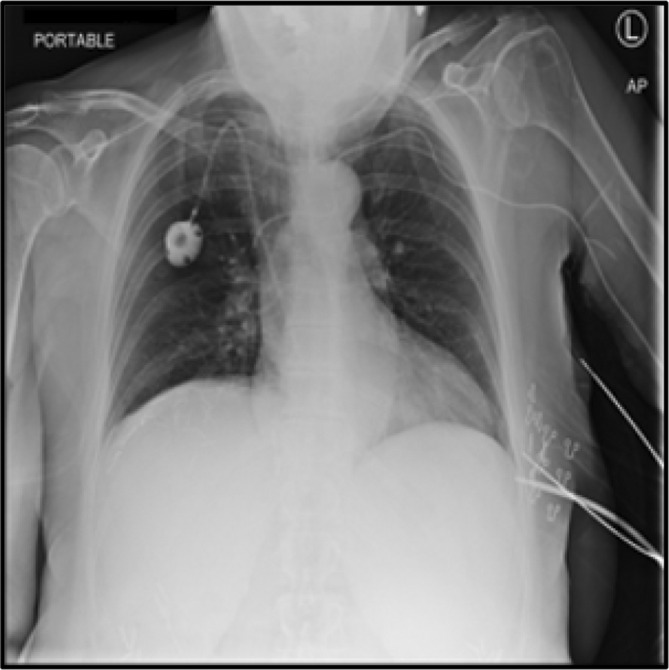
Chest X‐ray radiograph without Pneumonia
4. PROPOSED MODEL
For the medical tests the patient visits the radiology center for chest radiography. The X‐ray technician will take the chest X‐ray Image of the patient and the CXR would be further assessed by the Radiologist. The diagram of the proposed model is shown in Figure 3.
FIGURE 3.
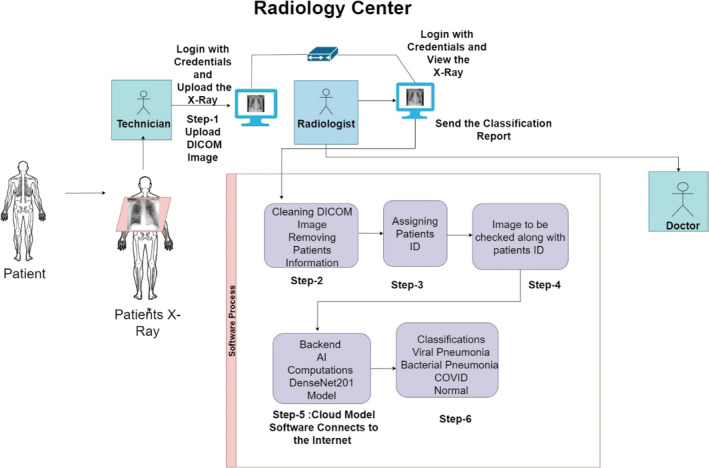
Proposed model for computer‐aided diagnosis
Chest X‐ray utilizes a small dose of ionizing radiation (0.1 mSv) in order to capture the CXR Images. CXR Imaging produces two‐dimensional images of the heart, lungs, airway, and blood vessels, as well as the bones of the spine and chest. The CXR will assist the medical provider in making a diagnosis and can provide additional information that aids in the treatment of the patient. In this method of diagnosis, the predicted symptom/disease is identified, and treatment is given accordingly. The proposed framework as shown in Figure 1 will aid radiologists by providing better feedback on CXR Images. In the framework, The X‐ray technician will take the chest X‐ray of the patient and upload it on the software using his login credentials. In the next step, the radiologist will log in to the software using his user credentials and the Radiologist will clean the Digital Imaging and Communication in Medicine (DICOM) Image which will deidentify patient record. After the removal of the information, the image is assigned a patients identification number by the software which will further assist the medical facilities for the better management of the data. The radiologist will check the image to which the patient's record number is attached and after approval from the radiologist, the software will connect to the internet. The image is then now uploaded on the cloud platform which is the framework for the proposed DenseNet201 Model. The result of the proposed DenseNet‐201 would be the classification in terms of chest X‐ray Images as Pneumonia, Normal or COVID‐19. The classification result would be generated by the software and shown as feedback to the radiologist. The classification report is sent to the doctor by the radiologist. The doctor shall prescribe the necessary medications and treatments to the patient and also recommends for the further medical tests if necessary. As shown below, Figure 4 demonstrates the flowchart of the proposed software model.
FIGURE 4.
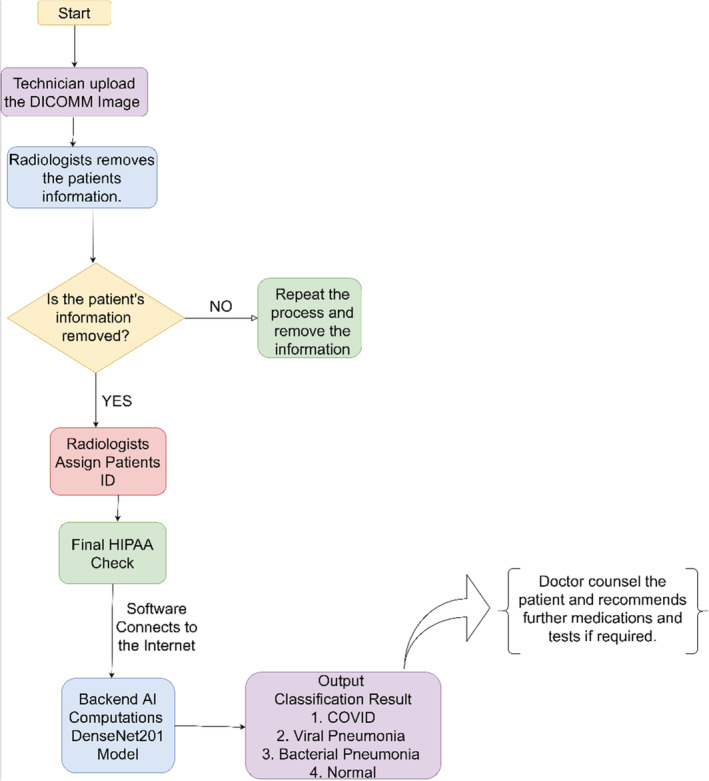
Flowchart of proposed software model
The flowchart as shown in Figure 4 begins with the uploading of the DICOM Image by the technician which further goes to the radiologist for removal of the patient's information to protect from data‐breach and to comply with HIPAA. Once the patient's information from the DICOM file is removed, the software will check the image again and if the information is still not removed, the process will repeat. If the patient's information is removed, the radiologist shall assign a deidentified record number and will send it to the radiologist for the final check. Once the radiologist approves and assigns the patient's record number, the image shall be uploaded to the AI module and the software shows the output in terms of the classification. Observing the results, the doctor consults the patient and can assist in further medications.
In our day‐to‐day life, we come up with the medical diagnosis performed by multiple medical expert's views. If we have the feedback from the proposed model, we reach to a more reliable conclusion. In our proposed model, transfer on DenseNet was utilized to train the algorithm to detect the presence of viruses in the chest X‐ray images. The proposed model consists of three additional layers which include a flatten layer and two dense layers consisting of three output nodes. The output nodes in our model describes the classifications as Normal, Pneumonia, COVID‐19. In the model, the dataset which was utilized was taken from Kaggle. In order to train the model, 16 000 chest X‐ray images were used. The images used were resized to (224*224) pixels to match the dimensions of the algorithm.
DenseNet201 is divided into four blocks, each of which includes a connection to prior feature maps, allowing for feature propagation and reuse. DenseNet201 generally allows influence from the previous layers in the model which is sometimes referred to as “Collective Knowledge.” The advantage of Dense Convolutional Network as shown in the Figure 5 is that it requires less parameters as compared to the other models of CNN. The advantages of DenseNet201 are High Computational Efficiency and Memory Efficiency. The diagram of the DenseNet Block is shown in Figure 5 and the backend computations which is the cloud model as described in the proposed model diagram (Figure 1) is shown in Figure 5.
FIGURE 5.

Basic dense net block
The detailed overview of the working of Dense Blocks in the proposed DenseNet201 model is represented in the Figure 6. In the proposed model there are four dense blocks used which are interconnected to each other. The images are given as an input to the DenseBlock‐1 which passes through the convolution block. The convolutional block is generally used for detecting small features of an image and the pooling layer acts as a layer reducing feature map sizes. The output of the pooling layer is given as the input to the Dense Block‐2 and the same process is repeated for all the four blocks. In the proposed model, the convolution layers are used for the edge detection and the output obtained is a feature map which generates at each Dense Block which assists to train our model with more accuracy. The four Dense Blocks utilized here results in higher accuracy in classification of the image. The detailed explanation of the image classification is shown in Figure 7.
FIGURE 6.

Backend artificial intelligence computations (Dense Net‐201 Module)
FIGURE 7.
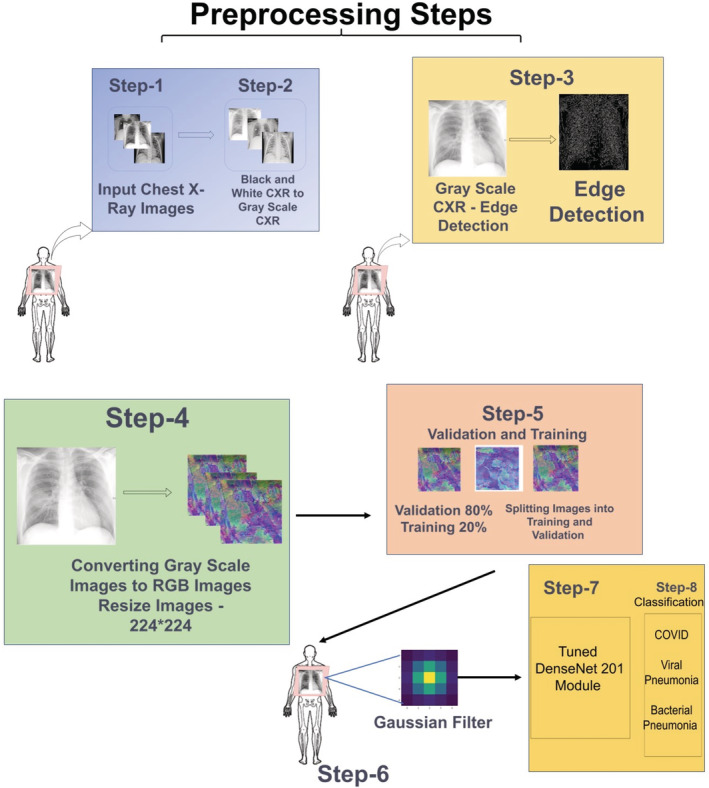
Comprehensive overview for image classification
Figure 7 shows the comprehensive overview of the process of the Backend AI Computations in the proposed model. The initial stage as described in Figure 7 consists of preprocessing steps. In preprocessing the chest X‐ray images are first transformed into Grayscale Images and then the Edge Detection is performed. Further, the images are converted from Grayscale and resized to 224*224 pixels. The next stage is considered to the training and validation. In this stage, the images are split into the Validation and Training where 80% of the images are used for validation and 20% images are used for Training Set. The next stage is the filtration stage where the Gaussian filter is being used. In the fourth stage, the images go to the Dense Net‐201 module for training and validation. The output of the DenseNet‐201 is the classification of the images as Pneumonia, COVID‐19 or Normal, which acts as feedback to the Radiologist.
In the proposed model, the transfer learning 45 on DenseNet201 was used by taking the weights saved from training on ImageNet and freezing them during training. Transfer learning is advantageous in that it prevents overfitting by being previously trained on millions of images and having the outer layers frozen during the actual training. The DenseNet201 model is more efficient in training since it has fewer trainable parameters to ResNet50 while being similarly accurate. DenseNet201 has four dense blocks which all have connection to previous feature maps. By allowing a direct link from any given layer to all previous layers, DenseNet201 allows influence from previous layers sometimes referred to as a “collective knowledge” and epochs and is saved. The DenseNet201 architecture is shown in Figure 8.
FIGURE 8.

DenseNet architecture for ImageNet. K = 32, each convolution layer corresponds to sequence BN‐ReLU‐Conv
Dense Net architecture for ImageNet is as described in Figure 8 with the growth rate for all the corresponding networks (k) = 32. Here as shown, each convolution layer as described in Table 2 corresponds to the sequence BN‐ReLU‐Conv while the very first convolution layer with the size of the filter 7*7 corresponds to the Conv‐BN‐ReLU. The full model was frozen, and the three layers were added. The three layers includes a flatten layer followed by two dense layers which has three output nodes. In the array, all the images were stored, and then random splitting of the images was done as training (70%), validation (20%), and testing (10%). On the last three layers, the whole model was trained for 100 epochs and was saved. The nomenclature of the Dense Net −201 is as described in Table 3.
TABLE 3.
Nomenclature of the DenseNet‐201
| Layer name | Calculation of number 201 |
|---|---|
| Convolution and pooling layer | 5 |
| 3 Transition layer | 6,12,48 |
| 1 Classification Layer | 32 |
| 2 Dense Block | (1*1 and 3*3 convolution) |
| Total DenseNet201 | 5 + (6 + 12 + 48 + 32) *2 = 201 |
Hyperparameter tuning: The proposed model fine tuning for transfer learning using Dense Net‐201 as a source dataset, the base model which was created to compare the success metrics of each model and to develop a common architecture for each model. In the proposed model, the hyperparameters and design of the fully connected layers remained the same. Table 4 Hyperparameter tuning for proposed Dense Net‐201 architecture lists the values for each attribute and architecture that was previously discussed.
TABLE 4.
Hyperparameter tuning for proposed DenseNet‐201 architecture
| Sr. No. | Attribute/Architecture | Value |
|---|---|---|
| 1 | Source weights | ImageNet |
| 2 | Batch size | 150 |
| 3 | Epochs | 100 |
| 4 | Architecture (Number of neurons in hidden layer) | 128 |
| 5 | Learn rate | 00.001 |
| 6 | Optimizer | Softmax |
4.1. Preprocessing
The associated images are normalized and resized to fit the dimensions of the intended algorithm, 224*224. The reason behind using 224*224 images is that it requires less memory and computing power. The image size of the input image is important the larger the image, the more parameters the neural network will have to handle. More parameters may lead to several problems. One of the major problems is need for more computing power(memory). CNNs are memory‐intensive, especially for training. If the model is running out of memory, memory can be reduced by reducing batch size, reducing the input image resolution, reducing the number of layers of the network, or doing some down sampling very early on (but reducing layers or down sampling will impact performance). In the proposed model, there are a total of 16,000 images divided into COVID‐19 = 3616, Normal = 10 192, Pneumonia = 1345. Furthermore, it is bifurcated as 70% validation, 20% training, 10% testing. The whole process is done three times to make the three subsets. The images are shuffled and split into Validation, Testing and Training sets. If there is a case where the same patients CXR images are in both test, and training data, then there is a chance that the result obtained will be overly optimistic due to the overlap of the patient. The folders of CXR Images have been formed and prepared for training and testing the model. The distribution of the data is as shown in Figure 9.
FIGURE 9.
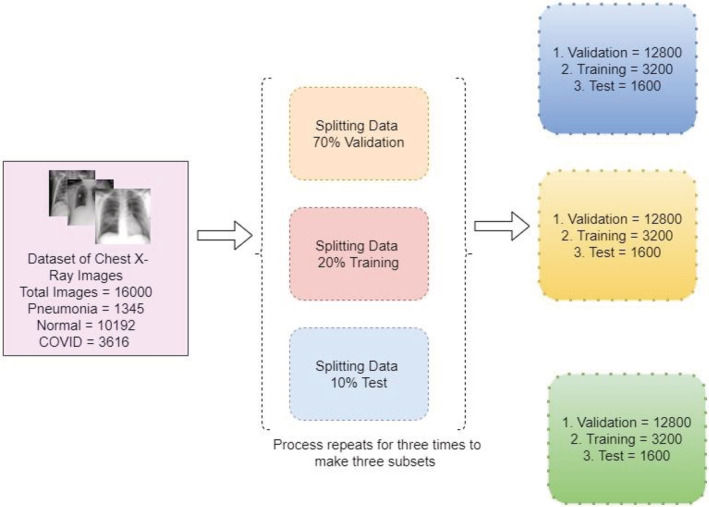
Data distribution for training, validation, and testing
Figure 9 describes the bifurcation of the total images from the dataset utilized and splitting the data into Validation, Training, and Test. This will allow the model for the optimum utilization of the dataset and the model would be trained.
4.1.1. Tools used
We have utilized Jupyter Notebook, Python and TensorFlow 2.2.0. For implementing the DenseNet‐201, TensorFlow, a deep learning library is used and all the training and testing procedures are experimented in Jupyter Notebook.
4.2. Performance metrics
4.2.1. Edge detection
For finding out the boundaries (edge's) of the objects as well as to pull out useful information from the image, Image Processing techniques are used. Here in the proposed model our objects is the lungs, so lungs would be detected. Generally, for pulling out useful information, edge detection is useful which gives us the detailed information of the object. In the proposed model, Sobel Edge Detection algorithm 46 , 47 , 48 is used which is made up of 3*3 convolutional kernels.
Sobel Operator is the Magnitude of the gradient is given by
equation, and the partial derivatives are defined by
| (1) |
| (2) |
Constant c = 2. Here as compared to other gradient operators S x and S y can be applied using convolution masks where,
| (3) |
Here the operator portrays an importance on the pixels that are nearer to the center of the masks. The Sobel Operator is one of the most used operators.
4.2.2. Noise reduction
To reduce the noise and the details from the image, Gaussian blur is applied. Image Convolution techniques are applied with Gaussian kernel, which can be of the size (3*3, 5*5 or 7*7). The Gaussian function with 5*5 Gaussian kernel is represented in Equation (4). For the Gaussian filter, the equation is of the size (2 k + 1)*(2 k + 1) which is represented by the following equation.
| (4) |
where, = standard deviation.
In the computer vision, looking the image through translucent screen is the same as blurring the image. It is generally used to enhance at different scales similar to data augmentation. In gaussian blurring, the process is divided into two parts. In the first part, in a horizontal or a vertical direction, one dimensional kernel is generally used. To blur in the other direction, the same one‐dimensional kernel is used in the second part. Finally, the gained effect is similar to convolving with a two‐dimensional kernel (2D) in single pass. These are also known as low pass filters.
4.3. Evaluation metrics
To understand the machine learning models evaluation metrics are calculated. For the model presented, four metrics Accuracy, Precision, Recall and F1 score are calculated. Predicted Label shows the classification of results as True Positive, False Positive, False Negative, and True Negative.
4.4. Quantitative analysis
Quantitative analysis is a mathematical calculation of the parameters of the model which defines the feasibility and accuracy of the model. The quantitative analysis for the proposed model is divided into five categories as described below.
Classification accuracy:
Accuracy is the most important parameter and is a proportion of correctly calculated observations to the total observations. Normally if the higher accuracy is achieved the model tends to be the best but having a symmetric dataset where false positives and false negatives are equal, other parameters are observed to estimate the execution of the proposed model. 44
| (5) |
-
2
B. Precision:
Precision means the proportion of currently predicted positive observations to the total predicted observations. For every single class there is one precision value. 44 Precision is observed when the predictions given by the proposed model are correct.
| (6) |
-
3
C. Recall:
Recall is said to be the ratio of the results of the model to the actual results. For each classification there is one recall value. To maximize the prediction of a particular class, the recall value in the results is observed. 44
| (7) |
-
4
D. F1 Score:
F1 score is generally known to be the weighted average of the Precision and Recall. F1 score takes false positives and false negatives into consideration. 44 F1 is more useful than studying the accuracy. If the false positive and false negatives have similar costs, accuracy is observed to determine the results.
| (8) |
-
5
E. Sensitivity and specificity:
The model's capability to predict true positives is known as sensitivity and specificity is defined as models ability to predict true negatives. 44
| (9) |
| (10) |
| (11) |
The equations are calculated, and the results are shown in Table 5.
TABLE 5.
Calculation of various parameters
| Conditions | Parameters | |||
|---|---|---|---|---|
| Precision | Recall | F1‐score | Support | |
| Normal | 0.98 | 0.98 | 0.98 | 2027 |
| COVID19 | 0.95 | 0.96 | 0.95 | 738 |
| Viral Pneumonia | 0.95 | 0.94 | 0.95 | 266 |
| Accuracy | ‐ | ‐ | 0.97 | 3031 |
| Macro avg | 0.96 | 0.96 | 0.96 | 3031 |
| Weighted avg | 0.97 | 0.97 | 0.97 | 3031 |
Table 5 indicates the classification of the tested parameters. Parameters includes Precision, Recall, F1 scores and its average in three conditions Normal, COVID‐19 and Viral Pneumonia.
4.5. Convergence analysis
Convergence analysis is dependent on the variables such as weights, error, and accuracy. In our proposed methodology, the convergence analysis is shown in Figure 10A. It shows the epoch versus magnitude (Validation Loss and Validation Accuracy) graph and Figure 10B describes epoch versus magnitude (Training Loss and Training Accuracy) graph. The maximum value of error or accuracy can be 100% which means on the scale of 0 to 1. The SI unit is not utilized to specify error or accuracy. Hence, the term magnitude is taken on Y axis.
FIGURE 10.
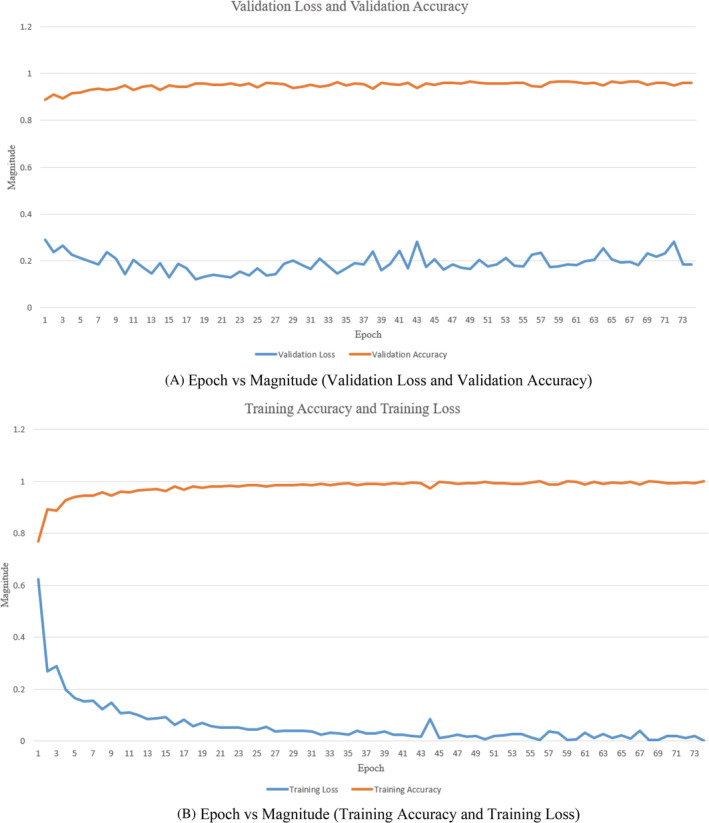
(A) Epoch versus Magnitude (Validation Loss and Validation Accuracy). (B) Epoch versus Magnitude (Training Accuracy and Training Loss)
As shown in Figure 10A,B, the validation loss is lesser than training loss initially, so it depicts this case mentioned below. It is illustrated from the figures that epoch is completed when all of the training data is passed through the network precisely once, and if the data are passed in small batches, each epoch could have multiple backpropagations. Each backpropagation step could improve the model significantly, especially in the first few epochs when the weights are still relatively untrained. As a result, there is lower validation loss in the first few epochs when each backpropagation updates the model significantly.
5. RESULTS AND DISCUSSION
The proposed model was trained on 100 epochs to minimize the overfitting and increase the trained parameters. The transfer learning on DenseNet201 was used by taking the weights saved from Training on ImageNet and freezing them during training. Transfer learning is advantageous as it prevents overfitting by being previously trained on millions of images and having the outer layers frozen during the actual training. The DenseNet201 model is more efficient in training since it has fewer trainable parameters compared to ResNet50 while being similarly accurate. DenseNet201 has four dense blocks which all have a connection to the previous feature maps. By allowing immediate networks from any layer to connect all the previous layers, DenseNet201 allows influence from previous layers sometimes referred to as “collective knowledge”. Python library keras was used to alter the DenseNet. The learning optimizer was used categorical cross entropy optimizer to Adam, the learning rate set to 00.001 and softmax as the activation function. The results of the existing CNN models such as ResNet50, VGG16, and others are compared.
5.1. Confusion matrix
Figure 11 shows the classification of predicted values through confusion matrix which represents the prediction as Viral Pneumonia, COVID or Normal. Figure 11A shows the confusion matrix for classification of COVID‐19 and non‐COVID‐19 Cases. As shown in the figure, 2171 cases were correctly predicted as non‐COVID‐19 by the model and 687 cases were correctly predicted as COVID‐19 cases by the model. Figure 11B shows the confusion matrix for the classification of Normal and Not Normal Images (Not Normal may include COVID‐19, Viral Pneumonia and Bacterial Pneumonia) 1914 cases were predicted as Normal cases and 929 as not normal cases by the model. It also shows that there were 78 wrongly predicted Not Normal cases. Similarly, Figure 11C demonstrates the confusion matrix for Viral Pneumonia and Not Viral Pneumonia cases. The 2756 cases were correctly predicted as Not Pneumonia and 224 cases were predicted as Pneumonia cases. Here Figure 11D shows the combined confusion matrix for a specific disease prediction model. Confusion matrix as represented in the Figure 11D shows that out of 2074 Normal patients, 2062 has been diagnosed by our proposed model and only 12 out of 2074 has been wrongly classified. Correspondingly, out of 700 CXR images of COVID patients, 690 has been diagnosed by our model and only 10 out of 700 were not diagnosed correctly. Similarly, for Pneumonia 252 out of 257 CXR Images were detected correctly and only 5 CXR images were classified incorrectly. The overall accuracy based on the confusion matrix shows 99.1% (3004/3031). The computed Cohen's Kappa coefficient is 98.1%. The detection sensitivity of the proposed model is 98.5% (690/700) and specificity is 98.95% So, the model produces competitive results compared to VGG16 and ResNet50. Figure 12 shows the accuracy of the prediction by the model and the error incurred in certain predictions. The observations from training and validation analysis are as shown in Figure 12.
FIGURE 11.
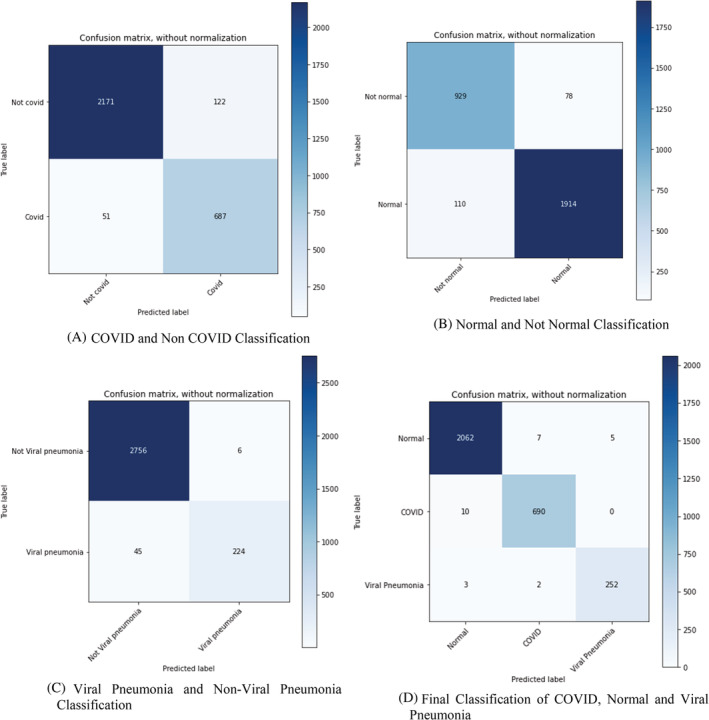
Classification of Predicted Values through Confusion Matrix. (A) COVID and Non COVID Classification. (B) Normal and Not Normal Classification. (C) Viral Pneumonia and Non‐Viral Pneumonia Classification. (D) Final Classification of COVID, Normal, and Viral Pneumonia
FIGURE 12.
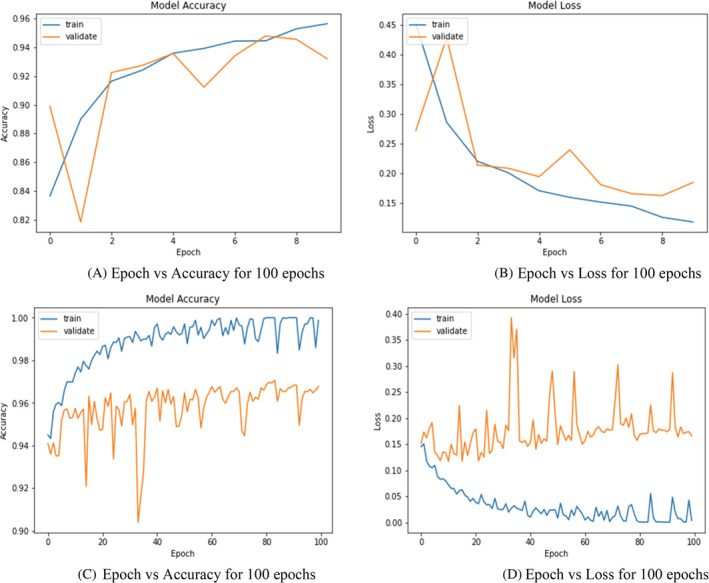
Training and validation analysis over 10 and 100 epochs. (A) Epoch versus accuracy for 100 epochs. (B) Epoch versus Loss for 100 epochs. (C) Epoch versus accuracy for 100 epochs. (D) Epoch versus Loss for 100 epochs
As seen in the Figure 12 is classified into four parts: Training and validation analysis over 10 epochs and 100 epochs. In general model accuracy on training data is expected to be more as it is on a small sample dataset where Validation or Testing data are the whole dataset on which accuracy of the model might be lower as there might be certain outliners edge case in the data which cannot be determined by the algorithm. There are two parameters to be studied: the validation data and the training data. Addition of it shows a learning curve that may represent some overfitting. Perhaps using some digital image processing to the images such as removing the thorax or smoothing the images could help prime the data set to a smoother loss and accuracy curve. Even with the slight over fitting the proposed model produced detection sensitivity of 98.5% with an overall accuracy of 99.1%. the Figure 12A: Epoch versus accuracy describes the model accuracy over 10 epochs. When we train the model the accuracy per epoch goes on increasing but for validating the data there is a spike in accuracy as the epoch increases. Figure 12B describes Epoch versus Loss over 10 epochs. Analyzing Figure 12B shows the model loss over 10 epochs. As we see the learning curve, amount of loss goes on decreasing over the epochs when the model is trained. When examining the training data, as shown in Figure 12C: Model accuracy analysis, the correctness of the data increases with the increase in epoch with a minor variation. As can be seen, validation data increase at first and then dramatically declines as the number of epochs increases. Then there is a big spike, and the variation is much higher than in the training data set. Figure 12D: Model loss analysis shows that model loss decreases with increasing amount of epoch for the training data set but for the validation set there is a huge‐spike, and the loss increases compared to the training data set.
When epoch = 10, the accuracy of the training as well as validation interjects for epochs 2–8 accuracy for both the dataset is consistent at certain iterations which implies that the datapoints at those intervals would be pretty much similar. When epochs = 10, it can be observed from both the graphs that loss and accuracy are inversely proportional so training dataset has higher accuracy and decreasing loss graph while the actual dataset has loss at its peak at iteration 2–4 which indicates that tuning or determining parameters of algorithm defined on training dataset might not be working on actual one. While epoch = 100, values for training and actual dataset does not overlap at all, so even if the datapoints are similar the algorithm behaves differently also it can be observed the values for training dataset are pretty much consistent that is, accuracy between 0.98 to 100 and loss from 0.05 to 0 while the values for the validation datasets are fluctuating.
5.2. The prototype tool
As discussed in the proposed approach, a straightforward application was created for the recognition of the Pneumonia, Normal, COVID Chest X‐ray Images. As shown in Figure 12A‐C, the application will allow any medical facilitator to upload a CXR Image and produce feedback. The application will execute the proposed model and delivers the label for the CXR Images. Accordingly, it will detect the CXR Image and will show the classification in the form of Text as well as it will show the CXR Image. This application would be utilized by the radiologists for classification of the CXR Images. This application can be utilized on platforms like Windows, MAC and Linux as it is developed on python and it is an open‐source platform.
Figure 13A shows the welcome screen of GUI tool. Figure 13B demonstrates the patient details form which is entered by technician and the database is generated in Microsoft Excel to store the patient's information. Figure 13C is the analysis window of GUI where the analysis is performed on GUI Tool and the classification result is displayed.
FIGURE 13.
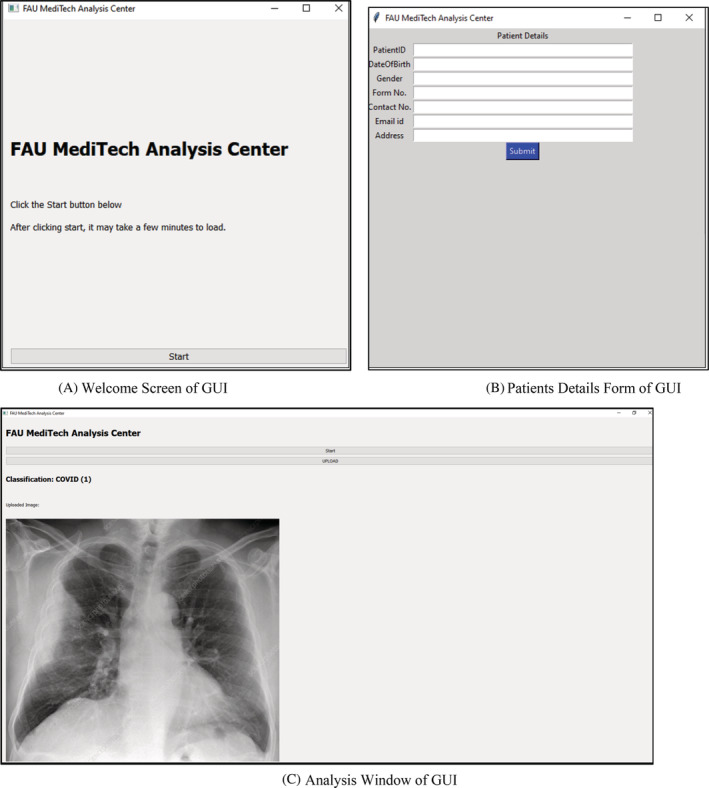
Welcome screen of graphical user interface (GUI). (B) Patients details form of GUI. (C) Analysis Window of GUI
6. CONCLUSION
In this research paper, the proposed software model is framed to assist the radiologists in getting feedback on Chest ‐X‐ray Images (CXR‐Images). The feedback allows the radiologists to confirm the prediction of the disease and give the report to the treating physician. The proposed software model is framed keeping the consideration for HIPAA compliance for maintaining the privacy of the patient's information. The prototype model framed can be utilized in remote places to overcome the shortage of radiologists and to get better feedback. In addition, such models can be utilized to analyze other chest‐related illnesses including tuberculosis, and the same model can also be framed for studying skin lesions. The expansion of the proposed model and the prototype would be a medical Web/Mobile based Application which scans the X‐ray, CT scans, and MRI for giving feedback by looking at millions of images in the database and showing the related images. The feedback would be the medications given to the patient. This future work shall assist Physicians to get feedback on the treatments given so far and to prescribe treatments to patients for better and faster recovery. This bridge will allow physicians across the world to study the various medical treatments given in the past to the patients and their recovery rate. Applications of AI in healthcare will play a massive role in improving public health and medical facilities. The further developments and modifications in the DenseNet‐201 architecture shall also contribute to the recognition of the abnormalities in the hand and spine images and the application developed will recognize the crack in the bones and shall give feedback to the physician or radiologist. These developments will make the novel contribution to the medical community and shall assist the medical facilities.
CONFLICT OF INTEREST
The authors declare no conflicts of interest.
ACKNOWLEDGEMENT
I acknowledge Ms. Shraddha Jain (St. Xavier's College, Ahmedabad) and Mr. Rupesh Andani for their contribution and the Department of CEECS, Florida Atlantic University for their continuous support and motivation for carrying out this project.
Sanghvi HA, Patel RH, Agarwal A, Gupta S, Sawhney V, Pandya AS. A deep learning approach for classification of COVID and pneumonia using DenseNet‐201. Int J Imaging Syst Technol. 2022;1‐21. doi: 10.1002/ima.22812
Contributor Information
Harshal A. Sanghvi, Email: hsanghvi2020@fau.edu.
Riki H. Patel, Email: rikipatel26@gmail.com.
DATA AVAILABILITY STATEMENT
The authors confirm that the data supporting the finding of this study are available within the article and its supplementary material. Raw data that support the findings of this study are available from the corresponding author, upon reasonable request.
REFERENCES
- 1. WHO—Emergencies preparedness, response. World Health Organization . Pneumonia of unknown cause China. 2019. Accessed March 29, 2020. https://www.who.int/csr/don/05‐january‐2020‐pneumonia‐of‐unkowncause‐china/en/?mod=article\_inline
- 2. Wu D, Wu T, Liu Q, Yang Z. The SARS‐CoV‐2 outbreak what we know. Int J Infect Dis. 2020;94:44‐48. [DOI] [PMC free article] [PubMed] [Google Scholar]
- 3. World Health Organization . Weekly epidemiological update on COVID‐19‐29 June 2021, 46th edn. 2021. https://www.who.int/publications/m/item/weekly-epidemiological-update-on-covid-19-29-june-2021
- 4. Team E. The epidemiological characteristics of an outbreak of 2019 novel coronavirus diseases (COVID‐19)—China, 2020. China CDC Weekly. 2020;2(8):113‐122. [PMC free article] [PubMed] [Google Scholar]
- 5. Xie Z. Pay attention to SARS‐CoV‐2 infection in children. Pediatric Invest. 2020;4(1):1‐4. [DOI] [PMC free article] [PubMed] [Google Scholar]
- 6. Wang D, Hu B, Hu C, et al. Clinical characteristics of 138 hospitalized patients with 2019 novel coronavirus–infected pneumonia in Wuhan, China. Jama. 2020;323(11):1061‐1069. [DOI] [PMC free article] [PubMed] [Google Scholar]
- 7. Matthay MA, Zemans RL, Zimmerman GA, et al. Acute respiratory distress syndrome. Nat Rev Dis Primers. 2019;5(1):1‐22. [DOI] [PMC free article] [PubMed] [Google Scholar]
- 8. Nambu A, Ozawa K, Kobayashi N, Tago M. Imaging of community‐acquired pneumonia: roles of imaging examinations, imaging diagnosis of specific pathogens and discrimination from noninfectious diseases. World J Radiol. 2014;6(10):779‐793. [DOI] [PMC free article] [PubMed] [Google Scholar]
- 9. Macera M, De Angelis G, Sagnelli C, Coppola N, COVID V. Clinical presentation of COVID‐19: case series and review of the literature. Int J Environ Res Public Health. 2020;17(14):5062. [DOI] [PMC free article] [PubMed] [Google Scholar]
- 10. Mobarak AM, Miguel E, Abaluck J, et al. End COVID‐19 in low‐and middle‐income countries. Science. 2022;375(6585):1105‐1110. [DOI] [PubMed] [Google Scholar]
- 11. Krause PR, Fleming TR, Longini IM, et al. SARS‐CoV‐2 variants and vaccines. New England J Med. 2021;385(2):179‐186. [DOI] [PMC free article] [PubMed] [Google Scholar]
- 12. Higuchi Y, Suzuki T, Arimori T, et al. Engineered ACE2 receptor therapy overcomes mutational escape of SARS‐CoV‐2. Nat Commun. 2021;12(1):1‐13. [DOI] [PMC free article] [PubMed] [Google Scholar]
- 13. Sironi M, Hasnain SE, Rosenthal B, et al. SARS‐CoV‐2 and COVID‐19: a genetic, epidemiological, and evolutionary perspective. Infect Genet Evol. 2020;84:104384. [DOI] [PMC free article] [PubMed] [Google Scholar]
- 14. Openshaw JJ, Travassos MA. COVID‐19 outbreaks in US immigrant detention centers: the urgent need to adopt CDC guidelines for prevention and evaluation. Clin Infect Dis. 2021;72(1):153‐154. [DOI] [PMC free article] [PubMed] [Google Scholar]
- 15. Meng X, Liu Y. Chest imaging tests versus RT‐PCR testing for COVID‐19 pneumonia: there is no best. Only Better Fit Radiol. 2020;297:203792. [DOI] [PMC free article] [PubMed] [Google Scholar]
- 16. Bustin SA. Absolute quantification of mRNA using real‐time reverse transcription polymerase chain reaction assays. J Mol Endocrinol. 2000;25(2):169‐193. [DOI] [PubMed] [Google Scholar]
- 17. Bejnordi BE, Veta M, Van Diest PJ, et al. Diagnostic assessment of deep learning algorithms for detection of lymph node metastases in women with breast cancer. Jama. 2017;318(22):2199‐2210. [DOI] [PMC free article] [PubMed] [Google Scholar]
- 18. Goceri, E. , & Goceri, N . (2017). Deep learning in medical image analysis: recent advances and future trends.
- 19. Litjens G, Kooi T, Bejnordi BE, et al. A survey on deep learning in medical image analysis. Med Image Anal. 2017;42:60‐88. [DOI] [PubMed] [Google Scholar]
- 20. Bhandary A, Prabhu GA, Rajinikanth V, et al. Deep‐learning framework to detect lung abnormality–a study with chest X‐ray and lung CT scan images. Pattern Recogn Lett. 2020;129:271‐278. [Google Scholar]
- 21. Kuchana M, Srivastava A, Das R, Mathew J, Mishra A, Khatter K. AI aiding in diagnosing, tracking recovery of COVID‐19 using deep learning on chest CT scans. Multimed Tools Appl. 2021;80(6):9161‐9175. [DOI] [PMC free article] [PubMed] [Google Scholar]
- 22. Rahman T, Khandakar A, Qiblawey Y, et al. Exploring the effect of image enhancement techniques on COVID‐19 detection using chest X‐ray images. Comput Biol Med. 2021;132:104319. [DOI] [PMC free article] [PubMed] [Google Scholar]
- 23. Apostolopoulos ID, Mpesiana TA. Covid‐19: automatic detection from X‐ray images utilizing transfer learning with convolutional neural networks. Phys Eng Sci Med. 2020;43(2):635‐640. [DOI] [PMC free article] [PubMed] [Google Scholar]
- 24. Rajpurkar, P. , Irvin, J. , Zhu, K. , et al. Chexnet: radiologist‐level pneumonia detection on chest X‐rays with deep learning. arXiv preprint arXiv:1711.05225. 2017.
- 25. Wang X, Peng Y, Lu L, Lu Z, Bagheri M, Summers RM. ChestX‐ray8: hospital‐scale chest X‐ray database and benchmarks on weakly‐supervised classification and localization of common thorax diseases. In Proceedings of the IEEE Conference on Computer Vision and Pattern Recognition. 2017:2097–2106.
- 26. Chouhan V, Singh SK, Khamparia A, et al. A novel transfer learning based approach for pneumonia detection in chest X‐ray images. Appl Sci. 2020;10(2):559. [Google Scholar]
- 27. Jaiswal AK, Tiwari P, Kumar S, Gupta D, Khanna A, Rodrigues JJ. Identifying pneumonia in chest X‐rays: a deep learning approach. Measurement. 2019;145:511‐518. [Google Scholar]
- 28. Singh D, Kumar V, Kaur M. Classification of COVID‐19 patients from chest CT images using multi‐objective differential evolution–based convolutional neural networks. Eur J Clin Microbiol Infect Dis. 2020;39(7):1379‐1389. [DOI] [PMC free article] [PubMed] [Google Scholar]
- 29. Shan F, Gao Y, Wang J, et al. Lung infection quantification of COVID‐19 in CT images with deep learning. 2020. arXiv preprint arXiv:2003.04655.
- 30. Li L, Qin L, Xu Z, et al. Artificial intelligence distinguishes COVID‐19 from community acquired pneumonia on chest CT. Radiology. 2020;296(2):E65‐E72. [DOI] [PMC free article] [PubMed] [Google Scholar]
- 31. Albahli S, Yar GNAH. Fast and accurate COVID‐19 detection along with 14 other chest pathology using: multi‐level classification. J Med Internet Res. 2021;23:e23693. [DOI] [PMC free article] [PubMed] [Google Scholar]
- 32. Makris A, Kontopoulos I, Tserpes K. COVID‐19 detection from chest X‐ray images using Deep Learning and Convolutional Neural Networks. In 11th hellenic conference on artificial intelligence. 2020:60–66.
- 33. Rahimzadeh M, Attar A. A modified deep convolutional neural network for detecting COVID‐19 and pneumonia from chest X‐ray images based on the concatenation of Xception and ResNet50V2. Inf Med Unlocked. 2020;19:100360. [DOI] [PMC free article] [PubMed] [Google Scholar]
- 34. Wang L, Lin ZQ, Wong A. Covid‐net: a tailored deep convolutional neural network design for detection of covid‐19 cases from chest X‐ray images. Sci Rep. 2020;10(1):1‐12. [DOI] [PMC free article] [PubMed] [Google Scholar]
- 35. Jain R, Gupta M, Taneja S, Hemanth DJ. Deep learning based detection and analysis of COVID‐19 on chest X‐ray images. Appl Int. 2021;51(3):1690‐1700. [DOI] [PMC free article] [PubMed] [Google Scholar]
- 36. Gangwani D, Liang Q, Wang S, Zhu X. An Empirical Study of Deep Learning Frameworks for Melanoma Cancer Detection using Transfer Learning and Data Augmentation. In 2021 IEEE International Conference on Big Knowledge (ICBK). IEEE. 2021:38–45. [Google Scholar]
- 37. Sethy PK, Behera SK. 2020. Detection of coronavirus disease (covid‐19) based on deep features.
- 38. Liu KC, Xu P, Lv WF, et al. CT manifestations of coronavirus disease‐2019: a retrospective analysis of 73 cases by disease severity. Eur J Radiol. 2020;126:108941. [DOI] [PMC free article] [PubMed] [Google Scholar]
- 39. Minaee S, Kafieh R, Sonka M, Yazdani S, Soufi GJ. Deep‐COVID: predicting COVID‐19 from chest X‐ray images using deep transfer learning. Med Image Anal. 2020;65:101794. [DOI] [PMC free article] [PubMed] [Google Scholar]
- 40. Mahmud T, Rahman MA, Fattah SA. CovXNet: a multi‐dilation convolutional neural network for automatic COVID‐19 and other pneumonia detection from chest X‐ray images with transferable multi‐receptive feature optimization. Comput Biol Med. 2020;122:103869. [DOI] [PMC free article] [PubMed] [Google Scholar]
- 41. Khan AI, Shah JL, Bhat MM. CoroNet: a deep neural network for detection and diagnosis of COVID‐19 from chest X‐ray images. Comput Methods Programs Biomed. 2020;196:105581. [DOI] [PMC free article] [PubMed] [Google Scholar]
- 42. Duran‐Lopez L, Dominguez‐Morales JP, Corral‐Jaime J, Vicente‐Diaz S, Linares‐Barranco A. COVID‐XNet: a custom deep learning system to diagnose and locate COVID‐19 in chest X‐ray images. Appl Sci. 2020;10(16):5683. [Google Scholar]
- 43. Ozturk T, Talo M, Yildirim EA, Baloglu UB, Yildirim O, Acharya UR. Automated detection of COVID‐19 cases using deep neural networks with X‐ray images. Comput Biol Med. 2020;121:103792. [DOI] [PMC free article] [PubMed] [Google Scholar]
- 44. Das AK, Ghosh S, Thunder S, Dutta R, Agarwal S, Chakrabarti A. Automatic COVID‐19 detection from X‐ray images using ensemble learning with convolutional neural network. Pattern Anal Appl. 2021;24(3):1111‐1124. [Google Scholar]
- 45. Jadon, S. (2021). COVID‐19 detection from scarce chest X‐ray image data using few‐shot deep learning approach. In Medical Imaging 2021: Imaging Informatics for Healthcare, Research, and Applications. International Society for Optics and Photonics. 11601:116010X. [Google Scholar]
- 46. Basha SH, Anter AM, Hassanien AE, Abdalla A. Hybrid intelligent model for classifying chest X‐ray images of COVID‐19 patients using genetic algorithm and neutrosophic logic. Soft Comput. 2021;1‐16. [DOI] [PMC free article] [PubMed] [Google Scholar] [Retracted]
- 47. Anter AM, Oliva D, Thakare A, Zhang Z. AFCM‐LSMA: new intelligent model based on Lévy slime mould algorithm and adaptive fuzzy C‐means for identification of COVID‐19 infection from chest X‐ray images. Adv Eng Inform. 2021;49:101317. [Google Scholar]
- 48. Hassanien AE, Darwish A, Gyampoh B, Abdel‐Monaim AT, Anter AM. The Global Environmental Effects during and beyond COVID‐19. Springer International Publishing; 2021. [Google Scholar]
Associated Data
This section collects any data citations, data availability statements, or supplementary materials included in this article.
Data Availability Statement
The authors confirm that the data supporting the finding of this study are available within the article and its supplementary material. Raw data that support the findings of this study are available from the corresponding author, upon reasonable request.


