

Abstract
SARS‐CoV‐2 diagnosis is a cornerstone for the management of coronavirus disease 2019 (COVID‐19). Numerous studies have assessed saliva performance over nasopharyngeal sampling (NPS), but data in young children are still rare. We explored saliva performance for SARS‐CoV‐2 detection by RT‐PCR according to the time interval from initial symptoms or patient serological status. We collected 509 NPS and saliva paired samples at initial diagnosis from 166 children under 12 years of age (including 57 children under 6), 106 between 12 and 17, and 237 adults. In children under 12, overall detection rate for SARS‐CoV‐2 was comparable in saliva and NPS, with an overall agreement of 89.8%. Saliva sensitivity was significantly lower than that of NPS (77.1% compared to 95.8%) in pre‐school and school‐age children but regained 96% when considering seronegative children only. This pattern was also observed to a lesser degree in adolescents but not in adults. Sensitivity of saliva was independent of symptoms, in contrary to NPS, whose sensitivity decreased significantly in asymptomatic subjects. Performance of saliva is excellent in children under 12 at early stages of infection. This reinforces saliva as a collection method for early and unbiased SARS‐CoV‐2 detection and a less invasive alternative for young children.
INTRODUCTION
Diagnosis for SARS‐CoV‐2 is a cornerstone in the management of coronavirus disease 2019 (COVID‐19) (Hu et al., 2021). Accurate and prompt testing of children is a major public health challenge given the viral spread in this age group, even more so in the context of new highly contagious variants (Koelle et al., 2022; Zachariah, 2022). The focus is now put on pre‐school children who are mostly not vaccinated as of today (Malcangi et al., 2022). They are very frequently asymptomatic or display non‐specific symptoms thus qualifying for repeated SARS‐CoV‐2 testing. An easy and well‐accepted testing procedure would thus be highly useful in school systems to limit viral transmission and prevent school closure.
Nasopharyngeal (NP) swabs (NPS) are the gold standard specimen for the diagnosis of SARS‐CoV‐2 infection. However, NP swab collection is an unpleasant procedure that children and parents accept reluctantly, especially when reiterated testing is advised to ascertain negativity. As a result, saliva sampling that avoids unnecessary discomfort is particularly attractive in children for repeated and widespread screening. Saliva collection has also a practical advantage since it can be performed quickly by the parents or any other referent adult (Caixeta et al., 2021).
Numerous studies have assessed saliva performance over nasopharyngeal sampling in unstratified populations, mainly in adults. Meta‐analyses find an overall high performance for saliva sampling, acknowledging, as a whole, a sensitivity of around 86% as compared to nasopharyngeal/oropharyngeal swabs (NPS) (Atieh et al., 2021; Bastos et al., 2021; Cañete et al., 2021; Ibrahimi et al., 2021; Lee, Herigon, Benedetti, Pollock, et al., 2021; Tsang et al., 2021). Data in adolescents and children are scarcer. In the paediatric population, saliva sensitivity varies widely according to the different studies, ranging from 47% to 96% (Al Suwaidi et al., 2021; Banerjee et al., 2021; Borghi et al., 2021; Felix et al., 2022; Fougère et al., 2021; López‐Martínez et al., 2020; Oliver et al., 2021; Yee et al., 2021). These discrepancies could be linked to sampling, differences in test methods and enrolments, but may also unmask dissimilar saliva performance in younger children as compared to adolescents.
As of today, only three studies have reported specific data in children under 12 years of age, including pre‐school children (Fougère et al., 2021; Oliver et al., 2021; Yee et al., 2021), and yielded heterogenous results from 85.2% (Fougère et al., 2021) to 47.6% (Oliver et al., 2021). Interestingly, Yee et al. reported comparable performance of saliva and NPS, with a positive percent agreement above 82% for both, based on a composite gold standard of any positive test from either NPS or saliva (Yee et al., 2021). A single study reported data in pre‐school children and highlighted a drastic drop in saliva sensitivity down to 25% (Fougère et al., 2021). However, all these results stemmed from small cohorts and none reported on saliva performance according to the time interval from initial infection, which is a crucial point to determine the relevance of the test for diagnosis.
To fill this gap, we initiated a study to compare saliva with NPS for diagnosing COVID‐19 in younger children, including children <6 years of age, in comparison to adolescents and adults. We explored the performance of saliva sampling for SARS‐CoV‐2 detection by RT‐PCR and studied specifically its variation according to both the time interval from initial symptoms and patient serological status.
EXPERIMENTAL PROCEDURES
Population study
The current study relies on two separate campaigns of enrolment. During the first campaign (child/parent cohort), between October and December 2020, 95 children and 34 accompanying parents were prospectively enrolled. These were hospitalized or outpatient children presenting in Parisian hospitals for any reason including ambulatory monitoring. Paired NP and saliva samples were systematically collected from the child and any volunteering accompanying parent for subsequent SARS‐CoV2 detection by RT‐PCR, and a SARS‐CoV‐2 serology was performed when agreed.
During the second campaign (family cohort), between April and July 2021, an ‘index children’ population was constituted from 128 children identified with an initial positive RT‐PCR or antigenic NPS test following symptoms, or screening as contact case or during national screening campaigns. Their siblings and parents were enrolled as contact cases for longitudinal home follow‐up, making up a total of 535 individuals enrolled. The index cases and their families were enrolled as soon as possible, for example, 1–3 days after initial positivity of the index case. Saliva sampling for subsequent SARS‐CoV‐2 detection by RT‐PCR and a SARS‐CoV‐2 serology was performed on the day of inclusion (D0). Paired NP sampling was performed when accepted. Saliva sampling (and NP if agreed) was performed at 3 (D3), 7 (D7), 15 (D15) and 45 (D45) days post‐inclusion, for both index cases and family members. A final SARS‐CoV‐2 serology was performed at D45.
For both campaigns, demographic and clinical data were collected including age, gender, previous vaccination, previous COVID‐19 infection (defined by a RT‐PCR or a serology positive test at least 60 days before enrolment) and clinical status, for example, asymptomatic or symptomatic, focusing on the initial symptom. Patients with paediatric inflammatory multisystem syndrome (PIMS), or severe symptoms requiring intensive care unit admission, were excluded from the analysis.
Informed consent from adults and for the children under 18 years from the legal guardians were mandatory for inclusion. This study protocol was approved by the ethics committee of Sud Mediterranée V (n°20.14.62339) and was registered (clinicaltrails.gov identifier; NCT04355533).
Sample collection
Specimens for RT‐PCR testing were collected under the supervision of a healthcare professional, following a standard procedure. Subjects had to spit up to 3 ml of saliva without coughing after at least 2 h fasting and 30 min without drinking, smoking or chewing gum. For the young non‐cooperating children under 3 years of age, a pipette was used to collect saliva in the gingival fold. Saliva was stored at room temperature for a maximum of 12 h or at 4°C. The healthcare professional collected concomitantly NP swabs for RT‐PCR in 3 ml of viral transport medium (EsWab) and a blood sample for serology if required. RT‐PCR analyses were performed the same day or the next morning.
Quantitative SARS‐CoV‐2 PCR
Viral RNA was extracted from 200 μl of naso‐pharyngeal transport medium and 200 μl of saliva sample with the Easy‐Mag extractor (Biomérieux, Marcy l'Etoile). The 10 μl of RNA extract was used for RNA amplification with the SARS‐CoV‐2 R‐gene assay (Argene Biomérieux), which amplifies two nucleic acid targets, one from the N gene and one from the RdRP gene. For some samples, usually those with low viral load, the N gene was amplified and the RdRP gene was not amplified. Such samples were retested and the result was considered as positive only if the N gene amplification was confirmed in the second replica. For positive samples, viral load was estimated according to the C T value of amplification of the N gene target as low, intermediate, high or very high for CT values of ≥35, ≥30–<35, ≥25–<30, <25, respectively. PCR detecting mutation E484K and mutation N501Y on the spike gene was performed on each new positive sample (TIBMolBio, Roche, France) with C T value <25 C T.
A participant was deemed to be positive for SARS‐CoV‐2 if test results for either saliva or NPS were positive. Specimens with indeterminate, invalid, or missing results (including saliva specimens with insufficient volume for testing) were considered non‐assessable and excluded from analysis.
SARS‐CoV‐2 serology
The Alinity SARS‐CoV‐2 IgG II Quant was used to detect IgG against the spike (S1) protein from February 2021. The Abbott test recognizes antibodies directed against the receptor‐binding domain (RBD). Antibodies against the spike protein were assessed retrospectively in sera from patients enrolled before February 2021. Thresholds for positivity were ≥50 UA (7.1 BAU)/ml for anti‐S antibodies.
Data analysis
To compare the performance of NP and saliva sampling for SARS‐CoV‐2 detection, we used the RT‐PCR results (NPS/saliva) obtained at D0 in the population of the first campaign and from the first NPS/saliva sampling matching pair in the population of the second campaign. As indicated in Table S2, 53 out of 449 individuals had their first available saliva‐NPS pairs collected either at D3, D7, D15 or D45 from the time of family enrolment.
Positivity was retained if SARS‐CoV‐2 was detected by RT‐PCR using either of the two sampling methods. Quantitative data were expressed as medians [interquartile range] (range), and qualitative data as numbers (percentages). The diagnostic accuracy of the tests was evaluated by calculating their respective sensitivities. Confidence intervals were calculated by the exact binomial method.
To achieve a prospective unbiased assessment of sensitivities, we refined our analysis by excluding individuals enrolled with a previous known positive SARS‐CoV‐2 PCR status, that is, essentially index cases of the second campaign. Hence, results will be presented both for the overall population and for this selected population with no previously documented positive SARS‐CoV‐2 RT‐PCR (‘No Prior Positive RT‐PCR’) subjects.
Subgroup analyses were performed according to: (i) age group (ii) serology results performed on the same day when available, (iii) no prior positive RT‐PCR group, (iv) presence of symptoms on the day of testing, and (v) the time of enrolment campaign. Quantitative variables were compared with Wilcoxon's test, with a significance level of 5% and qualitative data using Chi‐squared or Fisher's exact test as appropriate. The sensitivities of the two sampling tests were compared using the McNemar's test. The statistical analysis was performed using R software (http://cran.r-project.org/).
RESULTS
Patients description
Over both campaigns, October to December 2020 and April to July 2021, a total of 664 individuals were enrolled among whom 509 had at least one paired NP/saliva sampling available and 416 a serology matching this sampling in time. The distribution of the population and how the first available NPS/saliva pairs were collected during the two enrolment campaigns are shown in Figure 1 and Tables S1 and S2. Refusal to perform NP sampling led to exclusion of 155 individuals for which no sampling pair was available, among whom 80 children under 12 years of age (of whom 24 were saliva PCR+). Ninety‐three serologic samplings were lacking, mainly because of blood puncture refusal by the participants (41 children under 12). There was a single failure for saliva sampling in one infant.
FIGURE 1.
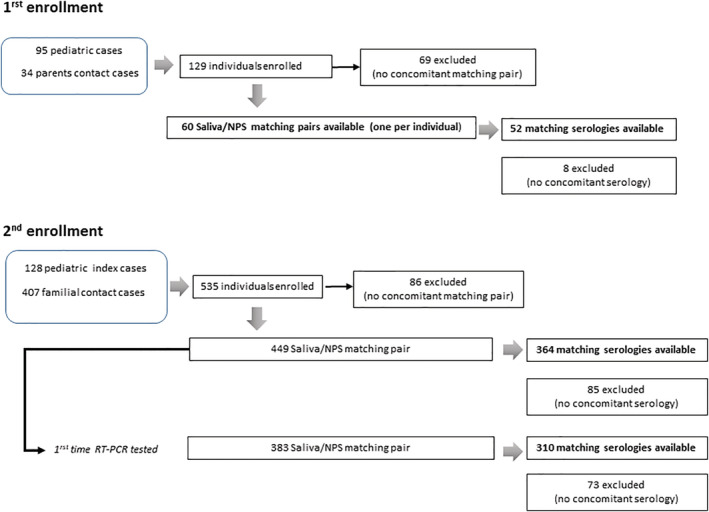
Flow‐chart scheme for each enrolment campaign
The 509 first paired samples were mainly collected at D0 and D45 visits (Table S2), from 166 children under 12 years of age, 106 between 12 and 17 years of age, and 237 adults. A combined NPS/saliva/serology was available for 125 children under 12, 90 children between 12 and 17, and 201 adults. When only the ‘No Prior Positive RT‐PCR’ were considered in this population (i.e. exclusion of the 66 paediatric index cases enrolled with a known RT‐PCR COVID‐19 status and having an available paired sampling), a total of 443 sample pairs remained, including 133 from children under 12 years of age and 73 from children between 12 and 17. Among these, a combined NPS/saliva/serology was available for 98 children under 12 and 63 between 12 and 17 years of age. Our study included 57 children under 6, whose characteristics are depicted in Supplemental materials S1 and Table S3.
Characteristics of the subjects included in the analysis are shown according to age distribution in Table 1, and Table S3, and according to enrolment in the two campaigns in Table S4. Median patient age was 16 years (ranging from 3 months to 79 years). The second campaign, including all the household contact cases, comprised by design more adults than the first campaign (median age 17 years vs. 10 years for the first campaign), as well as significantly more asymptomatic cases (Table S4).
TABLE 1.
Subject characteristics stratified by age groups for the whole study population. Comparison for all age classes
| Characteristics | 0–11 yo | 12–17 yo | ≥18 yo | p | Overall population |
|---|---|---|---|---|---|
| N = 166 | N = 106 | N = 237 | N = 509 | ||
| Sex ratio M/F | 82/84 | 53/53 | 105/132 | 0.48 | 240/269 |
| Age, median [IQR] (range) | 7 [4–10] (0.03–11) | 14 [13–15] (12–17) | 42 [38– 46] (18–79) | ‐ | 16 [10–42] (0.03–79) |
| Comorbidities | |||||
| Chronic respiratory disease (including asthma) | 17 (10.8%) | 11 (10.7%) | 16 (7.3%) | 0.42 | 44 (9.1%) |
| Transplantation and immunodepression | 2 (1.2%) | 3 (3%) | 3 (1.4%) | 0.58 | 8 (1.6%) |
| Others | 0 (0%) | 0 (0%) | 9 (4.3%) | 0.007 | 9 (2.1%) |
| Previous COVID infection diagnosed (positive RT‐PCR or serology at least 60 days before) | 3 (1.8%) | 0 (0%) | 5 (2.1%) | 0.42 | 8 (1.6%) |
| Symptoms | |||||
| Asymptomatic at time of collection | 74 (46%) | 35 (34%) | 107 (45.7%) | 0.1 | 216 (43.4%) |
| Symptomatic at time of collection | 87 (54%) | 68 (66%) | 127 (54.3%) | 282 (56.6%) | |
| Type of symptoms | |||||
| General:fever, chills, asthenia | 52 (59.8%) | 29 (42.6%) | 70 (55.1%) | 0.09 | 151 (53.5%) |
| Respiratory | 35 (40.2%) | 15 (22.1%) | 43 (33.9%) | 0.056 | 93 (33%) |
| Intestinal | 21 (24.1%) | 10 (14.7%) | 21 (16.5%) | 0.24 | 52 (18.4%) |
| Ear, nose and throat | 38 (43.7%) | 37 (54.4%) | 62 (48.8%) | 0.41 | 137 (48.6%) |
| Others (including dermatologic, renal, neurologic) | 34 (39.1%) | 37 (54.4%) | 78 (61.4%) | 0.005 | 149 (52.8%) |
| Days since symptom onset at the time of collection of PCR + patients/median [IQR] (range) | 4 [4–6] (0–11) | 5 [4–9] (0–20) | 6 [3–0] (1–18) | 0.08 | 5 [3–7] (0–20) |
| % of positive PCR | |||||
| Saliva | 55 (33.1%) | 52 (49.1%) | 85 (35.9%) | 0.03 | 192 (37.7%) |
| Nasopharyngeal (NP) | 64 (38.6%) | 51 (48.1%) | 79 (33.3%) | 0.02 | 194 (38.1%) |
| Saliva or NP | 68 (41.0%) | 58 (54.7%) | 93 (39.2%) | 0.02 | 219 (43.0%) |
| % of positive PCR, CT < 30 | |||||
| Saliva | 25 (15.1%) | 30 (28.3%) | 54 (22.8%) | 0.03 | 109 (21.4%) |
| Nasopharyngeal (NP) | 31 (19.7%) | 28 (26.9%) | 53 (22.6%) | 0.40 | 112 (22.6%) |
| Saliva or NP | 39 (24.5%) | 37 (34.9%) | 66 (27.8%) | 0.18 | 142 (28.3%) |
| % of positive serology a | 26 (20.8%) | 18 (20.0%) | 63 (28.1%) | 0.17 | 107 (24.4%) |
At the day of collection (D0 or D45) corresponding to the first matching saliva/NP pair (D0 or D45) for each individual.
In the overall study population, 282 subjects (56.6%) were symptomatic at the time of sample collection (Table 1). None was hospitalized. The median delay from declaration of the first symptom to sampling of the first available NPS/saliva pair was 6 days, ranging from 0 to 20 days. Neither symptom occurrence nor post‐symptoms delay significantly differed between age groups, including children under 12 years of age, confirming a homogeneous enrolment for all age classes.
Eight subjects reported prior exposure to SARS‐CoV‐2, ascertained by a positive RT‐PCR at least 60 days before enrolment. Three of those (2 children 10 years old and 1 adult) had a SARS‐CoV‐2 positive RT‐PCR during the study period. As their first infection occurred more than 6 months before enrolment, they were included in our subsequent sensitivity analyses.
Nearly a quarter of the studied population was seropositive at the time of collection with no significant difference between age groups nor between campaigns (Table 1 and Table S4).
Saliva and nasopharyngeal swabs positivity rate
Positivity rate, based on SARS‐CoV‐2 RT‐PCR in either NPS or saliva, reached 43% in the whole population (Table 1), with a similar range in both enrolment campaigns (Table S4). The highest prevalence was observed in the adolescent group (54.7%) vs. 41% in the under 12 years of age group and 39.2% in adults (p = 0.02). This was observed for both saliva and NPS (Table 1). This relatively high prevalence reflects enrolment of symptomatic, SARS‐Cov‐2 pre‐diagnosed or contact‐case individuals. Characteristics of children under 6 are shown in Supplemental materials S1.
Performance of saliva and nasopharyngeal swabs according to age
The sensitivity of saliva measured during the first campaign was not significantly different from that measured during the second campaign (Table S5). We thus decided to combine both populations for our analysis to improve the statistical power. Performance of NP and saliva sampling on all enrolled individuals showed an overall agreement of 89.9% (Confidence Interval [CI] 95% [86.8%–92.3%]). Saliva had a sensitivity of 87.7% [82.6%–91.7%] versus 88.6% [83.6%–92.5%] for NPS (Table 2). Each sampling method generated a comparable number of discordant results: when analysing all 219 positive patients, SARS‐CoV‐2 RNA was detected from both NPS and saliva in 167 patients, from saliva only in 25 patients, and from NPS only in 27 patients. Among the 443 subjects with no documented positive RT‐PCR test before enrolment, 178 had a positive RT‐PCR and similar results were obtained compared to the whole population, with a sensitivity of 87% [81.2%–91.6%] for saliva and 89.9% [84.5%–93.9%] for NP sampling (Table 2).
TABLE 2.
Saliva and NPS sensitivities stratified according to age groups
| All samples | Children < 12 years | Children 12–17 years | Adults | |||||
|---|---|---|---|---|---|---|---|---|
| All positives | ||||||||
| n (total enrolment) | 509 | 166 | 106 | 237 | ||||
| Saliva | NPS | Saliva | NPS | Saliva | NPS | Saliva | NPS | |
| n (PCR positive) | 192 | 194 | 55 | 64 | 52 | 51 | 85 | 79 |
| Sensitivity (%, [CI 95%] * ) | 87.7% [82.6%–91.7%] | 88.6% [83.6%–92.5%] | 80.9% [69.5%–89.4%] | 94.1 [85.6%–98.4%] | 89.7% [78.8%–96.1%] | 87.9% [76.7%–95.0%] | 91.4% [83.8%–96.2%] | 84.9% [76.0%–91.5%] |
| ns | ns | ns | ns | |||||
| wKappa‐cohen [ CI95%] | 0.78 [0.73–0.84] | 0.78 [0.66–0.87] | 0.75 [0.62–0.88] | 0.79 [0.70–0.87] | ||||
| Excluding seropositives | ||||||||
| n (total enrolment) | 332 | 99 | 72 | 161 | ||||
| Saliva | NPS | Saliva | NPS | Saliva | NPS | Saliva | NPS | |
| n (PCR positive) | 143 | 133 | 38 | 36 | 38 | 35 | 67 | 62 |
| Sensitivity (%, [CI 95%]) | 94.7% [89.8%–97.7%] | 88.1% [81.8%–92.8%] | 97.4% [86.5%–99.9%] | 92.3% [79.1%–98.4%] | 95% [83.1%–99.4%] | 87.5% [73.2%–95.8%] | 93.1% [84.5%–97.7%] | 86.1% [75.9%–93.1%] |
| ns | ns | ns | ns | |||||
| wKappa‐cohen [CI 95%] | 0.84 [0.78–0.90] | 0.91 [0.82–0.98] | 0.81 [0.66–0.92] | 0.81 [0.71–0.90] | ||||
| No Prior Positive RT‐PCR | ||||||||
| n (total enrolment) | 443 | 133 | 73 | 237 | ||||
| Saliva | NPS | Saliva | NPS | Saliva | NPS | Saliva | NPS | |
| n (PCR positive) | 155 | 160 | 37 | 46 | 33 | 35 | 85 | 79 |
| Sensitivity (%, [CI 95%]) | 87.0% [81.2%91.6%]) | 89.9% [84.5%–93.9%] | 77.1% [62.7%–88.0%] | 95.8% [85.7%99.5%] | 89.2%[74.6%–97.0%] | 94.6%[81.8%–99.3%] | 91.4%[83.8%–96.2%] | 84.9%[76.0%–91.5%] |
| ns | p = 0.02 | ns | ns | |||||
| Excluding seropositives | ||||||||
| n (total enrolment) | 285 | 75 | 49 | 161 | ||||
| Saliva | NPS | Saliva | NPS | Saliva | NPS | Saliva | NPS | |
| n (PCR positive) | 113 | 107 | 24 | 23 | 22 | 22 | 67 | 62 |
| Sensitivity (%, [CI 95%]) |
94.1% [88.4%–97.6%] |
89.2%[82.2%–94.1%] | 96.0% [79.6%–99.9%] | 92.0% [74.0%–99.0%] | 95.7% [78.1%–99.9%] | 95.7% [78.1%–99.9%] | 93.1% [84.5%–97.7%] | 86.1% [75.9%–93.1%] |
| ns | ns | ns | ns | |||||
Confidence Interval.
Stratification according to age showed that saliva and NP sampling in children under 12 years of age displayed an overall percentage of agreement (OPA = 89.8%) comparable to that found in adolescents (87.7%) and adults (90.7%). The kappa‐Cohen's concordance coefficient was equally high at 0.78 [0.66–0.87] versus 0.75 [0.62–0.88] in adolescents and 0.79 [0.70–0.87] in adults (Table 2 ).
Saliva sensitivity was high in all age groups and did not significantly differ from that of NPS (Table 2). However, in children under 12, saliva sensitivity showed a trend towards a lower value in comparison to older subjects (80.9% vs. 89.7% in 12–17 years old and 91.4% in adults) and lower performance in comparison to NPS (80.9% vs. 94.1% for NPS), which was not the case in the other age groups (Table 2). This difference reached significance only when children with no previous positive RT‐PCR test were considered (77.1% for saliva versus 95.8% for NPS; p = 0.02).
Altogether these results confirmed a high sensitivity of saliva for diagnosis of SARS‐CoV‐2 infection overall, but a significantly lower sensitivity in the school and preschool children group. We thus investigated possible explanations for this observation, focusing on symptomatic status, viral load and delay from infection.
Performance of saliva and nasopharyngeal swabs according to symptomatic status
We first investigated whether a lower symptom occurrence in children under 12 could explain the lower sensitivity of saliva measured in this age group. RT‐PCR positive children under 12 years indeed reported less symptoms than the other age groups (70.7% of school age children were symptomatic vs. 87.27% of adolescents and 84.6% of the adults) (Table 3).
TABLE 3.
Saliva and NPS sensitivities stratified according to both symptom occurrence at the time of collection and age groups
| Total a | Age 0–11 | Age 12–17 | Age ≥ 18 | |||||||||
|---|---|---|---|---|---|---|---|---|---|---|---|---|
| Symptomatic | Asymptomatic | p | Symptomatic | Asymptomatic | p | Symptomatic | Asymptomatic | p | Symptomatic | Asymptomatic | p | |
| All (n = 498 a ) | ||||||||||||
| n (PCR+/total) | 171/282 | 40/216 | 46/87 | 19/74 | 48/68 | 7/35 | 77/127 | 14/107 | ||||
| Saliva sensitivity [95% CI] | 87.7% [81.8%– 92.2%] | 85% [70.2%–94.3%] | NS | 80.4% [66.1%–90.6%] | 78.9% [54.4%–93.9%] | NS | 89.6% [77.3%–96.5%] | 85.7% [42.1%–99.6%] | NS | 90.9% [82.2%–96.3%] | 92.9% [66.1%–99.8%] | NS |
| NPS sensitivity [95% CI] | 91.8% [86.6%–95.5%] | 72.5% [56.1%–85.4%] | 0.0017 | 95.7% [85.2%–99.5%] | 89.5% [66.9%–98.7%] | NS | 91.7% [80%–97.7%] | 57.1% [18.4%–90.1%] | NS | 89.6% [80.6%–95.4%] | 57.1% [28.9%–82.3%] | 0.007 |
| Excluding seropositives | ||||||||||||
| n (PCR+/total) | 123/188 | 22/135 | 28/54 | 9/41 | 34/47 | 3/22 | 61/87 | 10/72 | ||||
| Saliva sensitivity [95% CI] | 94.3% [88.6%–97.7%] | 95.5% [77.2%–99.9%] | NS | 96.4% [81.7%–99.9%] | 100% [66.4%–100%] | NS | 94.1% [80.3%–99.3%] | 100% [29.2%–100%] | NS | 93.4% [84.1%–98.2%] | 90% [55.5%–99.7%] | NS |
| NPS sensitivity [95% CI] | 90.2% [83.6%–94.9%] | 72.7% [49.8%–89.3%] | NS | 96.4% [81.7%–99.9%] | 77.8% [40%–97.2%] | NS | 88.2% [72.5%–96.7%] | 66.7% [9.4%–99.2%] | NS | 88.5% [77.8%–95.3%] | 70% [34.8%–93.3%] | NS |
| No prior positive RT‐PCR ( n = 432 a ) | ||||||||||||
| n (PCR+/total) | 138/237 | 32/195 | 32/69 | 13/59 | 29/41 | 5/29 | 77/127 | 14/107 | ||||
| Saliva sensitivity [95% CI] | 87% [80.2%–92.1%] | 84.4% [67.2%–94.7%] | NS | 75% [56.6%–88.5%] | 76.9% [46.2%–95%] | NS | 89.7%[72.6%–97.8%] | 80% [28.4%–99.5%] | NS | 90.9% [82.2%–96.3%] | 92.9% [66.1%–99.8%] | NS |
| NPS sensitivity [95% CI] | 93.5% [88%–97%] | 71.9% [53.3%–86.3%] | 0.0011 | 100% [89.1%–100%] | 84.6% [54.6%–98.1%] | NS | 96.6% [82.2%–99.9%] | 80% [28.4%–99.5%] | NS | 89.6% [80.6%–95.4%] | 57.1% [28.9%–82.3%] | NS |
| Excluding seropositives | ||||||||||||
| n (PCR+/total) | 98/155 | 16/121 | 19/42 | 4/29 | 18/26 | 2/20 | 61/87 | 10/72 | ||||
| Saliva sensitivity [95% CI] | 93.9% [87.1%–97.7%] | 93.8% [69.8%–99.8%] | NS | 94.7% [74%–99.9%] | 100% [39.8%–100%] | NS | 94.4% [72.7%–99.9%] | 100% [15.8%–100%] | NS | 93.4% [84.1%–98.2%] | 90% [55.5%–99.7%] | NS |
| NPS sensitivity [95% CI] | 91.8% [84.5%–96.4%] | 68.8% [41.3%–89%] | 0.023 | 100% [82.4%–100%] | 50% [6.8%–93.2%] | 0.024 | 94.4% [72.7%–99.9%] | 100% [15.8%–100%] | NS | 88.5% [77.8%–95.3%] | 70% [34.8%–93.3%] | NS |
Missing data for 11 patients for symptomatic status.
We searched whether saliva performance varied according to symptomatic status by analysing saliva and NPS sensitivities according to symptom occurrence on collection day (Table 3). Saliva sensitivity did not differ between asymptomatic and symptomatic individuals in children under 12 years of age (80.4% vs. 78.9%). This was also the case considering the whole population, unstratified according to age groups (85% vs. 87.7% and 84.4% vs. 87% in no prior positive subjects). This was in contrast to NPS whose sensitivity significantly dropped from 91.8% in symptomatic individuals to 72.5% in asymptomatic individuals in the whole population (p = 0.017) and from 93.5% to 71.9% in ‘no prior positives’ (p = 0.0011). This lower NPS sensitivity in asymptomatic individuals was observed in all age groups but reached significance only in adults (saliva sensitivity at 92.9% vs. NPS 57.1% in asymptomatic cases, p = 0.007). Saliva sampling detected 34 out of the 40 asymptomatic positive cases compared to 29 cases for NPS. Importantly, SARS‐CoV‐2 could be detected from saliva before symptom onset: of the 38 asymptomatic individuals positive for SARS‐CoV‐2 at enrolment (including 18 children under 12), 8 declared symptoms 1–5 days after collection. Among those, seven were saliva positive at enrolment versus only four in NPS. This indicates that the lower sensitivity of saliva of children under 12 years of age is not due to the lower symptom occurrence observed in this age group.
Performance of saliva and nasopharyngeal swabs according to viral load
Next, we investigated whether the lower sensitivity of saliva in children under 12 might be related to a lower viral load in this population, using the C T value as proxy. Cohen's kappa analysis showed a high degree of agreement between C T values obtained from saliva and NPS in all age groups (Κ = 0.8 [0.75–0.85] for all C T pairs, and Κ = 0.8 [0.72–0.86] for that in adults, Κ = 0.77 [0.68–0.87] in 12–17 adolescents and Κ = 0.8 [0.72–0.88] in children under 12).
Focusing on children <12 years old, the overall viral load distribution as defined from C T in Experimental Procedures Section, did not significantly differ from that of the other age groups, for either sampling method (Table S7, lines). Interestingly, comparing viral load distribution between both types of specimens showed lower viral load values in saliva (Table S7, right column), with significance in adolescents and adults, but not in children under 12. These results suggest that the lower sensitivity of saliva observed in young children cannot be explained by a lower viral load in saliva in this age class.
Performance of saliva and nasopharyngeal swabs according to post‐infection delay and seroprevalence
We asked whether the lower sensitivity of saliva in school children was dependent on the delay post‐infection. First, we compared the saliva and NPS sensitivity depending on the time interval from declaration of symptoms to the collection of the paired samples (Table S8). Saliva sensitivity decreased from 87.8% if the symptoms occurred less than 3 days before sampling to 78% if the time interval between symptoms and collection exceeded 7 days. This was observed mainly in children under 12 years of age (from 81.2% to 60%) and in adolescents (from 100% to 73.3%) but not in adults (from 86.9% to 85.7%). These analyses, however, did not reach statistical significance because of the limited number of subjects or the relatively poor reliability of reporting symptoms.
To more accurately assess how the delay post‐infection affects saliva performance, we considered the serologies performed concomitantly to the saliva/NP sampling, as a proxy for early (seronegative), and late (seropositive) infections at the time of collection. The proportion of seropositive subjects at the moment of sampling did not differ according to age classes, with a mean of 24.4% seropositive subjects (Table 1). In children younger than 12, saliva sensitivity improved from 80.9% to 97.4% when only seronegative individuals were considered (Table 2), with a similar trend in adolescents but not in adults. We then focused on ‘no prior positive’ subjects to calculate an unbiased sensitivity. The impact of seropositivity on saliva performance was the greatest in children under 12 years of age. Indeed, in this age group, saliva sensitivity increased from 77.1% to 96% in seronegatives, while it dropped to 10% in seropositives (Table 2 and Figure 2). This increased sensitivity of saliva in seronegative patients was independent of the symptomatic status (Table 3). Seropositivity also affected to a lesser degree saliva performance in adolescents but not adults (sensitivity of 66.7% and 86.7%, respectively) (Figure 2). In contrast, NPS sensitivity was not affected by the serological status, neither in the school children nor in any of the other age groups (Table 2 and Figure 2). It specifically remained maximal in seropositive children under 12 (100% [66.4%–100%]).
FIGURE 2.

Saliva and NPS sensitivities according to age groups and serological status in patients with no prior positive RT‐PCR result. CI 95% were calculated by the exact binomial method. Only Significant difference are given. * corresponds to p < 0.001.
Altogether, these results show that the low sensitivity of saliva in children less than 12 years of age in the whole study population is due to the seropositive children (26/166). Saliva sensitivity was conversely very high in seronegative children.
DISCUSSION
Our results provide evidence that the overall detection rate for SARS‐CoV‐2 in children under 12 years of age is comparable in saliva and NPS, with an OPA of 89.8%. Although in this age group, saliva sensitivity was significantly lower than that of NPS (77.1% compared to 95.8%), it was increased up to 96% when considering seronegative children. This pattern was also observed to a lesser degree in adolescents but not in adults. Importantly, our data show that the sensitivity of saliva is independent of symptoms, in contrary to NPS, whose sensitivity decreases significantly in asymptomatic subjects. This supports the interest of saliva in screening campaigns as it would be able to detect asymptomatic patients with early infection, that is, before or while they were becoming contagious. Considering the non‐invasive collection of saliva, these results are of paramount importance in the paediatric population, especially for very young children.
Post‐mortem analyses have shown that salivary glands are a reservoir for SARS‐CoV‐2, which provides a rationale for the use of saliva for diagnostics and underlines the role of this biological fluid in spreading the disease (Soares et al., 2022). This point is key in public health decision‐making and the implementation of appropriate societal measures in the context of new, highly contagious variants as children may not be isolated, and they interact with no social distancing during recreational activities. This is obviously the case in asymptomatic children, and knowing the evolution of the COVID‐19 pandemic in this population is extremely important.
With 166 children under 12, including 57 children under 6, our study is the largest cohort published on saliva performance in school and pre‐school children. It involves a population from the general community with subjects who underwent testing within households because of contact tracing. The high prevalence of SARS‐CoV‐2 infection found in our study (43%) reflects the selection criteria for enrolled individuals, who were either mildly symptomatic or recently identified as SARS‐CoV‐2 positive during screening campaigns, or were contacts of positive cases in households. This study design achieved statistical significance at reasonable costs in the context of infectious waves. It also allowed the prospective follow‐up of contact cases with high positivity rates and the early detection of some pre‐symptomatic individuals. We nevertheless acknowledge that in this real‐world study design, the effective infection date is unknown, which makes it difficult to finely interpret the differential viral dynamics in saliva and NP during infection. The optimal design of the study would have been an unbiased enrolment of a calibrated and regularly tested population, while our study relied on a partly self‐selected population.
To optimize the pre‐analytical step, we standardized the collection of saliva in this age range. For this study, we did not consider nasal/oropharyngeal swabs, which offer another collection mode, whose sensitivity equals that obtained using NP swabs (Lee, Herigon, Benedetti, & Denkinger, 2021). As saliva is a complex medium, containing many proteins including RNase and inhibitors which can alter its performance, we sampled patients free of drinking for at least 30 min, and 2 h fasting when possible (López‐Martínez et al., 2020). We did not use any device but preferred to get spit saliva, or aspirated by a pipette in babies. In this daily life sampling of household cases, we allowed up to 12 h storage before analysis, as the viral RNA is stable in saliva at room temperature (Ott et al., 2021). This may be one of the reasons of good saliva performance in our study. Our study is unique in reporting SARS‐CoV‐2 serology of enrolled individuals, ascertaining either a previous or an on‐going infection since at least 7–10 days. This was the case for nearly 25% of our cohort. As these data are lacking in other paediatric studies, it may be that the reported variability of saliva performance in children relates to a different percentage of early and late infections. Finally, because our study is part of a household longitudinal study, we were able to report asymptomatic and pre‐symptomatic cases, which is an added value as the study of asymptomatic detection is inherently biased by the lower odds to collect samples close to the peak of infection.
Our results show that in children younger than 12 years of age, SARS‐CoV‐2 can be detected in saliva early after infection, in agreement with the salivary gland epithelium being an early site of virus replication, as reported in adults (Fronza et al., 2022; Matuck et al., 2021; Teo et al., 2021; To et al., 2020; Zhu et al., 2020). Importantly, we observe that in young children, in contrast to NPS, saliva sensitivity is strongly dependent on the delay post‐infection. Indeed, seroconversion rapidly prevented SARS‐CoV‐2 detection in saliva, with a decrease of sensitivity from 96% in seronegative children down to 10% in seropositive children. This pattern was also observed to a lesser degree in adolescents, but not in adults, despite comparable seropositivity rates and post‐symptom delays. This result is supported by other small longitudinal studies showing a faster decrease of saliva viral load compared to NPS; however, the reason and the age dependency were not investigated (Fronza et al., 2022; Teo et al., 2021; To et al., 2020; Zhu et al., 2020). This may be related to a much faster viral clearance in children's saliva compared to older individuals, an observation that may be crucial to understand childhood infectivity and their better coping with the disease. Physiologically, children are capable of mounting a robust serological and cellular response to SARS‐CoV‐2 infections, which may involve specific memory responses to recurrent seasonal coronavirus infections (Dowell et al., 2022; Yoshida et al., 2022). The reason why this is observed preferentially in saliva rather than in NPS is unclear but may suggest that immunity in young children reduces an already lower saliva viral load to a point of making it undetectable by RT‐PCR. A key point for public health but missing herein, will be to correlate the threshold of saliva RT‐PCR positivity with a replication‐active viral titre. Saliva most likely contains live virus as non‐encapsidated viral RNA should quickly be cleared up from this biofluid, unlike the more protected RNA found in nasopharyngeal infected cells. Detecting positive individuals before they become contagious, that is, before they exhibit detectable titers of live virus, should be the hallmark of a valuable screening strategy. The sensitivity provided by RT‐PCR together with the propensity of saliva to contain live virus, detectable at early stages of infection, could meet this goal. Coupling saliva RT‐PCR detection with pooling approaches would make this screening strategy cost‐effective.
In this study, enrolled individuals were mostly primo‐infected and not vaccinated. Seroconversion was used as a proxy for late infection at the time of collection. A challenge stemming from our observation is to know whether the serological status acquired from previous infection, or possibly vaccination, may or may not affect saliva sensitivity in children. This question is inherently hard to answer as any impact of immune‐history on saliva performance may depend on the time post‐infection/vaccination, the variant involved, the clinical outcome or even the unique nature of the elicited immune response.
Our study also shows that at all ages, saliva performs well in mildly symptomatic and asymptomatic subjects. In our data set, it enabled the detection of seven out of the eight pre‐symptomatic individuals. This is important because SARS‐CoV‐2 positive children are often less symptomatic compared to other age groups, which we indeed observed in this study. Our observation is in accordance with previous results by Yee et al. (Yee et al., 2021), showing comparable performance of saliva and NPS in symptomatic and asymptomatic paediatric patients not previously diagnosed with COVID‐19. However, these authors systematically reported a slightly lower number of cases detected using saliva, whether the individuals were symptomatic or not. With a median of 10 days between symptom onset and time of collection, it is possible that saliva under‐performed in their study due to late collection.
Saliva was previously reported to perform less well for SARS‐CoV‐2 detection in asymptomatic individuals, and this was attributed to a lower viral load. This was one of the causes underlined by Fougere et al. to explain the drastically lower saliva sensitivity in children under 6 years of age (Fougère et al., 2021). Al Sawaidi indeed observed a slightly lower viral load in asymptomatic individuals for both specimens, depending on the RT‐PCR target (Al Suwaidi et al., 2021).
In our samples, however, RT‐PCR C T distribution in saliva of young children was similar at all ages and did not differ from NPS. Even though our data globally confirm a higher detection threshold for saliva compared to NPS on the analysed samples, which may explain some of the discordant results for saliva, this did not specifically affect children under 12 years. Thus, the decrease in saliva performance observed in younger children could neither be strictly ascribed to asymptomatic presentation nor to a lower viral load in this population.
In contrast, NPS sensitivity was clearly decreased in asymptomatic subjects on the day of collection and NPS sampling detected only 4 out of the 8 pre‐symptomatic individuals compared to 7 for saliva. This observation is new as there are very few reports comparing saliva and NPS in asymptomatic or pre‐symptomatic patients. The late collection time performed by Yee et al. may explain why they did not observe a drop in NPS performance in the asymptomatic population. Supporting our observation, a recent community study showed that saliva detected more infection in asymptomatic individuals recruited by contact tracing (Fronza et al., 2022).
CONCLUSION
Overall, our results show that saliva sampling in asymptomatic subjects at an early infection stage performs equally well if not better than NPS. This reaffirms saliva as a safe and feasible collection method for early and unbiased SARS‐CoV‐2 detection and a more pleasant alternative to test infants, kindergarten, preschool children and older asymptomatic or pre‐symptomatic individuals (Jones et al., 2021; Marc et al., 2021). Our study was conducted when the SARS‐CoV‐2 original D614G and the Alpha variants predominated, before widespread circulation of the Delta variant and well before emergence of the Omicron and B1.5 variant. Since Omicron is now reported to be even more efficiently detected in saliva than in nasal swabs (Lin et al., 2022), the use of saliva for diagnosing active SARS‐CoV‐2 infections in school mass screening is further warranted as a cost‐effective and well‐accepted collection mode to screen large populations.
FUNDING INFORMATION
This study was funded by a research grant from the French Ministry of Health (PHRC) and sponsored by the Assistance Publique – Hôpitaux de Paris (AP‐HP) and by delegation: Délégation à la Recherche Clinique et à l'Innovation ‐ DRCI (Clinical Research and Innovation Department).
CONFLICT OF INTEREST
The author declares that there is no conflict of interest that could be perceived as prejudicing the impartiality of the research reported.
Supporting information
Appendix S1 Supporting Information
Supplemental Table S1 Saliva, Nasopharyngeal swab and serum matching samples.
Supplemental Table S2 Number of paired samples and matching sera collected along the sample collection timeline provided according to the protocol of the second enrolment campaign.
Supplemental Table S3 Characteristics of children under 12 years of age.
Supplemental Table S4 Patient Characteristics stratified by enrolment period.
Supplemental Table S5 Saliva and NPS sensitivities stratified according to enrolment campaigns
Supplemental Table S6 Contingency tables and saliva and NPS sensitivities calculated for all and preschool subjects with no prior positive RT‐PCR.
Supplemental Table S7 Viral load distribution stratified according to age groups for each specimen (Wilcoxon analysis, lines) and CT distribution stratified according to specimen within one age group (Fisher analysis, columns).
Supplemental Table S8 Saliva and NPS sensitivities stratified according to the delay between first symptom occurrence and first matching paired samples collection.
ACKNOWLEDGEMENTS
The authors thank all the families for their participation and URC‐CIC Paris Centre for the implementation, monitoring and data management of the study. The later includes Jean‐Marc Treluyer and Caroline Elie, Mathilde Serpinet, Céline Hauw, Amel Bouheraoua, Victor Bruyère, Mégane Ribot, Rosa Salhi, Gael Plastow, Cindy Parent, Sonia Lounis, Insaf Berrazaga, Wafa Atmani, Amélie de Haut de Sigy, Geovanna Meneses and Fabrice Gourmelon. The authors thank Carl Mann for careful reading of the manuscript.
Delaunay‐Moisan, A. , Guilleminot, T. , Semeraro, M. , Briand, N. , Bader‐Meunier, B. , Berthaud, R. et al. (2022) Saliva for molecular detection of SARS‐CoV‐2 in pre‐school and school‐age children. Environmental Microbiology, 1–13. Available from: 10.1111/1462-2920.16151
Brigitte Moltrecht, Sylvie van der Werf, Marianne Leruez‐Ville, and Isabelle Sermet‐Gaudelus are co‐last authors.
Funding information Assistance Publique ‐ Hôpitaux de Paris, Grant/Award Number: Code projet: APHP200467/N° IDRCB: 2020‐A00999; Ministry of Health
Contributor Information
Agnes Delaunay‐Moisan, Email: agnes.delaunay-moisan@cea.fr.
Isabelle Sermet‐Gaudelus, Email: isabelle.sermet@aphp.fr.
DATA AVAILABILITY STATEMENT
Data are available on request to the corresponding authors.
REFERENCES
- Al Suwaidi, H. , Senok, A. , Varghese, R. , Deesi, Z. , Khansaheb, H. , Pokasirakath, S. et al. (2021) Saliva for molecular detection of SARS‐CoV‐2 in school‐age children. Clinical Microbiology and Infection, 27(9), 1330–1335. 10.1016/j.cmi.2021.02.009 [DOI] [PMC free article] [PubMed] [Google Scholar]
- Atieh, M.A. , Guirguis, M. , Alsabeeha, N.H.M. & Cannon, R.D. (2021) The diagnostic accuracy of saliva testing for SARS‐CoV‐2: a systematic review and meta‐analysis. Oral Diseases, 1–15. 10.1111/odi.13934 [DOI] [PMC free article] [PubMed] [Google Scholar]
- Banerjee, D. , Sasidharan, A. , Abdulhamid, A. , Orosco, E.M. , Watts, J.L. , Schuster, J.E. et al. (2021) Diagnostic yield of saliva for SARS‐CoV‐2 molecular testing in children. Journal of the Pediatric Infectious Diseases Society, 10(10), 967–969. [DOI] [PMC free article] [PubMed] [Google Scholar]
- Bastos, M.L. , Perlman‐Arrow, S. , Menzies, D. & Campbell, J.R. (2021) The sensitivity and costs of testing for SARS‐CoV‐2 infection with saliva versus nasopharyngeal swabs: a systematic review and meta‐analysis. Annals of Internal Medicine, 174(4), 501–510 Epub 2021 Jan 12. Erratum in: Ann Intern Med. 2021 Apr;174(4):584. PMID: 33428446; PMCID: PMC7822569. [DOI] [PMC free article] [PubMed] [Google Scholar]
- Borghi, E. , Massa, V. , Carmagnola, D. , Dellavia, C. , Parodi, C. , Ottaviano, E. et al. (2021) Saliva sampling for chasing SARS‐CoV‐2: a game‐changing strategy. Pharmacological Research, 165, 105380. [DOI] [PMC free article] [PubMed] [Google Scholar]
- Caixeta, D.C. , Oliveira, S.W. , Cardoso‐Sousa, L. , Cunha, T.M. , Goulart, L.R. , Martins, M.M. et al. (2021) One‐year update on salivary diagnostic of COVID‐19. Frontiers in Public Health, 21(9), 589564. [DOI] [PMC free article] [PubMed] [Google Scholar]
- Cañete, M.G. , Valenzuela, I.M. , Garcés, P.C. , Massó, I.C. , González, M.J. & Providell, S.G. (2021) Saliva sample for the massive screening of SARS‐CoV‐2 infection: a systematic review. Oral Surgery, Oral Medicine, Oral Pathology Oral Radiology, 131(5), 540–548. [DOI] [PMC free article] [PubMed] [Google Scholar]
- Dowell, A.C. , Butler, M.S. , Jinks, E. , Tut, G. , Lancaster, T. , Sylla, P. et al. (2022) Children develop robust and sustained cross‐reactive spike‐specific immune responses to SARS‐CoV‐2 infection. Nature Immunology, 23(1), 40–49. [DOI] [PMC free article] [PubMed] [Google Scholar]
- Felix, A.C. , de Paula, A.V. , Ribeiro, A.C. , da Silva, F.C. , Inemami, M. , Costa, A.A. et al. (2022) Saliva as a reliable sample for COVID‐19 diagnosis in paediatric patients. International Journal of Paediatric Dentistry, 32(1), 123–125. 10.1111/ipd.12885 [DOI] [PubMed] [Google Scholar]
- Fougère, Y. , Schwob, J.M. , Miauton, A. , Hoegger, F. , Opota, O. , Jaton, K. et al. (2021) Performance of RT‐PCR on saliva specimens compared with nasopharyngeal swabs for the detection of SARS‐CoV‐2 in children: a prospective comparative clinical trial. The Pediatric Infectious Disease Journal, 40(8), e300–e304. [DOI] [PubMed] [Google Scholar]
- Fronza, F. , Groff, N. , Martinelli, A. , Passerini, B.Z. , Rensi, N. , Cortelletti, I. et al. (2022) A community study of SARS‐CoV‐2 detection by RT‐PCR in saliva: a reliable and effective method. Viruses, 14(2), 313. [DOI] [PMC free article] [PubMed] [Google Scholar]
- Hu, B. , Guo, H. , Zhou, P. & Shi, Z.L. (2021) Characteristics of SARS‐CoV‐2 and COVID‐19. Nature Reviews Microbiology, 19(3), 141–154 Epub 2020 Oct 6. Erratum in: Nat Rev Microbiol. 2022 Feb 23: PMID: 33024307; PMCID: PMC7537588. [DOI] [PMC free article] [PubMed] [Google Scholar]
- Ibrahimi, N. , Delaunay‐Moisan, A. , Hill, C. , Le Teuff, G. , Rupprecht, J.F. , Thuret, J.Y. et al. (2021) Screening for SARS‐CoV‐2 by RT‐PCR: saliva or nasopharyngeal swab? Rapid review and meta‐analysis. PLoS One, 16(6), e0253007. [DOI] [PMC free article] [PubMed] [Google Scholar]
- Jones, T.C. , Biele, G. , Mühlemann, B. , Veith, T. , Schneider, J. , Beheim‐Schwarzbach, J. et al. (2021) Estimating infectiousness throughout SARS‐CoV‐2 infection course. Science, 373(6551), eabi5273. [DOI] [PMC free article] [PubMed] [Google Scholar]
- Koelle, K. , Martin, M.A. , Antia, R. , Lopman, B. & Dean, N.E. (2022) The changing epidemiology of SARS‐CoV‐2. Science, 375(6585), 1116–1121. [DOI] [PMC free article] [PubMed] [Google Scholar]
- Lee, R.A. , Herigon, J.C. , Benedetti, A. , Pollock, N.R. & Denkinger, C.M. (2021) Performance of saliva, oropharyngeal swabs, and nasal swabs for SARS‐CoV‐2 molecular detection: a systematic review and meta‐analysis. Journal of Clinical Microbiology, 59(5), e02881–e02820. [DOI] [PMC free article] [PubMed] [Google Scholar]
- Lee, R.A. , Herigon, J.C. , Benedetti, A. & Denkinger, C.M. (2021) Performance of saliva, oropharyngeal swabs, and nasal swabs for SARS‐CoV‐2 molecular detection: a systematic review and meta‐analysis. Clinical Microbiology, 59(5), e02881–e02820. [DOI] [PMC free article] [PubMed] [Google Scholar]
- Lin, J. , Frediani, J.K. , Damhorst, G.L. , Sullivan, J.A. , Westbrook, A. , McLendon, K. et al. (2022) Where is omicron? Comparison of SARS‐CoV‐2 RT‐PCR and antigen test sensitivity at commonly sampled anatomic sites over the course of disease. medRxiv [Preprint], 2022.02.08.22270685. [Google Scholar]
- López‐Martínez, B. , Guzmán‐Ortiz, A.L. , Nevárez‐Ramírez, A.J. , Parra‐Ortega, I. , Olivar‐López, V.B. , Ángeles‐Floriano, T. et al. (2020) Saliva as a promising biofluid for SARS‐CoV‐2 detection during the early stages of infection. Boletín Médico del Hospital Infantil de México, 77(5), 228–233. [DOI] [PubMed] [Google Scholar]
- Malcangi, G. , Inchingolo, A.D. , Inchingolo, A.M. , Piras, F. , Settanni, V. , Garofoli, G. et al. (2022) COVID‐19 infection in children and infants: current status on therapies and vaccines. Children (Basel)., 9(2), 249. [DOI] [PMC free article] [PubMed] [Google Scholar]
- Marc, A. , Kerioui, M. , Blanquart, F. , Bertrand, J. , Mitjà, O. , Corbacho‐Monné, M. et al. (2021) Quantifying the relationship between SARS‐CoV‐2 viral load and infectiousness. eLife, 27(10), e69302. [DOI] [PMC free article] [PubMed] [Google Scholar]
- Matuck, B.F. , Dolhnikoff, M. , Duarte‐Neto, A.N. , Maia, G. , Gomes, S.C. , Sendyk, D.I. et al. (2021) Salivary glands are a target for SARS‐CoV‐2: a source for saliva contamination. Journal of Pathology, 254(3), 239–243. [DOI] [PMC free article] [PubMed] [Google Scholar]
- Oliver, J. , Tosif, S. , Lee, L.Y. , Costa, A.M. , Bartel, C. , Last, K. et al. (2021) Adding saliva testing to oropharyngeal and deep nasal swab testing increases PCR detection of SARS‐CoV‐2 in primary care and children. Medical Journal of Australia, 215(6), 273–278. [DOI] [PMC free article] [PubMed] [Google Scholar]
- Ott, I.M. , Strine, M.S. , Watkins, A.E. , Boot, M. , Kalinich, C.C. , Harden, C.A. et al. (2021) Stability of SARS‐CoV‐2 RNA in nonsupplemented saliva. Emerging Infectious Diseases, 27(4), 1146–1150. [DOI] [PMC free article] [PubMed] [Google Scholar]
- Soares, C.D. , Souza, L.L. , de Carvalho, M.G.F. , Pontes, H.A.R. , Mosqueda‐Taylor, A. , Hernandez‐Guerrero, J.C. et al. (2022) Oral manifestations of coronavirus disease 2019 (COVID‐19): a comprehensive clinicopathologic and immunohistochemical study. American Journal of Surgical Pathology, 46(4), 528–536. [DOI] [PMC free article] [PubMed] [Google Scholar]
- Teo, A.K.J. , Choudhury, Y. , Tan, I.B. , Cher, C.Y. , Chew, S.H. , Wan, Z.Y. et al. (2021) Saliva is more sensitive than nasopharyngeal or nasal swabs for diagnosis of asymptomatic and mild COVID‐19 infection. Scientific Reports, 11(1), 3134. [DOI] [PMC free article] [PubMed] [Google Scholar]
- To, K.K. , Tsang, O.T. , Yip, C.C. , Chan, K.H. , Wu, T.C. , Chan, J.M. et al. (2020) Consistent detection of 2019 novel coronavirus in saliva. Clinical Infectious Diseases, 71(15), 841–843. [DOI] [PMC free article] [PubMed] [Google Scholar]
- Tsang, N.N.Y. , So, H.C. , Ng, K.Y. , Cowling, B.J. , Leung, G.M. & Ip, D.K.M. (2021) Diagnostic performance of different sampling approaches for SARS‐CoV‐2 RT‐PCR testing: a systematic review and meta‐analysis. The Lancet Infectious Diseases, 21(9), 1233–1245. [DOI] [PMC free article] [PubMed] [Google Scholar]
- Yee, R. , Truong, T.T. , Pannaraj, P.S. , Eubanks, N. , Gai, E. , Jumarang, J. et al. (2021) Saliva is a promising alternative specimen for the detection of SARS‐CoV‐2 in children and adults. Journal of Clinical Microbiology, 59(2), e02686–e02620. [DOI] [PMC free article] [PubMed] [Google Scholar]
- Yoshida, M. , Worlock, K.B. , Huang, N. , RGH, L. , Butler, C.R. , Kumasaka, N. et al. (2022) Local and systemic responses to SARS‐CoV‐2 infection in children and adults. Nature, 602(7896), 321–327. [DOI] [PMC free article] [PubMed] [Google Scholar]
- Zachariah, P. (2022) COVID‐19 in children. Infectious Disease Clinics of North America, 36(1), 1–14. [DOI] [PMC free article] [PubMed] [Google Scholar]
- Zhu, J. , Guo, J. , Xu, Y. & Chen, X. (2020) Viral dynamics of SARS‐CoV‐2 in saliva from infected patients. Journal of Infection, 81(3), e48–e50. [DOI] [PMC free article] [PubMed] [Google Scholar]
Associated Data
This section collects any data citations, data availability statements, or supplementary materials included in this article.
Supplementary Materials
Appendix S1 Supporting Information
Supplemental Table S1 Saliva, Nasopharyngeal swab and serum matching samples.
Supplemental Table S2 Number of paired samples and matching sera collected along the sample collection timeline provided according to the protocol of the second enrolment campaign.
Supplemental Table S3 Characteristics of children under 12 years of age.
Supplemental Table S4 Patient Characteristics stratified by enrolment period.
Supplemental Table S5 Saliva and NPS sensitivities stratified according to enrolment campaigns
Supplemental Table S6 Contingency tables and saliva and NPS sensitivities calculated for all and preschool subjects with no prior positive RT‐PCR.
Supplemental Table S7 Viral load distribution stratified according to age groups for each specimen (Wilcoxon analysis, lines) and CT distribution stratified according to specimen within one age group (Fisher analysis, columns).
Supplemental Table S8 Saliva and NPS sensitivities stratified according to the delay between first symptom occurrence and first matching paired samples collection.
Data Availability Statement
Data are available on request to the corresponding authors.