Abstract
This systematic review and meta‐analysis examined the prevalence and factors associated with vaccine hesitancy and vaccine unwillingness in Canada. Eleven databases were searched in March 2022. The pooled prevalence of coronavirus disease 2019 (COVID‐19) vaccine hesitancy and unwillingness was estimated. Subgroup analyses and meta‐regressions were performed. Out of 667 studies screened, 86 full‐text articles were reviewed, and 30 were included in the systematic review. Twenty‐four articles were included in the meta‐analysis; 12 for the pooled prevalence of vaccine hesitancy (42.3% [95% CI, 33.7%–51.0%]) and 12 for vaccine unwillingness (20.1% [95% CI, 15.2%−24.9%]). Vaccine hesitancy was higher in females (18.3% [95% CI, 12.4%−24.2%]) than males (13.9% [95% CI, 9.0%−18.8%]), and in rural (16.3% [95% CI, 12.9%−19.7%]) versus urban areas (14.1% [95%CI, 9.9%−18.3%]). Vaccine unwillingness was higher in females (19.9% [95% CI, 11.0%−24.8%]) compared with males (13.6% [95% CI, 8.0%−19.2%]), non‐White individuals (21.7% [95% CI, 16.2%−27.3%]) than White individuals (14.8% [95% CI, 11.0%−18.5%]), and secondary or less (24.2% [95% CI, 18.8%−29.6%]) versus postsecondary education (15.9% [95% CI, 11.6%−20.2%]). Factors related to racial disparities, gender, education level, and age are discussed.
Keywords: COVID‐19 vaccine, systematic review, vaccine hesitancy, vaccine willingness
1. INTRODUCTION
In March 2020, in response to the extent and rapidity of the spread of the Severe acute respiratory syndrome coronavirus 2 (SARS‐CoV‐2), causing the Coronavirus disease 2019 (COVID‐19), the World Health Organization declared a pandemic. 1 Two months later, in May 2020, with hospital care capacities overstretched in many countries, most countries established restrictive measures of containment, interregional travel, and international border closures to avoid contact between individuals and prevent the spread of COVID‐19 among their populations. 2 In the same month of May 2020, the 73rd World Health Assembly adopted the resolution of recognizing vaccination at the level of each country as a necessary measure to prevent, control, and stop the spread of COVID‐19. 3 To meet this global prerogative, dozens of vaccines were developped in record time and tested around the world and some were approved.
In Canada, four vaccines were approved by Health Canada (Pfizer‐BioNTech's Comirnaty, Moderna's Spikevax, AstraZeneca's Vaxzevria, and Janssen's vaccine) 4 with the majority of the population being vaccinated with mainly two of those vaccines (Comirnaty and Spikevax). However, with increased vaccine availability, vaccine hesitancy also increased, and this became a major public health problem. 4 , 5 Although many people were willing to be vaccinated, issues of public confidence in vaccines were raised. Even though the scientific community considers vaccination as one of the most effective ways to prevent SARS‐CoV‐2 transmission and infection, prevent severe cases of COVID‐19, and reduce hospitalizations and deaths, emerging studies were showing that several sociodemographic (e.g., gender, race, and education), social, economic, and cognitive factors were related to people's reluctance to be vaccinated. 6 , 7 , 8 The World Health Organization defines vaccine hesitancy as a “delay in acceptance or refusal of vaccines despite availability of vaccination services,” while vaccination unwillingness refers to “the refusal to be vaccinated.” 9 , 10
In addition, results from various surveys conducted in Canada, including Statistics Canada's Canadian Perspectives Survey Series (CPSS), have revealed an evolution of the reasons for vaccine hesitancy and willingness to get vaccinated, with consistent findings around safety concerns, risks, side effects, and worries regarding the actual effectiveness and safety of vaccines. 11 , 12 , 13 , 14 Indeed, in June 2020, the majority of the population had concerns about vaccine safety (54.2%) and risks and side effects (51.7%). 14 In August 2021, results from the Canadian Community Health Survey (CCHS) revealed variations in the willingness of different racial groups to be vaccinated (ranging from 56.4% to 82.5% depending on the racial group considered), as well as among different provinces. 15 In addition, studies of issues related to vaccine willingness, hesitancy, and acceptance among Canadian populations have also led to mixed results requiring synthesis of findings. 7 , 8 , 16 , 17
We conducted a systematic review and meta‐analysis of studies conducted on vaccine hesitancy and vaccine unwillingness in Canadian populations, examining sociodemographic factors related to the available results. The objective of this study is to examine the prevalence and factors associated with vaccine hesitancy and vaccine unwillingness in Canada.
2. METHODS
2.1. Protocol and registration
The protocol of this systematic review was registered using PROSPERO (#CRD42022320695) and to our knowledge, no similar systematic reviews have been registered. This systematic review was reported in accordance with the 2020 Preferred Reporting Items for Systematic Reviews and Meta‐Analyses (PRISMA) reporting guideline. 18
2.2. Search strategy
This review sought to identify studies describing prevalence and factors related to COVID‐19 vaccine hesitancy and unwillingness among the Canadian population. A research librarian with experience in planning systematic reviews drafted, developed, and implemented a search strategy to find pertinent published articles in the following 11 electronic databases from 2020 to March 11, 2022: APA PsycInfo (Ovid); Cairn. info; Canadian Business and Current Affairs (ProQuest); CINAHL (EBSCOhost); Cochrane CENTRAL (Ovid); Canadian Periodical Index (Gale OneFile); Embase (Ovid); Érudit; Global Health (EBSCOhost); MEDLINE (Ovid); and Web of Science (Clarivate). This systematic review sought to build on the search strategies of previous meta‐analyses on COVID‐19 vaccination 19 , 20 , 21 and on vaccine hesitancy. 22 , 23 , 24 In addition, a resource developed by the Medical Library Association that compiles COVID‐19 search strategies used by other information professionals was consulted. 25 Search lines relating to Canada and its provinces and territories were favored over combining these with an exhaustive listing of possible minority groups to ensure that no study was missed. The final search strategy included relevant subject headings and keywords. The strategy for MEDLINE (Ovid) was peer‐reviewed by another research librarian in concordance with the Peer‐Review of Electronic Search Strategy guideline. 26 The final strategy was executed on March 10 and 11, 2022. To complement the database searches, a streamlined search strategy was executed on LitCovid, an up‐to‐date curated list of references related to research on COVID‐19. More detailed information on the implemented search strategy can be found in Supporting Information File 1. Citations were imported into Covidence, an online tool used to manage various steps of a systematic review's screening phases.
2.3. Selection criteria
Articles that met the following criteria were included in our study: (1) reported the nature, incidence, prevalence (including intention to be vaccinated), risk and protective factors, and disparities associated with vaccine hesitancy and/or vaccine unwillingness in Canada; (2) published in English or French; (3) peer‐reviewed studies (quantitative, qualitative, mixed methods, etc.); and (4) conducted in Canada. Quantitative studies and quantitative results from mixed methods studies were included in the meta‐analysis, while qualitative studies and qualitative results of mixed studies were included in the narrative review. 18 , 27 As this study analyses a new and ongoing pandemic situation, the inclusion of both quantitative and qualitative studies in this systematic review provides an integration of findings that are important for the development of public health strategies and programs. 18
2.4. Steps for selection
Two reviewers independently assessed the title and abstract of publications for inclusion in the review (O. O., A. M.). The full text of all records passing the title and abstract screening were retrieved and reviewed by two pairs of independent reviewers to confirm final eligibility (O. O. and S. F., A. M. and C. B.). Discrepancies in abstract screening and full‐text review were resolved through discussion by three authors (J. M. C., P. G. N., C. B.). The studies included in the meta‐analysis are identified in Table 1 by an asterisk. Figure 1 presents the PRISMA flow chart.
Table 1.
Key characteristics of included studies and main findings
| Study | Sample (female %) | Age group/range/mean (SD) | Race/ethnicity | Study design | Measure | Main findings | Quality of assessment |
|---|---|---|---|---|---|---|---|
| Afifi et al. 7 * | 664 (54.7%) |
39.5% 16–17 years 60.5% 18–21 years |
Observational longitudinal study | Willingness to get a COVID‐19 vaccine was assessed by asking “If a COVID‐19 vaccine was available would you get it?” Those who responded “no”, “maybe” or “I don't know” were subsequently asked “Why would you NOT get a COVID‐19 vaccine if it was available?”; Vaccine hesitancy: No, Maybe, I don't know. | Sex, age, and having mental health conditions were not related to willingness to vaccinate. Parent/caregiver educational attainment, household income, financial burden due to the pandemic, self‐reported COVID‐19 knowledge, practicing social/physical distancing, and having a physical health condition were related to significant differences in willingness to vaccinate. Spanking, household substance abuse, foster care/CPO contact, household running out of money, and any household challenges were associated with decreased willingness of getting a COVID‐19 vaccination. 65.4% of respondents indicated they would get a COVID‐19 vaccine if available, 8.5% indicated they would not, and 26.1% were unsure. | 6/8 | |
| Basta et al. 28 * | 23819 (53.0%) | 50–96 years |
3.8% Nonwhite 96.09% White 0.12% N/A |
Longitudinal cross‐sectional | Participants reported if they were “Unlikely to Receive COVID‐19 Vaccine” |
Most participants (72.7%) reported that they were very likely to receive a COVID‐19 vaccine. The proportions of those who were very unlikely to receive a COVID‐19 vaccine: • were in the two younger age groups (50–54 years [5.9% (95%CI: 4.5–7.3)] and 55–64 years [5.6% (95%CI: 5.1–6.1)]), • were female (5.1% [95% CI: 4.8–5.5]) compared to male (3.2% [95% CI: 2.8–3.5]), • were not White (7.6% [95%CI: 5.9–9.4]) compared to White (4.1% [95% CI: 3.8–4.3]) • had less than completed secondary school (7.0% [95% CI: 5.5–8.5] compared to 3.8% [95% CI: 3.5–4.1]) compared to people with a postsecondary degree/diploma) • had lower income compared to higher income (9.6% [95% CI: 7.6–11.6] with <20,000 annual income compared to 2.4% [95% CI: 1.9–2.9] with ≥150,000) • lived in a rural (5.4% [95% CI: 5.6–7.1]) versus urban area (3.7% [95% CI: 3.5–4.0]) |
6/8 |
| Benham, Atabati, et al.6* | 4498 (51.0%) |
29.8% 18–34 years 35.2% 35–54 years 35% 55+ years |
85.9% Caucasian 5% Indigenous/First Nations/Metis/Inuit 4.3% Asian 1.6% Caribbean/African/South American 3.2% Other |
Correlational cross‐sectional | Participants were asked what they would do if a COVID‐19 vaccine were available to them (“What would you do if a COVID‐19 vaccine were available to you?”) and given the following 4 options: (1) get a vaccine as soon as possible, (2) eventually get a vaccine, but wait a while first, (3) not get a vaccine, or (4) not sure | 63.9% of participants reported COVID‐19 vaccine hesitancy. There was no association between ethnicity and COVID‐19 vaccine hesitancy. Vaccine hesitancy was associated with younger age (18‐39 years), a lower education, a non‐Liberal political leaning, a higher prevalence of reporting being concerned about vaccine side effects, not believing that a COVID‐19 vaccine would end the pandemic or that the benefits of a COVID‐19 vaccine outweighed the risks, and with lower prevalence of reporting being influenced by peers or health care professionals about the vaccine. | 6/8 |
| Benham, Lang, et al. 29 | 50 (60.0%) |
34% 18–29 years 12% 30–39 years 8% 40–49 years 20% 50–59 years 26% 60 years or older |
Qualitative | The focus group content centered around attitudinal and behavioral measures (e.g., risk preferences, social attitudes), knowledge of COVID‐19, and knowledge and attitudes toward public health strategies | Participants reported mixed responses for why they would not take the COVID‐19 vaccine. Some said that COVID was not a risk to themselves or to their family and those from the older age group reported fearing that there had not been enough research done to support the vaccine. Those who said they were more likely to get the yearly flu shot and those who believed that the vaccine would allow them to return to their normal lives were more likely to accept a vaccine. The main barriers to the vaccine reported were fears about the safety of the vaccine and the usefulness of the vaccine. | 7/10 | |
| Dubé et al. 30 * | 6641 (51.3%) |
10.16% 18–24 years 31.32% 25–44 years 25.73% 45–59 years 20.22% 60–69 years 12.56% 70 years and older |
Correlational cross‐sectional | 10 items assessed respondents' attitudes and intentions regarding COVID‐19 vaccines. Two open‐ended questions assessed respondents' perceptions of the advantages and disadvantages of COVID‐19 vaccination. All other questions were close‐ended, and responses were recorded on a 5‐point Likert scale (“Completely Agree,” “Somewhat Agree,” “Somewhat Disagree,” “Completely Disagree,” “Don't know”). | Being 60 years or older was the strongest predictor for COVID‐19 vaccination intentions. The researchers observed a positive correlation between an adherence to conspiracy theories/low‐risk perceptions of COVID‐19 and unwillingness to receive a vaccine. Approximately 75% of Quebecers intended to be vaccinated. | 5/8 | |
| Dzieciolowska et al. 8 * | 1709 (72.2%) |
14.3% < 30 years 23.2% 30–39 years 23.8% 40–49 years 23% 50–59 years 8.8% ≥ 60 years 6% Unknown |
Correlational cross‐sectional | Participants responded to questions about whether they were presently interested in receiving the vaccine (vaccine acceptance. When respondents refused vaccination, they were asked to indicate how important a series of 15 factors were in their decision to decline the vaccine, by choosing 1 of 4 options: “Not important,” “somewhat important,” “very important,” or “I don't know.” | 80.9% of the respondents accepted the vaccine. Physicians, environmental services workers and healthcare managers were more likely to accept vaccination compared to nurses. Male sex, age over 50, rehabilitation center workers, and occupational COVID‐19 exposure were independently associated with vaccine acceptance by multivariate analysis. Factors for refusal included vaccine novelty, wanting others to receive it first, and insufficient time for decision‐making. Among those who declined, 74% reported they may accept future vaccination. Vaccine firm refusers were more likely than vaccine hesitates to distrust pharmaceutical companies and to prefer developing a natural immunity by getting COVID‐19. | 6/8 | |
| Gerretsen et al. 31 |
Full sample 4434 (50.4%) Canadian subsample 1680 (49.9%) |
Full sample 48.7 (17.2) Canadian subsample Age range = 18–65+ |
Full sample 74.4% White 11.9% East Asian 7.6% Latinx 4.9% Black 1% Indigenous Canadian subsample 78.3% White 15.4% East Asian 1.6% Latinx 2.9% Black 1.8% Indigenous |
Correlational cross‐sectional |
Participants' degree of vaccine hesitancy was assessed using a single‐item that asked how likely they are to get vaccinated if a vaccine for COVID‐19 becomes available. The answer options ranged from “1, Definitely” to “6, Definitely Not,” with a higher score representing greater hesitancy. Sociodemographic questionnaire; Vaccine complacency; Vaccine confidence. |
Full sample Among the full sample (Canada and the United States), 43.7% of Indigenous, 33.4% of Black, and 56.5% of Latinx participants were “very probably” to “definitely” likely to get a COVID‐19 vaccine compared with 59.6% of East Asian and 67.4% of White participants. Most people were supportive of the COVID vaccine. Education and political leaning influenced views on vaccines. Canadian subsample Self‐identified Black respondents reported the most vaccine hesitancy compared with other races. The mean scores differed by race among Canadians for this questionnaire (Indigenous = 3.1, Black = 3.4, Latinx = 2.6, East Asian = 2.5, White = 2.2). In Canada, vaccine hesitancy was higher among Black and Indigenous people compared to White people (F(4,1679) = 11.63, p < 0.001). |
6/8 |
| Goldman et al. 32 | 720 (45.6%) | 5.45 (3.78) | Longitudinal cross‐sectional | Parents were asked about their willingness to vaccinate their children | In Canada, where vaccination was mostly limited to first dose during the study period, willingness to vaccinate children under 12 was trending downward (r = −0.28). The odds of willingness to receive a vaccination decreased in Canada (OR = 0.82, 95% CI = 0.63–1.07). In Canada, (total first dose given to <25% of participants by the end of study period), the estimated willingness to receive a vaccination declined over time from above to below 50%. | 5/8 | |
| Hetherington et al. 33 * | 1321 (100%) | 42.2 (4.4) | 16.7% self‐identified as a visible minority | Longitudinal cross‐sectional | Surveyed on internally developed questions about COVID‐19 and vaccine intention; Hesitancy: “Unsure.” | Participants with lower education, lower income, and incomplete vaccination history were less likely to intend to vaccinate their children. | 6/10 |
| Hudson et al. 34 | 2002 (60.8%) | 37 (10.4) | Correlational cross‐sectional | Participants were asked about their vaccination status and if they did not have at least 2 COVID‐19 vaccine shots they were asked “What best describes your intention to get your next shot?” Response options were as follows: “I have NO plan to get a second shot”, “I am unsure whether I will get the second shot” [coded as unvaccinated without intention], and “I plan to get the second shot, but have NOT yet scheduled an appointment”, and “I am planning to get the second shot and have scheduled an appointment.” | 50.2% of respondents reported receiving two vaccine shots (i.e., fully vaccinated by the standards at the time of data collection), and 43.3% reported receiving no vaccinations. Findings demonstrated that those who possessed higher executive function, lower delay discounting, and greater future orientation were more likely to be vaccinated and engage in key COVID‐19 mitigation behaviors (i.e., social distancing, mask wearing, and hand hygiene). | 6/8 | |
| Humble et al. 35 * | 1702 (55.3%) | Parent's age range: 39.21–8.44 (SD = 17 − 65); Children's M age range: 0−6 (SD = 37.1) |
19.9% White. 10.3% Visible minority or White‐visible mixed ethnicity 2.8% Indigenous 0.8% Prefer not to answer |
Correlational cross‐sectional | Respondents were asked the following: ‘‘If a safe and effective COVID‐19 vaccine is available, I will get my child/children vaccinated,” response categories were recoded into binary categories for comparability with similar studies [5,8]: high intention to vaccinate (scores of 4–5, which was the reference category) and low intention to vaccinate (scores of 1–3) | 64.6% of participants reported that if a safe and effective COVID‐19 vaccine was available, they would get themselves vaccinated, and 63.1% would get their children vaccinated. Parents who mostly spoke languages other than English, French, or Indigenous languages at home were less likely to have low intention to vaccinate their children, compared with English speakers (OR = 0.55, 95% CI = 0.32–0.92). Parents who reported that COVID‐19 vaccination was unnecessary and lacked confidence in the safety of COVID‐19 vaccines were two and four times more likely to have low vaccination intention for their children (OR = 2.59, 95% CI = 1.72–3.91; OR = 4.21, 95% CI = 2.96–5.99, respectively) | 6/8 |
| Kaida et al. 36 * | 5588 (99.6%) | 48.2 (12.1) |
3.3% Indigenous 0.4% African/Black/Caribbean 79.5% White 13.9% Other or mixed |
Correlational cross‐sectional | Modified WHO Vaccine Hesitancy Scale: included two factors: Lack of Vaccine Confidence (7‐item 5‐point Likert scale from Strongly Agree to Strongly Disagree, with higher agreement corresponding with higher lack of general vaccine confidence) and Vaccine Risk (2‐item 5‐point Likert scale from Strongly Agree to Strongly Disagree, with higher agreement corresponding with higher concerns about vaccine risks) | Two‐thirds (65.2%) of participants living with HIV (LWH ‐ Living With HIV) reported intending to receive a COVID‐19 vaccine if recommended and available to them, significantly lower than participants not LWH (79.6%). The observed effect of HIV status on vaccine intention in unadjusted analyses was explained by differences in the distribution of other key sociodemographic factors, including Indigenous ancestry, being racialized, lower household income, lower education, and essential worker (non‐health related) status, all previously shown to be associated with vaccine intention in the general BC population. | 8/8 |
| Lang et al. 37 * | 60 (56.7%) |
31.7% 18–29 years 43.3% 30–59 years 25% >60 years |
85.0% White 5.0% South Asian 3.3% Chinese 1.7% Filipino 3.3% First Nation/Metis/Inuit 1.7% Unknown |
Correlational cross‐sectional | Willingness to receive a COVID‐19 vaccine when available | 20% of people said they would not receive a COVID‐19 vaccine when available and 12% were unsure. When considering ethnicity, 63% of White participants would be willing to accept the vaccine whereas all other recorded ethnicities were 100% willing to receive a vaccine. | 6/8 |
| Lavoie et al. 16 * | 15019 (51.6%) |
12.2% ≤25 years 41.4% 26–50 years 46.5% ≥51 years |
18.2% Nonwhite 81.8% White |
Longitudinal cross‐sectional | “If a vaccine for COVID‐19 were available today, what is the likelihood that you would get vaccinated?” Response options (very unlikely, unlikely, somewhat likely, extremely likely, I don't know/prefer not to answer) were dichotomised into “very unlikely, unlikely, somewhat likely” to describe those indicating at least some degree of hesitancy, versus “very likely” to describe those with very high intentions to get vaccinated. | Over 40% of Canadians reported some degree of vaccine hesitancy between April 2020 and March 2021. Women, those aged 50 and younger, non‐Whites, those with high school education or less, and those with annual household incomes below the poverty line in Canada (i.e., $60,000) were significantly more likely to report being vaccine hesitant over the study period, as were essential and healthcare workers, parents of children under the age of 18, and those who do not get regular flu vaccines. Believing engaging in infection prevention behaviors (like vaccination) is important for reducing virus transmission and high COVID‐19 health concerns (being infected and infecting others) were associated with 77% and 54% reduction in vaccine hesitancy. | 6/10 |
| Lazarus et al. 17 * | 707 (55.4%) | 68.32% <50 years 31.68 ≥ 50 years | Correlational cross‐sectional | “If a COVID‐19 vaccine is proven safe and effective and is available to me, I will take it” and “I would follow my employer's recommendation to get a COVID‐19 vaccine once the government has approved it as safe and effective.” Response options were recorded on a 5‐point Likert scale, ranging from completely agree to completely disagree. | In Canada, Older age (<50 vs. ≥50) was a significant factor to get the vaccine if available and higher education was associated with lower vaccine acceptance. Women in France, Germany, Russia, and Sweden indicated stronger willingness to accept COVID‐19 vaccine than men. In China, an opposite trend was observed, with younger individuals stating they were more likely to accept a vaccine. Results were not significantly different when comparing respondents aged <40 versus ≥40. | 6/8 | |
| Lessard et al. 38 * | 15 (33.3%) |
18 years of age and older M age = 43 |
36.0% Indigenous 20.0% from diverse minoritized groups (Asian, Black, Hispanic, and other) 44.0% White |
Qualitative | The interview included questions on knowledge and perceptions of the COVID‐19 vaccines, including perceived risks and benefits, concerns, and fears. |
Receiving strict recommendations, believing in conspiracies to harm, believing that infection prevention and control measures will not be fully lifted despite vaccination, being concerned with risk of side effects or getting sick because of the vaccine, lacking information about the vaccine, five barriers associated with three domains of the Theoretical Domains Framework (TDF) framework (social influences, belief about consequences, and knowledge), eight facilitators associated with five TDF domains (social influences, belief about consequences, knowledge, environmental context and resources, and emotions) lack of COVID‐19 information and confidence are significant key barriers to vaccine acceptability. Previous vaccinations, particular that of the influenza vaccine, were factors that made the COVID‐19 vaccine more acceptable. |
8/10 |
| Lin 39 * | 3522 (50.7%) |
20.2% 25–34 years 18.3% 35–44 years 17.4% 45–54 years 19.1% 55–64 years 25.1% 65 years and older |
Correlational cross‐sectional | COVID‐19 vaccine hesitancy was measured by a single item asking respondents: “When a COVID‐19 vaccine becomes available, how likely is it that you will choose to get it?” | Migrants had significantly higher proportions of vaccine hesitancy (21.5% vs. 15.5%) relative to Canadian‐born residents. Among vaccine‐hesitant individuals, immigrants had a significantly higher percentage reporting concerns on vaccine safety (71.3% vs. 49.5%, p < 0.001), side effects (66.4% vs. 47.3%, p < 0.001) and mistrust in vaccinations (12.5% vs. 6.6%, p < 0.05) as reasons of vaccine refusal, compared with Canadian‐born residents. The odds of vaccine hesitancy were almost two times greater for immigrants in Canada than their Canadian‐born counterparts (OR = 1.99, 95%CI = 1.57–2.52). | 6/8 | |
| Lunsky et al. 40 * | 3371 (84.7%) |
18.3% 18–29 years 23.9% 30–39 years 23.1% 40–49 years 34.7% 50 years and older |
4.9% African or Caribbean 4.5% Asian 3.6% Indigenous, First Nations or Metis 1.3% Latin 1.1% Mixed 3.3% Unknown 3.3% 81.3% European 81.3% |
Mixed‐methods | Vaccination Intent | There are nonsignificant differences in vaccine intent found between ethnicities in this study. 7% of participants were “somewhat unlikely” and 11% were “very unlikely” to get vaccinated. The only significant demographic contributor to vaccination hesitancy was age. | 7/10 |
| Mant et al. 41 * |
June/July 2020 survey: 433 (77.2%) September/October 2020 survey: 1170 (70.7%) |
June/July survey: 21.64 (3.88); September/October survey: 20.58 (3.31) |
Mixed‐methods | Participants were asked: “If a vaccine for COVID‐19 were to become available, would you want to get it?” Respondents could choose to indicate their willingness to get the vaccine as “Yes,” “No,” or “Not sure/Undecided.” | In the June/July survey and in the September/October survey, the majority of participants were willing to get a COVID‐19 vaccine. Respondents in the June/July survey with a higher perception of the severity of COVID‐19 had a greater relative chance of being willing to get COVID‐19 vaccine. For each 1‐point increase in perception of the severity of COVID‐19 disease, participants were 2.206 times more likely to be willing to get the COVID‐19 vaccine than not, controlling for all other predictor variables included in the model. The binary logistic regression analysis of the September/October survey indicates that factors predicting willingness to get the COVID‐19 vaccine included being personally affected by COVID‐19 (p < 0.001), perception of the severity of COVID‐19 (p = 0.005) and being encouraged by their doctor or pharmacist (p < 0.001). Also, respondents with a higher perception of the severity of COVID‐19 had a greater relative chance of being willing to get the vaccine. | 5/8 | |
| McKinnon et al. 42 * | 809 (50.0%) | Age range of 12 to 18 years |
88.4% White 35.0% Latin American 26.0% Arab 21.0% Black 18.0% Other |
Longitudinal cross‐sectional | The questionnaire for parents of participating children collected information on the COVID‐19 vaccination status of their child. For those who reported that their child was unvaccinated, they were asked about their intention to vaccinate against COVID‐19, their intention to vaccinate their children, and reasons for vaccinating or not vaccinating. | Racialized parents were overrepresented among the parents unlikely to accept vaccination. The prevalence of being vaccinated/very likely to get vaccinated was lower among racialized parents. The prevalence of being unlikely to vaccinate was also consistently higher among these groups. Racialized parents had twice the prevalence of being unlikely to vaccinate compared with White parents. Less educated, lower income, foreign‐born, and racialized parents were overrepresented among the parents unlikely to accept vaccination. Parents born outside Canada were less likely to report their child was vaccinated/likely to be vaccinated (OR = −15.0; 95% CI = −23 to −7.0) and more likely to report being unlikely to vaccinate compared with White parents (or = 7.6; 95% CI = 1.2‐14.0) | 5/8 |
| Merkley & Loewen, 43 | 2556 (52.0%) |
Age range of 34–63 years |
Correlational cross‐sectional | “How likely would you be to take this vaccine if offered to you?” Response categories: very likely, somewhat likely, not very likely, or not at all likely. The outcomes were rescaled from 0 to 1 so that higher values mean a higher likelihood of taking the vaccine and more confidence in its effectiveness. | Intention to receive a vaccine was 0.08 point higher on a 0 to 1 scale for those given the death prevention information compared with those who were not (95% CI, 0.04– 0.12; p < 0.001), For women, intention was 0.07 point higher for those given the death prevention information compared with those who were not (95% CI, 0.04–0.11; p < 0.001), | 5/8 | |
| Morillon & Poder 44 | 1599 (50.0%) | 50.23 | Mixed methods | Vaccine hesitancy was measured via an eight‐item questionnaire with a five‐point Likert scale with scores ranging from 0 to 32 (the higher the score, the higher the vaccination aversion). | There was a preference among participants for Western countries to produce the vaccine versus places such as Russia and China. Any vaccine that was found to be less than 85% effective was led to a decreased likelihood of it being accepted. Mild side effects due to the vaccine did not appear to have an effect on the likelihood of accepting the vaccine but a 1/3 chance of being hospitalized lead to a deduction in the likelihood of accepting the vaccine. There was found to be a preference ranking for the vaccine: effectiveness, safety, duration, origin, recommendation, waiting time and priority population. Vaccine trust and vaccine hesitancy scores were 4.08 of 5 (p < 0.001) [high trust] and 11.61 of 32 (p < 0.001) [moderate hesitancy]. Younger populations, people with lower levels of education, and female participants had the lowest vaccine trust score and the highest vaccine hesitancy score. Men and people with higher levels of education were more confident and least hesitant to receive a vaccine. The study concluded that the likelihood of accepting the vaccine increased with age, education, and income. | 5/8 | |
| Muhajarine et al. 45 * | 9252 (75.7%) |
39.78% 49 years and younger 33.05% 50–64 years 27.17% 65 years and older |
3.8% Indigenous 96.2% nonindigenous |
Correlational cross‐sectional | COVID‐19 Vaccine Intention | Respondents who self‐identified as Indigenous were 2.4 times more likely to refuse vaccination (95%CI = 1.2–4.6) and 1.7 times more likely to be unsure (95%CI = 1.0–2.7). | 7/8 |
| Ogilvie et al. 46 * | 4948 (84.8%) |
Age range = 25–69, Mage = 51.8 (SD = 10.5) 25–29 = 111 (2.2%) 30–39 = 573 (11.6%) 40–49 = 1260 (25.5%) 50–59 = 1496 (30.2%) 60–69 = 1370 (27.7%) Missing = 138 (2.8%) |
82.6% White 7.3% Asian 2.6% Indigenous 2.0% South Asian 1.3% Latin American 0.6% Black |
Correlational cross‐sectional |
9‐item Vaccine Hesitancy Scale (VHS), assessing lack of vaccine confidence and vaccine risk. Sociodemographic questionnaire; Vaccine attitudes; Direct Social norms; Indirect social norms; Perceived behavioral controls |
Most adults, especially older individuals (> 60 years), were more likely to receive a COVID‐19 vaccine if available. In the full sample, 79.8% were “somewhat or very likely” to receive a COVID‐19 vaccine if it was available to the public and recommended for them. Those with less than high school education, along with those who report higher lack of confidence in vaccines and higher perceived risk of vaccines were less likely to indicate an intention to vaccinate. Those who identified as non‐White(AOR = 0.76) or Indigenous (AOR = 0.58) indicated that they are less likely to receive a COVID‐19 vaccine. However, 67.7% of Black participants were willing to receive vaccine, compared with 79.9% of non‐Black participants. The likelihood to receive a COVID‐19 vaccine was not significantly different between Black (OR = 0.53) and non‐Black participants (reference, p = 0.13). |
6/8 |
| Palanica & Jeon 47 * | 1002 (48.9%) | 31.60 |
59.9% White 13.7% East Asian 7.1% South Asian or Indian 6.6% Southeast Asian 4.2% Black or African American |
Longitudinal cross‐sectional | Participants' concerns before each dose | No results by race/ethnicity were found. Participants who received adenoviral vector + mRNA vaccine combinations were typically older and more likely to be married. The majority of participants did not have concerns before either dose of their vaccine with an average of 1–1.5 questioning the potential side effects. Researchers did not find major differences in the concerns or the perceived efficacy of doses between doses in participants. | 6/8 |
| Piltch‐Loeb et al. 48 * | 985 (50.0%) | Age groups of 18–24, 25–34, 35–44, 45–54, and 55+ years | Correlational cross‐sectional | “If you were offered a COVID‐19 vaccine—at no cost to you—how likely are you to take it?” | The US had the highest percentage of vaccine‐hesitant respondents (63%), followed by Sweden (49%), Italy (43%), and Canada (42%). The top concern in the North American countries focused on the fast production of the vaccine. In Canada, Sweden, and Italy, the greatest concern among participants had to do with elites benefitting from the vaccine rollout. Across all four countries and hesitancy groups, there were the same top two concerns: that there should be freedom of choice to be vaccinated and freedom of movement when vaccinated. | 7/8 | |
| Racey et al. 49 * | 5076 (74.9%) |
9.7% 20–30 years 26.1% 30–40 years 32.2% 40–50 years 24.3% 50–60 years 6.0% 60 years and up 1.7% Missing |
84.0% White 0.5% Black 8.6% Asian 3.7% South Asian 0.7% Latin American 3.0% Indigenous |
Correlational cross‐sectional | The Vaccine Hesitancy Scale (VHS) is focused on general childhood vaccines and assesses vaccine hesitancy based on two separate factors: lack of confidence in and perceived risks of vaccines | There was no significant association between vaccine intention and visible minority status. Most (89.7%) public school teachers are willing to take a COVID‐19 vaccine that is safe, effective, and recommended for them, with 69.5% (95%CI: 68.2%−70.8%) reporting they would be very likely to get a COVID‐19 vaccine. | 7/8 |
| Stojanovic et al. 50 * | 16673 (74.8%) |
18.8% 29 years or younger 62% 30–64 years 19.2% 65 years or more |
Correlational cross‐sectional | “If a vaccine for COVID‐19 were available today, what is the likelihood that you would get vaccinated?” Response options were: Extremely likely, Somewhat likely, Unlikely, Very unlikely, and I don't know/prefer not to answer. | 27% of the sample were found to report vaccine hesitancy. There was an increase in vaccine hesitancy over time (period 1: 25.6%, period 2: 27.5%, period 3: 29.9%, p < 0.0001). There were significant vaccine hesitancy trends shown in Canada (in Colombia, France, Turkey, and the USA as well). Vaccine hesitancy was lowest among men, older people, and those who live in urban settings (males vs. females: OR = 0.84, 95% CI = 0.78–0.91; those 65+ vs. >29: OR = 0.75, 95% CI = 0.64–0.88; urban areas vs. rural areas: OR = 0.83, 95% CI = 0.74–0.92). Those who were in the higher or middle‐income bracket reported the least amount of vaccine hesitancy compared with those in the lower income bracket (middle compared with lower: OR = 0.81, 95% CI = 0.73–0.90; top compared with lower: OR = 0.53, 95% CI = 0.47‐0.59). Compared with North Americans, participants in Europe were less likely to report vaccine hesitancy. Those who reported higher personal finical concerns reported greater vaccine hesitancy (β = −0.374, p < 0.001; β = −0.309, p < 0.001). | 5/8 | |
| Syan et al. 51 * | 1367 (60.6%) | 37.5 |
78.9% White 1.5% Black 11.9% Asian 1.09% First Nations/Inuit/Metis 0.4% Pacific Islander 4% More than one option 2.3% Other |
Longitudinal observational cohort study | Participants where asked questions to ascertain their willingness to receive the COVID‐19 vaccine and examined potential reasons for either receiving or declining the vaccine | Female participants and those with higher education more commonly endorsed wanting to prevent transmission and protection from contracting COVID‐19. For unwillingness to receive a vaccine, female participants and those with less than a bachelor's degree reported more often that they worried about long‐term and immediate vaccine side effects than male participants and participants with a bachelor's degree or higher. No results by race/ethnicity were found. | 5/8 |
| Tang et al. 52 * | 14621 (53.2%) |
29.2% 18–39 years 34.9% 40–59 years 23.7% 60–69 years 12.1% 70+ years |
85.7% Not visible minority 14.3% Visible minority 91.1% Not Indigenous 8.9% Indigenous ancestry |
Correlational cross‐sectional | 20‐item survey which included a question about vaccination intention in which participants were asked “When a vaccine against the coronavirus becomes available to you, will you get vaccinated or not?” | 9% of respondents had no intention to vaccinate. Alberta (16%) and other Prairie provinces (14%) had higher proportions of people not intending to vaccinate compared with less than 10% in all other provinces. Participants aged 40–59 had the lowest vaccination intention (11.6%). Other groups with lower intention to vaccinate included those identifying themselves as visible minorities (12%), Indigenous (15%), and those living in households of five or more people (16%). | 7/8 |
Abbreviation: COVID‐19, coronavirus disease 2019.
*Studies included in the meta‐analysis.
Figure 1.
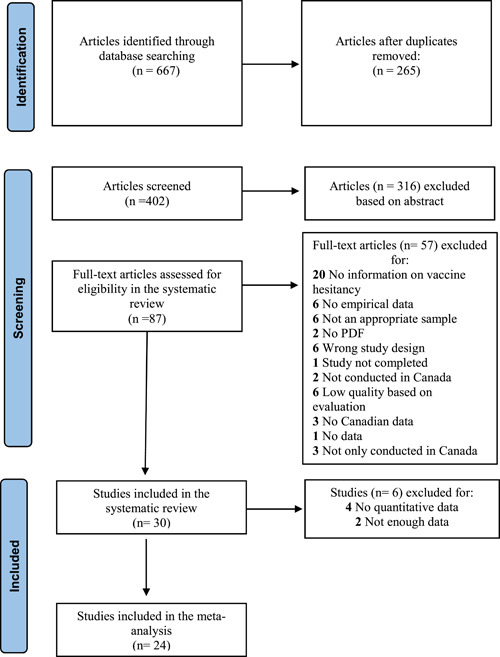
Preferred Reporting Items for Systematic Reviews and Meta‐analyses (PRISMA) flowchart of coronavirus disease 2019 (COVID‐19) vaccine hesitancy and unwillingness studies
2.5. Quality assessment
The JBI Critical appraisal checklists for Qualitative Research and for Cross‐sectional Research were used to evaluate the methodological quality of studies. 53 , 54 These tools assess the possible bias in the design, conduct, and analysis of a study. 53 , 54 For quantitative papers, authors evaluated eight criteria (e.g., appropriateness of the sample frame, recruitment procedure, adequacy of the sample size, description of participants, and setting). One point was assigned to studies for each criterion met and those with five and more were included. For qualitative studies, the JBI contains 10 criteria and studies with a score of 6 and more were included. The quality of the articles was assessed by two pairs of authors individually (O. O. and S. F., A. M. and C. B.) and verified by the principal investigator (J. M. C). The score for each study is presented in the last column of Table 1.
2.6. Data extraction
Two reviewers extracted study details pertaining to study publication, sample characteristics, study methods, description of measures used, variables assessed, main findings, and quality of assessment. Data extraction was performed in Microsoft Office Excel using a standardized data extraction form.
2.7. Statistical procedure
Random‐effects meta‐analysis was conducted in STATA/SE 14. The proportions of COVID‐19 vaccine hesitancy and unwillingness were estimated separately. The proportions were transformed using the Freeman–Tukey Double Arcsine Transformation to stabilize the variances. 55 Cochrane Q and the inconsistency index (I 2) were used to assess statistical heterogeneity. The I 2 values of 25%, 50%, and 75% are regarded as low, moderate, and high heterogeneity, respectively. 56 A series of subgroup analyses were performed to compare the proportions of the outcome variables among the years of evaluation (2020, 2021, or 2020‐21) and provinces (Ontario, Québec, British Columbia, and Atlantic provinces for vaccine hesitancy; Ontario, Quebec, British Columbia, and Alberta for vaccine unwillingness). Categories with at least two studies were included in the subgroup analyses. Moreover, the proportions of the outcome variables were compared for sex (female vs. male), racial identities (White vs. non‐White individuals), education level (secondary and below vs. postsecondary), and residence area (urban vs. rural) using Log Odds Ratio (Log ORs) with 95% Confidence Intervals (95% CIs). Meta‐regression analyses with random effects were conducted considering females' percentage, non‐White percentage, and the years of evaluation. Publication bias was tested using Egger's regression test.
3. RESULTS
A flow chart of study retrieval and selection is provided in Figure 1. A total of 667 studies were imported into Covidence for screening. After removing duplicates (265), two authors thoroughly screened 402 articles at the title and abstract levels. Eighty‐seven full texts were assessed for eligibility in the systematic review and 57 were excluded. A total of 30 studies were retained for the systematic review and 24 that had enough quantitative data were included in the meta‐analysis. The studies included in the meta‐analysis are identified in Table 1 by an asterisk.
A total of 30 studies from 2020 to 2022 with a sample size of 136 889 participants living in Canada were included in the current study. Most studies used samples of adults (N = 26). Sixteen studies addressed vaccine hesitancy (i. e., doubts concerning the reception of a COVID‐19 vaccine) 6 , 7 , 8 , 16 , 17 , 29 , 33 , 34 , 37 , 39 , 44 , 45 , 46 , 47 , 48 , 50 and 14 studies explored vaccine unwillingness (i.e., the likelihood of refusing a COVID‐19 vaccine). 28 , 30 , 32 , 35 , 36 , 38 , 40 , 41 , 42 , 43 , 46 , 49 , 51 , 52 The characteristics of the studies are presented in Table 1.
3.1. Meta‐analyses findings
3.1.1. COVID‐19 vaccine hesitancy
Twelve papers reported the prevalence of COVID‐19 vaccine hesitancy among Canadians. 6 , 7 , 8 , 16 , 17 , 33 , 37 , 39 , 45 , 47 , 48 , 50 The pooled prevalence of COVID‐19 vaccine hesitancy was 42.3% (95% CI, 33.7%−51.0%, Figure 2). The heterogeneity level in the analysis was high (I 2 = 99.03%. Q = 3042.63 p < 0.001, τ 2 = 0.036). The subgroup analysis showed that the pooled prevalence of COVID‐19 vaccine hesitancy did not differ across the years of evaluation (χ 2 = 0.00, p = 1; Figure 3) and provinces (χ 2 = 1.06, p = 0.787; Figure 4). The covariates in the meta‐regression model were not statistically associated with the pooled prevalence of COVID‐19 vaccine hesitancy (Table 2). Six papers 6 , 7 , 16 , 17 , 39 , 45 and three papers 6 , 16 , 33 reported the prevalence of COVID‐19 vaccine hesitancy in females and males, and White and non‐White individuals, respectively. The prevalence of COVID‐19 vaccine hesitancy was significantly higher in females (34.9% [95% CI, 20.1%−49.8%]) than males (31.9% [95% CI, 16.0%−47.8%]), Log OR = 0.21 (95% CI, 0.03, 0.38), z = 2.34, p = 0.019 (Figure 5). However, no significant differences were found among White (41.6% [95% CI, 20.5%−62.6%]) and non‐White (51.6% [95%, 30.3%−72.8%]) individuals, Log OR = 0.42 (95% CI, −0.09, 0.94), z = 1.60, p = 0.109 (Figure 6). Four papers 6 , 16 , 39 , 45 reported the prevalence of the COVID‐19 vaccine hesitancy in secondary or less and postsecondary education. There were no significant differences between secondary/less (37.1% [95% CI, 11.6%−62.6%]) and postsecondary education (29.7% [95% CI, 12.7%−47.0%]), Log OR = 0.35 (95% CI, −0.06, 0.75), z = 1.69, p = 0.090 (Figure 7). Two studies 39 , 45 reported the prevalence of COVID‐19 vaccine hesitancy among residential areas. The results showed that the prevalence of COVID‐19 vaccine hesitancy was significantly higher in individuals who were living in rural areas (16.3% [95% CI, 12.9%−19.7%]) than those who were living in urban area (14.1% [95% CI, 9.9%−18.3%]), Log OR = −0.27 (95% CI, −0.38, −0.16), z = −4.75, p < 0.001 (Figure 8). The Egger's test showed no substantial asymmetry for the pooled prevalence (z = −1.71, p = 0.088), female and male comparisons (z = −0.05, p = 0.958), and education level comparisons (z = 0.00, p = 0.997), while there was significant asymmetry for White and non‐White comparisons (z = −3.48, p < 0.001). The Egger's test was not conducted for residence area comparisons due to a lack of studies. The funnel plots are presented in Supporting Information: Figure 1.
Figure 2.
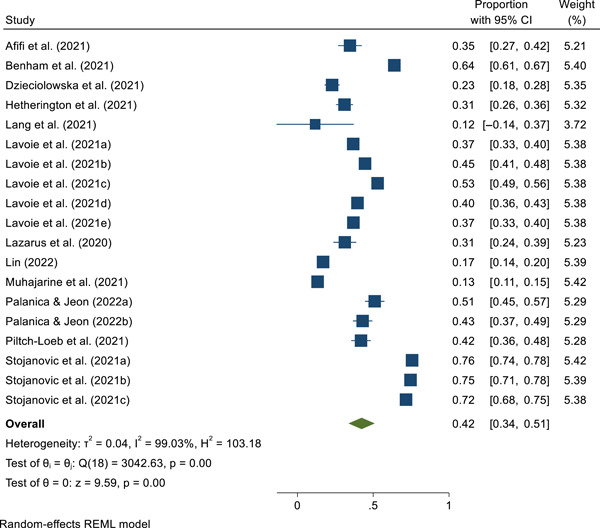
The pooled prevalence of coronavirus disease 2019 (COVID‐19) vaccine hesitancy
Figure 3.
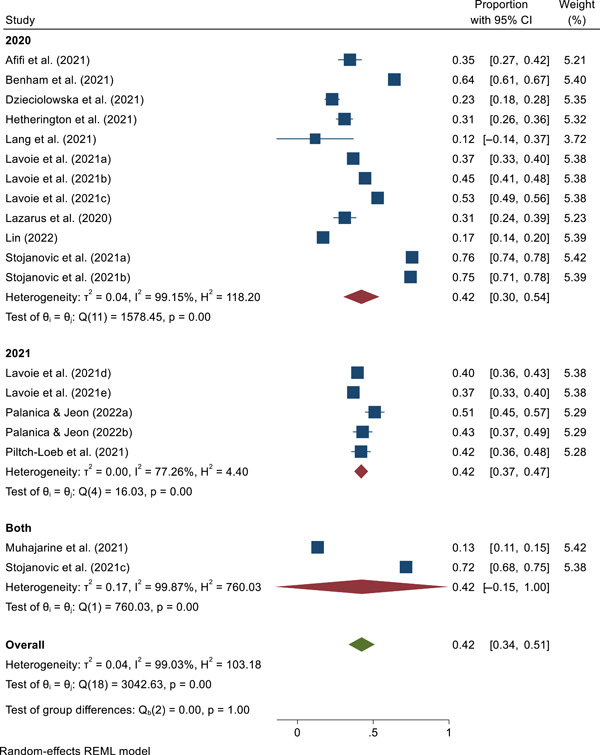
The prevalence of coronavirus disease 2019 (COVID‐19) vaccine hesitancy across the years of evaluation
Figure 4.
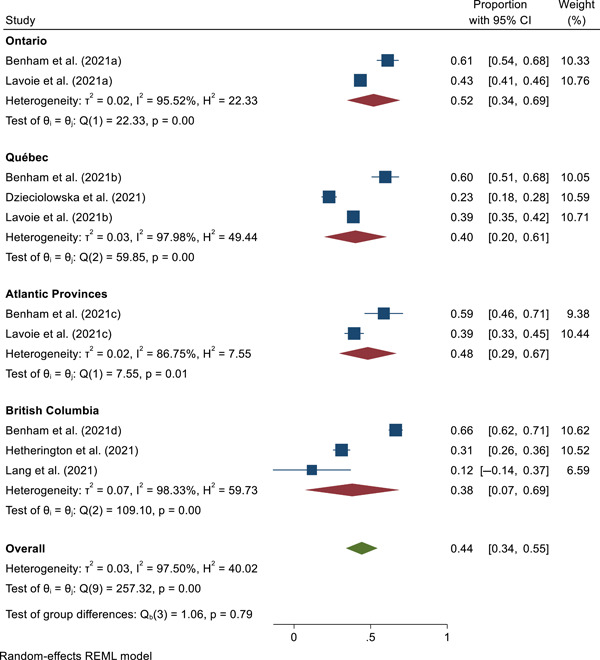
The prevalence of coronavirus disease 2019 (COVID‐19) vaccine hesitancy across provinces
Table 2.
The meta‐regression results for COVID‐19 vaccine hesitancy
| Covariates | B (SE) | z | 95% CI |
|---|---|---|---|
| Female % | −0.27 (0.35) | −0.78 | −0.96, 0.42 |
| Non‐White % | 0.34 (0.74) | 0.46 | −1.11, 1.79 |
| Year of evaluation | |||
| 2021 | 0.00 (0.11) | 0.02 | −0.20, 0.21 |
| 2020–2021 | 0.00 (0.15) | 0.01 | −0.29, 0.30 |
Figure 5.
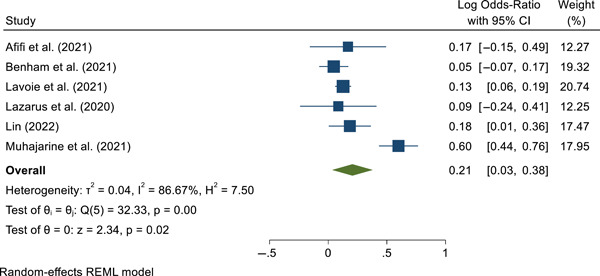
Gender differences of coronavirus disease 2019 (COVID‐19) vaccine hesitancy
Figure 6.
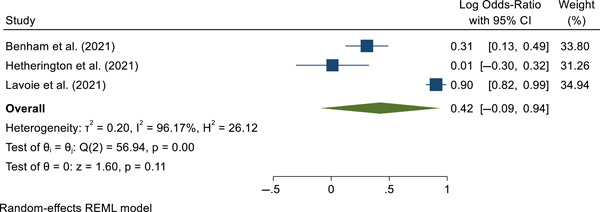
Race differences of coronavirus disease 2019 (COVID‐19) vaccine hesitancy
Figure 7.
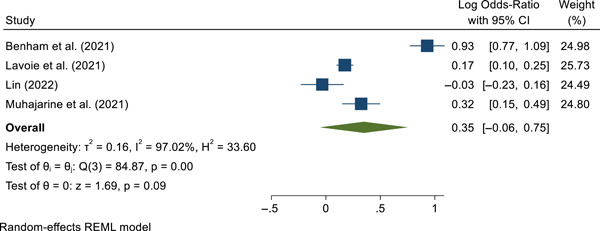
Education differences of coronavirus disease 2019 (COVID‐19) vaccine hesitancy
Figure 8.

Residence area differences of coronavirus disease 2019 (COVID‐19) vaccine hesitancy
3.1.2. COVID‐19 vaccine Unwillingness/Intention
Twelve papers reported the prevalence of the unwillingness to be vaccinated for COVID‐19. 28 , 30 , 35 , 36 , 38 , 40 , 41 , 42 , 46 , 49 , 51 , 52 The pooled prevalence of COVID‐19 vaccine unwillingness was 20.1% (95% CI, 15.2%−24.9%; Figure 9). The heterogeneity level in the analysis was high (I 2 = 97.05%. Q = 351.50, p < 0.001, τ 2 = 0.007). The subgroup analysis showed the pooled prevalence of COVID‐19 vaccine unwillingness did not differ across the years of evaluation (χ 2 = 2.70, p = 0.259; Figure 10) and provinces (χ 2 = 1.55, p = 0.670; Figure 11). The covariates in the meta‐regression model were not statistically associated with the pooled prevalence of COVID‐19 vaccine unwillingness (Table 3). Seven papers 28 , 30 , 40 , 46 , 49 , 51 , 52 and eight papers 28 , 36 , 38 , 40 , 42 , 46 , 49 , 52 reported the prevalence of COVID‐19 vaccine unwillingness in females and males, and White and non‐White individuals, respectively. The prevalence of COVID‐19 vaccine unwillingness was higher in females (18.3% [95% CI, 12.4%−24.2%]) than in males (13.9% [95% CI, 9.0%−18.8%]), Log OR = 0.32 (95% CI, 0.06, 0.58), z = 2.41, p = 0.016 (Figure 12). Furthermore, the prevalence of COVID‐19 vaccine unwillingness was higher in non‐White individuals (21.7% [95% CI, 16.2%−27.3%]) compared with White individuals (14.8% [95% CI, 11.0%−18.5%]), Log OR = 0.49 (95% CI, 0.17, 0.81), z = 3.00, p = 0.003 (Figure 13). Eight papers 28 , 30 , 36 , 40 , 42 , 46 , 51 , 52 reported the prevalence of the COVID‐19 vaccine unwillingness in secondary or less and postsecondary education. There were significant differences between secondary or less (24.2% [95% CI, 18.8%−29.6%]) and postsecondary education (15.9% [95% CI, 11.6%−20.2%]), Log OR = 0.56 (95% CI, 0.31, 0.80), z = 4.41, p < 0.001 (Figure 14). Two studies 28 , 30 reported the prevalence of COVID‐19 vaccine unwillingness among residential areas. No significant differences were found between individuals who were living in rural areas (24.0% [95% CI, 16.4%−31.7%]) and those who were living in urban area (20.7% [95% CI, 8.9%−32.6%]), Log OR = −0.28 (95% CI, −0.60, 0.03), z = −1.77, p = 0.078 (Figure 15). The Egger's test indicated no substantial asymmetry for the pooled prevalence (z = 0.27, p = 0.789), female and male comparisons (z = 0.68, p = 0.498), White and non‐White comparisons (z = 0.77, p = 0.439), and education level comparisons (z = −0.08, p = 0.939), therefore, there is no evidence of publication bias. The Egger's test was not conducted for residence area comparisons due to a lack of studies. The funnel plots are presented in Supporting Information: Figure 2.
Figure 9.
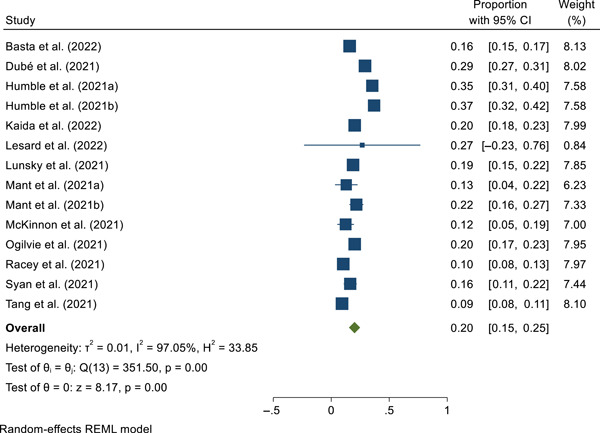
The pooled prevalence of unwillingness/intention to receive the coronavirus disease 2019 (COVID‐19) vaccine
Figure 10.
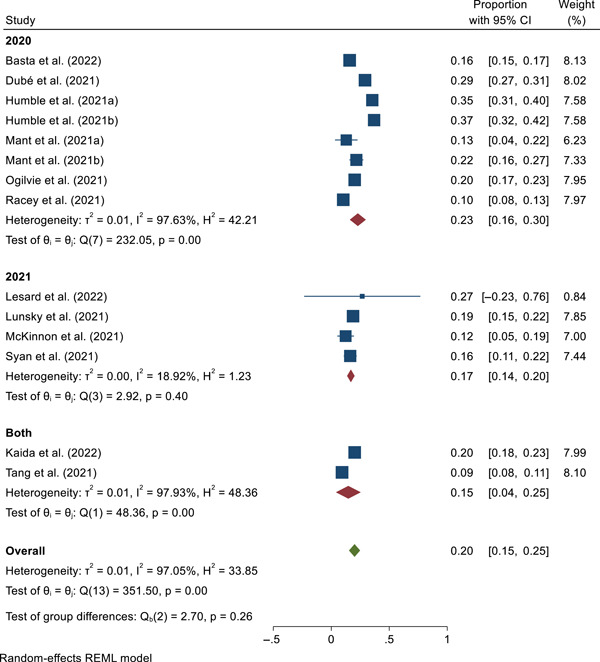
The prevalence of coronavirus disease 2019 (COVID‐19) vaccine unwillingness across the years of evaluation
Figure 11.
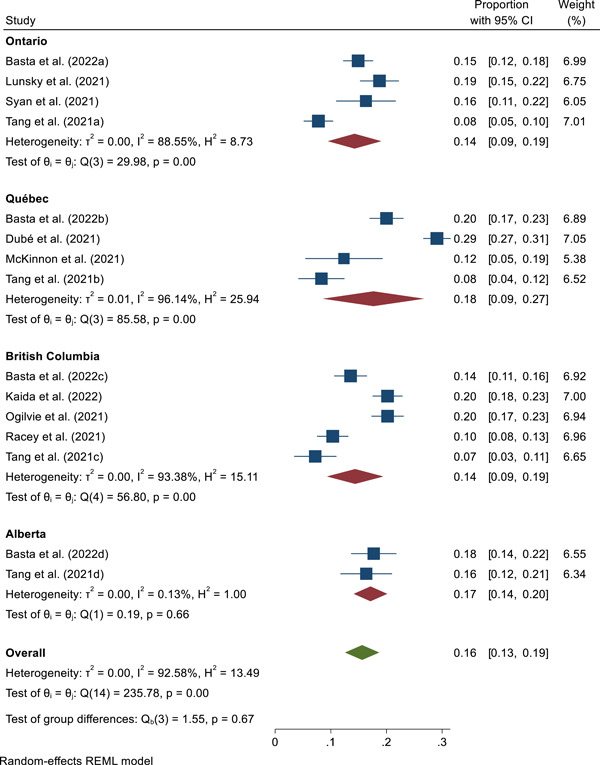
The prevalence of coronavirus disease 2019 (COVID‐19) vaccine unwillingness across provinces
Table 3.
The meta‐regression results for COVID‐19 vaccine unwillingness
| Covariates | B (SE) | z | 95% CI |
|---|---|---|---|
| Female % | −0.23 (0.21) | −1.10 | −0.63, 0.18 |
| Non‐White % | 0.28 (0.21) | 1.33 | −0.13, 0.69 |
| Year of Evaluation | |||
| 2021 | −0.07 (0.06) | −1.09 | −0.18, 0.05 |
| 2020–2021 | −0.08 (0.07) | −1.19 | −0.22, 0.05 |
Figure 12.
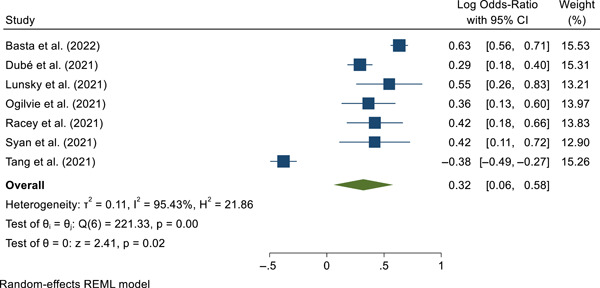
Gender differences of coronavirus disease 2019 (COVID‐19) vaccine unwillingness
Figure 13.
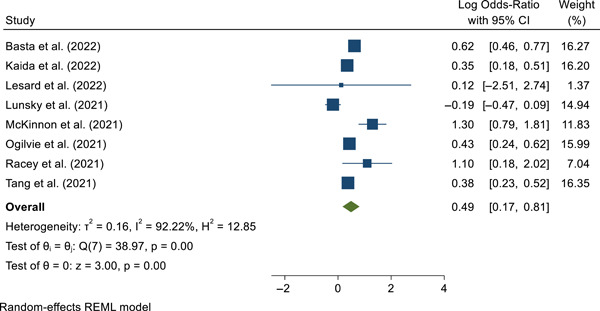
Race differences of coronavirus disease 2019 (COVID‐19) vaccine unwillingess
Figure 14.
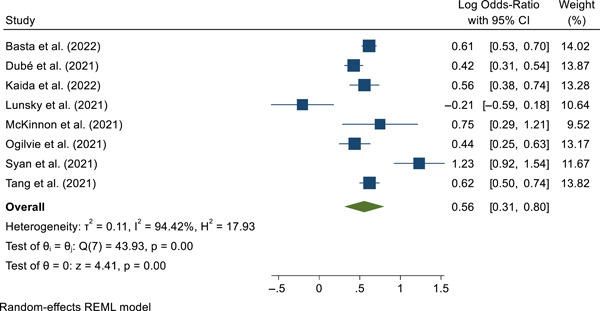
Education differences of coronavirus disease 2019 (COVID‐19) vaccine unwillingess
Figure 15.

Residence area differences of coronavirus disease 2019 (COVID‐19) vaccine unwillingess
3.2. Narrative review
Completing a narrative review of the studies including the systematic review and meta‐analysis sheds light on factors that are associated with vaccine hesitancy and unwillingness (e.g., sociodemographic factors, environmental factors, beliefs on COVID‐19 vaccinations). The most‐reported factors influencing vaccination hesitancy and unwillingness included age, sex, level of education, race, and socioeconomic status. Results are presented for both vaccine hesitancy and vaccine unwillingness in each factor's section.
3.2.1. Age
Most studies highlighted that vaccine hesitancy was related to younger age, 6 , 8 , 16 , 44 , 45 , 47 , 50 whereas two studies found no significant age differences. 7 , 17 Six studies observed a preponderance of lower vaccine hesitancy among people over the age of 40, particularly people over the age of 65. 6 , 8 , 16 , 39 , 45 , 50 Moreover, one study reported that parents with children under the age of 18 were more hesitant to vaccinate their children. 16
Many researchers reported that the willingness to accept a vaccine was related to older age. 28 , 40 , 49 People over the age of 60 were reported as the most willing age group to receive a vaccination in four studies. 28 , 30 , 40 , 49 The tendency to vaccinate children under the age of 12 was found to be trending downward in one study (r = −0.28 32 ), whereas other researchers found that most parents would vaccinate their children (63.1% 35 ). Other researchers pointed out that parents' willingness to vaccinate a child increases as the child's age increases. 42 By contrast, Tang et al. 52 reported that participants aged 40–59 had the lowest vaccination intention (11.6%).
3.2.2. Gender
Results on vaccine hesitancy according to sex indicated that women were more hesitant than men in five studies. 8 , 16 , 44 , 45 , 50 However, in three studies, researchers found no sex differences. 6 , 7 , 17 Among four studies with information on vaccine willingness and biological sex, men tended to be more willing to receive a COVID‐19 vaccination compared with women. 28 , 30 , 46 , 49 Conversely, one study reported that women were more willing than men. 51
3.2.3. Level of education
Vaccine hesitancy was related to a lower educational level in five studies. 6 , 16 , 33 , 39 , 44 More specifically, people with an education of high school or less were more hesitant, 16 that is, people with a bachelor's degree or more were less hesitant. 39 The willingness to accept a vaccine was related to higher levels of education, more specifically with having a postsecondary degree or higher in six studies. 28 , 36 , 42 , 49 , 51 , 52
3.2.4. Race
Five studies on vaccine hesitancy analyzed racial differences. 6 , 16 , 31 , 37 , 45 Three studies found that racialized people were less likely to be vaccinated compared with White people. 16 , 31 , 37 One of these studies was conducted with a sample comparing 51 White people to 9 racialized people 37 and the other created two broad racial groups for comparisons (White vs. non‐White) 16 . Muhajarine et al. 45 found that Indigenous people were 2.4 times more likely to refuse a vaccination; among their full sample (N = 9, 252), 3.67% of participants were Indigenous. Although not specific to race, Lin 39 reported that Canadian‐born people were less hesitant than people who immigrated to Canada (15.5% vs. 21.5%). Some researchers found no race differences. 6
Five studies reported that being White was related to more willingness to be vaccinated than those who are part of a racially minoritized group, 28 , 36 , 42 , 46 , 52 whereas three studies found no racial differences. 40 , 49 , 51 Specifically, Basta and colleagues 28 compared White and non‐White people and reported that White people were more unwilling to receive a vaccine (4.1%) compared with non‐White people (7.6%). Similarly, a study found that racialized parents were two times less willing than White parents to vaccinate their children. 42 Ogilvie and colleagues 46 also found that non‐White people were more willing (73.8%) to receive vaccines compared with White (80.8%), 0.67 (95% CI: 0.55–0.81), p < 0.0001). 46 Furthermore, another study indicated that Indigenous people were among the most unwilling groups to receive a vaccination (15%) alongside people who identified as visible minorities (12%). 52 One of the few studies to analyze racial issues in more detail 36 found that African/Caribbean/and Black (57.1%), Indigenous (65.1%), and multiracial people (77.8%) people were less likely to be vaccinated compared with White people (80.9%).
3.2.5. Socioeconomic status
Vaccine hesitancy was related to lower socioeconomic status in four studies. 7 , 16 , 33 , 50 For example, Afifi et al. 7 found that people with income instability were less likely to accept a COVID‐19 vaccine. Moreover, people living under the poverty line in Canada (under a 60, 000$ annual income) were more hesitant. 16 The willingness to accept a vaccine was correlated with higher income in three studies, 28 , 36 , 42 especially living above the poverty line.
3.2.6. Additional factors
Vaccine hesitancy was reported to be related to several factors including concerns that receiving a vaccine has more risks than benefits, 6 , 29 fear of side effects, 6 , 39 , 47 belief that insufficient research had been conducted on the vaccine, 29 , 47 , 48 mistrust in vaccines, 8 , 39 , 44 insufficient time to reflect on accepting the vaccine, 8 having an incomplete vaccination history, 16 , 29 , 33 believing that COVID‐19 will not affect the person or the people around them, 6 , 16 , 29 , 44 living in rural areas, 50 holding more conservative political views, 6 and poorer executive functions. 34
The willingness to accept a vaccine was related to living in an urban area, 28 scepticism of conspiracy theories, 30 , 38 confidence in the COVID‐19 vaccine, 28 , 30 , 35 , 38 previous receipt of other types of vaccines such as the flu shot, 38 belief that there was sufficient information available on the COVID‐19 vaccine, 38 , 43 , 49 concern that COVID‐19 is severe, 30 , 41 being personally affected by COVID‐19, 41 and encouragement by primary physicians or others to receive the vaccine. 41 , 49
4. DISCUSSION
We synthesized studies on the prevalence and factors associated with the Canadian population's vaccine hesitancy and unwillingness to be vaccinated against COVID‐19. We found that more than two in five people were reluctant to get vaccinated. The results showed that women were more reluctant to get vaccinated compared with men. A marginal difference was found between those with a high school education or less (37.1%) compared with those with a postsecondary education (29.7%). Although few studies have explored the issues associated with Canadians living in urban versus rural areas, the former group was found to be less likely hesitant about vaccination compared with the latter group. However, there was no significant difference by year of publication of the studies (2020 vs. 2021) or between White and non‐White individuals. Results regarding unwillingness to get vaccinated revealed that one in five people did not intend to get vaccinated. Women were more likely to report not intending to get vaccinated compared with men. The results also showed that non‐White people were more likely to not intend to be vaccinated compared with White people. In addition, the results showed that Canadians with a high school education or less were more likely to not intend to be vaccinated compared with those with a postsecondary degree.
The results of this study showed that a high proportion of Canadians are hesitant about being vaccinated against COVID‐19 and that one in five people did not want to get vaccinated. Although the results on unwillingness to get vaccinated show that one in five people in Canada does not plan to get vaccinated, systematic reviews from other countries have shown even more unwillingness. 57 , 58 , 59 , 60 A systematic review including 46 independent samples from studies conducted in the United States found that only 61% of people were willing to be vaccinated. 57 Results from three systematic reviews of students from 42 countries (69%), 58 33 low‐ and middle‐income countries (LMICs) (58.5%), 59 and one from 30 countries (66.01%) also found low rates of willingness to be vaccinated. Interestingly, the rate of vaccine hesitancy is higher in Canada (41.8%) compared with the rate observed in LMICs (38.2%). 59 Although we expected greater acceptance of vaccination in 2021 compared with 2020, the proportions of vaccine hesitancy and nonintention to be vaccinated did not change between the 2 years, indicating that the differences may lie in biosocial factors, rather than time.
This study found gender differences, suggesting that women were both more reluctant and less likely to get vaccinated. This finding echoes those observed in other meta‐analyses conducted in several other countries. 57 , 61 One reason for this difference may be the persistent theory that COVID‐19 vaccination is linked to problems with fertility and infant malformation. 62 , 63 This theory has caused many young women of childbearing age to hesitate about vaccination and not to consider being vaccinated. In fact, a systematic review of a sample of 703,004 pregnant women found a low rate of vaccination among them compared with the rest of the population. 64 These findings also align with a systematic review that found that women were less likely to be vaccinated for diphtheria, influenza, tetanus, and pertussis, compared with men. 65 Similarly, the results showed that education level was a factor associated with willingness to be vaccinated and marginally with vaccine hesitancy. This finding is consistent with other studies elsewhere, both in high‐income and LMICs. 59 This is an important factor that should be considered in the development of vaccination programs by public health agencies to educate populations. Additionally, results indicated that individuals living in rural areas are more reluctant to be vaccinated. However, the available results are too few to draw firm conclusions.
A small number of studies presented sociodemographic data in sufficient detail to be included in the quantitative analyses. However, the results suggest that non‐White individuals were less likely to intend to be vaccinated compared with White individuals. In addition, the few studies that provided details by racial group showed that Black, Indigenous, and multiracial individuals were more hesitant to get vaccinated and had less intention to vaccinate. 36 , 45 The one study that did not find significant differences had a small sample from racialized communities (85.9% White, 14.1% Native American, Asian, Caribbean, African, and South American). 6 Although these individuals were each time more hesitant, this difference was not significant and the quality of the sample can be questioned. 6 A systematic review in the United States found that Black people were 3.14 times more likely to refuse to get vaccinated compared with White people. 57 , 61
5. LIMITATIONS
First, although social and racial disparities emerged early in COVID‐19 vaccination surveys 14 , 15 few studies included in this systematic review explored issues related to race, gender, age, salary, education, and vaccine hesitancy, and willingness to be vaccinated. On racial issues, which have been particularly important given the major disparities that have been observed in some communities (e.g., Black communities) on infection, hospitalization, mortality, stigma, and mental health, 66 , 67 we were only able to conduct an analysis between White and non‐White individuals. Yet, we know that this analysis does not capture the full picture because the CCHS results showed that only 56.4% of Black people were likely to get vaccinated, whereas the rate was 77.7% for White people and 82.5% for South Asians. Our analyses would have been more accurate if we had enough data to perform them by different racial groups (e.g., Asian, Black, Indigenous, and White). Age‐related issues, which are an important aspect of vaccination against COVID‐19, could not be analyzed quantitatively because too few studies have reported age‐related outcomes. Although we have made efforts to report the few results available, analyses of issues related to race, gender, age, salary, and education level and their association with vaccine hesitancy and unwillingness should be systematically reported by studies as they are important for developing and implementing awareness and education programs that respond to the real needs of the Canadian population. Similarly, few Canadian studies have analyzed the factors often cited in the literature to explain vaccine hesitancy, such as distrust of vaccines and concerns about side effects. Studies are needed to assess these vaccine‐related concerns and to develop programs to address them. Finally, vaccine hesitancy for COVID‐19 and vaccine unwillingness related to COVID‐19 are newly explored constructs. Although rigorous assessment has been done to remove low‐quality studies, the measurement of these constructs has not always been done systematically and is sometimes not informed by previous studies on vaccination related to other infectious diseases. The development of measures with excellent psychometric properties should be a priority for researchers to ensure that the same constructs are measured in different vaccine hesitancy and unwillingness studies.
6. CONCLUSIONS
We found that many people remain hesitant about vaccination in Canada, even though the majority of the population was willing to be vaccinated. While the pandemic has revealed significant racial disparities in which Black communities are less likely to be vaccinated, the need to analyze racial issues is important. The lack of Canadian research that remains colorblind on this issue and on other health issues should be addressed. 68 The same observations can be made for age‐related issues, which were at the heart of the pandemic, but have failed to be the focus of research initiatives. Future work should consider key factors, such as race and ethnicity, age, gender, education level, socioeconomic status, living in rural areas, and the province of residence for the development of prevention and education programs aimed at improving vaccination rates and equitable access. New research should investigate emerging factors related to distrust and concern about vaccination from the population's perspectives (i.e., being afraid of side effects, mistrust of vaccines, poorer executive functions, and more conservative views). This study informs key considerations for integrative models of care as well as federal and provincial public health programs for vaccination against COVID‐19 and other diseases.
AUTHOR CONTRIBUTION
Dr. Cénat and M. Farahi had full access to all the data in the study and take responsibility for the integrity of the data and the accuracy of the data analysis. Concept and design: Cénat, Noorishad, Farahi, Darius, Labelle. Acquisition and extraction of data: Mesbahi, Onesi, Broussard, Furyk, Noorishad, Farahi, Cénat. Statistical analysis: Cénat and Farahi. Interpretation of data: All the authors. Drafting of the manuscript: Cénat, Noorishad, Farahi, Darius, and Labelle. Critical revision of the manuscript for important intellectual content: Caulley, Chomienne, Etowa, Yaya, Labelle, Noorishad, Darius. Administrative, technical, or material support: Darius and Cénat. Supervision: Cénat.
CONFLICT OF INTEREST
The authors declare no conflict of interest.
Supporting information
Supplementary information.
ACKNOWLEDGMENT
This article was supported by grant #469050 from the Canadian Institutes of Health Research (CIHR) and the grant # 4500440446 from the Public Health Agency of Canada (PHAC).
Cénat JM, Noorishad P‐G, Moshirian Farahi SMM, et al. Prevalence and factors related to COVID‐19 vaccine hesitancy and unwillingness in Canada: A systematic review and meta‐analysis. J Med Virol. 2022;1‐36. 10.1002/jmv.28156
DATA AVAILABILITY STATEMENT
Data that support the findings of this study are available from the corresponding author upon reasonable request.
REFERENCES
- 1. World Health Organization. WHO Director‐General's opening remarks at the media briefing on COVID‐19 − 11 March 2020. Accessed May 24, 2020. https://www.who.int/dg/speeches/detail/who-director-general-s-opening-remarks-at-the-media-briefing-on-covid-19-11-march-2020 [Google Scholar]
- 2. Unruh L, Allin S, Marchildon G, et al. A comparison of 2020 health policy responses to the COVID‐19 pandemic in Canada, Ireland, the United Kingdom and the United States of America. Health Policy. 2022;126(5):427‐437. 10.1016/j.healthpol.2021.06.012 [DOI] [PMC free article] [PubMed] [Google Scholar]
- 3. World Health Assembly . The ACT‐accelerator status & urgent priorities. Geneva, World Health Organization; 2020.
- 4. National Advisory Committee on Immunization . Recommendations on the use of COVID‐19 vaccines. 2021. Accessed July 20, 2022. https://www.canada.ca/en/public-health/services/immunization/national-advisory-committee-on-immunization-naci/recommendations-use-covid-19-vaccines.html
- 5. Nazlı ŞB, Yığman F, Sevindik M, Deniz Özturan D. Psychological factors affecting COVID‐19 vaccine hesitancy. Ir J Med Sci. 2022;191(1):71‐80. 10.1007/s11845-021-02640-0 [DOI] [PMC free article] [PubMed] [Google Scholar]
- 6. Benham JL, Atabati O, Oxoby RJ, et al. COVID‐19 vaccine–related attitudes and beliefs in Canada: national cross‐sectional survey and cluster analysis. JMIR Public Heal Surveill. 2021;7(12):e30424. 10.2196/30424 https//publichealth.jmir.org/2021/12/e30424 [DOI] [PMC free article] [PubMed] [Google Scholar]
- 7. Afifi TO, Salmon S, Taillieu T, Stewart‐Tufescu A, Fortier J, Driedger SM. Older adolescents and young adults willingness to receive the COVID‐19 vaccine: implications for informing public health strategies. Vaccine. 2021;39(26):3473‐3479. 10.1016/j.vaccine.2021.05.026 [DOI] [PMC free article] [PubMed] [Google Scholar]
- 8. Dzieciolowska S, Hamel D, Gadio S, et al. Covid‐19 vaccine acceptance, hesitancy, and refusal among Canadian healthcare workers: a multicenter survey. Am J Infect Control. 2021;49(9):1152‐1157. 10.1016/J.AJIC.2021.04.079 [DOI] [PMC free article] [PubMed] [Google Scholar]
- 9. Shen SC, Dubey V. Addressing vaccine hesitancy: clinical guidance for primary care physicians working with parents. 2019;65 (3):175‐181. [PMC free article] [PubMed] [Google Scholar]
- 10. MacDonald NE, SAGE Working Group on Vaccine H. Vaccine hesitancy: definition, scope and determinants. Vaccine. 2015;33(34):4161‐4164. 10.1016/j.vaccine.2015.04.036 [DOI] [PubMed] [Google Scholar]
- 11. COSMO Canada . Wave 11 Results | COSMO Canada. Impact Canada Initiative.
- 12. Gouvernement du Canada . Archivée 22: Recommandations sur l'utilisation des vaccins contre la COVID‐19 [2021‐10‐22] ‐ Canada.ca.
- 13. Public Health Agency of Canada . Emerging evidence on COVID‐19 evergreen rapid review on COVID‐19 vaccine attitudes and uptake‐update 8. 2021. [Google Scholar]
- 14. Frank K, Arim R . Canadians' willingness to get a COVID‐19 vaccine: group differences and reasons for vaccine hesitancy. 2022. Accessed July 20, 2020. https://www150.statcan.gc.ca/n1/pub/45-28-0001/2020001/article/00073-eng.htm
- 15. Vaccine Willingness among Canadian Population Groups . Statistics Canada. The Daily—Study: COVID‐19. 2022. Accessed July 20, 2021. https://www150.statcan.gc.ca/n1/daily-quotidien/210326/dq210326b-eng.htm
- 16. Lavoie K, Gosselin‐Boucher V, Stojanovic J, et al. Understanding national trends in COVID‐19 vaccine hesitancy in Canada: results from five sequential cross‐sectional representative surveys spanning April 2020‐March 2021. BMJ Open. 2022;12(4):e059411. 10.1136/BMJOPEN-2021-059411 [DOI] [PMC free article] [PubMed] [Google Scholar]
- 17. Lazarus JV, Wyka K, Rauh L, et al. Hesitant or not? the association of age, gender, and education with potential acceptance of a COVID‐19 vaccine: a country‐level analysis. J Health Commun. 2020;25(10):799‐807. 10.1080/10810730.2020.1868630 [DOI] [PubMed] [Google Scholar]
- 18. Page MJ, McKenzie JE, Bossuyt PM, et al. The PRISMA 2020 statement: an updated guideline for reporting systematic reviews. BMJ. 2021;10:89. 10.1136/BMJ.N71 [DOI] [PMC free article] [PubMed] [Google Scholar]
- 19. Helliwell JA, Bolton WS, Burke JR, Tiernan JP, Jayne DG, Chapman SJ. Global academic response to COVID‐19: cross‐sectional study. Learn Publ. 2020;33(4):385‐393. 10.1002/LEAP.1317 [DOI] [PMC free article] [PubMed] [Google Scholar]
- 20. Levay P, Finnegan A. The NICE COVID‐19 search strategy for Ovid MEDLINE and embase: developing and maintaining a strategy to support rapid guidelines. medRxiv. 2021. 10.1101/2021.06.11.21258749 [DOI] [Google Scholar]
- 21. Nussbaumer‐Streit B, Mayr V, Dobrescu AI, et al. Quarantine alone or in combination with other public health measures to control COVID‐19: a rapid review. Cochrane Database Syst Rev. 2020;2020(4):1‐46. 10.1002/14651858.CD013574 [DOI] [PMC free article] [PubMed] [Google Scholar]
- 22. Aw J, Seng JJB, Seah SSY, Low LL. Covid‐19 vaccine hesitancy—a scoping review of literature in high‐income countries. Vaccines. 2021;9(8):900. 10.3390/vaccines9080900 [DOI] [PMC free article] [PubMed] [Google Scholar]
- 23. Jarrett C, Wilson R, O'leary M, Eckersberger E, Larson HJ, SAGE Working Group on Vaccine H. Strategies for addressing vaccine hesitancy—a systematic review. Vaccine. 2015;33(34):4180‐4190. 10.1016/J.VACCINE.2015.04.040 [DOI] [PubMed] [Google Scholar]
- 24. Larson HJ, Jarrett C, Eckersberger E, Smith DMD, Paterson P. Understanding vaccine hesitancy around vaccines and vaccination from a global perspective: a systematic review of published literature, 2007‐2012. Vaccine. 2014;32(19):2150‐2159. 10.1016/J.VACCINE.2014.01.081 [DOI] [PubMed] [Google Scholar]
- 25. Lalonde K COVID‐19 literature searches. Medical Library Association.
- 26. McGowan J, Sampson M, Salzwedel DM, Cogo E, Foerster V, Lefebvre C. PRESS peer review of electronic search strategies: 2015 guideline statement. J Clin Epidemiol. 2016;75:40‐46. 10.1016/j.jclinepi.2016.01.021 [DOI] [PubMed] [Google Scholar]
- 27. Tong A, Flemming K, McInnes E, Oliver S, Craig J. Enhancing transparency in reporting the synthesis of qualitative research: ENTREQ. BMC Med Res Methodol. 2012;12(1):1‐8. 10.1186/1471-2288-12-181/TABLES/2 [DOI] [PMC free article] [PubMed] [Google Scholar]
- 28. Basta NE, Sohel N, Sulis G, et al. Factors associated with willingness to receive a COVID‐19 vaccine among 23,819 adults aged 50 years or older: an analysis of the Canadian longitudinal study on aging. Am J Epidemiol. 2022;191(6):987‐998. 10.1093/aje/kwac029 [DOI] [PMC free article] [PubMed] [Google Scholar]
- 29. Benham JL, Lang R, Kovacs Burns K, et al. Attitudes, current behaviours and barriers to public health measures that reduce COVID‐19 transmission: a qualitative study to inform public health messaging. PLoS One. 2021;16(2):0246941. 10.1371/journal.pone.0246941 [DOI] [PMC free article] [PubMed] [Google Scholar]
- 30. Dubé È, Dionne M, Pelletier C, Hamel D, Gadio S. COVID‐19 vaccination attitudes and intention among Quebecers during the first and second waves of the pandemic: findings from repeated cross‐sectional surveys. Hum Vaccines Immunother. 2021;17(11):3922‐3932. 10.1080/21645515.2021.1947096 [DOI] [PMC free article] [PubMed] [Google Scholar]
- 31. Gerretsen P, Kim J, Quilty L, et al. Vaccine hesitancy is a barrier to achieving equitable herd immunity among racial minorities. Front Med. 2021;8:8. 10.3389/fmed.2021.668299 [DOI] [PMC free article] [PubMed] [Google Scholar]
- 32. Goldman RD, Yan TD, Seiler M, et al. Caregiver willingness to vaccinate their children against COVID‐19: cross sectional survey. Vaccine. 2020;38(48):7668‐7673. 10.1016/j.vaccine.2020.09.084 [DOI] [PMC free article] [PubMed] [Google Scholar]
- 33. Hetherington E, Edwards SA, MacDonald SE, et al. SARS‐CoV‐2 vaccination intentions among mothers of children aged 9 to 12 years: a survey of the all our families cohort. Can Med Assoc Open Access J. 2021;9(2):E548‐E555. 10.9778/CMAJO.20200302 [DOI] [PMC free article] [PubMed] [Google Scholar]
- 34. Hudson A, Hall PA, Hitchman SC, Meng G, Fong GT. Cognitive predictors of vaccine hesitancy and COVID‐19 mitigation behaviors in a population representative sample. medRxiv. 2022. 10.1101/2022.01.02.22268629 [DOI] [PMC free article] [PubMed] [Google Scholar]
- 35. Humble RM, Sell H, Dubé E, et al. Canadian parents' perceptions of COVID‐19 vaccination and intention to vaccinate their children: results from a cross‐sectional national survey. Vaccine. 2021;39(52):7669‐7676. 10.1016/J.VACCINE.2021.10.002 [DOI] [PMC free article] [PubMed] [Google Scholar]
- 36. Kaida A, Brotto LA, Murray MCM, et al. Intention to receive a COVID‐19 vaccine by HIV status among a population‐based sample of women and gender diverse individuals in British Columbia, Canada. AIDS Behav. 2022;26:2242‐2255. 10.1007/s10461-022-03577-w [DOI] [PMC free article] [PubMed] [Google Scholar]
- 37. Lang R, Benham JL, Atabati O, et al. Attitudes, behaviours and barriers to public health measures for COVID‐19: a survey to inform public health messaging. BMC Public Health. 2021;21(1):765. 10.1186/s12889-021-10790-0 [DOI] [PMC free article] [PubMed] [Google Scholar]
- 38. Lessard D, Ortiz‐Paredes D, Park H, et al. Barriers and facilitators to COVID‐19 vaccine acceptability among people incarcerated in Canadian federal prisons: a qualitative study. Vaccine X. 2022;10:10. 10.1016/j.jvacx.2022.100150 [DOI] [PMC free article] [PubMed] [Google Scholar]
- 39. Lin S. COVID‐19 pandemic and im/migrants' elevated health concerns in Canada: vaccine hesitancy, anticipated stigma, and risk perception of accessing care. J Immigr Minor Heal. 2022;24:896‐908. 10.1007/s10903-022-01337-5 [DOI] [PMC free article] [PubMed] [Google Scholar]
- 40. Lunsky Y, Kithulegoda N, Thai K, et al. Beliefs regarding COVID‐19 vaccines among Canadian workers in the intellectual disability sector prior to vaccine implementation. J Intellect Disabil Res. 2021;65(7):617‐625. 10.1111/jir.12838 [DOI] [PMC free article] [PubMed] [Google Scholar]
- 41. Mant M, Aslemand A, Prine A, Holland AJ. University students' perspectives, planned uptake, and hesitancy regarding the COVID‐19 vaccine: a multi‐methods study. PLoS One. 2021;16(8):e.0255447. 10.1371/journal.pon [DOI] [PMC free article] [PubMed] [Google Scholar]
- 42. McKinnon B, Quach C, Dubé È, Tuong Nguyen C, Zinszer K. Social inequalities in COVID‐19 vaccine acceptance and uptake for children and adolescents in Montreal, Canada. Vaccine. 2021;39(49):7140‐7145. 10.1016/J.VACCINE.2021.10.077 [DOI] [PMC free article] [PubMed] [Google Scholar]
- 43. Merkley E, Loewen PJ. Assessment of communication strategies for mitigating COVID‐19 vaccine‐specific hesitancy in Canada. JAMA Netw Open. 2021;4(9):2126635. 10.1001/jamanetworkopen.2021.26635 [DOI] [PMC free article] [PubMed] [Google Scholar]
- 44. Morillon GF, Poder TG. Public preferences for a COVID‐19 vaccination program in Quebec: a discrete choice experiment. Pharmacoeconomics. 2022;40:341‐354. 10.1007/s40273-021-01124-4 [DOI] [PMC free article] [PubMed] [Google Scholar]
- 45. Muhajarine N, Adeyinka DA, McCutcheon J, Green KL, Fahlman M, Kallio N. COVID‐19 vaccine hesitancy and refusal and associated factors in an adult population in Saskatchewan, Canada: evidence from predictive modelling. PLoS One. 2021;16(11 November):0259513. 10.1371/journal.pone.0259513 [DOI] [PMC free article] [PubMed] [Google Scholar]
- 46. Ogilvie GS, Gordon S, Smith LW, et al. Intention to receive a COVID‐19 vaccine: results from a population‐based survey in Canada. BMC Public Health. 2021;21(1):1017. 10.1186/s12889-021-11098-9 [DOI] [PMC free article] [PubMed] [Google Scholar]
- 47. Palanica A, Jeon J. Initial mix‐and‐match COVID‐19 vaccination perceptions, concerns, and side effects across Canadians. Vaccines. 2022;10(1):93. 10.3390/vaccines10010093 [DOI] [PMC free article] [PubMed] [Google Scholar]
- 48. Piltch‐Loeb R, Harriman NW, Healey J, et al. COVID‐19 vaccine concerns about safety, effectiveness, and policies in the United States, Canada, Sweden, and Italy among unvaccinated individuals. Vaccines. 2021;9(10):1138. 10.3390/vaccines9101138 [DOI] [PMC free article] [PubMed] [Google Scholar]
- 49. Racey CS, Donken R, Porter I, et al. Intentions of public school teachers in British Columbia, Canada to receive a COVID‐19 vaccine. Vaccine X. 2021;8:100106. 10.1016/j.jvacx.2021.100106 [DOI] [PMC free article] [PubMed] [Google Scholar]
- 50. Stojanovic J, Boucher VG, Gagne M, et al. Global trends and correlates of covid‐19 vaccination hesitancy: findings from the icare study. Vaccines. 2021;9(6):661. 10.3390/vaccines9060661 [DOI] [PMC free article] [PubMed] [Google Scholar]
- 51. Syan SK, Gohari MR, Levitt EE, et al. COVID‐19 vaccine perceptions and differences by sex, age, and education in 1,367 community adults in Ontario. Front Public Heal. 2021;9:719665. 10.3389/fpubh.2021.719665 [DOI] [PMC free article] [PubMed] [Google Scholar]
- 52. Tang X, Gelband H, Nagelkerke N, et al. COVID‐19 vaccination intention during early vaccine rollout in Canada: a nationwide online survey. Lancet Reg Heal ‐ Am. 2021;2:100055. 10.1016/J.LANA.2021.100055 [DOI] [PMC free article] [PubMed] [Google Scholar]
- 53. Moola S, Munn Z, Tufanaru C, et al. Chapter 7: systematic reviews of etiology and risk. JBI Man Evid Synth. 2020. 10.46658/JBIMES-20-08 [DOI] [Google Scholar]
- 54. Lockwood C, Munn Z, Porritt K. Qualitative research synthesis: methodological guidance for systematic reviewers utilizing meta‐aggregation. Int J Evid Based Healthc. 2015;13(3):179‐187. 10.1097/XEB.0000000000000062 [DOI] [PubMed] [Google Scholar]
- 55. Freeman MF, Tukey JW. Transformations related to the angular and the square root. Ann Math Stat. 1950;21(4):607‐611. 10.1214/aoms/1177729756 [DOI] [Google Scholar]
- 56. Higgins JPT, Thompson SG, Jonathan JD, Douglas GA. Measuring inconsistency in meta‐analyses. Br Med J. 2003;327(7414):557‐560. [DOI] [PMC free article] [PubMed] [Google Scholar]
- 57. Dhanani LY, Franz B. A meta‐analysis of COVID‐19 vaccine attitudes and demographic characteristics in the United States. Public Health. 2022;207:31‐38. 10.1016/J.PUHE.2022.03.012 [DOI] [PMC free article] [PubMed] [Google Scholar]
- 58. Geng H, Cao K, Zhang J, Wu K, Wang G, Liu C. Attitudes of COVID‐19 vaccination among college students: a systematic review and meta‐analysis of willingness, associated determinants, and reasons for hesitancy. Hum Vaccines Immunother. 2022. 10.1080/21645515.2022.2054260/SUPPL_FILE/KHVI_A_2054260_SM1422.ZIP [DOI] [PMC free article] [PubMed] [Google Scholar]
- 59. Patwary MM, Alam MA, Bardhan M, et al. COVID‐19 vaccine acceptance among low‐ and lower‐middle‐income countries: a rapid systematic review and meta‐analysis. Vaccines. 2022;10:427. 10.3390/VACCINES10030427 [DOI] [PMC free article] [PubMed] [Google Scholar]
- 60. Robinson E, Jones A, Lesser I, Daly M. International estimates of intended uptake and refusal of COVID‐19 vaccines: a rapid systematic review and meta‐analysis of large nationally representative samples. Vaccine. 2021;39(15):2024‐2034. 10.1016/J.VACCINE.2021.02.005 [DOI] [PMC free article] [PubMed] [Google Scholar]
- 61. Nehal KR, Steendam LM, Campos Ponce M, Van Der Hoeven M, Suzanne G, Smit A. Worldwide vaccination willingness for COVID‐19: a systematic review and meta‐analysis. 2021. 10.3390/vaccines [DOI] [PMC free article] [PubMed]
- 62. Nikpour M, Sepidarkish M, Omidvar S, Firouzbakht M. Global prevalence of acceptance of COVID‐19 vaccines and associated factors in pregnant women: a systematic review and meta‐analysis. Expert Rev Vaccines. 2022;21(6):843‐851. 10.1080/14760584.2022.2053677 [DOI] [PubMed] [Google Scholar]
- 63. Schaler L, Wingfield M. COVID‐19 vaccine—can it affect fertility. Irish J Med Sci. 2021(1971). 10.1007/s11845-021-02807-9 [DOI] [PMC free article] [PubMed] [Google Scholar]
- 64. Galanis P, Vraka I, Siskou O, Konstantakopoulou O, Katsiroumpa A, Kaitelidou D. Uptake of COVID‐19 vaccines among pregnant women: a systematic review and meta‐analysis. Vaccines. 2022;10(5):766. 10.3390/vaccines10050766 [DOI] [PMC free article] [PubMed] [Google Scholar]
- 65. Flanagan KL, Fink AL, Plebanski M, Klein SL. Sex and gender differences in the outcomes of vaccination over the life course. Annu Rev Cell Dev Biol. 2017;33:577‐599. 10.1146/annurev-cellbio-100616-060718 [DOI] [PubMed] [Google Scholar]
- 66. Allen UD . Reducing the impact of COVID‐19 on black communities in Canada: building confidence and decreasing vaccine hesitancy. 2021. Accessed July 20, 2022. https://rsc-src.ca/en/voices/reducing-impact-covid-19-black-communities-in-canada-building-confidence-and-decreasing
- 67. Miconi D, Li ZY, Frounfelker RL, et al. Ethno‐cultural disparities in mental health during the COVID‐19 pandemic: a cross‐sectional study on the impact of exposure to the virus and COVID‐19‐related discrimination and stigma on mental health across ethno‐cultural groups in Quebec (Canada). BJPsych Open. 2021;7:e14. 10.1192/bjo.2020.146 [DOI] [PMC free article] [PubMed] [Google Scholar]
- 68. Cénat JM. Who is black? The urgency of accurately defining the black population when conducting health research in Canada. CMAJ. 2022;194(27):E948‐E949. 10.1503/CMAJ.220274 [DOI] [PMC free article] [PubMed] [Google Scholar]
Associated Data
This section collects any data citations, data availability statements, or supplementary materials included in this article.
Supplementary Materials
Supplementary information.
Data Availability Statement
Data that support the findings of this study are available from the corresponding author upon reasonable request.


