Abstract
SARS‐CoV‐2 Omicron variant seemed to cause milder disease compared to previous predominated variants. We aimed to conduct a meta‐analysis to assess the pooled proportion of nonsevere disease and asymptomatic infection among COVID‐19 patients infected with Omicron and Delta. We searched PubMed, Embase, Web of Science, and China National Knowledge Infrastructure (CNKI) databases. We included studies of SARS‐CoV‐2 Omicron infection from November 1, 2021, to April 18, 2022, and studies of Delta infection from October 1, 2020, to June 30, 2022. Studies without corresponding data, with less than 50 patients, or obviously biased concerning main outcome were excluded. Meta‐analysis was performed in R 4.2.0 with the “meta” package. Subgroup analyses were conducted by study group and vaccination status. The pooled proportion of asymptomatic infection and nonsevere disease with Omicron were 25.5% (95% confidence interval [CI] 17.0%–38.2%) and 97.9% (95% CI 97.1%–98.7%), significantly higher than those of Delta with 8.4% (95% CI 4.4%–16.2%) and 91.4% (95% CI 87.0%–96.0%). During Omicron wave, children and adolescents had higher proportion of asymptomatic infection, SOTR and the elderly had lower proportion of nonsevere disease, vaccination of a booster dose contributed to higher proportion of both asymptomatic infection and nonsevere disease. This study estimates the pooled proportion of asymptomatic infection and nonsevere disease caused by SARS‐CoV‐2 Omicron compared to other predominant variants. The result has important implications for future policy making.
Keywords: asymptomatic infection, clinical severity, COVID‐19, meta‐analysis, SARS‐CoV‐2 variants
1. INTRODUCTION
The global pandemic coronavirus disease‐19 (COVID‐19), caused by the SARS‐CoV‐2 virus, began in China in 2020 and has since spread across the world. 1 , 2 The severity of COVID‐19 varies according to different infected individuals and mutant strains. Some COVID‐19 patients may develop the most common presenting symptoms including upper respiratory symptoms, fever, and fatigue, some may have no symptoms at all, while still some others can be critically ill. 3 , 4 Apart from contact and droplet transmission, SARS‐CoV‐2 can be transmitted through aerosol, which may lead to broad transmission far from the actual source, thus increasing the difficulty to control the pandemic. 5 The B.1.1.529 (Omicron) variant of SARS‐CoV‐2, first identified in South Africa in November 2021, has driven the largest wave of infection thus far. 6 With its 3.31‐fold higher transmissibility than the Delta variant, decreased pathogenicity was deduced and further inferred by recent studies on the clinical severity of Omicron. 7 , 8 , 9 Nonetheless, the large number of infections during a short period of time laid huge burdens on health care resources and aroused great panic among people in affected areas. 10
To accurately value the clinical severity of COVID‐19 caused by the Omicron variant, the proportion of nonsevere disease, including asymptomatic infection needs to be calculated. If we do not have robust statistics of the proportion of nonsevere diseases and asymptomatic infections caused by Omicron and compare them with those of other predominant variants, it is hard to understand the true impact of the Omicron wave in any susceptible population, which may hinder policy development. When it comes to the policy making of the reopening of the previous “lockdown” countries and areas, further call to vaccinate a third or even fourth dose of COVID‐19 vaccines, or protection of key populations, the true statistics of the proportion of nonsevere diseases and asymptomatic infections are being called.
This paper uses meta‐analysis to present a systematic effort to aggregate current published evidence of the proportion of nonsevere disease and asymptomatic infection caused by the SARS‐CoV‐2 Omicron variant and compares the results with those of the Delta variant.
2. METHODS
The study used a systematic review protocol and was registered in PROSPERO (ID=CRD42022327378, available from: https://www.crd.york.ac.uk/prospero/display_record.php?ID=CRD42022327378).
2.1. Search strategy
PubMed/MEDLINE, Embase, Web of Science (WOS), and China National Knowledge Infrastructure (CNKI) were searched from November 1, 2021, to April 18, 2022, using the terms: (COVID‐19 OR SARS‐CoV‐2) AND (omicron) AND (symptom OR disease OR clinical OR severity OR hospitalization). PubMed/MEDLINE and Embase were searched from October 1, 2020, to June 30, 2022, using the terms: (COVID‐19 OR SARS‐CoV‐2) AND (delta) AND (symptom OR disease OR clinical OR severity OR hospitalization). There was no language or study type restriction. Preprint studies without peer review and gray literature (i.e., published estimates from government agencies) were also included.
2.2. Eligibility criteria
2.2.1. Inclusion criteria for the studies were
-
‐
Observational studies (including cohort, case–control, cross‐sectional, and case studies).
-
‐
Participants infected with SARS‐CoV‐2 Omicron or Delta variant.
-
‐
Containing data of asymptomatic infection and nonsevere disease (If data of nonsevere disease were unavailable, studies containing data of detailed description of clinical symptoms or hospitalization would be used to deduce and estimate the number of nonsevere patients).
2.2.2. Exclusion criteria for the studies were
-
‐
Without data of asymptomatic infection, nonsevere disease, detailed description of clinical symptoms or hospitalization.
-
‐
Participants were obviously biased concerning the main outcome (i.e., symptomatic or in‐hospital patients).
-
‐
Having a sample of less than 50 patients.
Confirmed COVID‐19 infection was defined as one that had a nasopharyngeal swab or other specimen tested positive for SARS‐CoV‐2 using polymerase chain reaction or antigen test. Identification of Omicron or Delta variant was conducted with whole genome sequencing, genotyping, S gene screening (defined as S gene target failure status, SGTF), or period of predominance. Asymptomatic infection was defined as confirmed COVID‐19 patients who developed no symptoms during infection. According to the newest WHO guideline, 11 nonsevere COVID‐19 was defined as the absence of any criteria for severe or critical COVID‐19; severe COVID‐19 was defined as requiring any of oxygen saturation <90% on room air, expressing signs of pneumonia or signs of severe respiratory distress; critical COVID‐19 was defined as meeting the criteria for acute respiratory distress syndrome (ARDS), having sepsis, septic shock, or other conditions that would normally require the provision of life‐sustaining therapies such as mechanical ventilation (invasive or noninvasive) or vasopressor therapy. If data of nonsevere diseases were missing, they were inferred with data of clinical manifestation. Considering COVID‐19 hospitalization was widely used to verify the presence of severe COVID‐19 symptoms, we estimated data of nonsevere COVID‐19 with the following formula:
| (1) |
where T is the total number of SARS‐CoV‐2 patients, n is the number of patients hospitalized during SARS‐CoV‐2 infection, when detailed description of clinical symptoms was also unavailable. To note, nonsevere patients should include asymptomatic infection.
2.3. Study selection
After removing duplicates, two reviewers independently screened the titles and abstracts and further included the relevant articles according to the inclusion criteria. Then, by going through each article, reviewers excluded articles according to the exclusion criteria. Disagreement was resolved by discussion or by consulting a third author until consensus was reached.
2.4. Data extraction
For the primary study on Omicron variant, first author, year of publication, location of study, study design, time period of the positive test, sample size, age group, type of diagnostic test, identification of omicron, number of asymptomatic infections, number of nonsevere patients, whether estimated by hospitalization, COVID‐19 vaccination status, and type of vaccine were extracted. Missing data of nonsevere disease that could not be counted by symptom was replaced with (1–hospitalization ratio) with the column of “estimated with hospitalization” labeled “yes.” Studies were divided into five groups labeled “all,” “children and adolescent,” “elderly,” “pregnant,” and “SOTR.” “All” was defined as people in all ages or aged 18–65, “children and adolescent” was defined as people aged 0–20, “elderly” was defined as people aged 60 and over, “pregnant” represented pregnant COVID‐19 patients, and “SOTR” represented solid organ transplant recipients with COVID‐19. Vaccination status was divided into “<65% fully vaccinated,” “≥65% fully vaccinated,” and “all boostered,” where “fully vaccinated” was defined as having received two doses of COVID‐19 vaccine for at least 14 days or having finished a standard vaccination according to local policies, “boostered” was defined as having received the third or the fourth dose of COVID‐19 vaccination for at least 14 days, “<65% fully vaccinated” represented less than 65% participants were fully vaccinated, “≥65% fully vaccinated” represented over 65% participants were fully vaccinated, “all boostered” represented all participants were boostered. Any other missing or unclear information was labeled “NA.”
For the secondary research on the Delta variant, first author, year of publication, location of study, sample size, age group, number of asymptomatic infections, number of nonsevere patients, and COVID‐19 vaccination status were extracted. Any missing or unclear information was labeled “NA.”
Two authors independently extracted data. Disagreement was resolved by discussion or by consulting a third author until consensus was reached.
2.5. Quality assessment
For cohort studies, the Newcastle–Ottawa Scale (NOS) was used to assess study quality as follows: low quality = 0–3, moderate quality = 4–6, high quality = 7–9. For cross‐sectional studies and case series, the Agency for Healthcare Research and Quality (AHRQ) suggestions were applied to assess study quality as follows: low quality = 0–3, moderate quality = 4–7, high quality = 8–11.
2.6. Data analysis
All analyses were performed in R version 4.2.0 statistical software and Rstudio, using “meta” package. Meta‐analyses of asymptomatic infection and nonsevere disease were conducted separately using the “metaprop” command. The proportion of asymptomatic infection and nonsevere disease were transformed using log transformation to be conformed to a normal distribution, respectively. The DerSimonian and Larid random‐effects model was applied to calculate the effect size and its 95% confidence interval (95% CI) due to high heterogeneity. τ 2 and I 2 were applied to describe heterogeneity. Forest plots were used to visually present results of meta‐analyses. Funnel plots and Begg's test were used to examine publication bias among included studies. Influential analyses were performed to identify influential studies that significantly contributed to heterogeneity. Subgroup analyses were conducted among Omicron studies according to different study groups, vaccination status, and estimation status of nonsevere data to further explain the factors that contribute to heterogeneity. Results of Omicron infection and Delta infections were compared using an unpaired Student's t test or Mann–Whitney U test as appropriate. A p value of less than 0.05 was considered statistically significant.
3. RESULTS
3.1. Study selection
For the Omicron variant, across all databases, 1797 studies were identified, including 835 in PubMed, 608 in Embase, 324 in WOS, and 30 in CNKI. Nine hundred fifty‐two duplicates were removed. After screening titles and abstracts, 670 studies were removed. One hundred seventy‐five papers were assessed for eligibility for inclusion in the study, which resulted in 130 exclusions and a final 45 to be included in the review (Figure 1). Fourteen studies were included in the meta‐analysis on COVID‐19 Omicron asymptomatic infection, and 43 studies were included in the meta‐analysis on nonsevere disease.
Figure 1.
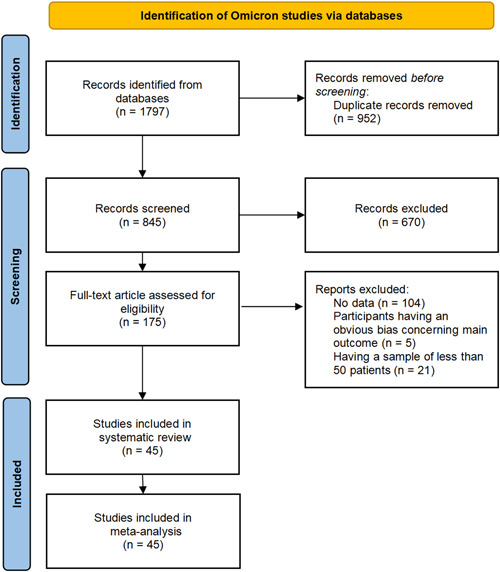
A PRISMA flow diagram of the systematic review and meta‐analysis on the Omicron variant
For the Delta variant, 934 studies were identified, including 784 in PubMed and 150 in Embase. After removing duplicates and screening titles and abstracts, 23 papers were further assessed, and 7 were finally included in the systematic review (Supporting Information: Figure S1). Four studies were included in the meta‐analysis on COVID‐19 Delta asymptomatic infection, and seven were included in the meta‐analysis on nonsevere disease.
3.2. Study characteristics
For the Omicron variant, first author, year of publication, location of study, study design, time period of the positive test, sample size, age group, type of diagnostic test, identification of omicron, number of asymptomatic infections, number of nonsevere patients, whether estimated by hospitalization, COVID‐19 vaccination status, and type of vaccine were abstracted (Supporting Information: Table S1). There were 39 cohort studies and 6 cross‐sectional studies. There was one special cohort study that contained four subcohorts according to different age groups. 12 Thirty‐eight studies were of high quality and seven studies were of moderate quality according to the NOS and AHRQ assessments (Supporting Information: Tables S2 and S3).
For the Delta variant, first author, year of publication, location of study, sample size, age group, number of asymptomatic infections, number of nonsevere patients, and COVID‐19 vaccination status were abstracted (Supporting Information: Table S4).
3.3. Results of meta‐analysis
3.3.1. Proportion of asymptomatic infection caused by SARS‐CoV‐2 Omicron variant
A total of 67 477 patients with confirmed COVID‐19 Omicron infection were included. The main result from the random effects meta‐analysis is presented with the forest plot (Figures 1 and 2). The proportion of asymptomatic infection is 25.5% (95% CI 17.0%–38.2%). Heterogeneity was extremely high, with the overall I 2 exceeding 99% (p < 0.001; τ 2, 0.59, Q, 13 167.0).
Figure 2.
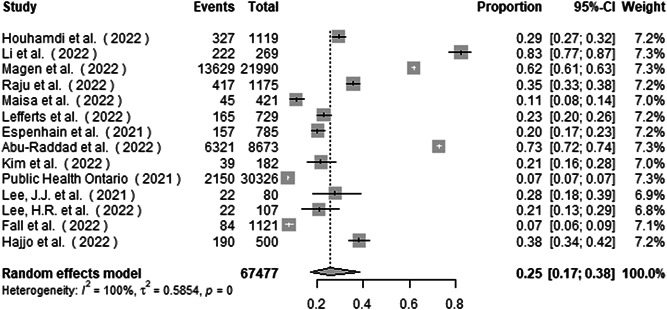
Forest plot of the proportion of asymptomatic infection in COVID‐19 Omicron patients
Influential analysis using leave‐one‐out diagnostic strategy showed no specific study had a pronounced impact on the summary proportion (Supporting Information: Figure S2).
Subgroup analysis by the study group found the proportion of asymptomatic infection to be 21.4% (14.5%–31.6%), 82.5% (78.1%–87.2%), and 62.0% (61.3%–62.6%) in studies from all aged group, children and adolescent group, and elderly group, respectively (Figure 3). There was a significant subgroup difference between the studies (p < 0.001).
Figure 3.
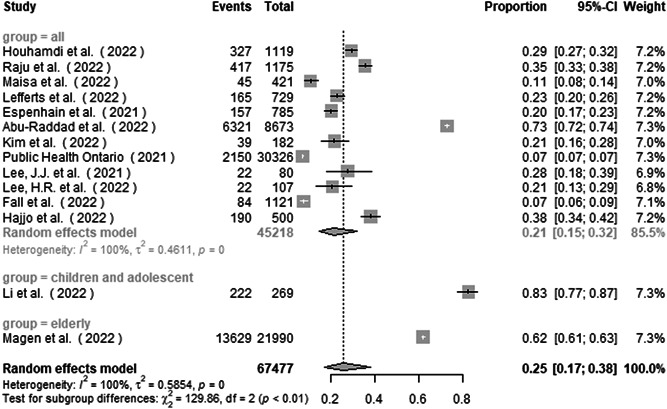
Subgroup analysis of the proportion of asymptomatic infection in COVID‐19 Omicron patients by study group
Subgroup analysis by vaccination status found the proportion of asymptomatic infection to be 18.7% (10.0%–35.1%), 19.3% (12.3%–30.5%), and 67.2% (57.3%–78.8%) in studies from <65% fully vaccinated group, ≥65% fully vaccinated group, and all boostered group (Figure 4). There was a significant subgroup difference between the studies (p < 0.001).
Figure 4.
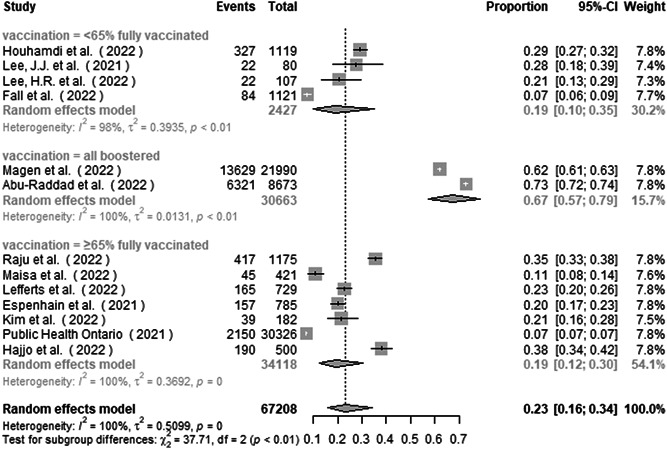
Subgroup analysis of the proportion of asymptomatic infection in COVID‐19 Omicron patients by vaccination status
The funnel plot (Supporting Information: Figure S3) and Begg's test (Supporting Information: Figure S4) showed no significant publication bias among the studies (p = 0.96).
3.3.2. Proportion of nonsevere disease caused by SARS‐CoV‐2 omicron variant
A total of 2 540 625 patients with confirmed COVID‐19 Omicron infection were included. The main result from the random effects meta‐analysis is presented with the forest plot (Figure 5). The proportion of nonsevere disease is 97.9% (97.1%–98.7%). Heterogeneity was high, with the overall I 2 exceeding 99% (p < 0.001; τ 2, 0.0008, Q, 25 526.5).
Figure 5.
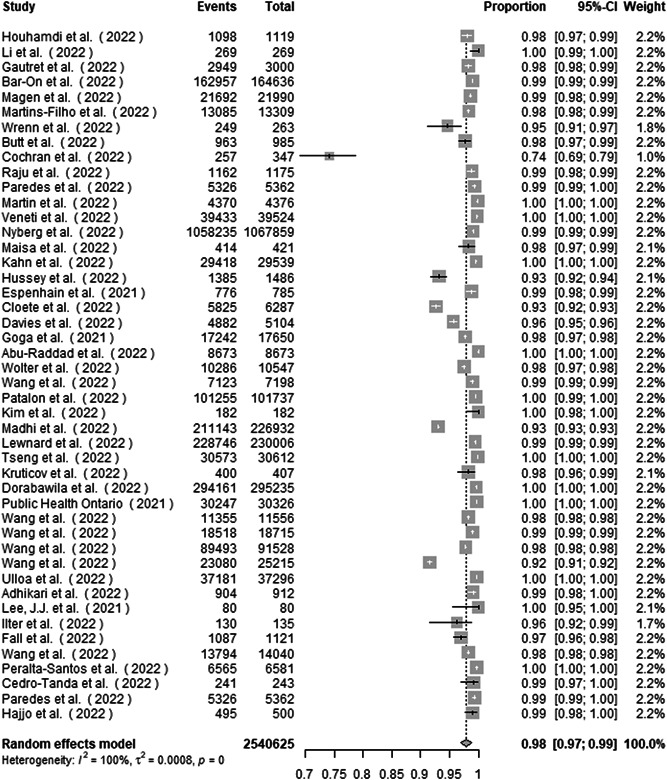
Forest plot of the proportion of nonsevere disease in COVID‐19 Omicron patients
Influential analysis using leave‐one‐out diagnostic strategy showed no specific study had a pronounced impact on the summary proportion (Supporting Information: Figure S5).
Subgroup analysis by whether estimated with hospitalization found the proportion of nonsevere disease to be 99.3% (98.9%–99.7%) and 97.35% (96.2%–98.5%) in studies from not estimated and estimated groups, respectively (Supporting Information: Figure S6). There was a significant subgroup difference between the studies (p < 0.01).
Subgroup analysis by study group found the proportion of nonsevere disease to be 98.4% (97.8%–99.0%), 98.3% (96.6%–99.9%), 96.8% (93.3%–100.0%), 74.1% (69.6%–78.8%), and 98.2% (95.6%–100.0%) in studies from all aged group, children and adolescent group, elderly group, SOTR group, and pregnant group, respectively (Figure 6). There was a significant subgroup difference between the studies (p < 0.001).
Figure 6.
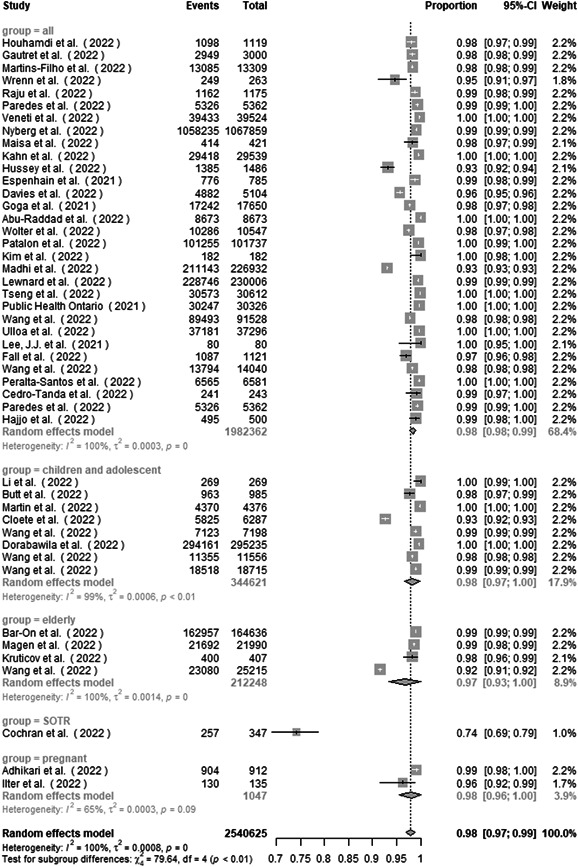
Subgroup analysis of the proportion of nonsevere disease in COVID‐19 Omicron patients by study group
Five studies were excluded from subgroup analysis by vaccination status for lack of vaccination information. Subgroup analysis by vaccination status found the proportion of nonsevere disease to be 97.1% (95.8%–98.3%), 98.9% (98.4%–99.4%), and 99.3% (98.7%–99.9%) in studies from <65% fully vaccinated group, ≥65% fully vaccinated group, and all boostered group (Figure 7). There was a significant subgroup difference between the studies (p < 0.01).
Figure 7.
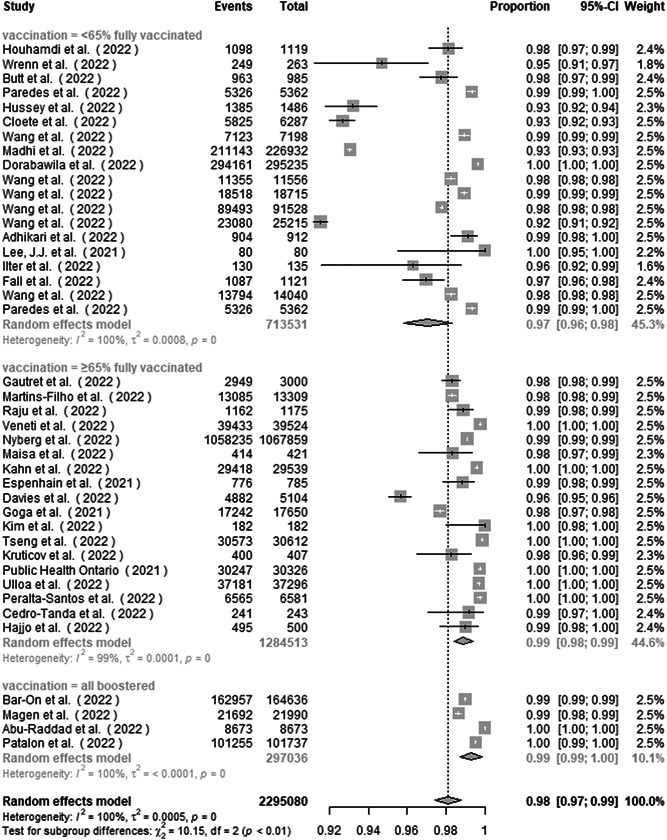
Subgroup analysis of the proportion of nonsevere disease in COVID‐19 Omicron patients by vaccination status
The funnel plot (Supporting Information: Figure S7) and Begg's test (Supporting Information: Figure S8) showed no significant publication bias among the studies (p = 0.26).
3.3.3. Proportion of asymptomatic infection and nonsevere disease caused by SARS‐CoV‐2 Delta variant
A total of 2099 patients with confirmed COVID‐19 Delta infection were included in the meta‐analysis of the proportion of asymptomatic infection. The proportion of asymptomatic infection is 8.4% (95% CI 4.4%–16.2%). Heterogeneity was high, with an I 2 of 92.5% (p < 0.001; τ 2, 0.33; Q, 40.1). The forest plot is provided in Supporting Information: Figure S9.
A total of 10 325 patients with confirmed COVID‐19 Delta infection were included in the meta‐analysis of the proportion of nonsevere disease. The proportion of asymptomatic infection is 91.4% (95% CI 87.0%–96.0%). Heterogeneity was high, with an I 2 of 95.4% (p < 0.001; τ 2, 0.004; Q, 131.1). The forest plot is provided in Supporting Information: Figure S10.
Influential analyses using leave‐one‐out diagnostic strategy showed no specific study had a pronounced impact on the summary proportion in both meta‐analyses (Supporting Information: Figures S11 and S12). Funnel plots (Supporting Information: Figures S13 and S14) showed no significant publication bias among the studies. The number of studies was too small (n = 7) to obtain the results of Begg's tests.
In comparison with the Delta variant, the proportion of asymptomatic infection and proportion of nonsevere disease among patients infected with the Omicron variant were significantly higher (p = 0.005, p = 0.007) (Figure 8).
Figure 8.
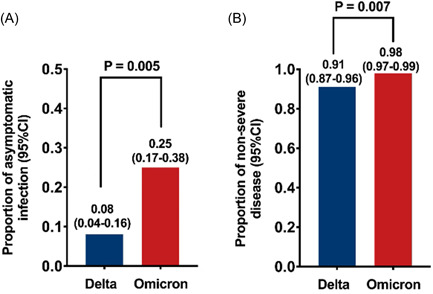
Proportion of asymptomatic infection and proportion of nonsevere disease among COVID‐19 Omicron patients were significantly higher than among Delta patients. (A) proportion of asymptomatic infection (B) proportion of nonsevere disease.
4. DISCUSSION
The main finding of this study is that in the context of the COVID‐19 Omicron wave, the pooled proportion of asymptomatic infection is 25.5%, and the pooled proportion of nonsevere disease is 97.9%. Compared with the pooled proportion of asymptomatic COVID‐19 in 2020 (15.6%) 4 and during the Delta wave (8.4%), there were more asymptomatic infections during the Omicron wave. The pooled proportion of nonsevere disease during the Omicron wave was also higher than that of the Delta wave (91.4%). Therefore, the clinical severity of COVID‐19 was decreased during the Omicron wave compared to the Delta wave (Supporting Information: Figure S15A,B). With high heterogeneity among included data, significant differences were found between subgroups. During the Omicron wave, children and adolescents presented a significantly higher proportion of asymptomatic infection than other age groups. 13 SOTR COVID‐19 patients experienced significant lower proportion of nonsevere disease. 14 The elderly also had a lower proportion of nonsevere disease with subtle significance compared to other age groups, especially when vaccination coverage was high. 12 , 15 , 16 , 17 During the Omicron wave, studies among participants who received booster vaccines showed remarkably higher proportion of asymptomatic infection and nonsevere disease than participants who were unvaccinated and received a primary vaccination series, 15 , 16 , 18 , 19 indicating boostered vaccination might contribute to lower clinical severity of COVID‐19 (Supporting Information: Figure S15C).
High proportion of asymptomatic infection observed in children and adolescents in the study of Li. 13 highlights the necessity to apply asymptomatic infection surveillance in schools for better control of the disease.
The elderly had lower proportion of asymptomatic infection and nonsevere disease, 12 , 15 , 16 , 17 possibly due to their ageing immune system, which may aggravate SARS‐CoV‐2 Omicron infection. Besides, older age has negative effects on immune response to COVID‐19 vaccines, thus making vaccine less effective among them. SOTR patients, due to immunosuppressive therapy, also have relatively weak immune response to the vaccines compared to healthy vaccine receptors. Therefore, SOTRs presented rather low proportions of nonsevere disease. 14 This highlights the need to expand vaccination coverage among high‐risk groups such as the elderly and immunocompromised populations.
Different vaccination status has significant impact on the proportion of asymptomatic infection. For studies with participants who received booster vaccines, the pooled proportion of asymptomatic infection reached 67.2%, significantly higher than participants who were unvaccinated and received a primary vaccination series, 15 , 18 urging border vaccination of the third and even the fourth dose of COVID‐19 vaccine. However, only slight difference was observed between studies with <65% fully vaccinated individuals and ≥65% fully vaccinated individuals, 20 , 21 , 22 , 23 , 24 , 25 , 26 , 27 , 28 , 29 , 30 making broad coverage of vaccination seem to be meaningless. This is probably due to decreased pathogenicity of Omicron itself. 9 At the same time, with the increasing time since vaccination, immune protection of the vaccine waned especially humoral immune responses. 31 Therefore, vaccination of the booster dose is of vital importance for both individual health and disease control.
The proportion of nonsevere disease showed a difference between subgroups defined by whether estimated by hospitalized patients. Studies, where the nonsevere disease data were available and were not estimated by number of hospitalization, showed better consistency and a higher proportion of nonsevere disease, while those estimated by hospitalization showed high heterogeneity within subgroup and a lower proportion of nonsevere disease. This is mainly due to the inconsistency of hospital admission standards. Some studies claimed COVID‐19 related hospital admission uncorrelated to clinical severity, 24 while others used hospital admission rate to estimate severe disease rate. 32 Nevertheless, the pooled proportion of nonsevere disease, whether estimated by hospitalization or not, is still very high and reached 97.9%, confirming the theory that SARS‐CoV‐2 Omicron causes less severe disease. 7
5. LIMITATIONS
There are a number of limitations to this research. First, the heterogeneity of all four meta‐analyses was very high. This was largely attributed to the inclusion of a broad range of studies with different age, vaccination, and basic health condition distributions. Second, estimation of nonsevere disease by hospitalization during the Omicron wave further increased heterogeneity. Third, dividing vaccination coverage into “<65% fully vaccinated,” “≥65% fully vaccinated”, and “all boostered” during Omicron wave was crude and might miss more detailed information concerning the inherent correlation between vaccination coverage and nonsevere disease proportion. Further, observation time for the appearance of symptoms of some studies was inadequate, thus might mistake presymptomatic cases for asymptomatic ones. Last but not least, restricted by inadequate asymptomatic infection surveillance in most countries and areas, participants of the included studies are not ideal enough to represent the whole infected population, leading to an underlying bias and unavoidable heterogeneity. Especially, during the meta‐analysis concerning the previous Delta wave, most searched studies were conducted among patients in hospitals instead of the whole infected population, resulting in the small included study number.
6. HIGHLIGHTS
This study accurately estimated the pooled proportion of asymptomatic infection and nonsevere disease in the COVID‐19 Omicron and Delta wave and made the comparison between the two periods. The results have a lot of important implications on policy making, from reopening of “lockdown” areas, vaccination programs, key group protection, to surveillance strategy on asymptomatic infections.
7. CONCLUSION
Based on meta‐analyses of published evidence on COVID‐19 Omicron and Delta wave, the pooled proportion of asymptomatic SARS‐CoV‐2 Omicron infection is 25.5% (95% CI 17.0%–38.2%), and the pooled proportion of nonsevere disease is 97.9% (95% CI 97.1%–98.7%), significantly higher than those of Delta, which were 8.4% (95% CI 4.4%–16.2%) and 91.4% (95% CI 87.0%–96.0%). The heterogeneity between studies is high. During the Omicron wave, children and adolescents are likely to have a higher proportion of asymptomatic infection than other age groups. The elderly and SOTR patients are likely to have a lower proportion of nonsevere diseases. Vaccination of a booster COVID‐19 vaccine contributes to higher proportion of asymptomatic infection and nonsevere disease significantly. Still, more studies based on asymptomatic infection surveillance are needed to get a comprehensive understanding of asymptomatic infections of SARS‐CoV‐2 Omicron.
AUTHOR CONTRIBUTIONS
All authors contributed equally to the concept and preparation of the manuscript. Weien Yu, Yifei Guo, Zhongliang Shen, and Jiming Zhang completed the final preparation and editing of the manuscript. Weien Yu and Yifei Guo created the figures and tables. All authors contributed to the article and approved the submitted version.
CONFLICT OF INTEREST
The authors declare no conflict of interest.
Supporting information
Supplementary information.
Supplementary information.
ACKNOWLEDGMENT
This work was supported by the National Natural Science Foundation of China under Grant No. 81871640, 82172255, Shanghai Shen Kang Hospital Development Center under Grant No. SHDC12019116, Shanghai Key Clinical Specialty Construction Program under Grant No. ZK2019B24, and Shanghai Municipal Science and Technology Major Project under Grant No. ZD2021CY001.
Yu W, Guo Y, Zhang S, Kong Y, Shen Z, Zhang J. Proportion of asymptomatic infection and nonsevere disease caused by SARS‐CoV‐2 Omicron variant: a systematic review and analysis. J Med Virol. 2022;1‐12. 10.1002/jmv.28066
Zhongliang Shen and Jiming Zhang have contributed equally to this work.
Weien Yu and Yifei Guo share first authorship.
Contributor Information
Zhongliang Shen, Email: shenzhongliangnjnu@163.com.
Jiming Zhang, Email: jmzhang@fudan.edu.cn.
DATA AVAILABILITY STATEMENT
The data that support the findings of this study are available from the corresponding author upon reasonable request.
REFERENCES
- 1. WHO . COVID‐19—China. World Health Organization Disease Outbreak News ; 2020. (DON233).
- 2. Sharma A, Ahmad Farouk I, Lal SK. COVID‐19: a review on the novel coronavirus disease evolution, transmission, detection, control and prevention. Viruses. 2021;13(2):202. [DOI] [PMC free article] [PubMed] [Google Scholar]
- 3. Long B, Carius BM, Chavez S, et al. Clinical update on COVID‐19 for the emergency clinician: presentation and evaluation. Am J Emerg Med. 2022;54:46‐57. [DOI] [PMC free article] [PubMed] [Google Scholar]
- 4. He J, Guo Y, Mao R, Zhang J. Proportion of asymptomatic coronavirus disease 2019: a systematic review and meta‐analysis. J Med Virol. 2021;93(2):820‐830. [DOI] [PMC free article] [PubMed] [Google Scholar]
- 5. Priyanka, Choudhary OP , Singh I, Patra G. Aerosol transmission of SARS‐CoV‐2: the unresolved paradox. Travel Med Infect Dis. 2020;37:101869. [DOI] [PMC free article] [PubMed] [Google Scholar]
- 6. Thakur V, Ratho RK. OMICRON (B.1.1.529): a new SARS‐CoV‐2 variant of concern mounting worldwide fear. J Med Virol. 2022;94(5):1821‐1824. [DOI] [PubMed] [Google Scholar]
- 7. Christie B. Covid‐19: early studies give hope omicron is milder than other variants. BMJ. 2021;375:n3144. [DOI] [PubMed] [Google Scholar]
- 8. Sigal A. Milder disease with Omicron: is it the virus or the pre‐existing immunity? Nat Rev Immunol. 2022;22(2):69‐71. [DOI] [PMC free article] [PubMed] [Google Scholar]
- 9. Balint G, Voros‐Horvath B, Szechenyi A. Omicron: increased transmissibility and decreased pathogenicity. Signal Transduct Target Ther. 2022;7(1):151. [DOI] [PMC free article] [PubMed] [Google Scholar]
- 10. Seens H, Lu Z, Fraser J, MacDermid JC, Walton DM, Grewal R. An intersectional approach to identifying factors associated with anxiety and depression following the COVID‐19 pandemic. Sci Rep. 2022;12(1):11393. [DOI] [PMC free article] [PubMed] [Google Scholar]
- 11. WHO . Therapeutics and COVID‐19: living guideline . World Health Organization; 2022. WHO/2019‐nCoV/therapeutics (2022.2). [PubMed]
- 12. Wang L, Berger NA, Kaelber DC, Davis PB, Volkow ND, Xu R. COVID infection rates, clinical outcomes, and racial/ethnic and gender disparities before and after Omicron emerged in the US. medRxiv. 2022. 10.1101/2022.02.21.22271300 [DOI]
- 13. Li Y. A clustered school outbreak caused by the SARS‐CoV‐2 Omicron variant. Chin J Public Health. 2022;38:614‐618. [Google Scholar]
- 14. Cochran W, Shah P, Barker L, et al. COVID‐19 clinical outcomes in solid organ transplant recipients during the Omicron surge. Transplantation. 2022;106:346. [DOI] [PMC free article] [PubMed] [Google Scholar]
- 15. Magen O, Waxman JG, Makov‐Assif M, et al. Fourth dose of BNT162b2 mRNA Covid‐19 vaccine in a nationwide setting. N Engl J Med. 2022;386:1603‐1614. [DOI] [PMC free article] [PubMed] [Google Scholar]
- 16. Bar‐On YM, Goldberg Y, Mandel M, et al. Protection by a fourth dose of BNT162b2 against Omicron in Israel. N Engl J Med. 2022;386:1712‐1720. [DOI] [PMC free article] [PubMed] [Google Scholar]
- 17. Krutikov M, Stirrup O, Nacer‐Laidi H, et al. Outcomes of SARS‐CoV‐2 Omicron infection in residents of long‐term care facilities in England (VIVALDI): a prospective, cohort study. The Lancet Healthy longevity. 2022;3:e347‐e355. [DOI] [PMC free article] [PubMed] [Google Scholar]
- 18. Abu‐Raddad LJ, Chemaitelly H, Ayoub HH, et al. Effectiveness of BNT162b2 and mRNA‐1273 COVID‐19 boosters against SARS‐CoV‐2 Omicron (B.1.1.529) infection in Qatar. N Engl J Med. 2022;386:1804‐1816. [DOI] [PMC free article] [PubMed] [Google Scholar]
- 19. Patalon T, Saciuk Y, Peretz A, et al. Waning effectiveness of the third dose of the BNT162b2 mRNA COVID‐19 vaccine. Nat Commun. 2022;13(1):3203. [DOI] [PMC free article] [PubMed] [Google Scholar]
- 20. Houhamdi L, Gautret P, Hoang VT, Fournier PE, Colson P, Raoult D. Characteristics of the first 1119 SARS‐CoV‐2 Omicron variant cases, in Marseille, France, November‐December 2021. J Med Virol. 2022;94(5):2290‐2295. [DOI] [PMC free article] [PubMed] [Google Scholar]
- 21. Lee JJ, Choe YJ, Jeong H, et al. Importation and transmission of SARS‐CoV‐2 B.1.1.529 (Omicron) variant of concern in Korea, November 2021. J Korean Med Sci. 2021;36(50):e346. [DOI] [PMC free article] [PubMed] [Google Scholar]
- 22. Lee HR, Choe YJ, Jang EJ, et al. Time from exposure to diagnosis among quarantined close contacts of SARS‐CoV‐2 Omicron Variant Index case‐patients, South Korea. Emerg Infect Dis. 2022;28(4):901‐903. [DOI] [PMC free article] [PubMed] [Google Scholar]
- 23. Fall A, Eldesouki RE, Sachithanandham J, et al. A quick displacement of the SARS‐CoV‐2 variant delta with omicron: unprecedented spike in COVID‐19 cases associated with fewer admissions and comparable upper respiratory viral loads. medRxiv. 2022. 10.1101/2022.01.26.2226992 [DOI] [PMC free article] [PubMed]
- 24. Raju MK, Vivian Thangaraj JW, Selvavinayagam TS, et al. Clinical profile of patients infected with suspected SARS‐CoV‐2 Omicron variant of concern, Tamil Nadu, India, December 2021‐January 2022. Indian J Med Res. 2022;155:165‐170. [DOI] [PMC free article] [PubMed] [Google Scholar]
- 25. Maisa A, Spaccaferri G, Fournier L, et al. First cases of Omicron in France are exhibiting mild symptoms, November 2021‐January 2022. Infect Dis Now. 2022;52:160‐164. [DOI] [PMC free article] [PubMed] [Google Scholar]
- 26. Lefferts B, Blake I, Bruden D, et al. Antigen test positivity after COVID‐19 isolation—Yukon‐Kuskokwim Delta Region, Alaska, January‐February 2022. MMWR Morb Mortal Wkly Rep. 2022;71(8):293‐298. [DOI] [PubMed] [Google Scholar]
- 27. Espenhain L, Funk T, Overvad M, et al. Epidemiological characterisation of the first 785 SARS‐CoV‐2 Omicron variant cases in Denmark, December 2021. Euro Surveill. 2021;26(50):2101146. [DOI] [PMC free article] [PubMed] [Google Scholar]
- 28. Kim EY, Choe YJ, Park H, et al. Community transmission of SARS‐CoV‐2 Omicron variant, South Korea, 2021. Emerg Infect Dis. 2022;28(4):898‐900. [DOI] [PMC free article] [PubMed] [Google Scholar]
- 29. Public Health Ontario . Weekly epidemiological summary: COVID‐19 lineage B.1.1.529 (Omicron) or S‐gene target failure (SGTF) in Ontario: October 31, to December 29, 2021.
- 30. Hajjo R, AbuAlSamen MM, Alzoubi HM, Alqutob R. The Epidemiology of Hundreds of Individuals Infected with Omicron BA.1 in Middle‐Eastern Jordan. medRxiv. 2022. 10.1101/2022.01.23.22269442 [DOI]
- 31. Sheikh A, McMenamin J, Taylor B, Robertson C, Public Health Scotland and the EAVE II Collaborators . Public Health S, the EIIC. SARS‐CoV‐2 Delta VOC in Scotland: demographics, risk of hospital admission, and vaccine effectiveness. Lancet. 2021;397(10293):2461‐2462. [DOI] [PMC free article] [PubMed] [Google Scholar]
- 32. Kahn F, Bonander C, Moghaddassi M, et al. Risk of severe COVID‐19 from the Delta and Omicron variants in relation to vaccination status, sex, age and comorbidities—surveillance results from southern Sweden, July 2021 to January 2022. Euro Surveill. 2022;27(9):2200121. [DOI] [PMC free article] [PubMed] [Google Scholar]
Associated Data
This section collects any data citations, data availability statements, or supplementary materials included in this article.
Supplementary Materials
Supplementary information.
Supplementary information.
Data Availability Statement
The data that support the findings of this study are available from the corresponding author upon reasonable request.


