

Abstract
Objective
To assess risk factors for anxiety and depression among pregnant women during the COVID‐19 pandemic using Mind‐COVID, a prospective cross‐sectional study that compares outcomes in middle‐income economies and high‐income economies.
Methods
A total of 7102 pregnant women from 12 high‐income economies and nine middle‐income economies were included. The web‐based survey used two standardized instruments, General Anxiety Disorder‐7 (GAD‐7) and Patient Health Questionnaire–9 (PHQ‐9).
Result
Pregnant women in high‐income economies reported higher PHQ‐9 (0.18 standard deviation [SD], P < 0.001) and GAD‐7 (0.08 SD, P = 0.005) scores than those living in middle‐income economies. Multivariate regression analysis showed that increasing PHQ‐9 and GAD‐7 scales were associated with mental health problems during pregnancy and the need for psychiatric treatment before pregnancy. PHQ‐9 was associated with a feeling of burden related to restrictions in social distancing, and access to leisure activities. GAD‐7 scores were associated with a pregnancy‐related complication, fear of adverse outcomes in children related to COVID‐19, and feeling of burden related to finances.
Conclusions
According to this study, the imposed public health measures and hospital restrictions have left pregnant women more vulnerable during these difficult times. Adequate partner and family support during pregnancy and childbirth can be one of the most important protective factors against anxiety and depression, regardless of national economic status.
Keywords: anxiety, coronavirus disease 2019, cross‐sectional studies, depression, economic status, mental health, patient health questionnaire, pregnant women
Synopsis
Imposed public health measures and hospital‐level restrictions have made pregnant women more vulnerable to anxiety and depression during the COVID‐19 pandemic.
1. INTRODUCTION
Severe acute respiratory syndrome coronavirus 2 (SARS‐CoV‐2) infection and the coronavirus disease‐19 (COVID‐19) have caused a major disruption to medical services, governments, and societies worldwide. 1 There is evidence on how pandemics including the current one have a significant affect on mental health, resulting in anxiety, depression, and high‐stress levels. 2
There is sufficient evidence demonstrating that SARS‐CoV‐2 infection is associated with an increased risk of adverse maternal and perinatal outcomes, and there are also reported cases of vertical transmission. 3 , 4 , 5 Hence pregnant women are particularly concerned about their well‐being and the safety of their unborn child, which has been reflected in studies reporting significantly higher rates of depressive symptoms after the declaration of the COVID‐19 pandemic. 6 , 7 , 8 , 9 , 10 Infectious epidemics have been shown to cause anxiety in pregnant women because of unmet needs and expectations of women during prenatal, intrapartum, and postnatal care. 4 , 5 Although several countries have assessed maternal mental health during the pandemic, no study has been reported so far that assesses and compares maternal mental health between countries, continents, or geographical regions.
The objectives of this study were to assess risk factors for anxiety and depression among pregnant women during the COVID‐19 pandemic, compare differences in anxiety and depression scores between pregnant women in middle‐income economies and high‐income economies, and evaluate the relation between the pandemic status (number of infected patients, number of reported deaths), imposed/implemented restrictions, and maternal mental health.
2. MATERIAL AND METHODS
2.1. Study protocol
We report the results of a prospective cross‐sectional study with the use of a web‐based survey. The STROBE and Cherries guidelines were used to ensure appropriate reporting. 11 The study was performed in accordance with the Helsinki Declaration 2013. Approval for the study was obtained from the Centre of Postgraduate Medical Education Research Ethics Committee (Ref. No. 56/PB/2020) in Warsaw, Poland, and the Ethics Committee of each participating hospital in other regions, where applicable. Details of the study protocol have been previously published [3 The study was registered in ClinicalTrials.gov (NCT04377412). The survey was conducted using the Research and Electronic Data Capture (REDCap) tool hosted at the Foundation for the Saint Sofia Specialist Hospital in Warsaw, Poland 12 (Appendix S1; Full survey in English).
2.2. Recruitment
Recruitment took place from 1 May 2020 to 28 February 2021 but did not start simultaneously in all regions (Table 1). Inclusion criteria were declaration of being pregnant, being able to complete the survey in the available languages (English, French, Spanish, Chinese, Polish, German, Russian, Italian, Ukrainian, Czech, Swedish, Albanian, Hebrew, Arabic, Malaysian, and Norwegian), completion of screening questions, and provision of informed consent for participation. Exclusion criteria were: not providing online informed consent for participation or not clicking the submit button at the end of the survey, and not answering all the General Anxiety Disorder‐7 (GAD‐7) 13 and Patient Health Questionnaire‐9 (PHQ‐9) scale 14 questions. Women were recruited in 21 regions and countries through a dedicated webpage (www.pregmind.org) and social media (Facebook, Instagram). The webpage link with the description of the survey was posted in open and closed groups and fora dedicated to pregnancy. Medical staff provided pregnant women with flyers with information about the study, the website address, and a QR code to the survey during their visits to medical facilities.
TABLE 1.
Recruitment calendar
| Country/Region | Start date | Time of recruitment in days | Number of respondents |
|---|---|---|---|
| High‐income economies (N = 6134) | |||
| Czech Republic | 1 May 2020 | 303 | 1488 |
| Spain | 18 July 2020 | 225 | 566 |
| United States | 3 December 2020 | 87 | 11 |
| France | 20 May 2020 | 284 | 66 |
| Germany | 1 May 2020 | 303 | 12 |
| Israel | 1 May 2020 | 303 | 524 |
| Hong Kong SAR, China | 22 May 2020 | 282 | 397 |
| Italy | 2 May 2020 | 302 | 72 |
| Norway | 13 July 2020 | 230 | 146 |
| Poland | 1 May 2020 | 303 | 811 |
| Sweden | 5 June 2020 | 268 | 27 |
| Taiwan | 26 May 2020 | 278 | 2014 |
| Middle‐income economies (N = 1700) | |||
| Albania | 3 May 2020 | 301 | 96 |
| Argentina | 7 September 2020 | 205 | 198 |
| Malaysia | 23 October 2020 | 128 | 560 |
| Mexico | 14 July 2020 | 229 | 524 |
| Peru | 16 July 2020 | 227 | 131 |
| Russian Federation | 1 May 2020 | 303 | 7 |
| Thailand | 20 May 2020 | 284 | 22 |
| Honduras | 4 September 2020 | 208 | 82 |
| Ukraine | 1 May 2020 | 303 | 80 |
2.3. Data
The survey consisted of 60 questions: general demography, pregnancy health history, mental health history, socioeconomic factors, perception of fear, burden and restrictions related to the COVID‐19 pandemic, GAD‐7, 13 and PHQ‐9 14 questionnaires. The list of all explanatory variables from the survey is presented in Table 2. According to the World Bank's Data, the collected survey results were grouped into middle‐income economies and high‐income economies 15 (Table 1). The analysis included six variables generated from the Oxford COVID‐19 Government Response Tracker. These were used to correlate the results and declaration of burden and fear regarding different aspects of everyday life with the actual stringency measures and pandemic state (numbers of new cases and deaths). All the above variables were matched with the date and place of each survey completion.
TABLE 2.
Explanatory variables
| Question | Distractors a | Variable name |
|---|---|---|
| Demographic | ||
| Age, year | Age | |
| Education |
1 None 2 Elementary education 3 Secondary education 4 Higher education |
Higher education |
| Where do you currently live? |
1 A rural area (population of less than a 1000) 2 A small population center (population 1000–29 999) 3 A medium population center (population 30 000–99 999) 4 A large population center (population 100 000–499 999) 5 A very large population (population over 500 000) |
Residence place large cities |
| Relationship status |
1 Married 2 In a relationship 3 Single 4 Widowed |
In relationship |
| How you feel about your household's income nowadays? |
1 Living comfortably on present income 2 Coping on present income 3 Finding it difficult on present income 4 Finding it very difficult on present income |
Sufficient income |
| Feeling supported | ||
| Do you feel supported by your partner during this pregnancy? |
YES NO |
Partner support |
| Do you feel supported by other family members or friends during this pregnancy? |
YES NO |
Family support |
| Medical issue | ||
| Is this your first pregnancy? |
YES—primiparous NO—multiparous |
Primiparous |
| Have you been told by your doctor or midwife that your pregnancy is a high‐risk one? |
YES NO |
High risk pregnancy |
| Do you have any pregnancy‐related conditions or problems during your current pregnancy? |
YES, if any answer 1–15 NO—answer 16 1 Pregnancy hypertension 2 HELLP syndrome 3 Pre‐eclampsia 4 Obstetric cholestasis 5 Gestational diabetes mellitus 6 Fetal structural abnormalities 7 Fetus affected by genetic syndromes 8 Hyperemesis gravidarum 9 Threatened preterm birth 10 Threatened miscarriage 11 Acute fatty liver syndrome 12 Anemia during pregnancy treated with iron supplementation 13 Polyhydramnios 14 Oligohydramnios 15 Fetal growth restriction 16 I do not have any pregnancy‐related health issues in this pregnancy |
Pregnancy‐related conditions |
| Before pregnancy have you ever sought any mental health support? |
YES NO |
Mental health problems before pregnancy |
| Before pregnancy have you had any psychiatric treatment? |
YES, if any answer 1–3 1 Yes, pharmacologic 2 Yes, psychotherapy 3 Yes, psychotherapy and pharmacologic 4 NO |
Psychiatric treatment before pregnancy |
| During this pregnancy have you sought any mental health support? |
YES NO |
Mental health problems during pregnancy |
| During this pregnancy have you received/are you receiving any psychiatric treatment? |
YES, if any answer 1–3 1 Yes, pharmacologic 2 Yes, psychotherapy 3 Yes, psychotherapy and pharmacologic 4 NO |
Psychiatric treatment during pregnancy |
| COVID‐19 | ||
| Have you been infected with the new coronavirus (known as COVID‐19) before pregnancy? |
YES NO |
COVID‐19 before pregnancy |
| Have you been infected with COVID‐19 during this pregnancy? |
YES NO |
COVID‐19 during pregnancy |
| Fear of a pandemic | ||
| How would you rate your level of fear that you or the people close to you will become infected with COVID‐19? | SCALE 1–100 | COVID‐19 fear people infected |
| How much are you concerned about your unborn child's safety due to the COVID‐19 pandemic? | SCALE 1–100 |
COVID‐19 child's safety |
| How much are you concerned about your family members getting sick and have the adverse effects of the COVID‐19? | SCALE 1–100 | COVID‐19 fear family adverse outcomes |
| How much are you concerned about you getting sick and having the adverse effects of the COVID‐19? | SCALE 1–100 | COVID‐19 fear you getting sick |
| How much do you fear that the COVID‐19 pandemic will result in restrictions related to your childbirth (presence of accompanying person/s at hospital etc.) | SCALE 1–100 | COVID‐19 fear childbirth |
| How much do you fear that your baby will become ill during/after delivery and will have adverse outcomes due to the COVID‐19? | SCALE 1–100 | COVID‐19 child adverse outcomes |
| How much do you fear that your partner will not be able to be present during the delivery? | SCALE 1–100 | COVID‐19 no partner during the delivery |
| Feeling of burden | ||
| How much do you feel restricted due to social distancing recommended or implemented during the COVID‐19 pandemic? | SCALE 1–100 | COVID‐19 distancing |
| How burdened do you feel by the current COVID‐19 pandemic in regard to your or your family members' possibility to work and earn money (i.e. has it changed because of the pandemic)? | SCALE 1–100 | COVID‐19 burdened work |
| How burdened do you feel by the current COVID‐19 pandemic in regard to your favorite leisure activities (i.e. has it changed because of the pandemic)? | SCALE 1–100 |
COVID‐19 burdened leisure |
| How burdened do you feel by the current COVID‐19 pandemic in regard to the provision of childcare—closed schools, kindergartens, nurseries, etc. (i.e. has it changed because of the pandemic)? | SCALE 1–100 | COVID‐19 burdened childcare |
| How burdened do you feel by the current COVID‐19 pandemic in regard to how it has affected your household's financial situation? | SCALE 1–100 | COVID‐19 burdened financial situation |
| How much do you feel burdened by restrictions imposed on labor and delivery as a result of the COVID‐19 pandemic (presence of accompanying person/s at hospital etc.)? | SCALE 1–100 |
COVID‐19 restrictions delivery |
| Which is your number one source of information about COVID‐19 pandemic and the new coronavirus? |
1 Social media 2 Internet published statistics 3 Medical research papers 4 Medical provider, general practitioner or midwife that I attend 5 Family or friends 6 Newspaper 7 TV |
COVID‐19 information from social media |
| COVID‐19 situation | ||
| Government Response Index (Oxford COVID‐19 Government Response Tracker) | Scale 1–100 | Government response index |
| Economic support index (Oxford COVID‐19 Government Response Tracker) | Scale 1–100 | Economic support index |
| Stringency index (Oxford COVID‐19 Government Response Tracker) | Scale 1–100 | Stringency index |
| Containment health index (Oxford COVID‐19 Government Response Tracker) | Scale 1–100 | Containment health index |
| Confirmed COVID‐19 cases | cases per 1000 inhabitants | Confirmed cases |
| Confirmed COVID‐19 deaths | cases per 1000 inhabitants | Confirmed deaths |
Reference values are shown in bold type.
2.4. Statistical analysis
Descriptive statistics for middle‐income economies and high‐income economies were presented as mean (± standard deviation [SD]) for continuous variables and number (percentage) for categorical variables. For the comparisons, we report P values based on F‐test for continuous variables and based on χ2 test for proportions. Both tests were adjusted for the clustering effects of the economies.
The main variables of interest, PHQ‐9, and GAD‐7 are composite variables, scales composed of aggregating responses from several items. Instead of using a simple sum of the scores, both scales were scaled using IRT‐MG latent variable modeling with alignment optimization. 16 There are two main advantages of this method. First, it ensures the maximum possible comparability of the scales controlling for different behaviors of the item in different groups. Second, the procedure transforms a composite variable so that it results in a normally distributed indicator. In our analysis, both outcome variables were standardized to have mean of 0 and SD of 0 for the whole data set. Alignment optimization is one of the most effective scaling methods in cross‐cultural studies and has been successfully applied to many studies, including analysis of anxiety and depressive symptoms, parenting knowledge, or well‐being. The scaling of the outcome variables was performed using mplus version 8 software with default settings. 17
We used a two‐stage approach based on a multivariate regression approach to investigate the relation between PHQ‐9 and GAD‐7 scales and a set of explanatory variables. In the first step, we used an adaptive lasso approach for multivariate regression. All potential predictors were included in the model and the procedure excluded the variables with zero (or close to zero) contribution for predicting outcomes. This stage allowed us to reduce the number of initial variables, excluding ones that were not relevant for PHQ‐9 and GAD‐7 scales. The procedure was performed separately for middle‐income economies and high‐income economies. In the second step, we kept all the significant parameters in the prediction models either in middle‐income economies or high‐income economies. This resulted in a different set of predictors, each for PHQ‐9 and GAD‐7, but after modeling each scale, the sets of predictors for middle‐income economies and high‐income economies became the same.
In the second stage, an ordinary linear square multivariate regression was performed separately for PHQ‐9 and GAD‐7 and separately for middle‐income economies and high‐income economies. Standardized coefficients were reported on a graph together with 95% confidence intervals (CI) for those coefficients. Additionally, we tested whether coefficients were statistically different among middle‐income economies and high‐income economies at P = 0.95 and P = 0.90, respectively, indicating differences by adding asterisks to the names of variables in the graphs.
The two‐step procedure (sometimes described as post‐lasso estimation) was shown to be more effective than one‐step procedures both for variable selection and for estimation of unbiased parameters in the presence of a large set of predictors. 18 The two‐step estimation was performed using stata 17 statistical software (StatCorp, College Station, TX, USA) using default routines for lasso estimation and an ordinary linear square estimation with adjustment for clustering effects of the countries/economies. 19
3. RESULTS
A total of 10 046 unique participants responded to the survey website. Among the initial participants, 368 did not meet inclusion criteria and 1240 women did not consent to participate in the study (participation rate 84%). In all, 604 participants did not complete the demographic questionnaire. The final study population was 7834, including 6134 women from 12 high‐income economies and 1700 women from nine middle‐income economies, including 7102, who completed the GAD‐7 or PHQ‐9 questionnaires (completion rate 90%) (Figure 1).
FIGURE 1.

Recruitment and screened records.
There were statistically significant differences in education, residence, relationship status, declared income, and number of people living in the household between middle‐income economies and high‐income economies. Respectively, 1287 (75.71%) and 5613 (92.51%) declared to be living comfortably or coping on present income (P < 0.001). Women in high‐income economies were older (32.5 versus 29.5 years, P = 0.005), had higher education (4885 [79.64%] versus 884 [49.65%], P < 0.001), lived in very large and large agglomerations (3650 [60.48%] versus 652 [38.35%], P < 0.001) in comparison to women in middle‐income economies (Table 3). In all, 453 (26.65%) in middle‐income economies versus 1202 (19.60%) in high‐income economies declared being in a relationship but not being married (P < 0.001). As for the mean number of people living in a household, this was three in high‐income economies and four in middle‐income economies (P = 0.011). The rates of declared partner and family support exceeded 90% in both groups.
TABLE 3.
Demographic data of women participating in the study a
| ALL | Middle Income | High Income | P value | ||||
|---|---|---|---|---|---|---|---|
| Age, year | 31.91 | 5.06 | 29.57 | 6.20 | 32.55 | 4.50 | 0.005 |
| Body mass index b | 23.69 | 4.67 | 25.23 | 5.26 | 23.29 | 4.42 | 0.001 |
| Education | |||||||
| None | 28 | 0.36 | 18 | 1.06 | 10 | 0.16 | <0.001 |
| Elementary education | 141 | 1.80 | 86 | 5.06 | 55 | 0.90 | |
| Secondary education | 1936 | 24.71 | 752 | 44.24 | 1184 | 19.30 | |
| Higher education | 5729 | 73.13 | 844 | 49.65 | 4885 | 79.64 | |
| Where do you currently live? | |||||||
| A rural area (population of less than a 1000) | 616 | 7.86 | 246 | 14.47 | 370 | 6.03 | <0.001 |
| A small population centre (population between 1000 and 29 999) | 1354 | 17.28 | 349 | 20.53 | 1005 | 16.38 | |
| A medium population centre (population between 30 000 and 99 999) | 1502 | 19.17 | 453 | 26.65 | 1049 | 17.10 | |
| A large population centre (population between100 000 and 499 999) | 2031 | 25.93 | 339 | 19.94 | 1692 | 27.58 | |
| A very large population (population over 500 000) | 2331 | 29.75 | 313 | 18.41 | 2018 | 32.90 | |
| Relationship status: | |||||||
| Married | 5897 | 75.27 | 1105 | 65.00 | 4792 | 78.12 | <0.001 |
| In a relationship | 1655 | 21.13 | 453 | 26.65 | 1202 | 19.60 | |
| Single | 273 | 3.48 | 136 | 8.00 | 137 | 2.23 | |
| Widowed | 9 | 0.11 | 6 | 0.35 | 3 | 0.05 | |
| How you feel about your household's income nowadays? | |||||||
| Living comfortably on present income | 3336 | 42.58 | 463 | 27.24 | 2873 | 46.84 | <0.001 |
| Coping on present income | 3564 | 45.49 | 824 | 48.47 | 2740 | 44.67 | |
| Finding it difficult on present income | 739 | 9.43 | 336 | 19.76 | 403 | 6.57 | |
| Finding it very difficult on present income | 195 | 2.49 | 77 | 4.53 | 118 | 1.92 | |
| The number of people living in household | 3.26 | 1.62 | 4.09 | 2.11 | 3.03 | 1.37 | 0.011 |
| Which of these descriptions applies to what you have been doing just before finding out you got pregnant? | |||||||
| In paid work (or away temporarily) (employee, self‐employed, working for your family business) | 6131 | 78.99 | 1025 | 60.29 | 5106 | 84.23 | <0.001 |
| In education (not paid for by employer) even if on vacation | 197 | 2.54 | 97 | 5.71 | 100 | 1.65 | |
| Unemployed and actively looking for a job | 200 | 2.58 | 103 | 6.06 | 97 | 1.60 | |
| Unemployed, wanting a job but not actively looking for a job | 123 | 1.58 | 51 | 3.00 | 72 | 1.19 | |
| Permanently sick or disabled | 18 | 0.23 | 10 | 0.59 | 8 | 0.13 | |
| In community or military service | 37 | 0.48 | 7 | 0.41 | 30 | 0.49 | |
| Doing housework, looking after children or other persons | 1056 | 13.60 | 407 | 23.94 | 649 | 10.71 | |
| Which of these descriptions applies to your current employment situation? | |||||||
| In paid work (or away temporarily) (employee, self‐employed, working for your family business) | 5449 | 70.20 | 775 | 45.59 | 4674 | 77.10 | <0.001 |
| In education (not paid for by employer) even if on vacation | 159 | 2.05 | 73 | 4.29 | 86 | 1.42 | |
| Unemployed and actively looking for a job | 150 | 1.93 | 86 | 5.06 | 64 | 1.06 | |
| Unemployed, wanting a job but not actively looking for a job | 312 | 4.02 | 118 | 6.94 | 194 | 3.20 | |
| Permanently sick or disabled | 102 | 1.31 | 22 | 1.29 | 80 | 1.32 | |
| In community or military service | 33 | 0.43 | 7 | 0.41 | 26 | 0.43 | |
| Doing housework, looking after children or other persons | 1557 | 20.06 | 619 | 36.41 | 938 | 15.47 | |
| Do you feel supported by your partner during this pregnancy? | 7497 | 95.70 | 1557 | 91.59 | 5940 | 96.84 | 0.066 |
| Do you feel supported by other family members or friends during this pregnancy? | 7532 | 96.15 | 1629 | 95.82 | 5903 | 96.23 | 0.837 |
Data are presented as mean and standard deviation.
Body mass index is calculated as weight in kilograms divided by the square of height in meters.
Regarding demography and obstetric history there were significant differences in maternal body mass index, number of previous cesarean sections, parity, proportion of high‐risk pregnancies, and multiple pregnancies between middle‐income economies and high‐income economies (Table 4).
TABLE 4.
Obstetric history of women participating in the study a
| All | Middle Income | High Income | P value | ||||
|---|---|---|---|---|---|---|---|
| Primiparous | 3973 | 52.04 | 757 | 45.74 | 3216 | 53.78 | 0.138 |
| How many vaginal deliveries have you had? | 1.97 | 0.91 | 2.12 | 1.23 | 1.92 | 0.78 | 0.469 |
| How many cesarean sections have you had? | 1.34 | 0.59 | 1.48 | 0.67 | 1.30 | 0.56 | 0.032 |
| How many times have you been pregnant? (including this pregnancy) | 2.50 | 1.25 | 2.85 | 1.33 | 2.39 | 1.20 | 0.014 |
| Cesarean rate | 0.42 | 0.17 | 0.43 | 0.18 | 0.41 | 0.16 | 0.553 |
| How many pregnancies have you lost before 22 weeks? | |||||||
| 1 | 2273 | 62.12 | 593 | 66.18 | 1680 | 60.80 | 0.132 |
| 2 | 949 | 25.94 | 205 | 22.88 | 744 | 26.93 | |
| 3 | 306 | 8.36 | 68 | 7.59 | 238 | 8.61 | |
| > 3 | 131 | 3.58 | 30 | 3.35 | 101 | 3.66 | |
| Do you have any pre‐pregnancy chronic conditions? | |||||||
| Pre‐pregnancy hypertension | 174 | 2.22 | 58 | 3.41 | 116 | 1.89 | 0.324 |
| Pre‐pregnancy diabetes mellitus type 1 + 2 | 121 | 1.54 | 70 | 4.12 | 51 | 0.83 | <0.001 |
| Hypothyroidism or Hashimoto disease | 541 | 6.91 | 68 | 4.00 | 473 | 7.71 | 0.258 |
| Hyperthyroidism or Graves‐Basedow disease | 105 | 1.34 | 9 | 0.53 | 96 | 1.57 | 0.001 |
| Systemic lupus erythematosus, polyarthritis rheumatoid or other rheumatic diseases | 118 | 1.51 | 63 | 3.71 | 55 | 0.90 | 0.074 |
| Chronic anemia | 99 | 1.26 | 19 | 1.12 | 80 | 1.30 | 0.743 |
| Other | 605 | 7.72 | 112 | 6.59 | 493 | 8.04 | 0.519 |
| Do you have any pregnancy‐related conditions or problems during your current pregnancy? | |||||||
| Pregnancy hypertension | 235 | 3.00 | 67 | 3.94 | 168 | 2.74 | 0.394 |
| HELLP syndrome | 143 | 1.83 | 33 | 1.94 | 110 | 1.79 | 0.884 |
| Diabetes mellitus | 489 | 6.24 | 183 | 10.76 | 306 | 4.99 | 0.199 |
| Hyperemesis | 181 | 2.31 | 32 | 1.88 | 149 | 2.43 | 0.597 |
| Threatened preterm birth | 235 | 3.00 | 79 | 4.65 | 156 | 2.54 | 0.102 |
| Threatened miscarriage | 254 | 3.24 | 89 | 5.24 | 165 | 2.69 | 0.076 |
| Anemia | 448 | 5.72 | 117 | 6.88 | 331 | 5.40 | 0.576 |
| Polyhydraminios | 40 | 0.51 | 11 | 0.65 | 29 | 0.47 | 0.600 |
| Oligohydraminios | 41 | 0.52 | 16 | 0.94 | 25 | 0.41 | 0.010 |
| FGR | 74 | 0.94 | 30 | 1.76 | 44 | 0.72 | 0.001 |
| Other | 648 | 8.27 | 226 | 13.29 | 422 | 6.88 | 0.096 |
| I do not have any pregnancy‐related health issues in this pregnancy | 5766 | 73.60 | 1065 | 62.65 | 4701 | 76.64 | 0.021 |
| Have you been told by your doctor or midwife that your pregnancy is a high‐risk one? | 1483 | 19.43 | 651 | 39.38 | 832 | 13.92 | <0.001 |
| Did you get infertility treatment before this pregnancy? | 950 | 12.44 | 217 | 13.12 | 733 | 12.26 | 0.810 |
| Is this pregnancy a result of fertility treatment? | 658 | 8.62 | 109 | 6.59 | 549 | 9.18 | 0.151 |
| How many babies are you carrying? | |||||||
| 1 | 7373 | 96.61 | 1552 | 93.89 | 5821 | 97.36 | <0.001 |
| 2 | 233 | 3.05 | 85 | 5.14 | 148 | 2.48 | |
| 3 | 26 | 0.34 | 16 | 0.97 | 10 | 0.17 | |
Data are presented as mean and standard deviation.
The proportions of women declaring mental health problems and in need of treatments before and during pregnancy were the same in both groups (Table 5). There were also no statistical differences between SARS‐CoV‐2 infection rates between the two groups.
TABLE 5.
Mental health and views on the COVID‐19 pandemic a
| All | Middle Income | High Income | P value | ||||
|---|---|---|---|---|---|---|---|
| Before pregnancy have you ever sought any mental health support? | 1437 | 19.00 | 312 | 19.22 | 1125 | 18.94 | 0.971 |
| Before pregnancy have you had any psychiatric treatment? | |||||||
| Yes, pharmacologic | 181 | 2.39 | 27 | 1.66 | 154 | 2.59 | 0.274 |
| Yes, psychotherapy | 349 | 4.61 | 61 | 3.76 | 288 | 4.85 | |
| Yes, psychotherapy and pharmacologic | 261 | 3.45 | 38 | 2.34 | 223 | 3.75 | |
| No | 6773 | 89.54 | 1498 | 92.24 | 5275 | 88.80 | |
| During this pregnancy have you sought any mental health support? | 563 | 7.45 | 146 | 9.00 | 417 | 7.02 | 0.460 |
| During this pregnancy have you received/are you receiving any psychiatric treatment? | |||||||
| Yes, pharmacologic | 72 | 0.95 | 20 | 1.23 | 52 | 0.88 | 0.729 |
| Yes, psychotherapy | 186 | 2.46 | 40 | 2.47 | 146 | 2.46 | |
| Yes, psychotherapy and pharmacologic | 34 | 0.45 | 8 | 0.49 | 26 | 0.44 | |
| No | 7266 | 96.14 | 1553 | 95.81 | 5713 | 96.23 | |
| Have you been infected with the new coronavirus (known as COVID‐19) before pregnancy? | 160 | 2.18 | 80 | 5.09 | 80 | 1.39 | 0.117 |
| Have you been infected with COVID‐19 during this pregnancy? | 287 | 3.92 | 91 | 5.79 | 196 | 3.41 | 0.501 |
| Which of the following imposed restrictions resulting from the COVID‐19 pandemic have burdened you the most? | |||||||
| None | 1878 | 25.65 | 396 | 25.19 | 1482 | 25.77 | <0.001 |
| I have to give up on my leisure activities | 1481 | 20.22 | 203 | 12.91 | 1278 | 22.22 | |
| I have to give up on social meetings | 2237 | 30.55 | 304 | 19.34 | 1933 | 33.61 | |
| I have to work from home | 352 | 4.81 | 115 | 7.32 | 237 | 4.12 | |
| I cannot work at all | 505 | 6.90 | 246 | 15.65 | 259 | 4.50 | |
| I cannot leave the house at all | 870 | 11.88 | 308 | 19.59 | 562 | 9.77 | |
| How do you view your country's policies related to the COVID‐19 pandemic? Which statement best describes your view/feeling/fear? | |||||||
| They are sufficient and I feel they are aimed at protecting me and my unborn child | 3671 | 50.18 | 725 | 46.24 | 2946 | 51.25 | 0.008 |
| The restrictions are not sufficient enough fear for myself and my unborn child | 961 | 13.14 | 300 | 19.13 | 661 | 11.50 | |
| I feel the restrictions such as labour without an accompanying person are harmful to me and my child | 1153 | 15.76 | 129 | 8.23 | 1024 | 17.81 | |
| I fear that I will have to have a cesarean section if I have suspected/confirmed COVID‐19 infection | 131 | 1.79 | 40 | 2.55 | 91 | 1.58 | |
| I fear that if I have suspected/confirmed COVID‐19 infection I will be separated from my child | 1251 | 17.10 | 312 | 19.90 | 939 | 16.34 | |
| I fear that if I have suspected/confirmed COVID‐19 infection I will not be allowed to breastfeed | 149 | 2.04 | 62 | 3.95 | 87 | 1.51 | |
| Which is your number one source of information about COVID‐19 pandemic and the new coronavirus? | |||||||
| Social media | 2079 | 28.42 | 607 | 38.71 | 1472 | 25.61 | <0.001 |
| Internet published statistics | 1075 | 14.70 | 132 | 8.42 | 943 | 16.41 | |
| Medical research papers | 502 | 6.86 | 123 | 7.84 | 379 | 6.59 | |
| Medical provider, general practitioner or midwife that I attend | 436 | 5.96 | 109 | 6.95 | 327 | 5.69 | |
| Family or friends | 137 | 1.87 | 50 | 3.19 | 87 | 1.51 | |
| Newspaper | 509 | 6.96 | 33 | 2.10 | 476 | 8.28 | |
| Television | 2577 | 35.23 | 514 | 32.78 | 2063 | 35.90 | |
Data are presented as mean and standard deviation.
The analysis of the six variables generated from the Oxford COVID‐19 Government Response Tracker showed statistical differences between middle‐income economies and high‐income economies in the containment and health index (Table 6).
TABLE 6.
Oxford COVID‐19 Government Response Tracker (OxCGRT) data from regions participating in the study a
| All | Middle income | High income | P value | ||||
|---|---|---|---|---|---|---|---|
| Government response index | 57.94 | 14.89 | 69.47 | 6.47 | 54.74 | 14.99 | 0.054 |
| Economic support index | 61.16 | 22.27 | 71.45 | 14.69 | 58.31 | 23.16 | 0.175 |
| Stringency index | 57.61 | 22.60 | 74.89 | 9.21 | 52.82 | 22.87 | 0.057 |
| Health and containment index | 57.49 | 14.92 | 69.19 | 6.67 | 54.25 | 14.95 | 0.049 |
| Confirmed cases per 1000 | 9.22 | 15.52 | 7.39 | 6.84 | 9.74 | 17.16 | 0.715 |
| Confirmed deaths per 1000 | 0.23 | 0.36 | 0.39 | 0.43 | 0.18 | 0.32 | 0.385 |
Data are presented as mean and standard deviation.
Analysis of attitudes towards the pandemic and the related restrictions showed that women in both middle‐income economies and high‐income economies expressed similar sources of fear and burden regarding the pandemic. The mean declared values of fear regarding restrictions related to childbirth and feeling burdened by restriction imposed on labour and delivery because of the COVID‐19 pandemic (presence of accompanying persons at hospital etc.) were 70.56 and 65.42, respectively for the total study population. There were no statistical differences between middle‐income economies and high‐income economies. The mean value of concern about family members getting sick and having adverse effects of COVID‐19 was 70.67, but it was significantly higher in middle‐income economies (76.82 versus 69.00, P < 0.001). The mean value of declared fear that the baby will become ill during/after delivery and will have adverse outcomes due to COVID‐19 was 70.19 but was significantly higher in middle‐income economies (78.70 versus 67.88, P = 0.011). In general, women in middle‐income economies declared significantly higher mean values of fear and burden regarding the pandemic than women in high‐income economies (7 out of 13 questions; Table 7).
TABLE 7.
Self‐assessed levels of fear and burden regarding restrictions in high‐income and middle‐income regions a
| All | Middle income | High income | P value | ||||
|---|---|---|---|---|---|---|---|
| How would you rate your level of fear that you or the people close to you will become infected with COVID‐19? | 59.58 | 25.63 | 65.12 | 25.28 | 58.08 | 25.53 | 0.002 |
| How much are you concerned about your unborn child's safety due to the COVID‐19 pandemic? | 67.36 | 25.81 | 75.80 | 22.24 | 65.07 | 26.24 | <0.001 |
| How much are you concerned about your family members getting sick and having the adverse effects of the COVID‐19? | 70.67 | 23.66 | 76.82 | 21.30 | 69.00 | 23.99 | <0.001 |
| How much are you concerned about you getting sick and having the adverse effects of the COVID‐19? | 66.91 | 25.82 | 74.65 | 23.29 | 64.81 | 26.07 | 0.002 |
| How much do you fear that the COVID‐19 pandemic will result in restrictions related to your childbirth (presence of accompanying person/s at hospital etc.) | 70.56 | 26.27 | 71.84 | 25.54 | 70.22 | 26.45 | 0.730 |
| How much do you fear that your baby will become ill during/after delivery and will have adverse outcomes due to the COVID‐19? | 70.19 | 26.90 | 78.70 | 22.73 | 67.88 | 27.48 | 0.011 |
| How much do you fear that your partner will not be able to be present during the delivery? | 69.76 | 28.86 | 66.72 | 30.98 | 70.59 | 28.21 | 0.408 |
| How much do you feel restricted due to social distancing recommended or implemented during the COVID‐19 pandemic? | 59.86 | 26.25 | 63.85 | 25.88 | 58.77 | 26.25 | 0.400 |
| How burdened do you feel by the current COVID‐19 pandemic in regard to your or your family members' possibility to work and earn money (i.e. has it changed because of the pandemic)? | 47.82 | 31.65 | 64.28 | 26.52 | 43.36 | 31.45 | 0.001 |
| How burdened do you feel by the current COVID‐19 pandemic in regard to your favorite leisure activities (i.e. has it changed because of the pandemic)? | 58.51 | 26.45 | 59.23 | 27.23 | 58.31 | 26.24 | 0.864 |
| How burdened do you feel by the current COVID‐19 pandemic in regard to the provision of childcare ‐ closed schools, kindergartens, nurseries, etc. (i.e. has it changed because of the pandemic)? | 46.94 | 34.37 | 56.06 | 32.18 | 44.47 | 34.53 | 0.116 |
| How burdened do you feel by the current COVID‐19 pandemic in regard to how it has affected your household's financial situation? | 44.67 | 30.98 | 64.08 | 27.21 | 39.41 | 29.82 | <0.001 |
| How much do you feel burdened by restrictions imposed on labor and delivery as a result of the COVID‐19 pandemic (presence of accompanying person/s at hospital etc.)? | 65.42 | 27.70 | 70.10 | 26.21 | 64.16 | 27.95 | 0.257 |
Data are presented as mean and standard deviation.
Women in high‐income economies presented higher PHQ‐9 (0.18 SD, P < 0.001) and GAD‐7 (0.08 SD, P = 0.005) scores than those living in middle‐income economies. Results did not change significantly after controlling for socioeconomic variables; both indicators were higher in high‐income economies (PHQ‐9: 0.21 SD, P < 0.001 and GAD‐7: 0.11 SD, P < 0.001; Figure 2). There was a significant correlation between the GAD‐7 and PHQ‐9 scale (0.7613; P < 0.001) (Figure 3).
FIGURE 2.
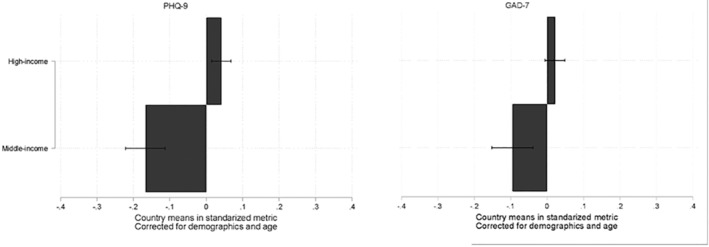
PHQ‐9 and GAD‐7 results corrected for demographics and age in high‐income and middle‐income regions.
FIGURE 3.

Correlations between scales PHQ‐9 and GAD‐7 (0.7613).
In the total study population, multivariate regression analysis showed that increasing the PHQ‐9 scale in pregnant women during the COVID‐19 pandemic was contributed by mental health problems, psychiatric treatment during and before pregnancy, feeling of burden related to restrictions in social distancing, and access to leisure activities (Figure 4).
FIGURE 4.

Comparison of multivariate regression of variables affecting the results of the PHQ‐9 scale. Footnote: ** difference statistically significant at P = 0.05 and *difference statistically significant at P = 0.1.
In high‐income economies, increasing PHQ‐9 scale in pregnant women during the COVID‐19 pandemic was contributed by having mental health problems before pregnancy, feeling of burden related to financial restrictions, and fear for child's safety and adverse outcomes. Feeling of burden related to financial restrictions had a significantly higher effect on the PHQ‐9 scale in high‐income economies than in middle‐income economies (P < 0.05) (Figure 4).
In middle‐income economies, PHQ‐9 scores were affected by living in a large city, fear of childbirth‐related restrictions and burden related to childcare. Fear of childbirth had a significantly higher effect on the PHQ‐9 scale in middle‐income economies than in high‐income economies (P < 0.1) (Figure 4).
Low PHQ‐9 scores in pregnant women during the COVID‐19 pandemic were significantly associated with having a good financial situation, and support from a partner and family (Tables 8 and 9). Higher maternal age resulted in lower PHQ‐9 scores in middle‐income economies, whereas a good financial situation had a significantly lower effect on the PHQ‐9 scale in middle‐income economies than in high‐income economies (P < 0.1) (Figure 4).
TABLE 8.
Multivariate regression of variables affecting the results of the PHQ‐9 scale in middle‐income regionsa
| Coefficient | SE | t | P > |t| | 95% CI | ||
|---|---|---|---|---|---|---|
| Age | −0.08 | 0.02 | −3.98 | 0.004 | −0.13 | −0.04 |
| Higher education | 0.14 | 0.07 | 2.01 | 0.079 | −0.02 | 0.29 |
| Residence place large cities | 0.11 | 0.04 | 2.87 | 0.021 | 0.02 | 0.19 |
| In relationship | 0.06 | 0.03 | 1.92 | 0.092 | −0.01 | 0.13 |
| Psychiatric treatment before pregnancy | 0.10 | 0.04 | 2.7 | 0.027 | 0.02 | 0.19 |
| COVID‐19 fear childbirth | 0.15 | 0.03 | 4.37 | 0.002 | 0.07 | 0.23 |
| COVID‐19 child adverse outcomes | 0.10 | 0.04 | 2.59 | 0.032 | 0.01 | 0.18 |
| COVID‐19 burdened work | 0.06 | 0.04 | 1.39 | 0.201 | −0.04 | 0.15 |
| COVID‐19 burdened childcare | 0.10 | 0.04 | 2.57 | 0.033 | 0.01 | 0.18 |
| Confirmed deaths | −0.01 | 0.08 | −0.07 | 0.947 | −0.18 | 0.17 |
| Sufficient income | −0.15 | 0.04 | −4.09 | 0.004 | −0.24 | −0.07 |
| Partner support | −0.10 | 0.03 | −3.12 | 0.014 | −0.17 | −0.03 |
| Family support | −0.13 | 0.05 | −2.75 | 0.025 | −0.24 | −0.02 |
| COVID‐19 during pregnancy | −0.02 | 0.02 | −0.96 | 0.364 | −0.08 | 0.03 |
| Mental health problems before pregnancy | 0.08 | 0.04 | 1.9 | 0.094 | −0.02 | 0.18 |
| Mental health problems during pregnancy | 0.05 | 0.02 | 2.9 | 0.020 | 0.01 | 0.09 |
| COVID‐19 fear people infected | −0.09 | 0.04 | −2.04 | 0.076 | −0.19 | 0.01 |
| COVID‐19 child's safety | 0.00 | 0.04 | 0.08 | 0.941 | −0.09 | 0.10 |
| COVID‐19 distancing | 0.10 | 0.04 | 2.87 | 0.021 | 0.02 | 0.18 |
| COVID‐19 burdened leisure | 0.11 | 0.04 | 2.77 | 0.024 | 0.02 | 0.21 |
| COVID‐19 burdened financial situation | −0.02 | 0.03 | −0.49 | 0.634 | −0.09 | 0.06 |
| COVID‐19 restrictions delivery | 0.06 | 0.03 | 1.84 | 0.103 | −0.02 | 0.13 |
| Constant | −0.20 | 0.10 | −2.09 | 0.071 | −0.43 | 0.02 |
Abbreviations: CI, confidence interval; COVID‐19, coronavirus disease 2019; SE, standard error.
TABLE 9.
Multivariate regression of variables affecting the results of the PHQ‐9 scale in high‐income regions
| Coefficient | SE | t | P > |t| | 95% CI | ||
|---|---|---|---|---|---|---|
| Age | −0.06 | 0.03 | −2.07 | 0.068 | −0.12 | 0.01 |
| Higher education | 0.02 | 0.02 | 1.34 | 0.212 | −0.02 | 0.06 |
| Residence place large cities | 0.01 | 0.02 | 0.8 | 0.442 | −0.02 | 0.05 |
| In relationship | 0.02 | 0.01 | 2.07 | 0.068 | −0.00 | 0.05 |
| Psychiatric treatment before pregnancy | 0.08 | 0.01 | 12.78 | <0.001 | 0.07 | 0.09 |
| COVID‐19 fear childbirth | −0.00 | 0.04 | −0.03 | 0.981 | −0.09 | 0.09 |
| COVID‐19 child adverse outcomes | 0.04 | 0.01 | 5.03 | 0.001 | 0.02 | 0.06 |
| COVID‐19 burdened work | −0.00 | 0.01 | −0.19 | 0.856 | −0.03 | 0.03 |
| COVID‐19 burdened childcare | 0.04 | 0.03 | 1.53 | 0.160 | −0.02 | 0.11 |
| Confirmed deaths | −0.01 | 0.03 | −0.46 | 0.660 | −0.09 | 0.06 |
| Sufficient income | −0.06 | 0.01 | −6.4 | <0.001 | −0.08 | −0.04 |
| Partner support | −0.07 | 0.01 | −5.63 | <0.001 | −0.10 | −0.04 |
| Family support | −0.09 | 0.02 | −5.13 | 0.001 | −0.14 | −0.05 |
| COVID‐19 during pregnancy | 0.00 | 0.01 | 0.27 | 0.793 | −0.02 | 0.03 |
| Mental health problems before pregnancy | 0.06 | 0.02 | 3.11 | 0.012 | 0.02 | 0.11 |
| Mental health problems during pregnancy | 0.11 | 0.01 | 11.57 | <0.001 | 0.09 | 0.13 |
| COVID‐19 fear people infected | 0.02 | 0.03 | 0.52 | 0.617 | −0.05 | 0.08 |
| COVID‐19 child's safety | 0.06 | 0.03 | 2.38 | 0.041 | 0.00 | 0.12 |
| COVID‐19 distancing | 0.13 | 0.04 | 3.51 | 0.007 | 0.05 | 0.21 |
| COVID‐19 burdened leisure | 0.07 | 0.02 | 3.64 | 0.005 | 0.03 | 0.12 |
| COVID‐19 burdened financial situation | 0.07 | 0.01 | 9.94 | <0.001 | 0.06 | 0.09 |
| COVID‐19 restrictions delivery | 0.10 | 0.06 | 1.73 | 0.118 | −0.03 | 0.23 |
| Constant | 0.09 | 0.06 | 1.54 | 0.158 | −0.04 | 0.21 |
Abbreviations: CI, confidence interval; COVID‐19, coronavirus disease 2019; SE, standard error.
In the total study population, multivariate regression analysis demonstrated that GAD‐7 scores were increased among women with a pregnancy‐related complication, mental health problems during pregnancy, the need for psychiatric treatment before pregnancy, fear of adverse outcomes in children related to COVID‐19, and feeling of burden related to finances. Fear of adverse outcomes in children had a significantly different effect on the GAD‐7 scale in high‐income economies and middle‐income economies (P < 0.1). Additionally, in high‐income economies, GAD‐7 scores were higher among women with higher education, mental health problems before pregnancy, fear for child safety, and burden related to social distancing and leisure. Child safety had a significantly different effect on the GAD‐7 scale in high‐income economies and middle‐income economies (P < 0.05). GAD‐7 scores among women in middle‐income economies were higher because of fear of childbirth restrictions (Figure 5).
FIGURE 5.

Comparison of multivariate regression of variables affecting the results of the GAD‐7 scale. Footnote: ** difference statistically significant at P = 0.05 and * difference statistically significant at P = 0.1.
In both middle‐income economies and high‐income economies, factors associated with reducing GAD‐7 scores were comfortable financial status and support from a partner and family members. Higher maternal age was related to decreased GAD‐7 scores in middle‐income economies (Tables 10 and 11).
TABLE 10.
Multivariate regression of variables affecting the results of the GAD‐7 scale in high‐income regions
| Coefficient | SE | t | P > |t| | 95% CI | ||
|---|---|---|---|---|---|---|
| Age | −0.05 | 0.03 | −1.87 | 0.088 | −0.10 | 0.01 |
| Higher education | 0.04 | 0.02 | 2.64 | 0.023 | 0.01 | 0.07 |
| Sufficient income | −0.04 | 0.02 | −2.41 | 0.035 | −0.08 | −0.00 |
| In relationship | 0.05 | 0.02 | 2.56 | 0.026 | 0.01 | 0.08 |
| Partner support | −0.06 | 0.02 | −2.49 | 0.030 | −0.11 | −0.01 |
| Primiparous | −0.00 | 0.03 | −0.1 | 0.924 | −0.08 | 0.07 |
| Pregnancy‐related conditions | 0.08 | 0.02 | 3.44 | 0.006 | 0.03 | 0.13 |
| Mental health problems before pregnancy | 0.09 | 0.01 | 8.32 | <0.001 | 0.07 | 0.12 |
| Psychiatric treatment before pregnancy | 0.08 | 0.01 | 5.93 | <0.001 | 0.05 | 0.11 |
| COVID‐19 fear family adverse outcomes | 0.05 | 0.03 | 1.98 | 0.073 | −0.01 | 0.10 |
| COVID‐19 fear childbirth | −0.01 | 0.03 | −0.41 | 0.691 | −0.09 | 0.06 |
| COVID‐19 child adverse outcomes | 0.04 | 0.01 | 5.51 | <0.001 | 0.03 | 0.06 |
| Economic support index | 0.05 | 0.04 | 1.35 | 0.204 | −0.03 | 0.13 |
| Family support | −0.09 | 0.01 | −6.06 | <0.001 | −0.12 | −0.06 |
| COVID‐19 during pregnancy | 0.00 | 0.01 | 0.31 | 0.763 | −0.02 | 0.03 |
| High‐risk pregnancy | 0.02 | 0.02 | 1.4 | 0.190 | −0.01 | 0.06 |
| Mental health problems during pregnancy | 0.13 | 0.01 | 15.12 | <0.001 | 0.11 | 0.15 |
| COVID‐19 child's safety | 0.11 | 0.02 | 6.54 | <0.001 | 0.07 | 0.15 |
| COVID‐19 distancing | 0.12 | 0.04 | 2.68 | 0.022 | 0.02 | 0.22 |
| COVID‐19 burdened leisure | 0.06 | 0.02 | 2.51 | 0.029 | 0.01 | 0.11 |
| COVID‐19 burdened financial situation | 0.08 | 0.01 | 9.19 | <0.001 | 0.06 | 0.10 |
| COVID‐19 restrictions delivery | 0.09 | 0.05 | 1.94 | 0.079 | −0.01 | 0.19 |
| Constant | 0.09 | 0.04 | 2.28 | 0.044 | 0.00 | 0.18 |
Abbreviations: CI, confidence interval; COVID‐19, coronavirus disease 2019; SE, standard error.
TABLE 11.
Multivariate regression of variables affecting the results of the GAD‐7 scale in middle‐income regions
| Coefficient | SE | t | P > |t| | 95% CI | ||
|---|---|---|---|---|---|---|
| Age | −0.04 | 0.01 | −2.85 | 0.022 | −0.06 | −0.01 |
| Higher education | 0.08 | 0.06 | 1.35 | 0.215 | −0.06 | 0.23 |
| Sufficient income | −0.12 | 0.04 | −2.89 | 0.020 | −0.22 | −0.02 |
| In relationship | 0.07 | 0.04 | 1.66 | 0.136 | −0.03 | 0.16 |
| Partner support | −0.11 | 0.03 | −3.36 | 0.010 | −0.18 | −0.03 |
| Primiparous | 0.01 | 0.05 | 0.23 | 0.824 | −0.10 | 0.12 |
| Pregnancy‐related conditions | 0.08 | 0.03 | 3.3 | 0.011 | 0.03 | 0.14 |
| Mental health problems before pregnancy | 0.06 | 0.05 | 1.24 | 0.249 | −0.05 | 0.18 |
| Psychiatric treatment before pregnancy | 0.15 | 0.04 | 3.29 | 0.011 | 0.04 | 0.25 |
| COVID‐19 fear family adverse outcomes | 0.10 | 0.05 | 2.18 | 0.061 | −0.01 | 0.21 |
| COVID‐19 fear childbirth | 0.08 | 0.03 | 3.29 | 0.011 | 0.03 | 0.14 |
| COVID‐19 child adverse outcomes | 0.13 | 0.03 | 4.28 | 0.003 | 0.06 | 0.20 |
| Economic support index | −0.09 | 0.11 | −0.8 | 0.449 | −0.33 | 0.16 |
| Family support | −0.11 | 0.04 | −2.53 | 0.035 | −0.21 | −0.01 |
| COVID‐19 during pregnancy | −0.01 | 0.03 | −0.22 | 0.834 | −0.07 | 0.06 |
| High‐risk pregnancy | −0.05 | 0.04 | −1.45 | 0.185 | −0.13 | 0.03 |
| Mental health problems during pregnancy | 0.08 | 0.02 | 4.52 | 0.002 | 0.04 | 0.12 |
| COVID‐19 child's safety | −0.09 | 0.04 | −2.3 | 0.050 | −0.18 | 0.00 |
| COVID‐19 distancing | 0.06 | 0.03 | 2.17 | 0.062 | −0.00 | 0.13 |
| COVID‐19 burdened leisure | 0.09 | 0.06 | 1.58 | 0.153 | −0.04 | 0.23 |
| COVID‐19 burdened financial situation | 0.12 | 0.04 | 2.99 | 0.017 | 0.03 | 0.21 |
| COVID‐19 restrictions delivery | 0.06 | 0.04 | 1.33 | 0.219 | −0.04 | 0.16 |
| Constant | −0.16 | 0.10 | −1.6 | 0.148 | −0.38 | 0.07 |
Abbreviations: CI, confidence interval; COVID‐19, coronavirus disease 2019; SE, standard error.
No correlation was found between the six analyzed Oxford COVID‐19 Government Response Tracker variables and the GAD‐7 and PHQ‐9 scores. Confirmed COVID‐19 cases and related deaths per 1000 inhabitants had no effect on the PHQ‐9 and GAD‐7 scales.
4. DISCUSSION
WHO has expressed concerns regarding very restrictive government responses. Studies confirm that these government responses have significantly impacted mental health outcomes. 20 Although the containment and health index, defined as a composite measure of school closures, workplace closures, travel bans, testing policy, contact tracing, face coverings, and vaccine policy, was statistically higher in middle‐income economies than high‐income economies, a multivariate analysis did not confirm its impact on maternal mental health. This is in accordance with the previously published ineffectiveness of Oxford COVID‐19 Government Response Tracker variables in explaining differences between studied economical regions. 21
Our study confirms the previous finding of a stronger relation between mental health and the feelings related to burdens experienced, rather than the actual level of imposed restrictions. Satisfaction with government reactions and fear appraisal play an important role in the perception of the efficacy of restrictions. A perinatal cohort study revealed that general information on COVID‐19 safe behaviors did not meet their particular needs and exacerbated the risk of psychological and psychosocial distress. 22
The preventive protocols implemented in hospitals and birth centres have left women vulnerable. 23 , 24 In our study, women from middle‐income economies had significantly higher levels of anxiety and depression due to concerns related to childbirth policies. Perhaps this was related to the higher containment and health index in middle‐income economies. Previous studies regarding childbirth expectations were mainly conducted in high‐income economic regions. An Italian survey showed that only 5.3% of women declared that they were afraid of giving birth during the COVID‐19 pandemic. It was reported that the delivery experience was as expected in 50.8% of cases and better than expected in 36.2%. 25 WHO emphasizes that all pregnant women have the right to a safe and positive childbirth experience during the pandemic, irrespective of whether they have confirmed SARS‐CoV‐2 infection. This includes all prenatal, intrapartum, and postpartum maternal and neonatal care services, including psychological health services. 6
Partner and family support were the strongest protective factor for both anxiety and depression regardless of regional economic status. This confirms that social relationships provide a general sense of self‐worth, psychological well‐being, as well as access to resources during stressful times. 26
Previous studies have described a wide range of general risk factors of antenatal depression and anxiety including psychological status, history of maternal mental illness, a chronic mental illness, and a chronic somatic illness. 27 , 28 , 29 Our findings are consistent with studies associating higher anxiety levels with a history of psychological disorders. Additionally, during the pandemic risk factors include fear of vertical transmission of SARS‐CoV‐2.
In middle‐income economies specifically, women felt more burdened about the effect of the pandemic on their household's financial situation. One in four women declared not living comfortably or coping on their present income. For them the greatest potential burden of the imposed restrictions was not being able to leave the house for work. 30 Financial challenges, fear of loss of employment, and reduced salary are important risk factors affecting family stability and sense of security. 29
Mental health was not affected by the severity of the pandemic but by the feeling of being burdened related to public health measures imposed by the government. The primary issue is how the government responds and communicates to the general public the imposed public health measures to tackle the pandemic effectively and in a timely fashion. Hospital level restrictions have left pregnant women more vulnerable during these difficult times. Settings with very strict hospital measures including no visitation and no accompanying person for the delivery should provide additional support from healthcare workers to compensate the lack of support from the partner and family, especially during childbirth. The latter is the most important protective factor against anxiety and depression regardless of regional economic status.
The Oxford COVID‐19 Government Response Tracker variables were ineffective in discerning the differences between the studied regions. In future research, a different model for comparing public and healthcare measures should be used. The GAD‐7 and PHQ‐9 scales were found useful in assessing depression and anxiety syndromes. They are both short scales that can be used as online tools for self‐assessment.
The main strength of our study is that it presents data from 21 regions collected in 16 different languages, so allowing comparison between middle‐income economies and high‐income economies. To our knowledge this is the first study to be as inclusive as possible, having a global picture of the mental health issues related to the COVID‐19 pandemic. The strength of the study was that we targeted an unselected population of pregnant women and collected comprehensive demographic and medical history data. Another strength of the study is that it uses modern statistical tools that provide robust variable selection and unbiased estimation of parameters without threat of overfitting.
Although, the most used tools for the assessment of anxiety and depression are the State–Trait Anxiety Inventory and Edinburgh Postnatal Depression Scale, for this study we have chosen the GAD‐7 and PHQ‐9 because they are user‐friendly self‐assessment tools that can be completed online without the guidance of medical personnel.
A major limitation is that the online approach for data collection has limited participation of women in low‐income regions and with a low socioeconomic status. A convenience sampling method was used because it is a proven, efficient, cost‐effective method of recruitment for a web‐based survey. 3 Study promotion via the internet and social media, and fliers and QR codes distributed in healthcare facilities, yielded different rates of recruitment across the studied regions. In consequence, the number of recruited women was higher in high‐income economies than middle‐income economies. Although the number of cases in middle‐income economies was sufficient for statistical comparisons with high‐income economies, the results must be interpreted with caution. Differences in recruitment numbers between regions resulted in an under‐represented sample of pregnant women from middle‐income regions, which compromises the similarity of the results. A more homogeneous patient sample could result in finding risk factors with statistical difference between middle‐income and high‐income countries. This is a methodologic bias that cannot be compensated fully by the robust statistical methods applied in the study. Further, web‐based survey is prone to several other types of biases. 3 Response‐bias carries a risk that pregnant women are particularly worried about the COVID‐19 pandemic and are more likely to respond to the advertisement of a survey assessing mental health related to the COVID‐19 pandemic. This was accounted for by collecting background information regarding mental health problems and previous treatments. There were no differences in the rate of mental health problems declared in the studied groups. There were also initial concerns that the survey would reach more women of a higher socioeconomic status and from larger agglomerations, which was true for high‐income economies. For this reason, we corrected for these demographic variables when analyzing the results of the PHQ‐9 and GAD‐7 scales. Lastly, we have decided to report these results first, though some recruiting regions have not reached the recruitment target, as we feel strongly about informing our community of the negative impact of the ongoing pandemic on maternal perinatal mental health.
In conclusion, according to this study, the imposed public health measures and hospital restrictions have left pregnant women more vulnerable during these difficult times. Adequate partner and family support during pregnancy and childbirth can be one of the most important protective factors against anxiety and depression, regardless of national economic status (high‐income or middle‐income economies). However, more studies with robust methodology involving pregnant women in middle‐income economies are needed. A more homogeneous sample among countries with different socioeconomic levels can help to identify the risk factors that are related to anxiety and depression in pregnant women in different global economies.
AUTHOR CONTRIBUTIONS
AK and LCP are the principal investigators of this study; they conceived the study with input from DS, SF, AP, SK, MR, and RJM‐P. The survey questionnaire was translated by AK, PC, SF, FP, LJS, OMYR, HYV, SLY, and LCP. AK and DS coordinated data acquisition and data management. AK, DS, GA, MB‐Z, DB, TB‐S, PC, T‐YC, BC, AE, SF, RG‐M, MMG, SH, SK, AM‐A, RJM‐P, FP, MR, OMYR, LJS, MGS, SS, HT, SV, HYV, SLY, and LCP organized and performed the data collection. Data were cleaned and prepared by DS. AK and AP verified the underlying data. Statistical analyses and data visualization were performed by AP. AK, DS, AP, and LCP analyzed the results and wrote the manuscript. All authors were responsible for reviewing and editing the manuscript. All authors had full access to all the data in the study and approved the final version of this manuscript.
CONFLICT OF INTERESTS
All authors declare no competing interests.
Supporting information
Appendix S1 Full survey in English.
ACKNOWLEDGMENTS
APC was funded by the Centre of Postgraduate Medical Education—Grant No. 501‐1‐081‐34‐21. We would like to thank the Foundation for St. Sophia's Specialist Hospital for providing the Research and Electronic Data Capture (REDCap) tool. We are also grateful to the Ultrasound Section of Polish Society of Obstetricians and Gynecologists and Prenatal Projekt for their help in recruiting pregnant women. Pavel Calda is supported by Ministry of Health, Czech Republic—conceptual development of research organization 00064165, General University Hospital in Prague.
APPENDIX A.
Mind‐COVID Collaborative Team
Urszula Ajdacka MD, Clinical Department of Obstetrics and Gynecology, Central Clinical Hospital of Ministry of Interior and Administration, Warsaw, Poland; Ewa Andersson, RNM, PhD Department of Women's and Children's Health Division of Reproductive Health, Tomtebodavägen, Stockholm, Sweden; Barbara Baranowska, PhD, RM Department of Midwifery Centre of Postgraduate Medical Education Warsaw, Poland; Grażyna Bączek, PhD, RM, Department of Obstetrics and Gynecology Didactics, Faculty of Health Sciences, Medical University of Warsaw, Poland; Karine Stiberg Birkelund, Medical Student/Researcher, UiT‐The Arctic University of Norway Tromsø, Norway; Katherine Belen Campos Del Castillo, MD Department of Obstetrics and Gynecology Hospital Nacional Edgardo Rebagliati Martins, EsSalud, Lima, Peru; Gihad Chalouhi MD, PhD, American University of Beirut, Lebanon; Chan‐Yu Sung, Department of Medical Research, Taiji Clinic, Taipei, Taiwan; Ricardo Ciammella, MD Hospital Universitario Austral, Argentina; Angeles Cibert, MD Hospital Universitario Austral, Argentina; Sabrina Demirdjian, MD, Hospital Universitario Austral, Argentina; Mariana Esteban, MD Hospital Universitario Austral, Argentina; Dagmara Filipecka‐Tyczka, MD, PhD, Department of Reproductive Health, Centre of Postgraduate Medical Education, Warsaw, Poland; Sergio Freeman‐Rechy, Regional Militar Hospital, Guadalajara, Mexico; Tetiana Fedyshyn, MD, Ukraine; Orion Gliozheni, MD, Obstetrics and Gynecology Department University of Medicine Tirana; Yasmin Hasbini, Research Scholar, Office of Women's Health, Wayne State University; Veronica Aide Hernandez‐Muñoz, University of Colima, Colima, Mexico; Sarah Homitsky, MD Women's Behavioral Health, Department of Psychiatry, Allegheny Health Network; Hanna Jasiak, MD Department of Obstetrics and Gynecology, Pomeranian Medical University, Szczecin, Poland; Maria Kaźmierczak, PhD, Department of Family Studies and Quality of Life, Institute of Psychology, University of Gdansk, Poland; Roksana Lewandowska, MD, Department of Obstetrics and Gynecology, Pomeranian Medical University, Szczecin, Poland; Yi‐Ying Li, Department of Fetal Medicine, Taiji Clinic, Taipei, Taiwan; Josefina Maquieira MD, Hospital Universitario Austral, Argentina; Radosław Maksym, MD, PhD, Department of Reproductive Health, Centre of Postgraduate Medical Education, Warsaw, Poland; Virginia Medina‐Jimenez, MD. State center for timely prenatal screening, Hospital Materno‐Infantil, Leon, Guanajuato, Mexico; Jan Modzelewski, MD, Department of Reproductive Health, Centre of Postgraduate Medical Education, Warsaw, Poland; Juliana Moren, MD Hospital Austral, Buenos Aires, Argentina; Hector Murillo‐Bargas, Western General Hospital Zoquipan, Guadalajara, Mexico; Katarzyna Muzyka‐Placzyńska, MD, Department of Reproductive Health, Centre of Postgraduate Medical Education, Warsaw, Poland; Ksenia Olisova, MD, MPH Department of Medical Research, Taiji Clinic, Taipei, Taiwan; Paulina Pawlicka, PhD, Department of Social Studies, Institute of Psychology, University of Gdansk, Poland; Sofia Juarez Peñalba, MD Hospital Universitario Austral, Argentina; Anabella Lucia Pereyra, MD Hospital Universitario Austral, Argentina; Arbesa Qinami, MD, St. Sophie's Medical Hospital, Żelazna Medical Centre, Warsaw, Poland; Zarely Redondo MD, Dpto. Salud Social. Fetal Medicine Mexico A.C., Tabasco, México; Solrun Rasmussen, Medical Student/Researcher, UiT‐The Arctic University of Norway Tromsø, Norway; Cindy Rocío Sandoval Paz, MD, Department of Obstetrics and Gynecology Hospital Nacional Edgardo Rebagliati Martins, EsSalud, Lima, Perú; Belén Santacruz Martín MD, Hospital Universitario de Torrejón, Madrid, Spain; Simone Schwank, PhD SNSF Fellow, Karolinska Institutet, CLINTEC, Stockholm, Sweden; Florencia Contino Storz, MD Hospital Universitario Austral, Argentina; Urszula Tataj‐Puzyna, PhD, RM Department of Midwifery Centre of Postgraduate Medical Education Warsaw, Poland.
Kajdy A, Sys D, Pokropek A, et al. Risk factors for anxiety and depression among pregnant women during COVID‐19 pandemic—Results of a web‐based multinational cross‐sectional study. Int J Gynecol Obstet. 2022;00:1‐20. doi: 10.1002/ijgo.14388
Contributor Information
Liona C. Poon, Email: liona.poon@cuhk.edu.hk.
Mind‐COVID Collaborative Team:
Urszula Ajdacka, Ewa Andersson, Barbara Baranowska, Grażyna Bączek, Karine Stiberg Birkelund, Katherine Belen Campos Del Castillo, MD Gihad Chalouhi, Chan‐Yu Sung, Ricardo Ciammella, Angeles Cibert, Sabrina Demirdjian, Mariana Esteban, Dagmara Filipecka‐Tyczka, Sergio Freeman‐Rechy, Tetiana Fedyshyn, Orion Gliozheni, Yasmin Hasbini, Veronica Aide Hernandez‐Muñoz, Sarah Homitsky, Hanna Jasiak, Maria Kaźmierczak, Roksana Lewandowska, Yi‐Ying Li, Josefina Maquieira, Radosław Maksym, Virginia Medina‐Jimenez, Jan Modzelewski, Juliana Moren, Hector Murillo‐Bargas, Katarzyna Muzyka‐Placzyńska, Ksenia Olisova, Paulina Pawlicka, Sofia Juarez Peñalba, Anabella Lucia Pereyra, Arbesa Qinami, Zarely Redondo, Solrun Rasmussen, Cindy Rocío Sandoval Paz, Belén Santacruz Martín, Simone Schwank, Florencia Contino Storz, and Urszula Tataj‐Puzyna
DATA AVAILABILITY STATEMENT
Research data are not shared.
REFERENCES
- 1. Palacios Cruz M, Santos E, Velázquez Cervantes MA, León Juárez M. COVID‐19, a worldwide public health emergency. Rev Clin Esp (English Edition). 2021;221(1):55‐61. [DOI] [PMC free article] [PubMed] [Google Scholar]
- 2. Pfefferbaum B, North CS. Mental health and the Covid‐19 pandemic. N Engl J Med. 2020;383(6):510‐512. [DOI] [PubMed] [Google Scholar]
- 3. Kajdy A, Feduniw S, Ajdacka U, et al. Risk factors for anxiety and depression among pregnant women during the COVID‐19 pandemic: a web‐based cross‐sectional survey. Medicine (Baltimore). 2020;99:e21279. [DOI] [PMC free article] [PubMed] [Google Scholar]
- 4. Nanjundaswamy MH, Shiva L, Desai G, et al. COVID‐19‐related anxiety and concerns expressed by pregnant and postpartum women—a survey among obstetricians. Arch Womens Ment Health. 2020;23:787‐790. [DOI] [PMC free article] [PubMed] [Google Scholar]
- 5. Yang R, Mei H, Zheng T, et al. Pregnant women with COVID‐19 and risk of adverse birth outcomes and maternal‐fetal vertical transmission: a population‐based cohort study in Wuhan, China. BMC Med. 2020;18:1‐7. [DOI] [PMC free article] [PubMed] [Google Scholar]
- 6. Aksoy Derya Y, Altiparmak S, AkÇa E, GÖkbulut N, Yilmaz AN. Pregnancy and birth planning during COVID‐19: the effects of tele‐education offered to pregnant women on prenatal distress and pregnancy‐related anxiety. Midwifery. 2021;92:102877. [DOI] [PMC free article] [PubMed] [Google Scholar]
- 7. Chasson M, Taubman ‐ Ben‐Ari O, Abu‐Sharkia S. Jewish and Arab pregnant women's psychological distress during the COVID‐19 pandemic: the contribution of personal resources. Ethn Health. 2021;26:139‐151. [DOI] [PubMed] [Google Scholar]
- 8. Corbett GA, Milne SJ, Hehir MP, Lindow SW, O'connell MP. Health anxiety and behavioural changes of pregnant women during the COVID‐19 pandemic. Eur J Obstet Gynecol Reprod Biol. 2020;249:96‐97. [DOI] [PMC free article] [PubMed] [Google Scholar]
- 9. Lebel C, MacKinnon A, Bagshawe M, Tomfohr‐Madsen L, Giesbrecht G. Elevated depression and anxiety symptoms among pregnant individuals during the COVID‐19 pandemic. J Affect Disord. 2020;277:5‐13. [DOI] [PMC free article] [PubMed] [Google Scholar]
- 10. Salehi L, Rahimzadeh M, Molaei E, Zaheri H, Esmaelzadeh‐Saeieh S. The relationship among fear and anxiety of COVID‐19, pregnancy experience, and mental health disorder in pregnant women: a structural equation model. Brain Behav. 2020;10:e01835. doi: 10.1002/brb3.1835 [DOI] [PMC free article] [PubMed] [Google Scholar]
- 11. Eysenbach G. Improving the quality of web surveys: the checklist for reporting results of internet E‐surveys (CHERRIES). J Med Internet Res. 2004;6:e132. [DOI] [PMC free article] [PubMed] [Google Scholar]
- 12. Harris PA, Taylor R, Minor BL, et al. The REDCap consortium: building an international community of software platform partners. J Biomed Inform. 2019;95:103208. [DOI] [PMC free article] [PubMed] [Google Scholar]
- 13. Spitzer RL, Kroenke K, Williams JBW, Löwe B. A brief measure for assessing generalized anxiety disorder: the GAD‐7. Arch Intern Med. 2006;166:1092‐1097. [DOI] [PubMed] [Google Scholar]
- 14. Spitzer RL, Kroenke K, Williams JB. Validation and utility of a self‐report version of PRIME‐MD: the PHQ primary care study. Primary care evaluation of mental disorders. Patient health questionnaire. JAMA. 1999;282:1737‐1744. [DOI] [PubMed] [Google Scholar]
- 15. World Bank Country and Lending Groups – World Bank Data Help Desk. https://datahelpdesk.worldbank.org/knowledgebase/articles/906519‐world‐bank‐country‐and‐lending‐groups?fbclid=IwAR25p6tE39M3Ao5BjD0bx‐_uUqe‐yWBmTYdh6z_Aq5P5SPwDAA‐uJmRiOho (accessed June 20, 2021).
- 16. Asparouhov T, Muthén B. Multiple‐group factor analysis alignment. Struct Equ Model Multidiscip J. 2014;21:495‐508. [Google Scholar]
- 17. Muthén LK, Muthén BO. Mplus user's guide. Eighth; 2017. [Google Scholar]
- 18. Ahrens A, Hansen CB, Schaffer M. LASSOPACK: Stata module for lasso, square‐root lasso, elastic net, ridge, adaptive lasso estimation and cross‐validation. 2019.
- 19. StataCorp . Stata Statistical Software. StataCorp LLC; 2021. [Google Scholar]
- 20. WHO . Mental health and psychosocial considerations during the COVID‐19 outbreak. https://www.who.int/docs/default‐source/coronaviruse/mental‐health‐considerations.pdf (accessed June 20, 2021).
- 21. Chmielewska B, Barratt I, Townsend R, et al. Effects of the COVID‐19 pandemic on maternal and perinatal outcomes: a systematic review and meta‐analysis. Lancet Glob Health. 2021;9:e759‐e772. [DOI] [PMC free article] [PubMed] [Google Scholar]
- 22. Chivers BR, Garad RM, Boyle JA, Skouteris H, Teede HJ, Harrison CL. Perinatal distress during COVID‐19: thematic analysis of an online parenting forum. J Med Internet Res. 2020;22(9):e22002. doi: 10.2196/22002 [DOI] [PMC free article] [PubMed] [Google Scholar]
- 23. Poon LC, Abramowicz JS, Dall'Asta A, et al. ISUOG safety committee position statement: safe performance of obstetric and gynecological scans and equipment cleaning in the context of COVID‐19. Ultrasound Obstet Gynecol Off J Int Soc Ultrasound Obstet Gynecol. 2020; published online March 23;55:709‐712. doi: 10.1002/uog.22027 [DOI] [PubMed] [Google Scholar]
- 24. RCOG . Coronavirus (COVID‐19) Infection in Pregnancy. 2021. https://www.rcog.org.uk/globalassets/documents/guidelines/2021‐08‐25‐coronavirus‐covid‐19‐infection‐in‐pregnancy‐v14.pdf (accessed June 20, 2021).
- 25. Stampini V, Monzani A, Caristia S, et al. The perception of Italian pregnant women and new mothers about their psychological wellbeing, lifestyle, delivery, and neonatal management experience during the COVID‐19 pandemic lockdown: a web‐based survey. BMC Pregnancy Childbirth. 2021;21:473. [DOI] [PMC free article] [PubMed] [Google Scholar]
- 26. Değirmenci F, Vefikuluçay YD. The relationship between psychosocial health status and social support of pregnant women. J Psychosom Obstet Gynecol. 2020;41:290‐297. [DOI] [PubMed] [Google Scholar]
- 27. Wang D, Li Y‐L, Qiu D, Xiao S‐Y. Factors influencing paternal postpartum depression: a systematic review and meta‐analysis. J Affect Disord. 2021;293:51‐63. [DOI] [PubMed] [Google Scholar]
- 28. Ceulemans M, Foulon V, Ngo E, et al. Mental health status of pregnant and breastfeeding women during the COVID‐19 pandemic—a multinational cross‐sectional study. Acta Obstet Gynecol Scand. 2020;151(1):146‐147. doi: 10.1111/aogs.14092 [DOI] [PMC free article] [PubMed] [Google Scholar]
- 29. Ravaldi C, Wilson A, Ricca V, Homer C, Vannacci A. Pregnant women voice their concerns and birth expectations during the COVID‐19 pandemic in Italy. Women Birth. 2021;34:335‐343. [DOI] [PMC free article] [PubMed] [Google Scholar]
- 30. Jacobson NC, Lekkas D, Price G, et al. Flattening the mental health curve: COVID‐19 stay‐at‐home orders are associated with alterations in mental health search behavior in the United States. JMIR Ment Health. 2020;7:e19347. [DOI] [PMC free article] [PubMed] [Google Scholar]
Associated Data
This section collects any data citations, data availability statements, or supplementary materials included in this article.
Supplementary Materials
Appendix S1 Full survey in English.
Data Availability Statement
Research data are not shared.