

Abstract
Background
While the majority of COVID‐19 patients fully recover from the infection and become asymptomatic, a significant proportion of COVID‐19 survivors experience a broad spectrum of symptoms lasting weeks to months post‐infection, a phenomenon termed “post‐acute sequelae of COVID‐19 (PASC).” The aim of this study is to determine whether inflammatory proteins are dysregulated and can serve as potential biomarkers for systemic inflammation in COVID‐19 survivors.
Methods
We determined the levels of inflammatory proteins in plasma from 22 coronavirus disease 2019 (COVID‐19) long haulers (COV‐LH), 22 COVID‐19 asymptomatic survivors (COV‐AS), and 22 healthy subjects (HS) using an Olink proteomics assay and assessed the results by a beads‐based multiplex immunoassay.
Results
Compared to HS, we found that COVID‐19 survivors still exhibited systemic inflammation, as evidenced by significant changes in the levels of multiple inflammatory proteins in plasma from both COV‐LH and COV‐AS. CXCL10 was the only protein that significantly upregulated in COV‐LH compared with COV‐AS and HS.
Conclusions
Our results indicate that several inflammatory proteins remain aberrantly dysregulated in COVID‐19 survivors and CXCL10 might serve as a potential biomarker to typify COV‐LH. Further characterization of these signature inflammatory molecules might improve the understanding of the long‐term impacts of COVID‐19 and provide new targets for the diagnosis and treatment of COVID‐19 survivors with PASC.
Keywords: biomarkers, COVID‐19, inflammation, long haulers, SARS‐CoV‐2
Abbreviations
- COVID‐19
coronavirus disease 2019
- COV‐LH
COVID‐19 long haulers
- COV‐AS
COVID‐19 asymptomatic survivors
- HS
healthy subjects
- SARS‐CoV‐2
severe acute respiratory syndrome coronavirus 2
- PASC
post‐acute sequelae of COVID‐19
- IL‐6
interleukin 6
- TNF
tumor necrosis factor
- CCL2
CC‐chemokine ligand 2
- CXCL10
CXC‐chemokine ligand 10
- CRP
C‐reactive protein
- PEA
proximity extension assay
- NPX
normalized protein expression
- IgG
immunoglobulin G
- PCA
principal component analysis
- PC1
principal component 1
- CCL23
C‐C motif chemokine 23
- CXCL11
C‐X‐C motif chemokine 11
- OSM
Oncostatin‐M
- STAMBP
STAM‐binding protein
- AXIN1
Axin‐1
- ST1A1
Sulfotransferase 1A1
- SIRT2
SIR2‐like protein 2
- CASP‐8
Caspase‐8
- 4E‐BP1
eukaryotic translation initiation factor 4E‐binding protein 1
- NLRP3
NLR family pyrin domain containing 3
- mTOR
mechanistic target of rapamycin
- ART
antiretroviral therapy
- HEV
hepatitis E virus
1. INTRODUCTION
Severe acute respiratory syndrome coronavirus 2 (SARS‐CoV‐2) infection has caused the ongoing coronavirus disease 2019 (COVID‐19) pandemic. As of June 8, 2022, over 530 million confirmed COVID‐19 cases and over 6 million deaths have been reported worldwide [1]. While the majority of COVID‐19 patients fully recover from the infection and become asymptomatic, a significant proportion of COVID‐19 survivors experience a spectrum of symptoms lasting weeks to months from disease onset, termed “post‐acute sequelae of COVID‐19 (PASC)” [2, 3, 4, 5]. To date, there is not a consensus disease definition for PASC [6]. According to the U.S. CDC, PASC is defined by persistent symptoms and/or long‐term complications beyond 4 weeks from symptom onset. Proposed guidelines from the NICE define PASC as symptoms during or after COVID‐19 infection that continue for more than 12 weeks and are not explained by an alternative diagnosis [7]. Thus far, despite the awareness of the existence of PASC and the rapid and extensive efforts made to study this post‐infection syndrome, the underlying pathogenesis of PASC is still poorly understood.
Emerging data have revealed that inflammatory responses play a pivotal role in COVID‐19 pathogenesis [8]. COVID‐19 patients typically exhibit increased production of inflammatory cytokines/chemokines, such as interleukin 6 (IL‐6), tumor necrosis factor (TNF), CC‐chemokine ligand 2 (CCL2), CXC‐chemokine ligand 10 (CXCL10), and C‐reactive protein (CRP), all of which contribute to hyperinflammatory reactions to SARS‐CoV‐2, leading to a “cytokine storm” that correlates with disease severity and death during the acute stage of viral infection [9, 10]. Notably, inflammatory molecules not only promote disease progression in the early phase of infection but also persist in the plasma of patients after acute infection and may have a long‐term impact on COVID‐19 survivors. An analysis revealed that COVID‐19 survivors had elevated levels of pro‐inflammatory IL‐17A, IL‐12p70, and IL‐1β up to 6 months after the onset of the disease [11]. Another study reported that asymptomatic COVID‐19 patients also exhibited increased serum levels of S100A12, TGF‐α, IL18, and OSM 7–8 months after infection [12]. A recent study in COVID‐19 survivors with PASC symptoms showed the presence of COVID‐19‐related pulmonary lesions 2 months post‐infection that were associated with high levels of systemic inflammatory biomarkers D‐dimer and CRP [13]. While most studies highlighted that the excessive production of inflammatory proteins correlated with tissue/organ damage and death rates during acute SARS‐CoV‐2 infection [14, 15, 16, 17], there are a few more recent publications suggesting that inflammations persist in COVID‐19 survivors [18, 19]. However, whether and which inflammatory proteins are persistently dysregulated in COVID‐19 survivors remain to be determined. We hypothesize that persistently dysregulated inflammatory proteins may be identified in COVID‐19 survivors, including COVID‐19 asymptomatic survivors (COV‐AS) and especially survivors with PASC – termed COVID‐19 long haulers (COV‐LH), and may be used as biomarkers to diagnose and characterize the long‐term impact of SARS‐CoV‐2 infection.
In this report, we performed a pilot study by employing a proteomic array to assess inflammatory proteins present in the plasma from 44 COVID‐19 survivors, including 22 COV‐LH and 22 COV‐AS. Upon comparing with 22 healthy subjects (HS), the levels of eight inflammatory proteins were significantly changed in both COV‐AS and COV‐LH, whereas three additional inflammatory proteins were significantly dysregulated only in COV‐LH. These results provide new insights into the inflammation profiles of COVID‐19 survivors, suggesting that specific inflammatory proteins are dysregulated and can persist in COVID‐19 survivors, and importantly, may lead to improved diagnosis and targeted therapy for patients with PASC.
Significance Statement
While the majority of coronavirus disease 2019 (COVID‐19) patients fully recover from severe acute respiratory syndrome coronavirus 2 (SARS‐CoV‐2) infection and become asymptomatic survivors (COV‐AS), a significant proportion of COVID‐19 survivors experience long‐lasting symptoms ranging from weeks to months after the disease onset, defined as COVID‐19 long haulers (COV‐LH). In this study, we investigated inflammatory proteins in plasma from 22 COV‐LH, 22 COV‐AS, and 22 healthy subjects (HS). We discovered that systemic inflammation persists and has an effect on COVID‐19 survivors, especially in COV‐LH. The dysregulated inflammatory protein identified in this study can potentially serve as a biomarker to support the diagnosis of COV‐LH and warrant further investigation to identify effective therapeutic targets for this devastating infectious disease.
2. MATERIALS AND METHODS
2.1. Study subjects
The study subjects included three groups: 22 COV‐LH, 22 COV‐AS, and 22 HS. All COVID‐19 subjects were diagnosed by a positive nuclear acid test. COV‐AS had recovered from infection without persistent symptoms for at least 2 weeks after the diagnosis. Samples from COV‐LH were collected from patients experiencing symptoms 90 days after the disease onset. Blood samples from HS were obtained from BioIVT (Gray, TN) and were confirmed to be seronegative for SARS‐CoV‐2. All subjects enrolled in this study did not receive any COVID‐19 vaccinations. Plasma was isolated from heparin‐coagulated blood samples by centrifugation at 1000 g for 10 min and immediately frozen at −80°C. The demographic characteristics of the subjects enrolled in this study are shown in Supporting Information Tables S1–S3.
2.2. Detection of SARS‐CoV‐2 specific IgG antibodies and neutralization rates
The SARS‐CoV‐2 S1 IgG ELISA Kit (447807; Biolegend, CA) and SARS‐CoV‐2 Surrogate Virus Neutralization Test kit (L00847; GenScript; NJ) were used to determine the concentration of SARS‐CoV‐2 S1 IgG levels and neutralization rates, respectively, in the plasma of HS and COVID‐19 subjects. The ELISA was performed following the manufactory protocols as previously reported [20].
2.3. Olink proteomics analysis
Levels of inflammatory proteins in plasma were determined by the Olink proteomic platform (Uppsala, Sweden) as previously described [21]. The proximity extension assay (PEA) was used to identify specific proteins as potential biomarkers for individuals with or without PASC. All samples were examined with the Olink Target 96 Inflammation panel, which consists of 92 inflammatory biomarkers. The results for each biomarker are presented as normalized protein expression (NPX) values per Olink Proteomics’ arbitrary unit on a log2 scale and can be further linearized by using the formula 2NPX.
2.4. Beads‐based multiplex immunoassay for protein quantification
A proinflammatory Chemokine panel immunoassay (Biolegend, San Diego, CA) was used to quantify 12 human chemokines, including CCL2, CCL5, CXCL10, CCL11, CCL17, CCL3, CCL4, CXCL9, CCL20, CXCL5, CXCL1, CXCL11, and CXCL8, in plasma from all subjects according to the manufacturer's protocol. The data were acquired on a BD C6 plus flow cytometer and analyzed using LEGENDplex Qognit online software.
2.5. Statistics
The data were analyzed using Prism 9.3 software (GraphPad Software, San Diego, CA) and are presented as mean ± SD or median ± interquartile range. Correlation data was analyzed by Spearman correlation. t‐tests were used to compare means of two independent groups with equal variances; Welch's correction was utilized if unequal variances were found, and nonparametric Mann–Whitney U tests were used to compare two groups with skewed data. Comparisons between three groups were analyzed by one‐way ANOVA or Kruskal–Wallis test after excluding outliers that were identified by the ROUT method (Q = 1.000%), followed by Tukey's or Dunn's multiple comparisons. The heatmap data were analyzed using the online analysis tool Morpheus (available at: https://software.broadinstitute.org/morpheus/).
3. RESULTS
3.1. SARS‐CoV‐2 IgG concentrations in plasma of COVID‐19 survivors
Previous studies reported that the virus‐specific immunoglobulin G (IgG) levels in COVID‐19 patients significantly increased and associated with disease severity during the acute phase of SARS‐CoV‐2 infection [22, 23]. It is unclear, however, if the development of PASC correlates with the levels of IgG in COVID‐19 survivors. To identify potential biomarkers for typifying PASC, we measured SARS‐CoV‐2 IgG concentrations and their neutralization rates in convalescent plasma from COVID‐19 survivors by ELISA. Our results indicated that the log IgG concentrations are positively correlated with the neutralization rates (Figure 1A). However, the antibody levels did not significantly differ between COV‐AS and COV‐LH (Figure 1B). Additionally, we and others have shown that SARS‐CoV‐2‐specific IgG levels declined rapidly after infection [20, 23–25]. To determine the magnitude of the decline in SARS‐CoV‐2‐specific IgG levels in COV‐AS and COV‐LH, we evaluated the durability and relationship between IgG concentrations and time elapsed after PCR diagnosis. We found that IgG concentrations decreased to a substantial level 300 days following COVID‐19 diagnosis; however, we did not observe any correlation between the timing and extent of IgG decline between COV‐AS and COV‐LH (Figure 1C). These results indicate that the presence of PASC in COV‐LH may not be associated with the SARS‐CoV‐2 IgG antibody levels or neutralization rates.
FIGURE 1.
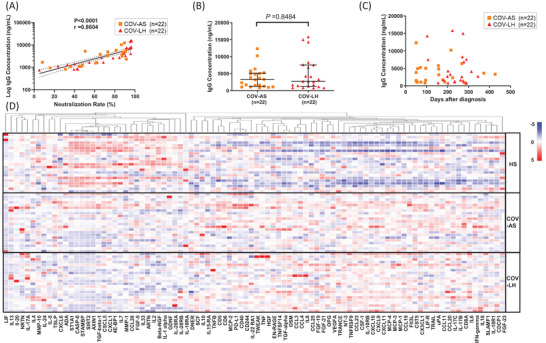
SARS‐CoV‐2 specific IgG concentrations and levels of inflammatory proteins in convalescent plasma from COVID‐19 survivors and HS. (A) The correlation between SARS‐CoV‐2 neutralization rates and log IgG concentrations was determined by Spearman correlation analysis in 22 COV‐AS and 22 COV‐LH. (B) SARS‐CoV‐2 specific IgG concentrations in 22 COV‐AS versus 22 COV‐LH, measured by ELISA. (C) Changes in SARS‐CoV‐2 IgG concentrations after COVID‐19 PCR diagnosis in 22 COV‐AS and 22 COV‐LH. (D) Heatmap showing the levels of 92 inflammatory proteins across 66 samples from HSs, COV‐AS, and COV‐LH, n = 22 per group. Each row represents one subject (y‐axis, right) and each column represents one particular protein (x‐axis, bottom). The alteration of color from red to blue indicates a change from a higher protein level to a lower protein level within one protein assay. COV‐AS, COVID‐19 asymptomatic survivors; COV‐LH, COVID‐19 long haulers; HS, healthy subject; IgG, immunoglobulin G; SARS‐CoV‐2, severe acute respiratory syndrome coronavirus 2
3.2. Profiles of inflammatory proteins in convalescent plasma of COVID‐19 survivors
Because the expression of inflammatory mediators is dysregulated during COVID‐19, we determined the levels of plasma proteins in COVID‐19 survivors using the Olink Target 96 inflammation panel. This antibody‐based multiplex immunoassay is a powerful and reliable tool, enabling faster identification of protein signatures that can be linked to a specific disease condition. Among the 92 inflammatory proteins examined, we detected 75 proteins in convalescent plasma from COVID‐19‐survivors. The proteomic data are shown as a heatmap in Figure 1D, which provides an overview of the abundance of all 92 proteins in our plasma samples. The protein abundance levels are presented as NPX values for a given assay. NPX values were then transformed by subtracting the mean of each protein, dividing by the standard deviation, and used to generate the heatmap with a hierarchical clustering (one minus Pearson correlation) of the protein assays (shown on the top x‐axis). Notably, the heatmap showed a differential expression pattern for several inflammatory proteins among all three study groups, especially between HS and COV groups.
3.3. Identification of inflammatory proteins in convalescent plasma of COV‐AS
To further analyze the proteomic data and to identify potential biomarkers in COV‐AS, we performed a principal component analysis (PCA) to compare the overall plasma protein levels in COV‐AS versus HS. Hereby, principal component 1 (PC1) and PC2 are presented as 28.08% and 15.38% of the 92 NPX variables, shown on the x‐axis versus y‐axis, respectively, in Figure 2A. Each dot represents one subject, which were clustered by the study groups. Remarkably, COV‐AS and HS exhibited two distinct clusters based on the abundance levels of the inflammatory proteins in plasma, indicating a substantial dysregulation of these inflammatory proteins in COV‐AS compared with HS.
FIGURE 2.
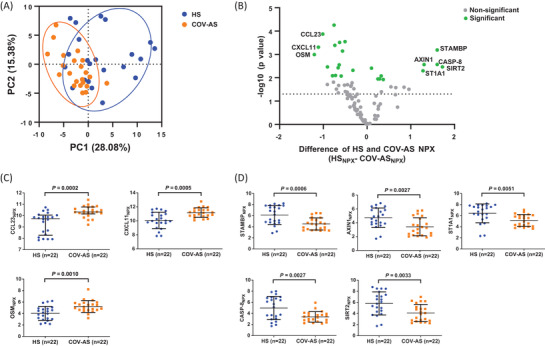
Dysregulated inflammatory proteins in convalescent plasma from COV‐AS. (A) PCA plot of plasma proteins in 22 COV‐AS versus 22 HS. The 44 samples were scatter plotted within two PCs, with PC1 on the x‐axis and PC2 on the y‐axis. A PC score of 28.08% means that 28.08% of variances are explained by PC1, which accounts for the majority of the variance in the original data; whereas 15.38% of variances are explained by PC2, which accounts for the second highest amount of variance in the NPX values. Each dot represents one subject, with orange color representing COV‐AS and blue color representing HS. All 92 assays from the Olink Target 96 Inflammation panel were used in the PCA analysis. Circles indicate the two clusters of subjects from COV‐AS and HS. (B) Volcano plot depicting 25 out of 92 proteins that displayed statistically significant differences in NPX values between COV‐AS and HS. Each dot represents one particular protein, with green color representing the statistically significant difference in adjusted p values and gray color representing non‐significant difference. The y‐axis shows log10 (p‐value), and the x‐axis shows the difference in NPX value between HS versus COV‐AS (HSNPX – COV‐ASNPX). The dotted line indicates a cut off p‐value (p = 0.05). Protein with greater than two‐fold changes (either upregulated or downregulated) in abundance levels are listed in the volcano plot. (C, D) Summary results of NPX for the upregulated (C) and downregulated proteins (D) in plasma from 22 COV‐AS versus 22 HS. Statistically significant p‐values are shown. COV‐AS, COVID‐19 asymptomatic survivors; HS, healthy subject; NPX, normalized protein expression; PC, principal component; PCA, principal component analysis
To determine which specific proteins are dysregulated in COV‐AS, we performed multiple t‐tests, followed by adjustments using the Benjamini–Hochberg method via the online Olink Insights Stat Analysis tool. A volcano plot showing the differential protein abundance in COV‐AS versus HS is presented in Figure 2B. Among the 92 inflammatory proteins analyzed, 25 proteins (green dots) showed statistically significant differences (for adjusted p‐value) in COV‐AS versus HS (see Supporting Information Table S4). The analysis revealed eight plasma proteins that were significantly altered with greater than two‐fold changes in COV‐AS versus HS (Figure 2C, D). Specifically, the C‐C motif chemokine 23 (CCL23), C‐X‐C motif chemokine 11 (CXCL11), and Oncostatin‐M (OSM) were significantly upregulated; whereas STAM‐binding protein (STAMBP), Axin‐1(AXIN1), Sulfotransferase 1A1 (ST1A1), Caspase‐8 (CASP‐8), and SIR2‐like protein 2 (SIRT2) were significantly downregulated in COV‐AS compared with HS.
3.4. Identification of inflammatory proteins in convalescent plasma of COV‐LH
To further analyze the inflammatory proteins that were differentially expressed in COV‐LH, we performed PCA for all proteins detected and compared their NPX values between COV‐LH and HS. As shown in Figure 3A, COV‐LH and HS showed two distinct clusters, indicating a substantial dysregulation of inflammatory proteins in COV‐LH. A volcano plot (Figure 3B) shows the proteins that displayed statistically significant (green dots) and non‐significant changes (gray dots) in COV‐LH versus HS. Among the 92 inflammatory proteins analyzed, 43 proteins were either significantly increased or decreased in COV‐LH compared with HS (see Supporting InformationTable S5). Figure 3C, D show the plasma proteins with statistical differences and greater than two‐fold changes between COV‐LH and HS. Notably, the abundance levels of CXCL10, CXCL11, CCL23, OSM, and CCL20 were upregulated (Figure 3C); whereas STAMBP, AXIN1, CASP‐8, SIRT2, ST1A1, and eukaryotic translation initiation factor 4E‐binding protein 1 (4E‐BP1) levels were downregulated in COV‐LH (Figure 3D). We found that the eight plasma proteins that were dysregulated in COV‐AS (Figure 2) were also altered in COV‐LH. Importantly, three additional proteins (including upregulated CXCL10 and CCL20, and downregulated 4E‐BP1) were solely dysregulated in COV‐LH, but not COV‐AS, compared with HS, suggesting an increased inflammatory state in COV‐LH and that these three inflammatory proteins might serve as potential biomarkers for COV‐LH.
FIGURE 3.
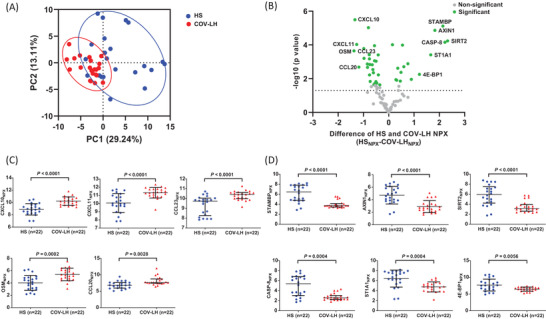
Dysregulated inflammatory proteins in convalescent plasma from COV‐LH. (A) PCA plot of plasma proteins in COV‐LH versus 22 HS. A total of 44 samples were scatter plotted within the two PCs, with PC1 on the x‐axis and PC2 on the y‐axis. Approximately 29.24% of variances were accounted for by PC1, and 13.11% of variances were explained by PC2. Each dot represents one subject, with red color representing COV‐LH and blue color representing HS. Circles indicate the data distribution in PC1 versus PC2 from two clusters of subjects (COV‐LH versus HS). (B) A volcano plot depicting the 43 out of 92 proteins that displayed statistically significant differences in adjusted p‐values between COV‐LH and HS. Each dot represents one particular protein, with green color representing statistically significant differences and gray color representing the non‐significant differences. The y‐axis shows the log10 (p‐value), and the x‐axis shows the difference in NPX value between HS versus COV‐LH (HSNPX – COV‐LHNPX). The dotted line indicates a cut off p‐value (p = 0.05). Proteins with more than two‐fold changes in abundance levels are listed. (C, D) Summary results of NPX for the upregulated (C) and downregulated proteins (D) in plasma from 22 COV‐LH versus 22 HS. Statistically significant p‐values are shown. COV‐LH, COVID‐19 long haulers; HS, healthy subject; NPX, normalized protein expression; PC, principal component; PCA, principal component analysis
3.5. CXCL10 is a unique biomarker for COV‐LH
To determine whether dysregulations of the above three proteins (CXCL10, CCL20, and 4E‐BP1) are unique to COV‐LH, we further analyzed the abundance levels of these three proteins by calculating the 2NPX value, which positively correlates with the protein level in a linearized manner. As shown in Figure 4A–C, while all three inflammatory proteins displayed significant differences among all three groups, only CXCL10 showed a significant increase in COV‐LH compared with COV‐AS and HS. To assess the results obtained by the Olink proteomics analysis, we employed a beads‐based multiplex immunoassay to quantify those dysregulated pro‐inflammatory proteins, including CXCL10. As shown in Figure 4D, the levels of CXCL10 were significantly upregulated in COV‐LH versus COV‐AS, similar to the results illustrated in Figure 4A. Of note, our results indicated that CXCL10 concentrations were positively correlated with the linear NPX values (Figure 4E), which indicate that this beads‐based multiplex immunoassay can reliably confirm the validity of the Olink proteomics platform. Taken together, these results demonstrate that CXCL10 protein is persistently elevated in COV‐LH and that this inflammatory protein may serve as a potential biomarker to identify COV‐LH.
FIGURE 4.
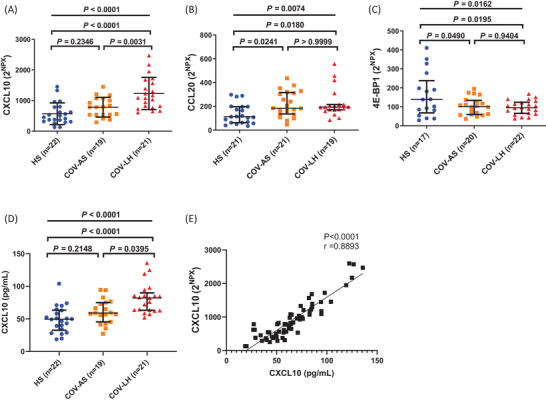
Identification of three inflammatory proteins differentially expressed in HS, COV‐AS, and COV‐LH. (A–C) Summary results of 2NPX for CXCL10, CCL20, and 4E‐BP1 protein levels in all three subject groups. (D) Concentrations of CXCL10 (pg/mL) amongst the three subject groups. Statistical differences among three groups were determined by one‐way ANOVA (data with normal distribution) or the Kruskal–Wallis test (data with non‐normal distribution), presented as an overall p‐value at the top. Differences between two groups were determined by Tukey's multiple comparisons test (A and C) or Dunn's multiple comparisons test (B and D), and p‐values are shown on top. (E) The correlation between CXCL10 concentrations and 2NPX of CXCL10 was determined by Spearman correlation analysis in 21 COV‐AS, 21 COV‐LH, and 22 HSs. Each dot represents one subject. All outliers were identified by the ROUT method (Q = 1.000 %) and excluded from the analysis. ANOVA, analysis of variance; COV‐AS, COVID‐19 asymptomatic survivors; COV‐LH, COVID‐19 long haulers; HS, healthy subject; NPX, normalized protein expression
4. DISCUSSION
The ongoing pandemic of COVID‐19 poses tremendous challenges to public health and medical communities and is worsened by the large portion of COV‐LH who experience long‐term PASC symptoms, posing a huge social/economic burden to our society. Currently, there are no specific diagnostics or treatments available for COVID‐19 survivors with PASC, the diagnosis of COV‐LH relies on patient complaints, which are quite subjective by nature, and current treatments are mainly focused on symptom relief or supportive care, but lack a mechanism‐driven, molecular‐targeting therapy. Thus, identification of biomarkers that can be objectively measured to support specific diagnosis or targeted for therapeutic intervention may provide additional insight into the pathogenesis and management of PASC.
In this pilot study, we employed an Olink multiplex immunoassay with qPCR readout to detect inflammatory biomarkers in convalescent plasma of COVID‐19 survivors [26]. Subjects enrolled in this study included 22 HS and 44 COVID‐19 survivors (22 COV‐AS and 22 COV‐LH), all of which were unvaccinated, considering that vaccination would affect the subject's inflammatory status. COV‐AS were collected at least 2 weeks after the diagnosis while COV‐LH were collected at least 90 days after the disease onset. We found that COVID‐19 survivors exhibited several significantly dysregulated inflammatory proteins signature in their peripheral blood. Specifically, we identified eight inflammatory proteins that were dramatically changed in convalescent plasma from both COV‐AS and COV‐LH compared with HS. Importantly, three additional inflammatory proteins (CXCL10, CCL20, and 4E‐BP1) were only dysregulated in COV‐LH versus HS, and only one unique protein (CXCL10) was solely upregulated in COV‐LH compared with COV‐AS and HS. The potential inflammatory biomarkers we identified in this study could provide an objective readout for the clinical diagnosis of PASC or COV‐LH and may serve as potential therapeutic targets.
In our study, the levels of CCL23, CXCL11, and OSM were significantly increased in both COV‐AS and COV‐LH compared with HS. CCL23 is a chemokine that promotes the migration of immune cells (monocytes, dendritic cells, and lymphocytes) to inflammatory sites. A previous study revealed that a high level of CCL23 is associated with a poor outcome in COVID‐19 patients [27]. Our results showed that CCL23 plasma levels were persistently elevated in both COV‐AS and COV‐LH versus HS, indicating systemic inflammation in all COVID‐19 survivors. CXCL11 is a chemokine‐induced by IFN‐γ through the receptor CXCR3. Interestingly, we found a significant increase in CXCL11 but observed a non‐significant increase in IFN‐γ (data not shown) in both COV‐AS and COV‐LH compared to HS. Consistent with our findings, CXCL11 transcripts/proteins were found to be increased in lung epithelial cells [28], lung adenocarcinoma cells [29], bronchoalveolar lavage [30], and plasma [31] in COVID‐19 patients. OSM is a positive regulator of IL‐6 and its level was observed to be elevated in moderate to severe COVID‐19 patients compared to those with mild pulmonary inflammation [32]; OSM serum levels are also elevated in acutely‐infected, asymptomatic COVID‐19 patients [12]. We observed a significant increase in OSM and a non‐significant increase in IL‐6 expression in both COV‐AS and COV‐LH versus HS, suggesting the persistence of inflammation in all COVID‐19 survivors.
Notably, several proteins that can produce an inflammatory milieu (STAMBP, AXIN1, ST1A1, CASP‐8, and SIRT2) were significantly decreased. For example, our finding that STAMBP plasma abundance is reduced in COVID‐19 survivors is supported by a previous study showing that STAMBP knockout increases the expression of many pro‐inflammatory cytokines via IL‐1β signaling [33]. Similarly, AXIN1 acts as a repressor of the Wnt signaling pathway, which is involved in cell proliferation. A negative correlation between AXIN1 and inflammatory markers in patients with endometriosis has been reported [34]. We found lower AXIN1 levels in COVID‐19 survivors, possibly contributing to the inflammatory state post‐SARS‐CoV‐2 infection. ST1A1 is a sulfotransferase whose expression strongly correlates with the AXIN1 level [35]. Our data showing relatively low AXIN1 and ST1A1 levels support these proteins as potential inflammatory biomarkers in COVID‐19 survivors. CASP‐8 is a critical molecule involved in cell apoptosis. In addition to regulating cell death, CASP‐8 regulates inflammation by modulating the NLR family pyrin domain containing 3 (NLRP3) inflammasome, thus playing an important role in the inflammatory process [36]. Our results indicate that the expression of CASP‐8 is decreased in both COV‐AS and COV‐LH, supporting the negative effect of CASP‐8 in regulating inflammation. SIRT2 is a protein deacetylase that plays a key role in multiple inflammatory pathways. Lastly, a recent study demonstrated that aged mice deficient in SIRT2 have accelerated inflammaging, resulting from reduced SIRT2‐mediated deacetylation of NLRP3 to activate the NLRP3 inflammasome [37]. Thus, the decrease in the SIRT2 level in COVID‐19 survivors may be related to their inflammatory status. Taken together, our findings suggest that the differential expression of these inflammatory proteins may contribute to persistent inflammation in COVID‐19 survivors, including both COV‐AS and COV‐LH.
Additionally, direct analysis of the NPX value showed that they only were three inflammatory proteins (CXCL10, CCL20, and 4E‐BP1) were changed in COV‐LH, but not in COV‐AS, compared with HS. However, when we analyzed the difference among three groups with linear NPX values, both CCL20 and 4E‐BP1 showed significant differences between COV‐AS and HS. The discrepancy may be caused by the use of different statistical analyses and a small cohort of samples in this pilot study. Specifically, the 4E‐BP1 protein is a translational repressor and acts as a substrate of the mechanistic target of the rapamycin (mTOR) pathway [38]. We observed a decrease in 4E‐BP1 levels in COVID‐19 survivors, suggesting that it might be involved in the persistent inflammation post COVID‐19 via mTOR activation. Both CXCL10 and CCL20 are inflammatory chemokines that can be upregulated during inflammation. Previous studies demonstrated that CXCL10 and CCL20 were elevated in SARS‐CoV‐2‐infected patients [39], and macrophages from critical patients expressed higher levels of both chemokines [40]. Of note, CXCL10 was the only protein that significantly upregulated in COV‐LH compared with COV‐AS and HS. Of note, CXCL10 upregulation was validated by a beads‐based multiplex immunoassay. CXCL10 is a chemokine that can be upregulated by IFN‐γ, shares the CXCR3 receptor with CXCL9 and CXCL11, and plays a crucial role in COVID‐19 pathogenesis [28]. Elevated serum levels of CXCL10 have been consistently observed in COVID‐19 patients and positively correlate with disease severity and mortality rate, indicating that CXCL10 might be used as a robust predictor of COVID‐19 outcome [28, 41–44]. Our study further supports that CXCL10 could be used as a potential biomarker for typifying the long‐term effects of SARS‐COV‐2 infection and a signature for PASC in COVID‐19 survivors.
Notably, sustained dysregulation of these inflammatory proteins is not unique to SARS‐CoV‐2 infection. For example, the diverse role of CXCL10 has been reported in other infectious diseases including but not limited to viral (hepatitis B and C, and HIV) and bacterial infections [45]. Similar to the results observed in this study, plasma levels of CXCL10 are also upregulated during HIV infection [46]. Moreover, CXCL10 levels remained aberrantly high and negatively correlated with CD4 T cell count in HIV controllers who achieved long‐term control of viremia without antiretroviral therapy (ART) [47]. A previous study has shown that pre‐infection levels of CXCL10 are associated with rapid disease onset and progression upon HIV‐1 infection [48]. Thus, the elevated CXCL10 levels in COV‐LH might lead to increased risks of accelerated disease progression upon primary HIV infection. In addition to CXCL10, CXCL11 levels were shown to be significantly elevated and positively correlate with bacterial burdens in pulmonary tuberculosis patients with bilateral or cavitary disease [49]. The level of CCL20 was detected at a significantly higher level in lung transplant recipients with cytomegalovirus replication in the allograft [50]. AXIN1 was reported to be reduced by Salmonella colonization in intestinal epithelial cells, which has a preventive effect at the early stage of infection [51]. It was reported that the antiviral effect of mTOR is via the downstream 4E‐BP1, as evidenced by significantly increased hepatitis E virus (HEV) replication in HuH7 cells following 4E‐BP1 knockdown [52]. Taken together, the sustained dysregulation of proinflammatory proteins in COVID‐19 survivors reported herein are not unique given that similar alterations of these proteins were reported in numerous other infectious diseases. Unanswered questions remain whether shared or distinct mechanisms drive the dysregulation of these inflammatory proteins and whether these proteins contribute to the systemic inflammation and immune dysregulation observed in different disease conditions.
Our study has some limitations that should be addressed in future studies. First, we investigated only biomarkers related to inflammation. The quantification analysis using the Olink multiplex immunoassay was limited to 92 proteins within the Target 96 inflammation panel. Other protein array panels that include proteins related to immune response, metabolism, and organ damage should be studied to screen for additional biomarkers in our samples. Second, although our patient cohorts are well‐characterized and the study is properly powered, the sample sizes used in this study were relatively small, and thus our findings need to be further validated in a larger cohort of samples with a broader range of patient demographic characteristics, including age, sex, race, time post‐infection, specific PASC symptoms, and co‐morbidities. Of note, the sampling days (the time from COVID‐19 diagnoses to sample collection) were significantly extended in COV‐LH group. Although we did not observe any differences in CXCL‐10 levels in COV‐AS samples collected before or after 100 days following the diagnosis (data not shown), it is possible that more pronounced differences in other inflammatory proteins exist between COV‐AS and COV‐LH, if the time from disease onset to sampling dates remain similar. To validate these data as well as the detection methods used, the same samples were used for both the Olink proteomics assay and beads‐based immunoassays. Additional independent samples should be used to further validate the results presented in this pilot study. Finally, in addition to the beads‐based immunoassay, other immunological and biochemical multiplex assays, including ELISA, could be used to further validate these results for biomarker discovery.
In this pilot study, we investigated the expression levels of inflammatory proteins in COVID‐19 survivors that can be used to differentiate between COV‐AS and COV‐LH and thus helps improve the understanding of the long‐term impact of SARS‐CoV‐2 infection. The results demonstrated that multiple inflammatory proteins are persistently dysregulated in COVID‐19 survivors, with an additional inflammatory protein CXCL10 identified in COV‐LH, suggesting that systemic inflammation persists and could be one of the driving forces that cause the residual symptoms presented in COVID‐19 survivors with PASC. The potential inflammatory biomarker identified in this study can support the diagnosis of PASC and warrant further investigation to identify effective therapeutic targets for this devastating infectious disease.
AUTHOR CONTRIBUTIONS
Juan Zhao performed most of the experiments and wrote the manuscript. Madison Schank, Ling Wang, Xindi Dang, Dechao Cao, Sushant Khanal, Lam N.T. Nguyen, Yi Zhang, Xiao Y. Wu, James L. Adkins, Benjamin J. Pelton, and Jinyu Zhang collected patients’ samples and performed some of the analysis. Ling Wang, Shunbin Ning, Mohamed El Gazzar, and Jonathan P. Moorman provided intellectual input, interpreted the results, and edited the manuscript. Zhi Q. Yao supervised the research and revised the manuscript, with the help of all other authors.
CONFLICT OF INTEREST
The authors have no conflicts of interest to declare.
Supporting information
Supporting Information
ACKNOWLEDGMENTS
This publication is the result of work supported with resources and the use of facilities at the James H. Quillen Veterans Affairs Medical Center. The contents in this publication do not represent the views of the Department of Veterans Affairs or the United States Government. This work was supported by National Institutes of Health grants R15AG076370 (to J.Z.); R21AI157909 and R15AG069544 (to Z.Q.Y.); VA Merit Review Awards 1I01BX004281 (to Z.Q.Y.) and 5I01BX005428 (to J.P.M.); DoD Award PR170067 (to Z.Q.Y.), and American Diabetes Award 7‐20‐COVID‐149 (to Z.Q.Y.).
Zhao, J. , Schank, M. , Wang, L. , Dang, X. , Cao, D. , Khanal, S. , Nguyen, L. N. T. , Zhang, Y. , Wu, X. Y. , Adkins, J. L. , Pelton, B. J. , Zhang, J. , Ning, S. , Gazzar, M. E. , Moorman, J. P. , & Yao, Z. Q. (2022). Plasma biomarkers for systemic inflammation in COVID‐19 survivors. PROTEOMICS – Clinical Applications, 16, e2200031. 10.1002/prca.202200031
Contributor Information
Juan Zhao, Email: zhaoj2@etsu.edu, Email: yao@etsu.edu.
Zhi Q. Yao, Email: yao@etsu.edu.
DATA AVAILABILITY STATEMENT
The datasets generated and analyzed during this study are available from the corresponding author upon reasonable request. The data sharing policies will be followed per the NIH and VA guidelines.
REFERENCES
- 1. World Health Organization . (2022). Coronavirus disease (COVID‐2019) situation reports. Retrieved June 8, 2022, from https://www.who.int/emergencies/diseases/novel‐coronavirus‐2019/situation‐reports
- 2. Al‐Aly, Z. , Xie, Y. , & Bowe, B. (2021). High‐dimensional characterization of post‐acute sequelae of COVID‐19. Nature, 594(7862), 259–264. 10.1038/s41586-021-03553-9 [DOI] [PubMed] [Google Scholar]
- 3. The, L. (2020). Facing up to long COVID. Lancet, 396(10266), 1861. 10.1016/S0140-6736(20)32662-3 [DOI] [PMC free article] [PubMed] [Google Scholar]
- 4. Meeting the challenge of long COVID. Nature Medicine, 26(12), 1803–1803. 10.1038/s41591-020-01177-6 [DOI] [PubMed] [Google Scholar]
- 5. Taquet, M. , Dercon, Q. , Luciano, S. , Geddes, J. R. , Husain, M. , & Harrison, P. J. (2021). Incidence, co‐occurrence, and evolution of long‐COVID features: A 6‐month retrospective cohort study of 273,618 survivors of COVID‐19. PLoS Medicine, 18(9), e1003773. 10.1371/journal.pmed.1003773 [DOI] [PMC free article] [PubMed] [Google Scholar]
- 6. Mehandru, S. , & Merad, M. (2022). Pathological sequelae of long‐haul COVID. Nature Immunology, 23(2), 194–202. 10.1038/s41590-021-01104-y [DOI] [PMC free article] [PubMed] [Google Scholar]
- 7. COVID‐19 rapid guideline: Managing the long‐term effects of COVID‐19 . London: National Institute for Health and Care Excellence (NICE); (2020) https://www.ncbi.nlm.nih.gov/books/NBK567261/ [PubMed]
- 8. Merad, M. , & Martin, J. C. (2020). Pathological inflammation in patients with COVID‐19: A key role for monocytes and macrophages. Nature Reviews Immunology, 20(6), 355–362. 10.1038/s41577-020-0331-4 [DOI] [PMC free article] [PubMed] [Google Scholar]
- 9. Ali, N. (2020). Elevated level of C‐reactive protein may be an early marker to predict risk for severity of COVID‐19. Journal of Medical Virology, 92(11), 2409–2411. 10.1002/jmv.26097 [DOI] [PMC free article] [PubMed] [Google Scholar]
- 10. Del Valle, D. M. , Kim‐Schulze, S. , Huang, H.‐H. , Beckmann, N. D. , Nirenberg, S. , Wang, B. , Lavin, Y. , Swartz, T. H. , Madduri, D. , Stock, A. , Marron, T. U. , Xie, H. , Patel, M. , Tuballes, K. , Van Oekelen, O. , Rahman, A. , Kovatch, P. , Aberg, J. A. , Schadt, E. , … Gnjatic, S. (2020). An inflammatory cytokine signature predicts COVID‐19 severity and survival. Nature Medicine, 26(10), 1636–1643. 10.1038/s41591-020-1051-9 [DOI] [PMC free article] [PubMed] [Google Scholar]
- 11. Ong, S. W. X. , Fong, S. W. , Young, B. E. , Chan, Y.‐H. , Lee, B. , Amrun, S. N. , Chee, R. S. L. , Yeo, N. K.‐W. , Tambyah, P. , Pada, S. , Tan, S. Y. , Ding, Y. , Renia, L. , Leo, Y.‐S. , Ng, L. F. P. , & Lye, D. C. (2021). Persistent symptoms and association with inflammatory cytokine signatures in recovered Coronavirus disease 2019 patients. Open Forum Infectious Diseases, 8(6), ofab156. 10.1093/ofid/ofab156 [DOI] [PMC free article] [PubMed] [Google Scholar]
- 12. Tserel, L. , Jõgi, P. , Naaber, P. , Maslovskaja, J. , Häling, A. , Salumets, A. , Zusinaite, E. , Soeorg, H. , Lättekivi, F. , Ingerainen, D. , Soots, M. , Toompere, K. , Kaarna, K. , Kisand, K. , Lutsar, I. , & Peterson, P. (2021). Long‐term elevated inflammatory protein levels in asymptomatic SARS‐CoV‐2 infected individuals. Frontiers in Immunology, 12, 709759. 10.3389/fimmu.2021.709759 [DOI] [PMC free article] [PubMed] [Google Scholar]
- 13. Mandal, S. , Barnett, J. , Brill, S. E. , Brown, J. S. , Denneny, E. K. , Hare, S. S. , Heightman, M. , Hillman, T. E. , Jacob, J. , Jarvis, H. C. , Lipman, M. C. I. , Naidu, S. B. , Nair, A. , Porter, J. C. , Tomlinson, G. S. , & Hurst, J. R. (2021). ‘Long‐COVID’: A cross‐sectional study of persisting symptoms, biomarker and imaging abnormalities following hospitalisation for COVID‐19. Thorax, 76(4), 396–398. 10.1136/thoraxjnl-2020-215818 [DOI] [PMC free article] [PubMed] [Google Scholar]
- 14. Perpiñan, C. , Bertran, L. , Terra, X. , Aguilar, C. , Lopez‐Dupla, M. , Alibalic, A. , Riesco, D. , Camaron, J. , Perrone, F. , Rull, A. , Reverté, L. , Yeregui, E. , Marti, A. , Vidal, F. , & Auguet, T. (2021). Predictive biomarkers of COVID‐19 severity in SARS‐CoV‐2 infected patients with obesity and metabolic syndrome. Journal of Personalized Medicine, 11(3), 227. 10.3390/jpm11030227 [DOI] [PMC free article] [PubMed] [Google Scholar]
- 15. Kimura, Y. , Nakai, Y. , Shin, J. , Hara, M. , Takeda, Y. , Kubo, S. , Jeremiah, S. S. , Ino, Y. , Akiyama, T. , Moriyama, K. , Sakai, K. , Saji, R. , Nishii, M. , Kitamura, H. , Murohashi, K. , Yamamoto, K. , Kaneko, T. , Takeuchi, I. , Hagiwara, E. , … Ryo, A. (2021). Identification of serum prognostic biomarkers of severe COVID‐19 using a quantitative proteomic approach. Scientific Reports, 11(1), 20638. 10.1038/s41598-021-98253-9 [DOI] [PMC free article] [PubMed] [Google Scholar]
- 16. Melo, A. K. G. , Milby, K. M. , Caparroz, A. L. M. A. , Pinto, A. C. P. N. , Santos, R. R. P. , Rocha, A. P. , Ferreira, G. A. , Souza, V. A. , Valadares, L. D. A. , Vieira, R. M. R. A. , Pileggi, G. S. , & Trevisani, V. F. M. (2021). Biomarkers of cytokine storm as red flags for severe and fatal COVID‐19 cases: A living systematic review and meta‐analysis. PLoS ONE, 16(6), e0253894. 10.1371/journal.pone.0253894 [DOI] [PMC free article] [PubMed] [Google Scholar]
- 17. Völlmy, F. , Van Den Toorn, H. , Zenezini Chiozzi, R. , Zucchetti, O. , Papi, A. , Volta, C. A. , Marracino, L. , Vieceli Dalla Sega, F. , Fortini, F. , Demichev, V. , Tober‐Lau, P. , Campo, G. , Contoli, M. , Ralser, M. , Kurth, F. , Spadaro, S. , Rizzo, P. , & Heck Jr, A. (2021). A serum proteome signature to predict mortality in severe COVID‐19 patients. Life Science Alliance, 4(9), e202101099. 10.26508/lsa.202101099 [DOI] [PMC free article] [PubMed] [Google Scholar]
- 18. Zhou, M. , Yin, Z. , Xu, J. , Wang, S. , Liao, T. , Wang, K. , Li, Y. , Yang, F. , Wang, Z. , Yang, G. , Zhang, J. , & Jin, Y. (2021). Inflammatory profiles and clinical features of Coronavirus 2019 survivors 3 months after discharge in Wuhan, China. Journal of Infectious Diseases, 224(9), 1473–1488. 10.1093/infdis/jiab181 [DOI] [PMC free article] [PubMed] [Google Scholar]
- 19. Mohammed, Y. , Goodlett, D. R. , Cheng, M. P. , Vinh, D. C. , Lee, T. C. , Mcgeer, A. , Sweet, D. , Tran, K. , Lee, T. , Murthy, S. , Boyd, J. H. , Singer, J. , Walley, K. R. , Patrick, D. M. , Quan, C. , Ismail, S. , Amar, L. , Pal, A. , Bassawon, R. , … ARBs CORONA I . (2022). Longitudinal plasma proteomics analysis reveals novel candidate biomarkers in acute COVID‐19. Journal of Proteome Research, 975–992. 10.1021/acs.jproteome.1c00863 [DOI] [PubMed] [Google Scholar]
- 20. Zhao, J. , Wang, L. , Schank, M. , Dang, X. , Lu, Z. , Cao, D. , Khanal, S. , Nguyen, L. N. , Nguyen, L. N. T. , Zhang, J. , Zhang, Y. I. , Adkins, J. L. , Baird, E. M. , Wu, X. Y. , Ning, S. , Gazzar, M. E. L. , Moorman, J. P. , & Yao, Z. Q. (2021). SARS‐CoV‐2 specific memory T cell epitopes identified in COVID‐19‐recovered subjects. Virus Research, 304, 198508. 10.1016/j.virusres.2021.198508 [DOI] [PMC free article] [PubMed] [Google Scholar]
- 21. Assarsson, E. , Lundberg, M. , Holmquist, G. , Björkesten, J. , Bucht Thorsen, S. , Ekman, D. , Eriksson, A. , Rennel Dickens, E. , Ohlsson, S. , Edfeldt, G. , Andersson, A.‐C. , Lindstedt, P. , Stenvang, J. , Gullberg, M. , & Fredriksson, S. (2014). Homogenous 96‐plex PEA immunoassay exhibiting high sensitivity, specificity, and excellent scalability. PLoS ONE, 9(4), e95192. 10.1371/journal.pone.0095192 [DOI] [PMC free article] [PubMed] [Google Scholar]
- 22. Ye, X. , Angelo, L. S. , Nicholson, E. G. , Iwuchukwu, O. P. , Cabral De Rezende, W. , Rajan, A. , Aideyan, L. O. , Mcbride, T. J. , Bond, N. , Santarcangelo, P. , Rayford, Y. J. , Ferlic‐Stark, L. , Fragoso, S. , Momin, Z. , Liu, H. , Truong, K. , Lopez, B. , Conner, M. E. , Rice, A. P. , … Piedra, P. A. (2021). Serum IgG anti‐SARS‐CoV‐2 binding antibody level is strongly associated with IgA and functional antibody levels in adults infected with SARS‐CoV‐2. Frontiers in Immunology, 12, 693462. 10.3389/fimmu.2021.693462 [DOI] [PMC free article] [PubMed] [Google Scholar]
- 23. Haveri, A. , Ekström, N. , Solastie, A. , Virta, C. , Österlund, P. , Isosaari, E. , Nohynek, H. , Palmu, A. A. , & Melin, M. (2021). Persistence of neutralizing antibodies a year after SARS‐CoV‐2 infection in humans. European Journal of Immunology, 3202–3213. 10.1002/eji.202149535 [DOI] [PMC free article] [PubMed] [Google Scholar]
- 24. Schiffner, J. , Backhaus, I. , Rimmele, J. , Schulz, S. , Möhlenkamp, T. , Klemens, J. M. , Zapf, D. , Solbach, W. , & Mischnik, A. (2021). Long‐term course of humoral and cellular immune responses in outpatients after SARS‐CoV‐2 infection. Front Public Health, 9, 732787. 10.3389/fpubh.2021.732787 [DOI] [PMC free article] [PubMed] [Google Scholar]
- 25. Zhao, J. , Wang, L. , Schank, M. , Dang, X. , Lu, Z. , Cao, D. , Khanal, S. , Nguyen, L. N. , Nguyen, L. N. T. , Zhang, J. , Zhang, Y. , Adkins, J. L. , Baird, E. M. , Wu, X. Y. , Ning, S. , Gazzar, M. E. , Moorman, J. P. , & Yao, Z. Q. (2021). SARS‐CoV‐2 specific memory T cell epitopes identified in COVID‐19‐recovered subjects. Virus Research, 304, 198508. 10.1016/j.virusres.2021.198508 [DOI] [PMC free article] [PubMed] [Google Scholar]
- 26. Petrera, A. , Von Toerne, C. , Behler, J. , Huth, C. , Thorand, B. , Hilgendorff, A. , & Hauck, S. M. (2021). Multiplatform approach for plasma proteomics: Complementarity of Olink proximity extension assay technology to mass spectrometry‐based protein profiling. Journal of Proteome Research, 20(1), 751–762. 10.1021/acs.jproteome.0c00641 [DOI] [PubMed] [Google Scholar]
- 27. Dekay, J. T. , Emery, I. F. , Rud, J. , Eldridge, A. , Lord, C. , Gagnon, D. J. , May, T. L. , Herrera, V. L. M. , Ruiz‐Opazo, N. , Riker, R. R. , Sawyer, D. B. , Ryzhov, S. , & Seder, D. B. (2021). DEspRhigh neutrophils are associated with critical illness in COVID‐19. Scientific Reports, 11(1), 22463. 10.1038/s41598-021-01943-7 [DOI] [PMC free article] [PubMed] [Google Scholar]
- 28. Callahan, V. , Hawks, S. , Crawford, M. A. , Lehman, C. W. , Morrison, H. A. , Ivester, H. M. , Akhrymuk, I. , Boghdeh, N. , Flor, R. , Finkielstein, C. V. , Allen, I. C. , Weger‐Lucarelli, J. , Duggal, N. , Hughes, M. A. , & Kehn‐Hall, K. (2021). The pro‐inflammatory chemokines CXCL9, CXCL10 and CXCL11 are upregulated following SARS‐CoV‐2 infection in an AKT‐dependent manner. Viruses, 3(6), 1062. 10.3390/v13061062 [DOI] [PMC free article] [PubMed] [Google Scholar]
- 29. Cheng, L.‐C. , Kao, T. J. , Phan, N. N. , Chiao, C. C. , Yen, M. C. , Chen, C.‐F. , Hung, J. H. , Jiang, J. Z. , Sun, Z. , Wang, C. Y. , & Hsu, H. P. (2021). Novel signaling pathways regulate SARS‐CoV and SARS‐CoV‐2 infectious disease. Medicine (Baltimore), 100(7), e24321. 10.1097/MD.0000000000024321 [DOI] [PMC free article] [PubMed] [Google Scholar]
- 30. Cambier, S. , Metzemaekers, M. , De Carvalho, A. C. , Nooyens, A. , Jacobs, C. , Vanderbeke, L. , Malengier‐Devlies, B. , Gouwy, M. , Heylen, E. , Meersseman, P. , Hermans, G. , Wauters, E. , Wilmer, A. , Schols, D. , Matthys, P. , Opdenakker, G. , Marques, R. E. , Wauters, J. , Vandooren, J. , & Proost, P. (2021). Atypical response to bacterial coinfection and persistent neutrophilic bronchoalveolar inflammation distinguish critical COVID‐19 from influenza. JCI Insight, 7(1), e155055. 10.1172/jci.insight.155055 [DOI] [PMC free article] [PubMed] [Google Scholar]
- 31. Haljasmägi, L. , Salumets, A. , Rumm, A. P. , Jürgenson, M. , Krassohhina, E. , Remm, A. , Sein, H. , Kareinen, L. , Vapalahti, O. , Sironen, T. , Peterson, H. , Milani, L. , Tamm, A. , Hayday, A. , Kisand, K. , & Peterson, P. (2020). Longitudinal proteomic profiling reveals increased early inflammation and sustained apoptosis proteins in severe COVID‐19. Scientific Reports, 10(1), 20533. 10.1038/s41598-020-77525-w [DOI] [PMC free article] [PubMed] [Google Scholar]
- 32. Russell, C. D. , Valanciute, A. , Gachanja, N. N. , Stephen, J. , Penrice‐Randal, R. , Armstrong, S. D. , Clohisey, S. , Wang, B. , Al Qsous, W. , Wallace, W. A. , Oniscu, G. C. , Stevens, J. , Harrison, D. J. , Dhaliwal, K. , Hiscox, J. A. , Baillie, J. K. , Akram, A. R. , Dorward, D. A. , & Lucas, C. D. (2021). Tissue proteomic analysis identifies mechanisms and stages of immunopathology in fatal COVID‐19. American Journal of Respiratory Cell and Molecular Biology, 196–205. 10.1165/rcmb.2021-0358OC [DOI] [PMC free article] [PubMed] [Google Scholar]
- 33. Bednash, J. S. , Johns, F. , Patel, N. , Smail, T. R. , Londino, J. D. , & Mallampalli, R. K. (2021). The deubiquitinase STAMBP modulates cytokine secretion through the NLRP3 inflammasome. Cell Signal, 79, 109859. 10.1016/j.cellsig.2020.109859 [DOI] [PMC free article] [PubMed] [Google Scholar]
- 34. Dihm, K. , Ek, M. , Roth, B. , & Ohlsson, B. (2020). Plasma AXIN1 expression exhibit negative correlations with inflammatory biomarkers and is associated with gastrointestinal symptoms in endometriosis. Biomedical Reports, 12(5), 211–221. 10.3892/br.2020.1282 [DOI] [PMC free article] [PubMed] [Google Scholar]
- 35. Ek, M. , Roth, B. , Engström, G. , & Ohlsson, B. (2019). AXIN1 in plasma or serum is a potential new biomarker for endometriosis. International Journal of Molecular Sciences, 20(1), 189. 10.3390/ijms20010189 [DOI] [PMC free article] [PubMed] [Google Scholar]
- 36. Gurung, P. , & Kanneganti, T. D. (2015). Novel roles for caspase‐8 in IL‐1beta and inflammasome regulation. American Journal of Pathology, 185(1), 17–25. 10.1016/j.ajpath.2014.08.025 [DOI] [PMC free article] [PubMed] [Google Scholar]
- 37. He, M. , Chiang, H. H. , Luo, H. , Zheng, Z. , Qiao, Q. , Wang, L. , Tan, M. , Ohkubo, R. , Mu, W. C. , Zhao, S. , Wu, H. , & Chen, D. (2020). An acetylation switch of the NLRP3 inflammasome regulates aging‐associated chronic inflammation and insulin resistance. Cell Metabolism, 31(3), 580–591.e585. 10.1016/j.cmet.2020.01.009 [DOI] [PMC free article] [PubMed] [Google Scholar]
- 38. Qin, X. , Jiang, B. , & Zhang, Y. (2016). 4E‐BP1, a multifactor regulated multifunctional protein. Cell Cycle, 15(6), 781–786. 10.1080/15384101.2016.1151581 [DOI] [PMC free article] [PubMed] [Google Scholar]
- 39. Venkataraman, A. , Kumar, N. P. , Hanna, L. E. , Putlibai, S. , Karthick, M. , Rajamanikam, A. , Sadasivam, K. , Sundaram, B. , & Babu, S. (2021). Plasma biomarker profiling of PIMS‐TS, COVID‐19 and SARS‐CoV2 seropositive children – a cross‐sectional observational study from southern India. EBioMedicine, 66, 103317. 10.1016/j.ebiom.2021.103317 [DOI] [PMC free article] [PubMed] [Google Scholar]
- 40. Chua, R. L. , Lukassen, S. , Trump, S. , Hennig, B. P. , Wendisch, D. , Pott, F. , Debnath, O. , Thürmann, L. , Kurth, F. , Völker, M. T. , Kazmierski, J. , Timmermann, B. , Twardziok, S. , Schneider, S. , Machleidt, F. , Müller‐Redetzky, H. , Maier, M. , Krannich, A. , Schmidt, S. , … Eils, R. (2020). COVID‐19 severity correlates with airway epithelium – immune cell interactions identified by single‐cell analysis. Nature Biotechnology, 38(8), 970–979. 10.1038/s41587-020-0602-4 [DOI] [PubMed] [Google Scholar]
- 41. Coperchini, F. , Chiovato, L. , Ricci, G. , Croce, L. , Magri, F. , & Rotondi, M. (2021). The cytokine storm in COVID‐19: Further advances in our understanding the role of specific chemokines involved. Cytokine & Growth Factor Reviews, 58, 82–91. 10.1016/j.cytogfr.2020.12.005 [DOI] [PMC free article] [PubMed] [Google Scholar]
- 42. Lorè, N. I. , De Lorenzo, R. , Rancoita, P. M. V. , Cugnata, F. , Agresti, A. , Benedetti, F. , Bianchi, M. E. , Bonini, C. , Capobianco, A. , Conte, C. , Corti, A. , Furlan, R. , Mantegani, P. , Maugeri, N. , Sciorati, C. , Saliu, F. , Silvestri, L. , Tresoldi, C. , Farina, N. , … Manfredi, A. A. (2021). CXCL10 levels at hospital admission predict COVID‐19 outcome: Hierarchical assessment of 53 putative inflammatory biomarkers in an observational study. Molecular Medicine, 27(1), 129. 10.1186/s10020-021-00390-4 [DOI] [PMC free article] [PubMed] [Google Scholar]
- 43. Tripathy, A. S. , Vishwakarma, S. , Trimbake, D. , Gurav, Y. K. , Potdar, V. A. , Mokashi, N. D. , Patsute, S. D. , Kaushal, H. , Choudhary, M. L. , Tilekar, B. N. , Sarje, P. , Dange, V. S. , & Abraham, P. (2021). Pro‐inflammatory CXCL‐10, TNF‐alpha, IL‐1beta, and IL‐6: Biomarkers of SARS‐CoV‐2 infection. Archives of Virology, 3301–3310. 10.1007/s00705-021-05247-z [DOI] [PMC free article] [PubMed] [Google Scholar]
- 44. Coperchini, F. , Chiovato, L. , & Rotondi, M. (2021). Interleukin‐6, CXCL10 and infiltrating macrophages in COVID‐19‐related cytokine storm: Not one for all but all for one! Frontiers in Immunology, 12, 668507. 10.3389/fimmu.2021.668507 [DOI] [PMC free article] [PubMed] [Google Scholar]
- 45. Liu, M. , Guo, S. , Hibbert, J. M. , Jain, V. , Singh, N. , Wilson, N. O. , & Stiles, J. K. (2011). CXCL10/IP‐10 in infectious diseases pathogenesis and potential therapeutic implications. Cytokine & Growth Factor Reviews, 22(3), 121–130. 10.1016/j.cytogfr.2011.06.001 [DOI] [PMC free article] [PubMed] [Google Scholar]
- 46. Lei, J. , Yin, X. , Shang, H. , & Jiang, Y. (2019). IP‐10 is highly involved in HIV infection. Cytokine, 115, 97–103. 10.1016/j.cyto.2018.11.018 [DOI] [PubMed] [Google Scholar]
- 47. Noel, N. , Boufassa, F. , Lécuroux, C. , Saez‐Cirion, A. , Bourgeois, C. , Dunyach‐Remy, C. , Goujard, C. , Rouzioux, C. , Meyer, L. , Pancino, G. , Venet, A. , & Lambotte, O. (2014). Elevated IP10 levels are associated with immune activation and low CD4+ T‐cell counts in HIV controller patients. AIDS, 28(4), 467–476. 10.1097/QAD.0000000000000174 [DOI] [PubMed] [Google Scholar]
- 48. Ploquin, M. J. , Madec, Y. , Casrouge, A. , Huot, N. , Passaes, C. , Lécuroux, C. , Essat, A. , Boufassa, F. , Jacquelin, B. , Jochems, S. P. , Petitjean, G. , Angin, M. , Gärtner, K. , Garcia‐Tellez, T. , Noël, N. , Booiman, T. , Boeser‐Nunnink, B. D. , Roques, P. , Saez‐Cirion, A. , … Müller‐Trutwin, M. C. (2016). Elevated basal pre‐infection CXCL10 in plasma and in the small intestine after infection are associated with more rapid HIV/SIV disease onset. PLoS Pathogens, 12(8), e1005774. 10.1371/journal.ppat.1005774 [DOI] [PMC free article] [PubMed] [Google Scholar]
- 49. Kumar, N. P. , Moideen, K. , Nancy, A. , Viswanathan, V. , Shruthi, B. S. , Sivakumar, S. , Natarajan, M. , Kornfeld, H. , & Babu, S. (2019). Plasma chemokines are biomarkers of disease severity, higher bacterial burden and delayed sputum culture conversion in pulmonary tuberculosis. Scientific Reports, 9(1), 18217. 10.1038/s41598-019-54803-w [DOI] [PMC free article] [PubMed] [Google Scholar]
- 50. Weseslindtner, L. , Görzer, I. , Roedl, K. , Küng, E. , Jaksch, P. , Klepetko, W. , & Puchhammer‐Stöckl, E. (2017). Intrapulmonary human cytomegalovirus replication in lung transplant recipients is associated with a rise of CCL‐18 and CCL‐20 chemokine levels. Transplantation, 101(1), 197–203. 10.1097/TP.0000000000001065 [DOI] [PubMed] [Google Scholar]
- 51. Zhang, Y.‐G. , Wu, S. , Xia, Y. , Chen, D. , Petrof, E. O. , Claud, E. C. , Hsu, W. , & Sun, J. (2012). Axin1 prevents Salmonella invasiveness and inflammatory response in intestinal epithelial cells. PLoS ONE, 7(4), e34942. 10.1371/journal.pone.0034942 [DOI] [PMC free article] [PubMed] [Google Scholar]
- 52. Zhou, X. , Wang, Y. , Metselaar, H. J. , Janssen, H. L. A. , Peppelenbosch, M. P. , & Pan, Q. (2014). Rapamycin and everolimus facilitate hepatitis E virus replication: Revealing a basal defense mechanism of PI3K‐PKB‐mTOR pathway. Journal of Hepatology, 61(4), 746–754. 10.1016/j.jhep.2014.05.026 [DOI] [PubMed] [Google Scholar]
Associated Data
This section collects any data citations, data availability statements, or supplementary materials included in this article.
Supplementary Materials
Supporting Information
Data Availability Statement
The datasets generated and analyzed during this study are available from the corresponding author upon reasonable request. The data sharing policies will be followed per the NIH and VA guidelines.