



Summary
Background
Few studies have assessed whether children exposed to in utero hyperglycaemia experience different growth trajectories compared to unexposed children.
Objectives
To assess association of type 2 diabetes (T2D) and gestational diabetes mellitus (GDM) with early childhood weight, length/height and body mass index (BMI) trajectories, and with timing and magnitude of peak BMI in infancy.
Methods
PANDORA is a birth cohort recruited from an Australian hyperglycaemia in pregnancy register, and women with normoglycaemia recruited from the community. Offspring growth measures were obtained from health records over a median follow‐up of 3.0 years (interquartile range 1.9–4.0). This analysis included children born to Aboriginal mothers with in utero normoglycaemia (n = 95), GDM (n = 228) or T2D (n = 131). Growth trajectories (weight, length/height and BMI) were estimated using linear mixed models with cubic spline functions of child age.
Results
After adjustment for maternal factors (age, BMI, parity, smoking, and socioeconomic measures) and child factors (age, gestational age at birth, and sex), children born to mothers with T2D or GDM had lower weight, length/height and BMI trajectories in infancy than children born to mothers with normoglycaemia, but similar weight and BMI by completion of follow‐up. Children exposed to T2D had lower mean peak BMI 17.6 kg/m2 (95% confidence interval [CI] 17.3–18.0) than children exposed to normoglycaemia (18.6 kg/m2 [18.1–18.9]) (p = 0.001).
Conclusions
Maternal hyperglycaemia was associated with differences in early childhood growth trajectories after adjustment for maternal BMI. Exploration of associations between in utero hyperglycaemia exposure and growth trajectories into later childhood is required.
Keywords: Aboriginal, child, diabetes, growth, pregnancy
1. INTRODUCTION
Growth trajectories in childhood are influenced by genetic factors, in utero exposures and environmental circumstances. 1 Early growth failure and rapid catch‐up growth are important in later cardiometabolic risk, 2 , 3 , 4 as are childhood overweight and obesity. 3 , 4 , 5 Body mass index (BMI) typically increases to a peak within the first 18 months of life, followed by a decrease to a nadir at approximately 5 years of age, with rebound thereafter. 6 The timing and magnitude of the BMI peak appear to be associated with subsequent cardiometabolic outcomes in high‐risk populations, 7 , 8 likely influencing the metabolic syndrome pathway. 8 , 9 , 10
There is increasing interest in the associations between transgenerational exposures, including the in utero environment, and growth of offspring. 11 , 12 Children exposed to hyperglycaemia from maternal type 2 diabetes (T2D) in pregnancy or gestational diabetes mellitus (GDM) are at a significantly higher risk of later T2D and have altered growth patterns. 13 , 14 , 15 , 16 , 17 These children are more likely to experience obesity and T2D at a younger age. 18
Among offspring of mothers with hyperglycaemia in pregnancy, there is a continuum of increased risk for adverse cardiometabolic outcomes depending on maternal glucose levels. 19 , 20 Early life exposures and abnormal growth contribute to this risk, in addition to adult lifestyle factors. 2 However, there are few data regarding the growth trajectories of children born to mothers with diabetes in pregnancy, particularly T2D, 21 , 22 due to few women with T2D being included in previous studies. Analysis of differences in offspring growth trajectories post exposure to in utero T2D or GDM is important due to the more severe metabolic changes seen in T2D, and hyperglycaemia being present pre‐conception and during early pregnancy. Other limitations of previous studies include minimal data regarding maternal BMI, retrospective design and classification of hyperglycaemia in pregnancy, cross‐sectional rather than longitudinal analysis, and limited follow‐up. 21 , 22 , 23 The extent to which maternal BMI may influence observed associations between maternal glycaemic status and offspring growth has therefore remained unclear.
The Pregnancy And Neonatal Diabetes Outcomes in Remote Australia (PANDORA) study 24 , 25 is a longitudinal cohort of mothers and children living in the Northern Territory (NT) of Australia. The cohort is uniquely positioned to address these evidence gaps as the prospective nature allows assessment of the influence of maternal BMI on childhood growth within glycaemic categories. There is also a far greater proportion of women with T2D than other studies. In addition, there is a high proportion of Aboriginal women and children as participants, a population with much higher rates of obesity and T2D, including T2D in pregnancy, than other Australians. 26 , 27 , 28 , 29 , 30 In the context of escalating global prevalence of youth‐onset T2D and obesity, and higher prevalence of cardiometabolic risk factors in Aboriginal Australian youth, 31 our cohort provides the opportunity to explore these evidence gaps from an earlier age. Analysis of early childhood growth may assist in identifying children at highest risk for obesity and cardiometabolic conditions, facilitating early intervention. This study aimed to assess the association of T2D in pregnancy and GDM with early childhood growth trajectories, and the influence of maternal BMI on these associations.
2. METHODS
2.1. Participants
The PANDORA cohort involves 1138 mothers and 1163 children across the NT, including Aboriginal, Europid and other ethnicity Australian women (Figure 1). The cohort includes women with and without hyperglycaemia, recruited between November 2011 and February 2017. Women with hyperglycaemia (n = 904, either T2D, type 1 diabetes or GDM) were recruited from a diabetes in pregnancy register via antenatal clinics, aged 16 years and over. Women with type 1 diabetes (n = 18) were excluded from this analysis due to small numbers. Women with normoglycaemia were recruited from antenatal clinics (n = 235). Diagnostic criteria for GDM, and the recruitment process and eligibility criteria, are described elsewhere. 24 In summary, women with GDM were diagnosed at the time of oral glucose tolerance test (OGTT) by either 1999 Australian Diabetes in Pregnancy guidelines 32 or 2013 World Health Organization (WHO) 33 criteria. Women were classified as having T2D in pregnancy using WHO criteria (OGTT or glycated haemoglobin) before the index pregnancy and confirmed on the medical record. Women were classified as having normoglycaemia in pregnancy if they did not meet criteria for either GDM or pre‐existing diabetes in pregnancy.
FIGURE 1.
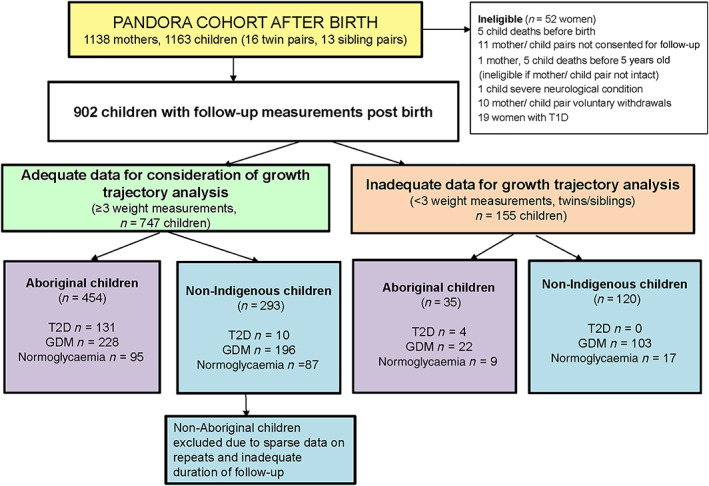
PANDORA study participants for growth trajectory analysis
2.2. Baseline maternal characteristics and neonatal measures
The following maternal variables were assessed by self‐report: ethnicity, location of residence (urban versus remote), any smoking in pregnancy (yes/no), age, breastfeeding at 6 months post‐partum and educational attainment (completion of ≥10 years vs. <10 years of schooling). Other variables were obtained from medical records: BMI (from first antenatal visit, adjusted for gestation), gestational weight gain (calculated as the difference between third trimester weight closest to delivery and first measured weight in pregnancy), maternal height at first antenatal visit, maternal diabetes treatment modalities and medication dose. Aboriginal women were those who self‐identified as Aboriginal and/or Torres Strait Islander.
Neonatal measures included gestational age at delivery, anthropometric measurements and cord blood c‐peptide. Child ethnicity was determined by maternal ethnicity, with 90% of PANDORA children born to an Aboriginal mother also having an Aboriginal father.
2.3. Growth outcomes
Data on child growth were obtained from data linkage to primary healthcare electronic medical records. Child weight (in kilograms) and length/height (in centimetres) were collected through NT primary healthcare service records (government or Aboriginal Community Controlled Health Services). Child growth measures were available for 902 children, with 155 excluded as they did not have at least three weight measurements between 0 and 5 years of age, required for growth trajectory modelling (Figure 1, Table 1). Birthweight has been included in models as the first measurement for all trajectories.
TABLE 1.
Demographic characteristics of the PANDORA cohort
| Adequate data for consideration of growth trajectory analysis (child with ≥3 weight measurements, n = 737) | Inadequate data for growth trajectory analysis (child with <3 weight measurements, n = 155) | Comparison of included and excluded Aboriginal children (p‐value) | |||
|---|---|---|---|---|---|
| Aboriginal (n = 454) | Non‐Indigenous (n = 293) | Aboriginal (n = 35) | Non‐Indigenous (n = 120) | ||
| Type 2 diabetes in pregnancy | 131 (29) | 10 (3) | 4 (11) | 0 | 0.40 |
| GDM | 228 (50) | 195 (67) | 22 (63) | 103 (86) | |
| No hyperglycaemia | 95 (21) | 85 (29) | 9 (26) | 17 (14) | |
| Maternal age at birth (years) | 29.0 (6.0) | 31.8 (5.1) | 30.1 (6.9) | 32.0 (5.3) | 0.33 |
| Maternal BMI at first antenatal visit (kg/m2) | 28.6 (7.2) | 27.7 (6.6) | 30.6 (7.0) | 27.7 (6.3) | 0.14 |
| Gestational weight gain (kg) | 7.7 (7.0) | 8.9 (5.8) | 8.1 (4.6) | 8.8 (5.2) | 0.78 |
| Maternal height at first antenatal visit (cm) | 163.1 (5.7) | 164.7 (7.5) | 163.8 (7.4) | 162.9 (7.7) | 0.56 |
| Maternal parity | 1.9 (1.6) | 0.9 (1.2) | 1.7 (1.5) | 0.9 (1.2) | 0.45 |
| Smoking in pregnancy | 199 (44) | 30 (10) | 9 (28) | 17 (13) | 0.07 |
| Remote residence | 337 (74) | 10 (3) | 7 (22) | 1 (1) | <0.001 |
| Maternal education duration ≤10 years | 96 (21) | 7 (2) | 3 (15) | 2 (2) | 0.11 |
| Child sex (male) | 234 (51) | 170 (59) | 17 (53) | 68 (53) | 0.84 |
| Gestational age at birth (weeks) | 38.0 (2.0) | 39.0 (1.6) | 38.7 (1.6) | 38.6 ± 1.9 | 0.07 |
| Premature birth at <37 weeks | 81 (18) | 25 (9) | 4 (13) | 15 (12) | 0.45 |
| Median number of weight measures | 43 [28, 57] | 6 [4, 8] | 2 [2, 2] | 2 [2,2] | <0.001 |
| Median age of follow‐up (i.e., age at most recent measurement) (months) | 35.8 [23.2, 48.0] | 25.5 [18.2, 35.8] | 26.3 [14.9, 35.8] | 30.6 [17.1, 39.6] | 0.53 |
Note: Results presented as n (%), mean (SD) or median [interquartile range]. Only Aboriginal children were included in final analysis (Table 2, Figures 2 and 3). While 293 non‐Indigenous children had ≥3 weight measurements, there were sparse data on repeats and inadequate duration of follow‐up among non‐Aboriginal children. Only 25% of non‐Indigenous children had a weight measure after 35.8 months of age and only 50% after 25.5 months of age. Number of each sub‐group relates to children with ≥3 weight measures. Of Aboriginal women with GDM, of those included in analysis, 57/229 (25%) had likely T2D in pregnancy; of those excluded from analysis, 2/12 (17%) had glycaemic results consistent with the T2D range outside of pregnancy, but diagnosed for the first time in pregnancy, p = 0.08.
Abbreviations: BMI, body mass index; GDM, gestational diabetes mellitus; T2D, type 2 diabetes.
There were limited measurements available for non‐Indigenous children from 2 to 5 years of age (1596 total weight measurements for 293 children between 0 and 5 years of age vs. 13 794 measurements available for 454 Aboriginal children, and only 50% with measurements available after 2.1 years of age), as many non‐Indigenous children are seen by private healthcare services. Therefore, only growth trajectory data for Aboriginal children (n = 454), stratified by maternal glycaemic status (n = 131 T2D, 228 GDM, 95 normoglycaemia), are presented in this analysis. Twins (n = 5) and siblings (n = 6) were excluded. For further details, see Supplementary Methods in Appendix S1.
2.4. Statistical analysis
Statistical analysis was conducted using STATA v15 (Stata Corporation, College Station, TX, USA). Two methodologies were used to analyse growth trajectories. Linear mixed models were used to estimate growth trajectories, and cubic spline functions of age were used to capture non‐linear trends and fit smooth, flexible curves. Knot positions (time points in children's age where the different cubic splines are joined) were determined by previous research. 3 , 6 Trajectories were estimated for each maternal glycaemic status group (T2D, GDM or normoglycaemia) by including in the models interaction terms between each cubic spline of offspring age and maternal glycaemic status. The p‐values of the interaction terms informed whether there was a statistically significant difference between growth trajectories of different glycaemia groups over the follow‐up.
Multivariable models also included fixed effects for maternal (age, BMI, educational attainment, smoking during pregnancy, parity, height) and child factors (sex, age, gestational age at birth, predominant breastfeeding at 6 months of age), variables previously found to be associated with child growth measures. 6 , 34 Growth trajectory peaks were the highest points on the estimated curves, with corresponding 95% confidence intervals, and were derived using the predict command in STATA following the execution of the mixed command. They were derived by extracting the maximum and corresponding 95% confidence intervals from predicted values. Age at peak BMI was defined as age after which there was a decline in BMI post the initial rise in infancy. For further details, see Supplementary Methods in Appendix S1.
3. RESULTS
Among Aboriginal children, those included in growth trajectory analysis were more likely to live in a remote area than those excluded (Table 1). The median number of weight measurements in included Aboriginal children was 43 (interquartile range [IQR] 28–57) and median age at last follow‐up was 3.0 years (IQR 1.9–4.0). Table 2 outlines demographic characteristics of included Aboriginal children, stratified by maternal glycaemic status.
TABLE 2.
Maternal and child characteristics of Aboriginal children included in growth trajectory analysis, stratified by maternal glycaemic status in pregnancy
| Type 2 diabetes in pregnancy (n = 131) | GDM (n = 228) | Normoglycaemia in pregnancy (n = 95) | p‐Value | |
|---|---|---|---|---|
| Maternal characteristics | ||||
| Maternal age at birth (years) | 31.3 (5.3) | 29.2 (6.1) | 25.0 (4.7) | 0.006 |
| Gestational age at first antenatal visit (weeks) | 13.6 (7.2) | 14.6 (7.7) | 14.8 (8.9) | 0.081 |
| Maternal BMI at first antenatal visit (kg/m2) a | 31.2 (5.7) | 29.1 (7.4) | 24.3 (6.2) | 0.005 |
| Gestational weight gain (kg) b | 5.9 (5.4) | 7.2 (5.6) | 10.4 (5.9) | 0.73 |
| Maternal height at first antenatal visit (cm) a | 163.9 (5.7) | 162.8 (5.8) | 162.9 (5.4) | 0.77 |
| Maternal parity | 2.3 (1.5) | 1.9 (1.6) | 1.2 (1.4) | 0.41 |
| Smoking in pregnancy | 50 (38) | 107 (48) | 42 (45) | 0.22 |
| Remote residence | 99 (76) | 165 (72) | 72 (76) | 0.73 |
| Maternal schooling duration ≤10 years | 39 (30) | 45 (20) | 12 (13) | 0.006 |
| Maternal glycaemia characteristics | ||||
| Glycated haemoglobin (HbA1c) | ||||
| HbA1c (mmol/mol) | 62.1 (21.0) | – | – | – |
| Gestational age at first HbA1c (weeks) | 10.4 (8.3) | – | – | – |
| First oral glucose tolerance test (OGTT) | ||||
| Fasting glucose (mmol/L) | – | 5.0 (1.1) | 4.2 (0.4) | <0.001 |
| One hour glucose (mmol/L) | – | 9.8 (2.1) | 7.1 (1.6) | <0.001 |
| Two hour glucose (mmol/L) | – | 8.3 (2.2) | 6.0 (1.1) | <0.001 |
| Gestational age at OGTT (weeks) | – | 23.6 (7.4) | 26.1 (5.5) | 0.003 |
| Cord blood C‐peptide (nmol/L) | 0.9 (0.9) | 0.6 (0.5) | 0.4 (0.2) | <0.001 |
| Diabetes treatment type | – | <0.001 | ||
| Diet/lifestyle management only | 2 (2) | 82 (36) | – | |
| Metformin only | 21(16) | 61 (27) | – | |
| Insulin only | 12 (9) | 22 (10) | – | |
| Metformin and insulin | 96 (73) | 63 (28) | – | |
| Maximal total daily dose insulin third trimester (units) | 54 [26–88] | 18 [8–32] | – | <0.001 |
| Maximal metformin dose third trimester (g) | 1.8 (0.4) | 1.5 (0.6) | – | <0.001 |
| Child characteristics | ||||
| Child sex (male) | 57 (44) | 127 (56) | 50 (53) | 0.081 |
| Gestational age at birth (weeks) | 36.7 (2.3) | 38.2 (1.5) | 39.5 (1.3) | <0.001 |
| Premature birth at <37 weeks | 49 (37) | 27 (12) | 4 (4) | <0.001 |
| Predominant breastfeeding at 6 months of age | 36 (57) | 95 (72) | 55 (73) | 0.062 |
| Median number of weight measures per child | 46 [29, 60] | 43 [30, 60] | 37 [21, 47] | 0.15 |
| Median age (months) at last follow‐up | 37.6 [26.4, 48.7] | 37.3 [25.9, 49.7] | 26.7 [19.0, 36.1] | 0.16 |
Note: Data are mean (SD) or median [interquartile range] or n (%). The same measures of glycaemia severity are not available across categories of maternal hyperglycaemia (GDM vs. T2D), with oral glucose tolerance test data being available for women with GDM and normoglycaemia and glycated haemoglobin data being available for women with T2D. Number is reduced for specific variables: For women with T2D, GDM and normoglycaemia respectively: maternal educational attainment, n = 131, n = 228, n = 95; BMI at first antenatal visit, n = 122, n = 212, n = 92; gestational weight gain, n = 109, n = 195, n = 78; smoking in pregnancy, n = 130, n = 223, n = 94; maternal height at first antenatal visit, n = 129, n = 226, n = 93; breastfeeding status at 6 months, n = 63, n = 131, n = 75; oral glucose tolerance test results, n = 212 GDM, n = 94 normoglycaemia; cord blood c‐peptide, n = 77 T2D, n = 212 GDM, n = 49 normoglycaemia.
Mean gestation at first antenatal visit 14.5 (7.7) weeks.
Gestational weight gain was calculated as the difference between third trimester weight closest to delivery and first measured weight in pregnancy (kg).
3.1. Growth trajectories
Growth trajectories to a follow‐up age of 5.0 years, stratified by maternal glycaemic status, are presented in Figure 2 (multivariable regression excluding maternal BMI) and Figure 3 (including maternal BMI). Maternal height, BMI, age and smoking in pregnancy, and child sex, were included in the final multivariable models, with all p‐values ≤0.1. Maternal glycaemic status (both T2D and GDM) remained associated with weight, length/height and BMI trajectories of offspring independent of these factors. Children born to mothers with T2D or GDM had lower weight, length/height and BMI in infancy than children born to mothers with normoglycaemia, but had similar weight and BMI by completion of follow‐up. There was minimal change in trajectories when including or excluding maternal BMI from the models. No collinearity was identified between maternal BMI and height (data not shown) or maternal BMI and glycaemic status (data not shown).
FIGURE 2.
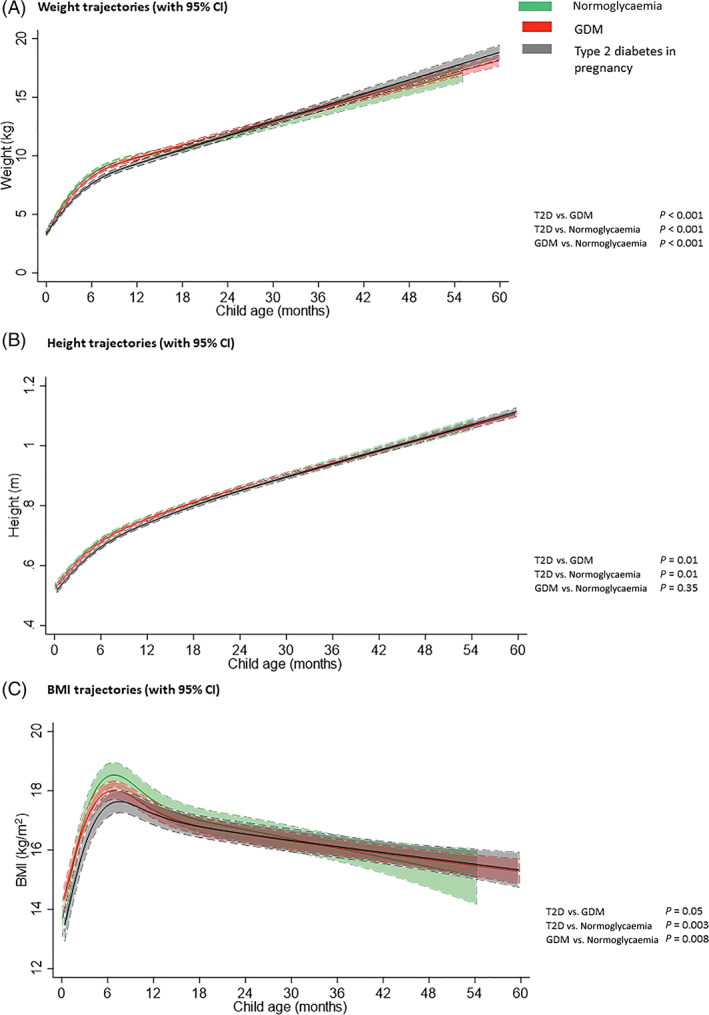
Growth trajectories of Aboriginal children from 0 to 60 months of age, stratified by maternal glycaemic status in pregnancy (full model, maternal BMI not included). Only variables with p‐value ≤0.1 on stepwise multivariable analysis were included in final model for each outcome. All variables with p‐value ≤0.2 on univariate analysis were included in model building process. Final models for each outcome are as follows: Weight: child sex, maternal height, maternal smoking in pregnancy; height: child sex, maternal height, maternal smoking in pregnancy; BMI: child sex, maternal smoking in pregnancy, maternal age. Other variables included in modelling process: maternal educational attainment, maternal parity, child's gestational age at birth.
FIGURE 3.
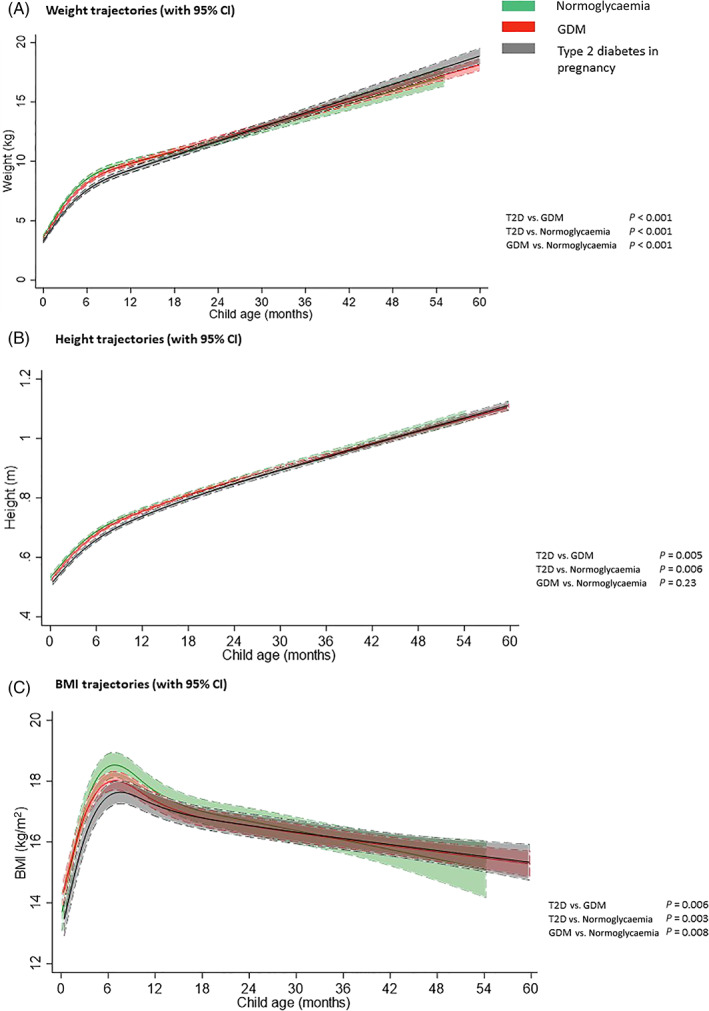
Growth trajectories of Aboriginal children from 0 to 60 months of age, stratified by maternal glycaemic status in pregnancy (including maternal BMI). Only variables with p‐value ≤0.1 on stepwise multivariable analysis were included in final model for each outcome. All variables with p‐value ≤0.2 on univariate analysis were included in model building process. Final models for each outcome are as follows: Weight: child sex, maternal BMI at first antenatal visit, maternal height, maternal smoking in pregnancy; height: child sex, maternal BMI at first antenatal visit, maternal height, maternal smoking in pregnancy; BMI: child sex, maternal BMI at first antenatal visit, maternal smoking in pregnancy, maternal age. Other variables included in modelling process: maternal educational attainment, maternal parity, child's gestational age at birth.
Compared to children born to mothers with normoglycaemia, children born to mothers with either T2D or GDM had on average lower weight in infancy, with a shift over early childhood leading to marginally higher weight by the end of follow‐up. Children born to mothers with T2D had a lower initial weight than children born to mothers with GDM and differed over the 5 years (p < 0.001).
Children of mothers with T2D had on average a lower length/height in infancy compared to children born to mothers with either normoglycaemia (p = 0.006) or GDM (p = 0.005), with minimal differences persisting into childhood. There was no difference in length/height between children born to mothers with GDM and normoglycaemia (p = 0.23).
Children of mothers with T2D (p = 0.003) or GDM (p = 0.008) had on average lower BMI in infancy, compared to children of women with normoglycaemia. Children of mothers with T2D had lower BMI in infancy than children of mothers with GDM (p = 0.006 when maternal BMI included in modelling, p = 0.05 when BMI excluded).
3.2. Timing and magnitude of peak BMI
After adjustment for maternal and child variables (Table 3), children born to mothers with T2D reached peak BMI at a similar age to children of mothers with either GDM or normoglycaemia. The mean magnitude of peak BMI, however, was lower in children of mothers with either GDM (18.0 kg/m2, p = 0.037) or T2D (17.6 kg/m2, p = 0.001) compared to children of mothers with normoglycaemia (18.6 kg/m2). There was no difference in magnitude of peak BMI between children of mothers with GDM and T2D (p = 0.10).
TABLE 3.
Timing and magnitude of peak BMI among Aboriginal children (kg/m2, adjusted for child sex) by maternal glycaemic status
| Unadjusted model a | Full model b | |
|---|---|---|
| Normoglycaemia (n = 89) | ||
| Child age (months) (95% CI) | 6.9 (4.7, 9.6) | 6.8 (7.6, 9.7) |
| Peak BMI (kg/m2) (95% CI) | 18.2 (17.8, 18.5) | 18.6 (18.1, 18.9) |
| GDM (n = 216) | ||
| Child age (months) (95% CI) | 6.9 (4.9, 9.3) | 6.9 (4.7, 9.6) |
| p‐Value comparing to normoglycaemia age | 1.0 | 0.96 |
| p‐Value comparing to T2D age | 0.73 | 0.74 |
| Peak BMI (kg/m2) (95% CI) | 17.8 (17.6, 18.1) | 18.0 (17.7, 18.3) |
| p‐Value comparing to normoglycaemia peak | 0.18 | 0.037 |
| p‐Value comparing to T2D peak | 0.15 | 0.10 |
| T2D in pregnancy (n = 121) | ||
| Child age (months) (95% CI) | 7.6 (5.0, 11.6) | 7.6 (5.0, 11.5) |
| p‐Value comparing to normoglycaemia age | 0.65 | 0.65 |
| Peak BMI (kg/m2) (95% CI) | 17.5 (17.2, 17.9) | 17.6 (17.3, 18.00) |
| p‐Value comparing to normoglycaemia peak | 0.015 | 0.001 |
Note: Only variables with p‐value ≤0.1 on stepwise multivariable analysis were included in final model for each outcome. All variables with p‐value ≤0.2 on univariate analysis were included in model building process. Other variables thus included in modelling process: Maternal educational attainment, maternal parity, child's gestational age at birth, predominant breastfeeding at 6 months. n differs from Table 1 as only children with ≥3 BMI measures available between 0 and 60 months of age were included here.
Adjusted for child sex only.
Adjusted for child sex, maternal BMI at first antenatal visit, maternal smoking in pregnancy and maternal age.
3.3. Sensitivity analyses
Sensitivity analyses regarding (i) women with glycaemic results consistent with T2D range outside of pregnancy, but diagnosed for the first time in pregnancy; and (ii) children with non‐Indigenous mother and Aboriginal father, demonstrated no differences in outcomes (data not shown). Sex‐specific analyses showed similar findings for male and female children (data not shown), and thus findings for all children are presented together. However, the study's sample size may not have been sufficiently large to identify sex‐specific differences. Sensitivity analyses that included predominant breastfeeding at 6 months in modelling demonstrated no difference in the observed associations between diabetes status in pregnancy and child growth outcomes to 5 years of age (see Figure S1). Of note, p‐value of predominant breastfeeding at 6 months was >0.2 for all outcomes on univariate analysis, and also when included in multivariable models.
4. DISCUSSION
This study reports four major findings among offspring of Aboriginal Australian women with GDM, T2D or normoglycaemia in pregnancy. Firstly, that maternal glycaemic status in pregnancy is associated with offspring growth trajectories during early childhood. After adjustment for maternal and child factors, including maternal BMI, the weight, length/height and BMI trajectories of children born to mothers with T2D, GDM and normoglycaemia differ from birth, over a median follow‐up period of 3 years. Children exposed to in utero hyperglycaemia have lower weight, length/height and BMI in infancy than non‐exposed children, but similar or marginally higher weight and BMI by completion of follow‐up. Secondly, these trajectories represented a gradient by timing and severity of exposure to in utero hyperglycaemia, with children born to mothers with T2D having initially lower weight, length/height and BMI than children of mothers with GDM. Inclusion of maternal BMI in modelling demonstrated minimal change in these trajectories. Thirdly, the mean magnitude of peak BMI in infancy differed by maternal glycaemic status, with a lower peak among those born to mothers with T2D and GDM than those born to mothers with normoglycaemia. Finally, we found no difference in the timing of peak BMI by maternal glycaemic status.
Children born to mothers with T2D had lower weight, length/height and BMI in infancy than children born to mothers with GDM. There was a shift into early childhood, leading to children of mothers with T2D having similar weight and BMI trajectories by completion of follow‐up. Very few women with T2D have been included in previous studies and, if included, analysed only as part of a larger group, including all women with hyperglycaemia, due to the small numbers of women with T2D in pregnancy, 35 , 36 or had growth measures analysed at certain time points rather than trajectories. 37 The exception is a US study using latent class analysis demonstrating that children of mothers with either type 1 or 2 diabetes, or GDM requiring medication, were more likely be in the higher BMI trajectory group after 2 years of age. 38 In our novel study, 29% of children were born to mothers with T2D. To the best of our knowledge, no other study has explored growth trajectories of children born to mothers with T2D.
This study also demonstrates, in contrast to previous assertions, 21 and in response to limitations of earlier studies, 22 , 23 that the relationship between maternal glycaemic status and childhood growth trajectories is independent of maternal BMI. While maternal BMI remained an important variable in the final multivariable models for child weight, length/height and BMI trajectories, the contribution was clinically small, with beta coefficients ranging between 0.01 and 0.04 for each trajectory. There was little change in weight, length/height or BMI growth curves after inclusion of maternal BMI (Figure 3) other than differences in BMI trajectories between children born to mothers with T2D or GDM becoming more apparent. This could reflect an additional impact of BMI in the setting of more severe metabolic changes associated with T2D in pregnancy than GDM, and earlier hyperglycaemia. 39
Our study demonstrated that children born to mothers with T2D have a lower mean peak BMI of infancy compared to children born to mothers with normoglycaemia, after adjustment for multiple factors, including maternal BMI. Other studies exploring GDM in pregnancy have inconsistently demonstrated lower peak BMI compared to women with normoglycaemia. 6 , 7 , 40 , 41 While there appeared to be a trend towards lower mean peak BMI among children born to women with T2D compared to children of women with GDM, our sample size was likely too small to detect significance.
We found no difference in timing of peak BMI by maternal glycaemic status, possibly relating to group size. Other studies have demonstrated that the timing and magnitude of the peak BMI in infancy is associated with cardiometabolic risk, a higher and later peak being associated with increased BMI, fat mass, blood pressure and skinfold thicknesses at 4 years of age. 7 The same study demonstrated ethnic differences in the timing of peak BMI, though children of women with diabetes were excluded from analysis. 7
To our knowledge, only one study has explored the effect of exposure to impaired glucose tolerance in utero on childhood growth trajectories, demonstrating a lower magnitude of peak BMI of infancy than in children born to women with normoglycaemia, 6 similar to the findings from our study. Interestingly, children born to women with GDM in that cohort did not differ in magnitude of peak from those born to women with normoglycaemia. In the context of T2D in pregnancy being associated with earlier onset of cardiometabolic conditions in offspring than in unexposed children, 13 , 14 , 42 it is important to understand the mechanisms by which maternal hyperglycaemia may lead to lower peak BMI in infancy, as seen in our study (with a difference of −0.6 kg/m2 for GDM compared to normoglycaemia, and −1.0 kg/m2 for T2D compared to normoglycaemia), and thus influence cardiometabolic risk in childhood. The children in our study were aged 0–5 years, and in this age group a 1 kg/m2 difference in BMI equates to approximately one unit Z score difference, 1 indicating potential clinical significance of our findings. The lower magnitude of peak BMI in infancy in children born to mothers with T2D is a somewhat unexpected finding in light of the known association between in utero exposure to maternal T2D and subsequent youth‐onset T2D and obesity. Previous studies have suggested a 89% increased risk of overweight at 4 years of age per unit z score increase for magnitude of peak BMI of infancy. 7 The mechanisms by which these children develop cardiometabolic conditions, and the time points at which intervention may be most effective in reducing risk, are still unclear.
Limitations of our study include the inability to access records of private primary healthcare facilities, leading to exclusion of non‐Indigenous children from the analysis. However, the incidence of youth‐onset T2D is 20‐fold higher, 28 and the prevalence of T2D in pregnancy 10‐fold higher, 29 in the Aboriginal than non‐Indigenous Australian population. Exploration of the association of T2D in pregnancy with offspring growth is therefore of greater importance among the Aboriginal population. 24 The only difference (Table 1) between Aboriginal children included or excluded from growth trajectory analysis was that a higher proportion of included children were from a remote location. This reflects the wider use of private primary health services within urban areas in the NT. Participants may not represent the wider NT population due to the voluntary nature of our study. However, of those on the diabetes in pregnancy register, 54% participated in PANDORA, with no significant demographic differences when compared to the register. 24 As the study sample size was not calculated for the purpose of addressing differences in growth trajectories, it may have been underpowered for some of the comparisons presented. Thus, although there is an apparent shift in growth trajectories towards completion of follow‐up, only 50% of children included in analyses had growth measures after 3.0 years of age (median follow‐up) and 25% after 4.0 years. The sensitivity analysis including predominant breastfeeding status at 6 months in multivariable analyses involved a subgroup of women, those with breastfeeding data available, and so may have been underpowered.
Maternal hyperglycaemia is a continuum and there are inherent limitations of analysis using diagnostic categories; however, these diagnostic categories are clinically relevant and reflect current practice. We were not able to collect data on glucose levels during pregnancy. However, cord blood c‐peptide results, as a marker of fuel load on the baby, were higher in women with T2D than women with GDM or normoglycaemia, suggesting more severe hyperglycaemia at birth. The differences in treatment modalities, with 73% of women with T2D requiring both metformin and insulin in the third trimester, compared to 28% of women with GDM, also suggests greater severity, as does the higher mean insulin and metformin doses required in women with T2D compared to women with GDM during the third trimester (insulin 52 vs. 10 units; metformin 1.8 vs. 1.5 g). Our data did not allow for the assessment of hyperglycaemia as a continuous variable across the spectrum of glucose tolerance in pregnancy. As the severity of hyperglycaemia within each glycaemic category was defined by different measures (OGTT glucose levels in GDM and normoglycaemia; HbA1c in T2D), it was not possible to compare glycaemia across the cohort. This may also have concealed associations between different levels of hyperglycaemia that exist within each glycaemia category, and child outcomes. Differences seen among women with hyperglycaemia may be secondary to differences in the pathology of the disease states, particularly the presence of hyperglycaemia at an early gestation in T2D, and not necessarily only the degree of hyperglycaemia.
Our study is unique for its birth cohort context and longitudinal nature, allowing examination of the differential impact on growth associated with exposure to pre‐existing T2D, GDM or normoglycaemia. The cohort includes prospective information regarding maternal (glycaemia, adiposity and socioeconomic status) and child factors, overcoming previous inconsistencies regarding glycaemia in pregnancy and growth trajectories. We could thus address the evidence gap regarding contribution of maternal BMI to differences in growth trajectories seen by maternal glycaemic status. The frequency of growth measures within our cohort increases the accuracy of trajectory curves and there was no difference in timing or number of measures by maternal glycaemic status. A second strength is the high proportion of women with T2D, in contrast to previous studies including only women with GDM, type 1 diabetes or normoglycaemia. A third strength is our setting of Aboriginal Australians, representing a population at high risk of cardiometabolic conditions from a young age. 31 This provides the opportunity for our study to explore risk factors, including differential growth, from an earlier age.
Our study has important implications for policy and practice. Children born to women with both GDM and T2D had a lower rate of weight and BMI gain in the first 12–18 months than non‐exposed children, and a lower BMI peak. These offspring are known to be at increased risk of cardiometabolic conditions in later life. Our study highlights the need to better understand factors contributing to cardiometabolic risk from a young age, particularly the role of early blunted growth. If significant weight gain and increased risk of obesity only occur in these offspring after early childhood, these early years may represent an opportunity to establish healthier growth patterns before adiposity sets in.
5. CONCLUSION
In conclusion, maternal glycaemia is associated with growth trajectories of offspring in early childhood, with children exposed to hyperglycaemia having lower weight, length/height and BMI in infancy. This association remained after adjustment for maternal BMI. Maternal glycaemic status (T2D and GDM) was also associated with lower peak BMI in infancy but the relationship between exposure to hyperglycaemia in utero and timing of peak BMI remains unclear. Exploration of associations between in utero hyperglycaemia and growth trajectories into later childhood, and their relationship to cardiometabolic risk, is also required.
Interventions must target the health of women pre‐conception, during pregnancy, and their children in early childhood, as well as address the social and systemic factors contributing to health inequities. Maternal BMI and hyperglycaemia in pregnancy are both modifiable risk factors, and improvements will have beneficial impacts on offspring. There is a need to address factors which may prevent intergenerational transmission of risk, particularly in high‐risk populations such as First Nations communities, with high rates of youth‐onset T2D and obesity.
AUTHOR CONTRIBUTIONS
Angela Titmuss and Danielle K. Longmore wrote the manuscript. Louise J. Maple‐Brown supervised all aspects of the study. Angela Titmuss, Danielle K. Longmore, Alex D. H. Brown, Christine Connors, Jacqueline A. Boyle, Jeremy Oats, H. David McIntyre, Jonathan E. Shaw and Louise J. Maple‐Brown conceived the project. Alex D. H. Brown, Christine Connors, Jacqueline A. Boyle, Jeremy Oats, H. David McIntyre, Jonathan E. Shaw and Louise J. Maple‐Brown led funding applications. Angela Titmuss, Danielle K. Longmore, Federica Barzi, Alison Simmonds, Vanya Webster and Louise J. Maple‐Brown lead ethics and data access applications. Angela Titmuss, Danielle K. Longmore and Federica Barzi designed, undertook and interpreted the analyses. Elizabeth L. M. Barr, Anna Wood, Alex D. H. Brown, Christine Connors, Jacqueline A. Boyle, Jeremy Oats, H. David McIntyre, Jonathan E. Shaw, Maria E. Craig and Louise J. Maple‐Brown revised the analysis plan and assisted in interpreting the data. Vanya Webster and Alex D. H. Brown critically revised the manuscript from First Nations perspectives. All authors critically revised the manuscript for important intellectual content and approved the final manuscript.
FUNDING INFORMATION
This work was supported by the National Health and Medical Research Council of Australia (NHMRC grants no. 1032116 and 1078333). Angela Titmuss was supported by a NHMRC Postgraduate Scholarship (no. 114760), RACP NHMRC Woolcock Scholarship and NHMRC Hot North PhD Completion Scholarship. Louise J. Maple‐Brown was supported by NHMRC Practitioner Fellowship (no. 1078477) and NHMRC Investigator Grant (no. 1194698). Jacqueline A. Boyle was supported by NHMRC Career Development Fellowship. Jonathan E. Shaw was supported by NHMRC Fellowship (no. 1079438). Alex D. H. Brown was supported by a Viertel Senior Medical Research Fellowship and an NHMRC Senior Research Fellowship (no. 1137563). Maria E. Craig was supported by a NHMRC Practitioner Fellowship (no. 1136735). Anna Wood was supported by a NHMRC Postgraduate Scholarship. The funders had no role in study design, data collection and analysis, decision to publish or preparation of the manuscript.
CONFLICT OF INTEREST
No conflict of interest was declared.
Supporting information
Appendix S1 Supporting Information
ACKNOWLEDGEMENTS
We gratefully acknowledge all PANDORA study staff and participants, including: M. Kirkwood (Wellbeing and Preventable Chronic Disease Division, Menzies School of Health Research, Australia), P. Van Dokkum (Aboriginal Health Domain, Baker Heart and Diabetes Institute, Australia), J. Kelaart (Aboriginal Health Domain, Baker Heart and Diabetes Institute, Australia), E. Death (Wellbeing and Preventable Chronic Disease Division, Menzies School of Health Research, Australia), S. Graham (Wellbeing and Preventable Chronic Disease Division, Menzies School of Health Research, Australia), as well as Diabetes across the Lifecourse: Northern Australia Partnership investigators, partners, staff, Aboriginal & Torres Strait Islander Advisory Group and Clinical Reference Group, health professionals from Northern Territory Department of Health hospitals and remote primary healthcare, Healthy Living NT and Aboriginal Community Controlled Health Organisations. Thank you also to PANDORA Cohort study investigators not named as authors on this study, including: S. Chitturi, S. Corpus, K. Dempsey, M. Dowden, S. Eades, C. Inglis, E. Moore, R. Saffery, M. Skilton, S. Thomas, L. Ward, C. Whitbread and P. Zimmet. We thank Professor Kerin O'Dea for her significant contributions over many years in the foundation of this programme of work. The views expressed in this publication are those of the authors and do not reflect the views of the National Health and Medical Research Council of Australia.
Open access publishing facilitated by Charles Darwin University, as part of the Wiley ‐ Charles Darwin University agreement via the Council of Australian University Librarians.
Titmuss A, Longmore DK, Barzi F, et al. Association between hyperglycaemia in pregnancy and growth of offspring in early childhood: The PANDORA study. Pediatric Obesity. 2022;17(10):e12932. doi: 10.1111/ijpo.12932
Angela Titmuss and Danielle K. Longmore are joint first authors.
Funding information National Health and Medical Research Council, Grant/Award Numbers: 1032116, 1078333, 1078477, 1079438, 1136735, 1137563, 114760, 1194698
REFERENCES
- 1. WHO Multicentre Growth Reference Study Group . WHO Child Growth Standards: Methods and Development. World Health Organization; 2006. [Google Scholar]
- 2. Hales CN, Barker DJ, Clark PM, et al. Fetal and infant growth and impaired glucose tolerance at age 64. Br Med J. 1991;303(6809):1019. [DOI] [PMC free article] [PubMed] [Google Scholar]
- 3. Tilling K, Davies NM, Nicoli E, et al. Associations of growth trajectories in infancy and early childhood with later childhood outcomes. Am J Clin Nutr. 2011;94(6 suppl):1808S‐1813S. [DOI] [PMC free article] [PubMed] [Google Scholar]
- 4. Baur LA, Garnett SP. Early childhood—a critical period for obesity prevention. Nat Rev Endocrinol. 2019;15(1):5‐6. [DOI] [PubMed] [Google Scholar]
- 5. Geserick M, Vogel M, Gausche R, et al. Acceleration of BMI in early childhood and risk of sustained obesity. N Engl J Med. 2018;379(14):1303‐1312. [DOI] [PubMed] [Google Scholar]
- 6. Aris IM, Rifas‐Shiman SL, Li L‐J, et al. Pre‐, perinatal, and parental predictors of body mass index trajectory milestones. J Pediatr. 2018;201:69‐77.e8. [DOI] [PMC free article] [PubMed] [Google Scholar]
- 7. Aris IM, Bernard JY, Chen LW, et al. Infant body mass index peak and early childhood cardio‐metabolic risk markers in a multi‐ethnic Asian birth cohort. Int J Epidemiol. 2017;46(2):513‐525. [DOI] [PMC free article] [PubMed] [Google Scholar]
- 8. Marinkovic T, Toemen L, Kruithof CJ, et al. Early infant growth velocity patterns and cardiovascular and metabolic outcomes in childhood. J Pediatr. 2017;186:57‐63.e4. [DOI] [PMC free article] [PubMed] [Google Scholar]
- 9. DeBoer MD, Limo AA, Oria RB, et al. Early childhood growth failure and the developmental origins of adult disease: do enteric infections and malnutrition increase risk for the metabolic syndrome? Nutr Rev. 2012;640(11):642‐653. [DOI] [PMC free article] [PubMed] [Google Scholar]
- 10. Kelishadi R, Haghdoost AA, Jamshidi F, Aliramezany M, Moosazadeh M. Low birthweight or rapid catch‐up growth: which is more associated with cardiovascular disease and its risk factors in later life? A systematic review and cryptanalysis. Paediatr Int Child Health. 2015;35(2):110‐123. [DOI] [PubMed] [Google Scholar]
- 11. Wells JC. Toward body composition reference data for infants, children, and adolescents. Adv Nutr. 2014;5(3):320s‐329s. [DOI] [PMC free article] [PubMed] [Google Scholar]
- 12. Gow ML, Roberts L, Henry A, et al. Growth from birth to 6 months of infants with and without intrauterine preeclampsia exposure. J Dev Orig Health Dis. 2021;13(2):1‐5. doi: 10.1017/S2040174421000167 [DOI] [PubMed] [Google Scholar]
- 13. Yajnik CS, Fall CH, Vaidya U, et al. Fetal growth and glucose and insulin metabolism in four‐year‐old Indian children. Diabet Med. 1995;12(4):330‐336. [DOI] [PubMed] [Google Scholar]
- 14. Dabelea D, Hanson RL, Lindsay RS, et al. Intrauterine exposure to diabetes conveys risks for type 2 diabetes and obesity: a study of discordant sibships. Diabetes. 2000;49(12):2208‐2211. [DOI] [PubMed] [Google Scholar]
- 15. Lampl M, Jeanty P. Exposure to maternal diabetes is associated with altered fetal growth patterns: a hypothesis regarding metabolic allocation to growth under hyperglycaemic‐hypoxaemic conditions. Am J Hum Biol. 2004;16:237‐263. [DOI] [PubMed] [Google Scholar]
- 16. Dabelea D, Knowler WC, Pettitt DJ. Effect of diabetes in pregnancy on offspring: follow‐up research in the Pima Indians. J Matern Fetal Med. 2000;9(1):83‐88. [DOI] [PubMed] [Google Scholar]
- 17. Silverman BL, Rizzo TA, Cho NH, Metzger BE. Long‐term effects of the intrauterine environment. The Northwestern University Diabetes in Pregnancy Center. Diabetes Care. 1998;21 Suppl 2:B142‐B149. [PubMed] [Google Scholar]
- 18. Fetita LS, Sobngwi E, Serradas P, Calvo F, Gautier JF. Consequences of fetal exposure to maternal diabetes in offspring. J Clin Endocrinol Metab. 2006;91(10):3718‐3724. [DOI] [PubMed] [Google Scholar]
- 19. Hillier TA, Pedula KL, Schmidt MM, Mullen JA, Charles MA, Pettitt DJ. Childhood obesity and metabolic imprinting: the ongoing effects of maternal hyperglycemia. Diabetes Care. 2007;30(9):2287‐2292. [DOI] [PubMed] [Google Scholar]
- 20. Zhu Y, Olsen SF, Mendola P, et al. Growth and obesity through the first 7 y of life in association with levels of maternal glycemia during pregnancy: a prospective cohort study. Am J Clin Nutr. 2016;103(3):794‐800. [DOI] [PMC free article] [PubMed] [Google Scholar]
- 21. Donovan LE, Cundy T. Does exposure to hyperglycaemia in utero increase the risk of obesity and diabetes in the offspring? A critical reappraisal. Diabet Med. 2014;32(3):295‐304. [DOI] [PubMed] [Google Scholar]
- 22. Philipps LH, Santhakumaran S, Gale C, et al. The diabetic pregnancy and offspring BMI in childhood: a systematic review and meta‐analysis. Diabetologia. 2011;54(8):1957‐1966. [DOI] [PubMed] [Google Scholar]
- 23. Yu Z, Han S, Zhu J, Sun X, Ji C, Guo X. Pre‐pregnancy body mass index in relation to infant birth weight and offspring overweight/obesity: a systematic review and meta‐analysis. PLoS One. 2013;8(4):e61627. [DOI] [PMC free article] [PubMed] [Google Scholar]
- 24. Lee IL, Purbrick B, Barzi F, et al. Cohort profile: the pregnancy and neonatal diabetes outcomes in remote Australia (PANDORA) study. Int J Epidemiol. 2018;47(4):1045‐6h. [DOI] [PubMed] [Google Scholar]
- 25. Maple‐Brown L, Lee IL, Longmore D, et al. Pregnancy and neonatal diabetes outcomes in remote Australia: the PANDORA study‐an observational birth cohort. Int J Epidemiol. 2019;48(1):307‐318. [DOI] [PubMed] [Google Scholar]
- 26. Australian Institute of Health and Welfare . The Health and Welfare of Australia's Aboriginal and Torres Strait Islander Peoples 2015. Cat. no. IHW 147. AIHW; 2015. [Google Scholar]
- 27. Azzopardi PS, Sawyer SM, Carlin JB, et al. Health and wellbeing of indigenous adolescents in Australia: a systematic synthesis of population data. Lancet. 2018;391(10122):766‐782. [DOI] [PubMed] [Google Scholar]
- 28. Haynes A, Kalic R, Cooper M, Hewitt JK, Davis EA. Increasing incidence of type 2 diabetes in indigenous and non‐indigenous children in Western Australia, 1990–2012. Med J Aust. 2016;204(8):303. [DOI] [PubMed] [Google Scholar]
- 29. Australian Institute of Health and Welfare . Diabetes in Pregnancy: Its Impact on Australian Women and Their Babies. Diabetes Series No. 14. AIHW; 2010. [Google Scholar]
- 30. Wood AJ, Boyle JA, Barr ELM, et al. Type 2 diabetes after a pregnancy with gestational diabetes among first nations women in Australia: the PANDORA study. Diabetes Res Clin Pract. 2021;181:109092. [DOI] [PubMed] [Google Scholar]
- 31. Titmuss A, Davis EA, O'Donnell V, et al. Youth‐onset type 2 diabetes among First Nations young people in northern Australia: a retrospective, cross‐sectional study. Lancet Diabetes Endocrinol. 2022;10(1):11‐13. [DOI] [PubMed] [Google Scholar]
- 32. Hoffman L, Nolan C, Wilson JD, Oats JJ, Simmons D. Gestational diabetes mellitus—management guidelines. The Australasian Diabetes in Pregnancy Society. Med J Aust. 1998;169(2):93‐97. [DOI] [PubMed] [Google Scholar]
- 33. World Health Organization . Diagnostic Criteria and Classification of Hyperglycaemia First Detected in Pregnancy. World Health Organization; 2013. [PubMed] [Google Scholar]
- 34. Lowe WL, Lowe LP, Kuang A, et al. Maternal glucose levels during pregnancy and childhood adiposity in the hyperglycemia and adverse pregnancy outcome follow‐up study. Diabetologia. 2019;62(4):598‐610. [DOI] [PMC free article] [PubMed] [Google Scholar]
- 35. Crume TL, Ogden L, Daniels S, Hamman RF, Norris JM, Dabelea D. The impact of in utero exposure to diabetes on childhood body mass index growth trajectories: the EPOCH study. J Pediatr. 2011;158(6):941‐946. [DOI] [PMC free article] [PubMed] [Google Scholar]
- 36. Hammoud NM, Visser GHA, van Rossem L, Biesma DH, Wit JM, de Valk HW. Long‐term BMI and growth profiles in offspring of women with gestational diabetes. Diabetologia. 2018;61(5):1037‐1045. [DOI] [PMC free article] [PubMed] [Google Scholar]
- 37. Touger L, Looker HC, Krakoff J, Lindsay RS, Cook V, Knowler WC. Early growth in offspring of diabetic mothers. Diabetes Care. 2005;28(3):585‐589. [DOI] [PubMed] [Google Scholar]
- 38. Wang X, Martinez MP, Chow T, Xiang AH. BMI growth trajectory from ages 2 to 6 years and its association with maternal obesity, diabetes during pregnancy, gestational weight gain, and breastfeeding. Pediatr Obes. 2020;15(2):e12579. [DOI] [PubMed] [Google Scholar]
- 39. Schaefer‐Graf U, Napoli A, Nolan CJ, the Diabetic Pregnancy Study Group . Diabetes in pregnancy: a new decade of challenges ahead. Diabetologia. 2018;61(5):1012‐1021. [DOI] [PMC free article] [PubMed] [Google Scholar]
- 40. Hakanen T, Saha M, Salo M, et al. Mothers with gestational diabetes are more likely to give birth to children who experience early weight problems. Acta Paediatr. 2016;105(10):1166‐1172. [DOI] [PubMed] [Google Scholar]
- 41. Manerkar K, Harding J, Conlon C, McKinlay C. Maternal gestational diabetes and infant feeding, nutrition and growth: a systematic review and meta‐analysis. Br J Nutr. 2020;123(11):1201‐1215. [DOI] [PubMed] [Google Scholar]
- 42. Wicklow BA, Sellers EA, Sjharma AK, et al. Association of gestational diabetes and type 2 diabetes exposure in utero with the development of type 2 diabetes in First Nations and non–First Nations offspring. JAMA Pediatr. 2018;172(8):724‐731. [DOI] [PMC free article] [PubMed] [Google Scholar]
Associated Data
This section collects any data citations, data availability statements, or supplementary materials included in this article.
Supplementary Materials
Appendix S1 Supporting Information