

Abstract
Cannabis use disorder is frequent in schizophrenia patients, and it is associated with an earlier age of onset and poor schizophrenia prognosis. Serotonin 2A receptors (5‐HT2AR) have been involved in psychosis and, like Akt kinase, are known to be modulated by THC. Likewise, endocannabinoid system dysregulation has been suggested in schizophrenia. The presence of these molecules in blood makes them interesting targets, as they can be evaluated in patients by a minimally invasive technique. The aim of the present study was to evaluate 5‐HT2AR protein expression and the Akt functional status in platelet homogenates of subjects diagnosed with schizophrenia, cannabis use disorder, or both conditions, compared with age‐ and sex‐matched control subjects. Additionally, endocannabinoids and pro‐inflammatory interleukin‐6 (IL‐6) levels were also measured in the plasma of these subjects. Results showed that both platelet 5‐HT2AR and the active phospho (Ser473)Akt protein expression were significantly increased in schizophrenia subjects, whereas patients with a dual diagnosis of schizophrenia and cannabis use disorder did not show significant changes. Similarly, plasma concentrations of anandamide and other lipid mediators such as PEA and DEA, as well as the pro‐inflammatory IL‐6, were significantly increased in schizophrenia, but not in dual subjects. Results demonstrate that schizophrenia subjects show different circulating markers pattern depending on the associated diagnosis of cannabis use disorder, supporting the hypothesis that there could be different underlying mechanisms that may explain clinical differences among these groups. Moreover, they provide the first preliminary evidence of peripherally measurable molecules of interest for bigger prospective studies in these subpopulations.
Keywords: 5‐HT2AR, Akt, biomarkers, cannabis use disorder, dual diagnosis, endocannabinoids, IL‐6, schizophrenia
Schizophrenia subjects show different circulating markers pattern depending on the associated diagnosis of cannabis use disorder, supporting the hypothesis that there could be different underlying mechanisms that may explain clinical differences among these groups.
1. INTRODUCTION
Cannabis use disorder (CUD) occurs in up to 42% of subjects with schizophrenia (SZ) 1 and has been associated with a lower age of onset, more positive symptoms and higher frequency of hospitalizations compared with patients with schizophrenia without co‐morbid cannabis abuse. The most accepted theory is that daily use of high‐potency varieties of cannabis may trigger the onset of schizophrenia in vulnerable individuals. 2 However, alternative explanations, including self‐medication and common genetic underpinnings, are also a matter of debate.
Accumulating evidence has proven that both exogenous cannabinoids and imbalances in the endocannabinoid system are involved in the onset and development of mental disorders such as anxiety, depression or schizophrenia. The effects of cannabinoids in the brain are mainly mediated by the activation of the cannabinoid type 1 receptor (CB1R) that has a crucial role in the regulation of brain function and disease. In this way, a CB1R dysregulation has been demonstrated in schizophrenia. Additionally, serotonergic system plays a relevant role in psychiatric disorders, and a dysregulation of 5‐HT2A receptors (5HT2AR) has been also described in schizophrenia. In this context, it is known that cannabinoid signalling is able to regulate some serotonergic functions and, specifically, the signalling of 5‐HT2AR in the brain.
We have previously demonstrated that chronic THC increases cortical 5‐HT2AR functionality in rodents. 3 In addition, CB1R has been proposed to interact with 5‐HT2AR, and evidence suggests that this 5‐HT2AR/CB1 interaction may mediate some THC effects such as memory impairments. 4 , 5 Akt signalling seems to mediate also some of the effects of cannabinoids in the brain, and the Akt1 genotype (rs2494732) might play an important role in cannabis‐induced psychosis. 6 Chronic THC activates Akt in mouse brain, 3 , 7 and downstream effectors are suggested to underlie THC induced cognitive impairment 8 and modify 5‐HT2AR signalling 3 and functionality. 9
The endocannabinoid system (ECS) is known to play a crucial role in CNS development, synaptic plasticity and the homeostatic maintenance of cognitive, behavioural, emotional, developmental and physiological processes. The activation of CB1R in the brain leads to the modulation of neuronal excitability, which may be in part responsible for the psychoactive effects of exogenous cannabinoids. For this main reason, a wide number of studies have focused on the potential involvement of the ECS in the pathophysiology of a variety of psychiatric and neurological disorders. Moreover, it has been suggested that ECS dysregulation could be a consequence of the modified immune response observed in the course of schizophrenia. 10 In this context, interleukins are also influenced by endocannabinoids (ECs) acting at cannabinoid receptors in immune cells. 11
Considering all these previous findings, it can be proposed that cannabis use may induce regulatory effects in 5‐HT2AR and Akt proteins and in the ECS or interleukins status. Thus, the aim of our study was to evaluate if cannabis exerts different effects in schizophrenia patients, which would support the hypothesis suggesting clinical differences among patients with schizophrenia with and without cannabis use disorder.
2. MATERIALS AND METHODS
2.1. Subjects
Subjects who met inclusion criteria for schizophrenia (SZ), cannabis use disorder (CUD) or dual diagnosis of cannabis use disorder and schizophrenia (DUAL) based on Structured Clinical Interview for DSM‐IV or DSM‐IV‐TR (American Psychiatric Association, 1994, 2000) or ICD criteria (World Health Organization, 1993) were included in the study. Control subjects were recruited regarding sex and age matching criteria. Exclusion criteria for controls included any neuropsychiatric disease or any use of cannabis in the last 2 years prior to blood extraction. A blood toxicological screening was performed in all subjects to determine the presence of antipsychotics. All the subjects but one included in SZ and DUAL groups were under antipsychotic treatment and had detectable levels of antipsychotics (data not shown). Regarding the putative confounding effect of acute cannabis in the studies, DUAL patients were diagnosed with schizophrenia while consuming cannabis and the vast majority of them stopped cannabis use when started the therapy. Whereas CUD and DUAL patients were asked to stop cannabis use due to their psychiatric condition, THC, 11‐OH‐THC and CBD presence was assessed in the blood of all the subjects in order to evaluate the cannabis consumption status. THC presence was found in the blood of 15 CUD patients, 2 DUAL subjects and 1 SZ patient and in none of the controls (data not shown).
Table 1 includes demographic characteristics of the groups. Tables S1–S3 in Supplementary Information include further details as well as the antipsychotic treatment of all the cases included in the study. The cohort used for platelet extraction and western blot assays was later enlarged with more patients; this is the reason why the cohort used for ECs and IL‐6 quantification included more subjects. All the participants gave written, witnessed, informed consent for the participation in the study, which was approved by the corresponding Human Research Ethics Committee (University Cruces Hospital, code CEIC E14/43).
TABLE 1.
Demographic characteristics of the subjects included in the study
| CUD | Controls | SZ | Controls | Dual | Controls | |
|---|---|---|---|---|---|---|
| Number of subjects | 26 | 24 | 22 | 19 | 13 | 10 |
| Females | 5 | 5 | 9 | 9 | 1 | 0 |
| Males | 21 | 19 | 13 | 10 | 12 | 10 |
| Age (years) | 32.5 ± 1.9 | 32.8 ± 2.0 | 48.4 ± 1.8 | 49 ± 2.1 | 38.0 ± 2.9 | 37.3 ± 3.4 |
2.2. Blood collection
Blood samples (~20 ml) were extracted by venipuncture in citrate blood collection tubes (Becton Dickinson & Company, Franklin Lakes, NJ, USA). Blood was subsequently processed for plasma separation (5 ml) or platelet isolation (15 ml). Blood collection was carried out at the Drug Addiction unit of the Uribe Mental Health Centre (Getxo, Spain) and at the School of Medicine of the University of the Basque Country (Leioa, Spain).
2.3. Plasma preparation
For each subject, 5 ml of blood was used. Blood cells were removed from plasma centrifugation (15 min; 1,000–2,000×g, 4°C), the supernatant transferred into a polypropylene tube and stored at −70°C until assays.
2.4. Platelets isolation
A gradient density centrifugation with OptiprepTM (60% w/v iodixanol) Density Barrier Medium (Sigma‐Aldrich, St Louis, MO) was performed as previously described. 12 OptiPrepTM (5 vol.) was diluted with 0.85% (w/v) NaCl, 20 mM HEPES (free acid) and 1 mM EDTA (Na2O·2H2O) (22 vol.), to produce a 1.063 g/ml solution, pH 7.4. In 15 ml Falcon tubes (three for each subject), 5 ml of blood was layered over 5 ml of the density barrier solution and centrifuged at 350×g (15 min, 20°C) in a swinging‐bucket rotor and a deceleration‐without‐brake mode. The platelet‐containing band was then harvested and subjected to a second centrifugation (600×g, 5 min, 20°C) and the pellet stored at −70°C until assays.
2.5. Preparation of total homogenates of human platelets for western blot
Platelet pellets were washed twice with a buffer containing 0.85% (w/v) NaCl, 20 mM HEPES (free acid), 1 mM EDTA (Na2·2H2O). A total of 80 μl of buffer (50 mM Tris–HCl, 150 mM NaCl, pH 7,4; 5 μl/ml Protease Inhibitor Cocktail [Sigma], 10 μg/ml antipain, 10 μg/ml chymostatin, 1 mM Na3VO4, 1mM NaF) was added and the samples homogenized using a miniPotter. A buffer containing detergents (50 mM Tris–HCl, 150 mM NaCl, pH 7,4; 10% Igepal, 120 mM sodium deoxycholate, 30 mM SDS, 240 mM CHAPS) was then added (1:30 ratio). Samples were kept on ice for 30 min and were then centrifuged at 22,000×g, 4°C, 10 min, keeping supernatants and discarding pellets. Protein content was determined using DC‐method (BioRad), using bovine seroalbumin as a standard. Laemmli (20% v/v) and β‐mercaptoetanol (2,5% v/v) were added to 65 μg protein aliquots, and samples were stored at −70°C.
2.6. Western blot
Samples (30 μg) were heated (5 min, 95°C), loaded onto polyacrylamide gel (10%) and submitted to SDS‐PAGE. After transference, nitrocellulose membranes were blocked (5% non‐fat dry‐milk or/and 0.5% BSA) in TBS buffer followed by overnight incubation with primary antibodies (4°C). Antibodies against 5‐HT2AR, CB1R, Akt, phospho (Ser473)‐Akt and β‐actin were used (1:500–1:100.000 range). Finally, incubation with fluorescent‐anti‐IgG secondary antibodies (2 h) (1:7.500–1:15.000 range) was performed and immunoreactivity quantified using an LI‐COR‐Odyssey® Infrared‐Imaging System.
2.7. Quantification of endocannabinoids and lipid mediators in human plasma
The method used for this study was carried out following a previously described one 13 to quantify the two most common ECs, 2‐arachidonoylglycerol (2‐AG) and anandamide (AEA; N‐arachidonoyl ethanolamine) and five other endogenous lipid compounds: N‐linoleoylethanolamine (LEA), N‐palmitoylethanolamine (PEA), N‐oleoylethanolamine (OEA), docosatetraenylethanolamide (DEA) and N‐arachidonoyldopamine (NADA) in human plasma samples.
Briefly, 500 μl of plasma were transferred to a 2 ml Precellys tube and were spiked with 20 μl of IS solution, containing deuterated endocannabinoids and lipidic mediators in a concentration of 1.25 μg/ml in acetonitrile. For the extraction of the molecules, 1,000 μl of methyl tert‐butyl ether (HPLC grade, Lab‐Scan Analytical Science, Poland) were added to the tubes, and the mixture was homogenized in a Precellys 24 homogenizer coupled to a Cryolys (Bertin Technologies, France) at 4°C with three cycles of 20 s at 6,500 rpm and 20 s of rest between cycles. Samples were centrifuged in an Allegra X‐30R centrifugator (Beckam Coulter, USA) (1,200 rpm, 5 min, 4°C). The organic layer was separated and evaporated to dryness under nitrogen (% 99.999, Messer, Germany) using a XcelVap evaporator (Horizon Technology, USA). Finally, the samples were reconstituted in 200 μl acetonitrile (ChromAR HPLC grade, Macron Fine Chemicals, USA) and filtered with 0.22 μm polypropylene discs prior to HPLC‐MS analysis. Finally, 5 μl of the final acetonitrile solution was injected into the chromatographic system, and the content of the metabolites of interest was determined by external calibration.
For the preparation of IS solution and external calibration solutions the following standards were purchased from Cayman Chemicals (USA): 1‐AG (95%, 9:1 mixture of 1‐AG and 2‐AG), 2‐AG (95%, 9:1 mixture of 2‐AG and 1‐AG), NADA (98%), LEA (98%), OEA (98%), PEA (98%), AEA (98%), DEA (98%), NADA‐d8 (% 99), PEA‐d4 (99%), 2‐AG‐d8 (99%), AEA‐d8 (99%).
The chromatographic set up included a 1290 Infinity II liquid chromatograph (Agilent Technologies, USA) coupled to a 6430 Triple Quad LC/MS (Agilent Technologies, USA) mass spectrometer. A Kinetex C18 precolumn 3 mm × 5 mm (Phenomenex, USA) and a Kinetex C18 column 15 × 3 mm, 2.6 μm (Phenomenex, USA) were used to provide the chromatographic separation of analytes.
2.8. Chromatographic method and mass spectrometer conditions for the HPLC‐MS analysis
The mobile phases used for the separation of analytes were (A) Water (UHPLC–MS grade, Scharlab, Spain) with 0.1% formic acid (Fischer Scientifics, USA) and (B) MeOH (UHPLC–MS grade, Scharlab, Spain) with 0.1% formic acid. The flow was 0.3 ml/min, and the column was at 35°C. The details of the chromatographic gradient are shown in Table S4. The mass analysis was performed with an electrospray ionization source operating in positive mode (ESI+). N2 was used as drying gas, nebulization and collision gas, with a flow of 12 L/h, a temperature of 350°C and a pressure of 30 psi, and the capillary voltage was of 2,878 V. The precursor ion and product ions of the measured analytes were determined by individual analysis of each of the standards. At the same time, optimum fragmentor voltage, between 20–200 V; collision energy, between 5–45 eV; and cell accelerator voltage were determined. For this purpose, Optimizer software was employed (MassHunter, Agilent Technologies, USA) and precursor ion, product ions and ionization conditions of highest abundance were chosen as optimum. The chosen conditions for the analysis of each endocannabinoid are summarized in Table S5, together with the retention times of each of them.
2.9. Plasmatic IL‐6 quantification
Enzyme‐linked immunosorbent assays (ELISA) were used to identify and quantify IL‐6 in plasma samples (IL‐6 Human ELISA Kit, High Sensitivity; BMS213HS, eBioscience, San Diego, CA, USA). No dilution was performed, and the absorption peak was at 450 nm. Results are shown as pg/ml, and the assay had a sensitivity of 0.03 pg/ml (assay range 0.08–5.0 pg/ml). The inter‐assay coefficient was 6% and an overall intra‐assay coefficient of 4.9%.
2.10. Data analysis and statistical procedure
Experiments were performed under a paired design where each case and the respective matched control were always processed simultaneously. For the western blot assays in platelets, the immunoreactivity values of the target proteins were corrected by the corresponding value of β‐actin and calculated as the percentage of a standard sample loaded in every single gel to control for inter‐assay variability. Data were standardized considering the mean value of the all the control samples as 100%. For every experiment, data were inspected for outliers using Grubb's tests. Graph Pad Prism™ version 9.0 (Graph Pad Software, San Diego, CA, USA) program was used to carry out statistical analyses. A two‐way analysis of variance (ANOVA) was used to evaluate the effects of schizophrenia and cannabis use disorder and the potential interaction between both of them. Tukey's test was used in post hoc analyses to evaluate the differences between groups. The matched control values of the three experimental groups were pooled together as they did not differ in the mean values of any of the proteins evaluated. Individual values are shown as scatterplots, and bars represent mean ± SEM. The level of significance was p < 0.05.
3. RESULTS
3.1. 5HT2AR protein expression in platelets of cannabis use disorder subjects, schizophrenia subjects with and without cannabis use disorder and matched controls
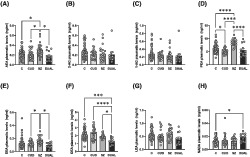
In order to quantify the protein expression of 5‐HT2AR, immunodetection with a specific antibody was performed. 3 Significant differences in 5‐HT2AR immunoreactivity between schizophrenia and control subjects were tested simultaneously along with the effect of cannabis use by means of a two‐way ANOVA (Table 2). These analyses indicated that SZ diagnosis exerted a significant effect in 5‐HT2AR immunoreactivity and that CUD effect was different in this clinical population (two‐way ANOVA: SZ × CUD; F[1, 69] = 15.25, *p < 0.001). Subsequent posthoc analyses showed that CUD (+35 ± 12% vs. controls, *p < 0.05) and SZ subjects (+59 ± 12% vs. controls, **** p < 0.0001), but not DUAL subjects, displayed significantly higher 5‐HT2AR protein immunoreactivity in platelets homogenates when compared with control subjects (Figure 1A).
TABLE 2.
Summary of two‐way ANOVA analysis to test the effect of schizophrenia, cannabis use disorder and the potential interaction between both in protein expression levels in platelets
| Protein | Source of variation | DF | F | p |
|---|---|---|---|---|
| 5‐HT2AR | Schizophrenia | 1 | 5.388 | 0.0232 * |
| Cannabis use disorder | 1 | 0.03270 | 0.8570 | |
| Interaction | 1 | 15.25 | 0.0002 * | |
| Residual | 69 | |||
| CB1R | Schizophrenia | 1 | 19.53 | <0.0001 * |
| Cannabis use disorder | 1 | 16.39 | 0.0002 * | |
| Interaction | 1 | 11.11 | 0.0015 * | |
| Residual | 55 | |||
| Akt | Schizophrenia | 1 | 4.391 | 0.0400 * |
| Cannabis use disorder | 1 | 0.2388 | 0.6267 | |
| Interaction | 1 | 0.9649 | 0.3296 | |
| Residual | 65 | |||
| P (Ser473)‐Akt | Schizophrenia | 1 | 0.3967 | 0.5311 |
| Cannabis use disorder | 1 | 5.959 | 0.0175 * | |
| Interaction | 1 | 7.000 | 0.0103 * | |
| Residual | 62 |
Note: Significant p values (*p < 0.05) are shown in bold
FIGURE 1.

5‐HT2A, CB1 receptors and Akt total and phosphorylated form protein expression in platelets of cannabis use disorder subjects, schizophrenia subjects with and without cannabis use disorder and matched controls. (A) 5‐HT2AR immunodensity values in platelet homogenates of patients with cannabis use disorder (CUD; n = 14), schizophrenia patients (SZ n = 14), patients with both diagnoses (DUAL n = 8) and controls (C; n = 37). (B) CB1R immunoreactivity in platelet homogenates of patients with CUD (n = 10), SZ (n = 12), DUAL (n = 7) and controls (C; n = 30). (C) Akt immunoreactivity in platelet homogenates of patients with CUD (n = 14), SZ (n = 13), DUAL (n = 7) and controls (n = 35). (D) Phospho (Ser473)Akt immunoreactivity in platelets homogenates of patients with CUD (n = 12), SZ (n = 12), DUAL (n = 7) and controls (n = 35). Tukeys's post hoc comparisons: *p < 0.05, **** p < 0.0001. Bars represent mean ± SEM of normalized individual values depicted in points.
3.2. CB1R protein expression in platelets of cannabis use disorder subjects, schizophrenia subjects with and without cannabis use disorder and matched controls
In order to investigate the CB1R protein expression, immunodetection with a specific antibody was performed. Significant differences in CB1R levels between schizophrenia and control subjects were tested simultaneously along with the effect of cannabis use by means of a two‐way ANOVA (Table 2). These analyses showed a significant effect of both cannabis use disorder and schizophrenia diagnosis, as well as an interaction between both factors (two‐way ANOVA: SZ x CUD; F[1, 55] = 11.11, *p < 0.01; Table 2).
Subsequent post‐hoc analyses showed that the CB1R protein immunoreactivity in platelet homogenates was significant decrease in all groups, CUD (−62 ± 2% vs. C, **** p < 0.0001), SZ (−64 ± 4% vs. C, **** p < 0.0001) and DUAL (−70 ± 4% vs. C, **** p < 0.0001) when compared to controls (Figure 1B).
3.3. Akt and phospho (Ser473)‐Akt protein expression in platelets of cannabis use disorder subjects, schizophrenia subjects with and without cannabis use disorder and matched controls
We also evaluated the Akt protein expression in both its total form and its active phosphorylated phospho (Ser473)‐Akt form with specific antibodies. 3 Again, significant differences in both protein levels between schizophrenia and control subjects were tested simultaneously along with the effect of cannabis use disorder by means of a two‐way ANOVA (Table 2). Analyses indicated lower total Akt protein expression in SZ than in controls. Furthermore, these analyses also showed that CUD exerted a different effect in patients also diagnosed with SZ (two‐way ANOVA: SZ x CUD; F[1, 62] = 7; *p < 0.05; Table 2). Posthoc analyses showed that SZ subjects displayed higher levels of the active phosphorylated form phospho (Ser473)‐Akt than controls, and that DUAL subjects expressed significantly lower levels than SZ.
When examining the differences in each group, platelet homogenates from SZ subjects showed a decrease in total Akt immunoreactivity (−59 ± 7% vs. controls, *p < 0.05) (Figure 1C). Moreover, an increase in phospho (Ser473)‐Akt immunoreactivity was found in platelets of SZ (+45 ± 21% vs. controls, *p < 0.05), comparing to controls; while a significant decrease in DUAL (−70 ± 8% vs. SZ, *p < 0.05) (Figure 1D), compared to SZ subjects.
3.4. Endocannabinoids and other lipid mediators levels in plasma of cannabis use disorder subjects, schizophrenia subjects with and without cannabis use disorder and matched controls
Significant differences in ECs levels between schizophrenia and control subjects were tested simultaneously along with the effect of cannabis use disorder by means of a two‐way ANOVA (Table 3). These analyses indicated that SZ condition significantly influences the circulating levels of PEA and OEA. Interestingly, CUD and SZ diagnoses exerted a significant interaction in the plasmatic levels of half of the evaluated lipids (AEA: SZ × CUD; F(1, 107) = 5.54; *p < 0.05; PEA: SZ × CUD; F(1, 107) = 5.68; *p < 0.05; DEA: SZ × CUD; F(1, 102) 4.44; *p < 0.05; OEA: SZ × CUD; F(1, 108) = 8.03; *p < 0.01). A significant effect of cannabis use disorder was also found for AEA, PEA, DEA, LEA and NADA (Table 3).
TABLE 3.
Summary of two‐way ANOVA analysis to test the effect of schizophrenia, cannabis use disorder and the potential interaction between both in ECs and other lipid mediators levels
| EC | Source of variation | DF | F | p |
|---|---|---|---|---|
| AEA | Schizophrenia | 1 | 1.800 | 0.1825 |
| Cannabis use disorder | 1 | 6.301 | 0.0136 * | |
| Interaction | 1 | 5.543 | 0.0204 * | |
| Residual | 107 | |||
| 2‐AG | Schizophrenia | 1 | 0.7552 | 0.3868 |
| Cannabis use disorder | 1 | 1.156 | 0.2848 | |
| Interaction | 1 | 0.2753 | 0.6009 | |
| Residual | 105 | |||
| 1‐AG | Schizophrenia | 1 | 0.6946 | 0.4065 |
| Cannabis use disorder | 1 | 0.4232 | 0.5168 | |
| Interaction | 1 | 0.2315 | 0.6314 | |
| Residual | 106 | |||
| PEA | Schizophrenia | 1 | 14.63 | 0.0002 * |
| Cannabis use disorder | 1 | 34.62 | <0.0001 * | |
| Interaction | 1 | 5.681 | 0.0189 * | |
| Residual | 107 | |||
| DEA | Schizophrenia | 1 | 0.4510 | 0.5034 |
| Cannabis use disorder | 1 | 9.007 | 0.0034 * | |
| Interaction | 1 | 4.435 | 0.0377 * | |
| Residual | 102 | |||
| OEA | Schizophrenia | 1 | 22.32 | <0.0001 * |
| Cannabis use disorder | 1 | 3.457 | 0.0657 | |
| Interaction | 1 | 8.026 | 0.0055 * | |
| Residual | 108 | |||
| LEA | Schizophrenia | 1 | 0.8670 | 0.3539 |
| Cannabis use disorder | 1 | 6.311 | 0.0135 * | |
| Interaction | 1 | 1.486 | 0.2256 | |
| Residual | 106 | |||
| NADA | Schizophrenia | 1 | 2.591 | 0.1105 |
| Cannabis use disorder | 1 | 5.157 | 0.0252 * | |
| Interaction | 1 | 2.724 | 0.1018 | |
| Residual | 106 |
Note: Significant p values (*p < 0.05) are shown in bold.
When examining the differences in ECs between the different group by post‐hoc analyses, a significant increase in AEA levels was found in SZ subjects compared to controls (*p < 0.05), CUD (*p < 0.05) and DUAL subjects (*p < 0.05) (Figure 2A), while no changes were found in the levels of 2‐AG (Figure 2B) or 1‐AG (Figure 2C). Moreover, PEA levels were also significantly increased in SZ subjects compared to controls (**** p < 0.0001), CUD (**** p < 0.0001) and DUAL subjects (**** p < 0.0001), while significantly decreased in CUD patients compared to controls (*p < 0.05) (Figure 2D). For DEA, differences were found between SZ and CUD (*p < 0.05), as well as SZ and DUAL (*p < 0.05), although no changes were found between SZ and controls (Figure 2E). On the contrary, OEA levels in DUAL patients significantly decreased when compared with all the others groups (***p < 0.005 for DUAL vs. C; **** p < 0.0001 DUAL vs. CUD; and *p < 0.05 DUAL vs. SZ) (Figure 2F). No changes were found in LEA levels (Figure 2G). Finally, a significant increase was found in NADA levels in DUAL subjects compared to controls (*p < 0.05) (Figure 2H).
FIGURE 2.
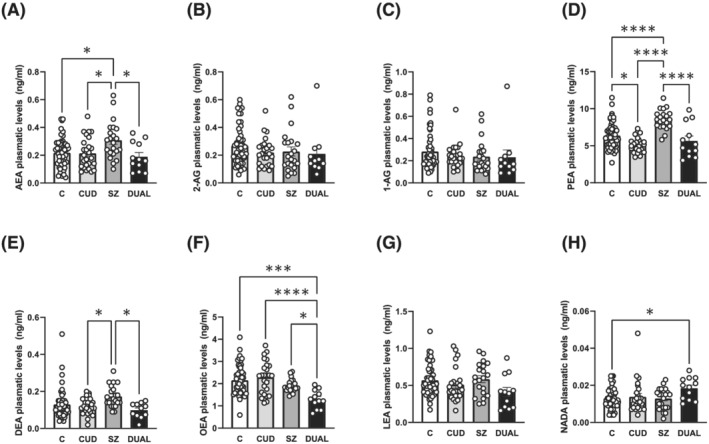
Plasmatic levels of endocannabinoids and other lipid mediators in cannabis use disorder subjects, schizophrenia subjects with and without cannabis use disorder and matched controls. (A) AEA plasmatic levels in patients with CUD (n = 26), SZ (n = 22), DUAL (n = 12) and controls (n = 51). (B) 2‐AG plasmatic levels in patients with CUD (n = 25), SZ (n = 22), DUAL (n = 11) and controls (n = 51). (C) 1‐AG plasmatic levels in patients with CUD (n = 25), SZ (n = 22), DUAL (n = 11) and controls (n = 52). (D) PEA plasmatic levels in patients with CUD (n = 26), SZ (n = 21), DUAL (n = 12) and controls (n = 52). (E) DEA plasmatic levels in patients with CUD (n = 26), SZ (n = 21), DUAL (n = 11) and controls (n = 51). (F) OEA plasmatic levels in patients with CUD (n = 26), SZ (n = 22), DUAL (n = 12) and controls (n = 52). (G) LEA plasmatic levels in patients with CUD (n = 25), SZ (n = 21), DUAL (n = 12) and controls (n = 52). (H) Plasmatic levels of NADA in patients with CUD (n = 25), SZ (n = 22), DUAL (n = 12) and controls (n = 51). Tukeys's post hoc comparisons: *p < 0.05, ***p < 0.001, **** p < 0.0001. Bars represent mean ± SEM of individual values depicted in points.
3.5. Inflammatory cytokine IL‐6 levels in plasma of cannabis use disorder subjects, schizophrenia subjects with and without cannabis use disorder and matched controls
Significant differences in IL‐6 levels between schizophrenia and control subjects were tested simultaneously along with the effect of cannabis use disorder by means of a two‐way ANOVA. These analyses indicated, on one hand, that both conditions exerted a significant individual effect in circulating IL‐6 levels and, on the other hand, that their effects interact between each other (SZ effect, F(1, 86) = 14.11, **p < 0.005; CUD effect F(1, 86) = 6.912, *p < 0.05, interaction, F(1, 86) = 12.44, **p < 0.005). When examining the differences in IL‐6 levels between the different groups, a significant increase was found in SZ patients (**** p < 0.0001 for SZ vs. CUD and vs. controls; ***p < 0.0005 for SZ vs. DUAL), while levels in CUD and DUAL subjects remained unchanged (Figure 3).
FIGURE 3.

Pro‐inflammatory cytokine IL‐6 plasmatic levels in cannabis use disorder subjects, schizophrenia subjects with and without cannabis use disorder and matched controls. IL‐6 plasmatic levels in patients with CUD (n = 18), SZ (n = 23), DUAL (n = 13) and controls (n = 36). Tukeys's post hoc comparisons: ***p < 0.001, **** p < 0.0001. Bars represent mean ± SEM of individual values depicted in points.
4. DISCUSSION
Our results show, for the first time, that cannabis use may differently modulate circulating molecules in schizophrenia subjects. Platelets have been extensively used as a peripheral cellular model for the analysis of molecular pathways related to neuropsychiatric disorders. 14 Platelets have some similarities with neurons, such as serotonin (5‐HT) uptake and storage mechanisms, serotonin 2A receptors (5‐HT2AR), Akt and other signalling proteins, and other receptors and enzymes largely studied in relation with psychiatric disorders. These features, along with their accessibility, turn platelets into an attractive tissue sample for the study of pathophysiological processes relevant to psychiatric disorders, including schizophrenia.
5‐HT2AR are abundantly expressed in the human brain cortex, and they are also present in blood platelets, where mediate 5‐HT induced platelet aggregation. Both postmortem brain and platelet studies in schizophrenia patients have shown controversies regarding 5‐HT2AR protein expression or density. 15 , 16 , 17 , 18 , 19 We found that platelets from SZ patients, as well as CUD patients, have increased 5‐HT2AR protein expression. The enhanced 5‐HT2AR protein expression agrees with the vast majority of previous literature carried out in platelets 16 , 17 , 20 , 21 , 22 as well as with some studies in postmortem brain of subjects with schizophrenia. 18 , 23 Importantly, all the schizophrenia subjects included in our study were under treatment with antipsychotics, and the pharmacological treatment is supposed to be one of the main confounding factor in studies addressing 5‐HT2AR in schizophrenia. In this sense, the effect of chronic treatment with antipsychotics in the density of these receptors is controversial. Studies in platelets have suggested that either an increase, 17 , 20 a decrease 16 or no changes 21 , 22 occurs after chronic treatment with antipsychotics of different nature.
Despite this controversy, studies addressing 5‐HT2AR density in drug‐free subjects with schizophrenia have demonstrated that this upregulation occurs in both platelets and brain cortex independently of antipsychotic treatment. 17 , 23 These observations suggest that platelets may reflect similar alterations than those occurring in the brain of subjects with schizophrenia. Future longitudinal studies addressing the effect of different antipsychotic treatments in platelet 5‐HT2AR expression would help to ascertain whether our observations are due to schizophrenia pathology or pharmacological treatment.
The only previous study carried out in humans evaluating 5‐HT2AR in the context of schizophrenia and cannabis abuse found an enhanced number of CB1R‐5‐HT2AR heteromers in olfactory neuroepithelial cells from cannabis users. 24 While this study did not evaluate 5‐HT2AR protein expression, it can be understood as an indirect evidence of an increased number of 5‐HT2AR resulting in more heteromers. Moreover, it has been described that subchronic treatment with a cannabinoid agonist, such as CP55,940, enhance 5‐HT2AR protein expression in rat brain. 25 In platelets, this receptor plays a key role in coagulation processes, and the upregulation of platelets 5‐HT2AR in patients with CUD shown in this study is in line with some case reports showing pro‐thrombotic adverse effects of chronic cannabis intake. 26
An interesting finding of the present study is that while platelets from both SZ and CUD subjects show a significant increase in 5‐HT2AR protein expression, DUAL subjects do not show this increase. Whereas the mechanisms through which these upregulations occur in the platelets are unknown, a plausible hypothesis is that increased platelet 5‐HT2AR underlying SZ occurs through a mechanism that differs from the one responsible for the increased platelet 5‐HT2AR seen in CUD subjects without SZ.
In this context, it is possible to speculate that chronic cannabis may be modulating some alterations naturally occurring in schizophrenia. This hypothesis is in line with previous evidence showing that cannabinoid agonists exert different effects in animal models of schizophrenia‐like behaviour and with human evidence showing that compounds modulating the endocannabinoid system may be effective in schizophrenia. 27 Indeed, a recent study has also shown that regular cannabis use exerts opposite effects regarding lipid and protein composition and DNA methylation in olfactory neuroepithelial cells of patients with schizophrenia. 28
A general decrease in CB1R protein expression was also observed in the three case groups assessed compared to controls. The downregulation of CB1R is a plausible effect of the chronic activation of the receptor in chronic cannabis users (CUD). Moreover, several studies have reported alterations on CB1R availability, density and/or mRNA expression in patients with schizophrenia but with different outcomes 29 depending on the tissue (brain, blood etc.), technique used (PET, western blot, flow cytometry, etc.) and the presence or not of antipsychotic medication. For example, a decrease in CB1R protein expression has been reported in postmortem brain of schizophrenia patients under antipsychotic treatment. 30 On the contrary, an increased expression of CB1R in peripheral leukocytes cells of schizophrenia patients treated with antipsychotics has been also reported. 31
Results from this study demonstrated that platelets from patients with schizophrenia show a decrease in total Akt protein expression and an increased expression of phospho (Ser473)‐Akt. As far as we know, this is the first study addressing Akt status in platelets from patients with schizophrenia. Interestingly, literature evaluating Akt status in human brain from subjects with schizophrenia has also reported decreased Akt protein expression. 32 Evidence from gene‐deletion and Akt inhibition studies in mice, and human genetic association studies all suggest that Akt regulates platelet function. 33 Whereas the role of Akt in platelets differs from that in the brain, our findings suggest that this kinase could show a similar status in both tissues. Thus, it would represent an interesting target in order to develop longitudinal studies addressing Akt functionality along different stages of the disease as well as putative modulations due to pharmacological treatment.
Like 5‐HT2AR, phospho (Ser473)‐Akt did not show any significant alteration when SZ patients were also diagnosed with CUD. Indeed, platelets of subjects with CUD had similar phospho (Ser473)‐Akt immunoreactivity compared to controls, and the cannabis use disorder seemed to normalize phospho (Ser473)‐Akt expression in SZ patients. In this regard, acute administration of THC increases the phosphorylation of Akt and several downstream kinases in multiple brain areas. 7 Moreover, the activation of this pathway in the brain cortex has been involved in chronic THC‐induced memory impairment 34 and 5‐HT2AR signalling modulation 3 in animals. Additionally, the polymorphism variant (rs2494732) of AKT1 gene is known to moderate both short‐term psychotomimetic effects of cannabis use in high‐risk population 35 and the risk of being diagnosed with a psychotic disorder when having used cannabis. 6 Furthermore, it has been proposed that acute psychotomimetic symptoms of cannabis use could be predicted by that AKT1 polymorphism in healthy young cannabis smokers. 36 This evidence clearly points out that Akt is an important mediator of cannabis deleterious effects. However, to our knowledge, to date, there are no other studies evaluating the Akt protein expression in schizophrenia patients with cannabis use disorder.
Our results suggest that cannabis abuse may modulate Akt kinase in patients with SZ, where it is in a hyper‐functional status. Interestingly, the downstream substrate of Akt pathway, ribosomal S6 kinase 2 (S6K2) interacts with 5‐HT2AR modulating its functionality. 9 Indeed, neuronal ablation of phospho (Ser473)‐Akt has been associated with an altered 5‐HT2AR expression and functionality. 37 More recently, we have demonstrated that the rapamycin‐induced inhibition of Akt and downstream kinases prevents the modulation of 5‐HT2AR functionality induced by chronic THC. 3 Future human studies assessing 5‐HT2AR functionality would be interesting in order to ascertain whether Akt pathway is directly involved in these modulations in vivo.
Additionally, alterations in the endocannabinoid system have been implicated in the pathophysiology of schizophrenia. Our results showing an increase in AEA circulating levels in schizophrenia patients are in line with previous studies reporting an increase of AEA in both blood 10 and cerebrospinal fluid (CSF). However, it has been also reported a decrease in AEA levels in postmortem brain of schizophrenia subjects. 38 Regarding this, the high expression in the blood–brain barrier of the anandamide‐hydrolyzing enzyme fatty acid amide hydrolase (FAAH) could explain discrepancies between plasma and brain AEA levels. 39 , 40 Additionally, different cohorts, methodologies and clinical confounders may be factors underlying these observed opposite results.
Interestingly, plasmatic AEA levels remained unchanged in those patients with CUD and with a DUAL diagnosis. These results are in line with those reported in a study in which AEA levels were evaluated in CSF of schizophrenia patients with cannabis use. 41 In that study, authors did not find any change in serum but found that CSF anandamide levels were not affected by cannabis use in subjects without a diagnosis of schizophrenia nor in schizophrenia subjects with a high‐frequency cannabis use. Our data suggest that cannabis may modulate anandamide signalling in schizophrenia, a pathological situation in which levels of AEA seem to be increased.
On the contrary, no changes were found in the plasmatic levels of 2‐AG or its isomer 1‐AG in none of the groups evaluated. This may be due to the distinct synthesis, transport and degradation processes of 2‐AG and AEA. Regarding this, there are several findings of opposing regulation for 2‐AG and AEA levels under both physiological and pathological conditions. 38 , 42 Similar results were found for PEA and DEA plasmatic levels, for which an increase was found in patients with schizophrenia but not for CUD or DUAL subjects. Regarding PEA, it has been reported an increase in CSF 43 and a decrease in postmortem brain in schizophrenia subjects. 38 On the other hand, a decrease in OEA levels in DUAL subjects has been found. Again, it seems that cannabis may modulate the signalling of these lipid mediators only under a pathological condition when the latter are altered. In this context, it has been suggested that this ECS dysregulation could be a consequence of the modified immune response observed in the course of schizophrenia. 10 Inflammatory and immune system alterations have been strongly linked to psychotic disorders. Activated immune cells release significant amounts of endocannabinoids, 44 and it is possible to speculate that these blood cells somehow contribute to the elevated levels of AEA in patients with a diagnosis of schizophrenia. In the last years, particular attention has focused on interleukin‐6 (IL‐6) and its correlation with psychotic symptom severity. Several evidences suggest that endocannabinoids participate in the fine regulation of homeostasis of the immune system, both in physiological and pathological conditions, exerting mainly anti‐inflammatory and immunosuppressive effects. 45 Thus, it has been proposed as a potential marker of high‐risk for psychosis. 46 A recent metaanalysis did not show a significant effect of cannabinoids on IL‐6 after chronic cannabis use, in spite of it is believed that these drugs are protective against inflammation and seems to actively reduce the IL‐6 in macrophages. 47 It has neither been seen any alteration in inflammatory markers when first‐episode psychosis patients who were cannabis users were studied. 48 Nonetheless, our data showing that cannabis use disorder decrease IL‐6 levels in schizophrenia subjects are in line with the few available studies suggesting that cannabis use reduces IL‐6 levels. 49
Globally, our results suggest that cannabinoids may directly regulate 5‐HT2AR and phospho (Ser473)Akt protein levels, which are dysregulated in platelets of schizophrenia subjects. Moreover, it has been proposed that 5‐HT2A receptor activation also leads to the formation and release of endocannabinoids. 50 This could be, in part, responsible of the changes observed in the ECs levels depending on the presence or absence of a diagnosis of schizophrenia and/or cannabis use disorder. Moreover, as it has been previously explained, the increased IL‐6 observed in schizophrenia could also be responsible of these changes in ECs levels.
In summary, the present work demonstrates that schizophrenia subjects show different circulating markers pattern depending on the cannabis use disorder and are in line with the hypothesis suggesting clinical differences among groups. This work might have clinical interest since results may be useful for the development of new biomarkers in blood of subjects with schizophrenia and for the management of different clinical subgroups.
CONFLICT OF INTEREST
The authors declare that they have no conflict of interest.
AUTHORS CONTRIBUTIONS
L.U. and L.F.C designed the experiments. B.M. and M.A.L recruited the subjects, and R.B.‐B. collected blood samples. I.I‐L., P.U‐L., I.H., N.E. and A.V. performed the experiments. L.U., I.I.‐L., J.J.M. and L.F.C. analysed the data, and I.I.‐L. and L.U. wrote the manuscript. All the co‐authors gave their final approval of this manuscript.
Supporting information
Data S1. Supporting Information
Table S1. Demographic characteristics of subjects with cannabis use disorder and matched controls.
Table S2. Demographic characteristics and antipsychotic treatment of subjects with schizophrenia and matched controls.
Table S3. Demographic characteristics and antipsychotic treatment of subjects with dual diagnostic and matched controls.
Table S4. Solvent A composition change in the chromatographic method.
Table S5. Retention times and chosen precursor ions, product ions, fragmentor voltages and collision energies for each of the measured analytes.
ACKNOWLEDGEMENTS
The authors thank the staff of the Uribe Mental Health Center (Osakidetza‐Basque Health Service) for sample recruitment, Virginia Luque for technical assistance and patients and controls for kindly participating in the study. The authors also thank technical and human support provided by Central Service of Analysis de Alava –SGIker‐ of UPV/EHU. This study is funded by the Spanish Ministry of Science and Innovation (PID2019‐106404RB‐I00), Spanish Ministry of Health (Ministerio de Sanidad PNSD 2019I021) and Basque Government (Eusko Jaurlaritza, 2019111082, ITIT1211‐19 and IT1512/22).
Ibarra‐Lecue I, Unzueta‐Larrinaga P, Barrena‐Barbadillo R, et al. Cannabis use selectively modulates circulating biomarkers in the blood of schizophrenia patients. Addiction Biology. 2022;27 (6): e13233. doi: 10.1111/adb.13233
DATA AVAILABILITY STATEMENT
The data that support the findings of this study are available from the corresponding author upon reasonable request.
REFERENCES
- 1. Henquet C, Murray R, Linszen D, van Os J. The environment and schizophrenia: the role of cannabis use. Schizophr Bull. 2005;31(3):608‐612. doi: 10.1093/schbul/sbi027 [DOI] [PubMed] [Google Scholar]
- 2. Marconi A, di Forti M, Lewis CM, Murray RM, Vassos E. Meta‐analysis of the association between the level of cannabis use and risk of psychosis. Schizophr Bull. 2016;42(5):1262‐1269. doi: 10.1093/schbul/sbw003 [DOI] [PMC free article] [PubMed] [Google Scholar]
- 3. Ibarra‐Lecue I, Mollinedo‐Gajate I, Meana JJ, Callado LF, Diez‐Alarcia R, Uriguen L. Chronic cannabis promotes pro‐hallucinogenic signaling of 5‐HT2A receptors through Akt/mTOR pathway. Neuropsychopharmacology. 2018;43(10):2028‐2035. doi: 10.1038/s41386-018-0076-y [DOI] [PMC free article] [PubMed] [Google Scholar]
- 4. Vinals X, Moreno E, Lanfumey L, et al. Cognitive impairment induced by Delta9‐tetrahydrocannabinol occurs through heteromers between cannabinoid CB1 and serotonin 5‐HT2A receptors. PLoS Biol. 2015;13(7):e1002194. doi: 10.1371/journal.pbio.1002194 [DOI] [PMC free article] [PubMed] [Google Scholar]
- 5. Galindo L, Moreno E, López‐Armenta F, et al. Cannabis users show enhanced expression of CB1‐5HT2A receptor heteromers in olfactory neuroepithelium cells. Mol Neurobiol. 2018;55(8):6347‐6361. doi: 10.1007/s12035-017-0833-7 [DOI] [PubMed] [Google Scholar]
- 6. di Forti M, Iyegbe C, Sallis H, et al. Confirmation that the AKT1 (rs2494732) genotype influences the risk of psychosis in cannabis users. Biol Psychiatry. 2012;72(10):811‐816. doi: 10.1016/j.biopsych.2012.06.020 [DOI] [PubMed] [Google Scholar]
- 7. Ozaita A, Puighermanal E, Maldonado R. Regulation of PI3K/Akt/GSK‐3 pathway by cannabinoids in the brain. J Neurochem. 2007;102(4):1105‐1114. doi: 10.1111/j.1471-4159.2007.04642.x [DOI] [PubMed] [Google Scholar]
- 8. Puighermanal E, Busquets‐Garcia A, Gomis‐Gonzalez M, Marsicano G, Maldonado R, Ozaita A. Dissociation of the pharmacological effects of THC by mTOR blockade. Neuropsychopharmacology. 2013;38(7):1334‐1343. doi: 10.1038/npp.2013.31 [DOI] [PMC free article] [PubMed] [Google Scholar]
- 9. Strachan RT, Sciaky N, Cronan MR, Kroeze WK, Roth BL. Genetic deletion of p90 ribosomal S6 kinase 2 alters patterns of 5‐hydroxytryptamine 2A serotonin receptor functional selectivity. Mol Pharmacol. 2010;77(3):327‐338. doi: 10.1124/mol.109.061440 [DOI] [PMC free article] [PubMed] [Google Scholar]
- 10. de Marchi N, de Petrocellis L, Orlando P, Daniele F, Fezza F, di Marzo V. Endocannabinoid signalling in the blood of patients with schizophrenia. Lipids Health Dis. 2003;2:5. doi: 10.1186/1476-511X-2-5 [DOI] [PMC free article] [PubMed] [Google Scholar]
- 11. Klein TW, Newton CA, Friedman H. Cannabinoids and the immune system. Pain Res Manag. 2001;6(2):95‐101. doi: 10.1155/2001/326867 [DOI] [PubMed] [Google Scholar]
- 12. Bagamery K, Kvell K, Barnet M, Landau R, Graham J. Are platelets activated after a rapid, one‐step density gradient centrifugation? Evidence from flow cytometric analysis. Clin Lab Haematol. 2005;27(1):75‐77. doi: 10.1111/j.1365-2257.2004.00662.x [DOI] [PubMed] [Google Scholar]
- 13. Hauer D, Schelling G, Gola H, et al. Plasma concentrations of endocannabinoids and related primary fatty acid amides in patients with post‐traumatic stress disorder. PLoS ONE. 2013;8(5):e62741. doi: 10.1371/journal.pone.0062741 [DOI] [PMC free article] [PubMed] [Google Scholar]
- 14. Asor E, Ben‐Shachar D. Platelets: a possible glance into brain biological processes in schizophrenia. World J Psychiatry. 2012;2(6):124‐133. doi: 10.5498/wjp.v2.i6.124 [DOI] [PMC free article] [PubMed] [Google Scholar]
- 15. Laruelle M, Abi‐Dargham A, Casanova MF, Toti R, Weinberger DR, Kleinman JE. Selective abnormalities of prefrontal serotonergic receptors in schizophrenia. A postmortem study. Arch Gen Psychiatry. 1993;50(10):810‐818. doi: 10.1001/archpsyc.1993.01820220066007 [DOI] [PubMed] [Google Scholar]
- 16. Govitrapong P, Chagkutip J, Turakitwanakan W, Srikiatkhachorn A. Platelet 5‐HT2A receptors in schizophrenic patients with and without neuroleptic treatment. Psychiatry Res. 2000;96(1):41‐50. doi: 10.1016/s0165-1781(00)00191-8 [DOI] [PubMed] [Google Scholar]
- 17. Arranz B, Rosel P, Sarró S, et al. Altered platelet serotonin 5‐HT2A receptor density but not second messenger inositol trisphosphate levels in drug‐free schizophrenic patients. Psychiatry Res. 2003;118(2):165‐174. doi: 10.1016/s0165-1781(03)00073-8 [DOI] [PubMed] [Google Scholar]
- 18. Gonzalez‐Maeso J, Ang RL, Yuen T, et al. Identification of a serotonin/glutamate receptor complex implicated in psychosis. Nature. 2008;452(7183):93‐97. doi: 10.1038/nature06612 [DOI] [PMC free article] [PubMed] [Google Scholar]
- 19. Kang K, Huang XF, Wang Q, Deng C. Decreased density of serotonin 2A receptors in the superior temporal gyrus in schizophrenia—a postmortem study. Prog Neuropsychopharmacol Biol Psychiatry. 2009;33(5):867‐871. doi: 10.1016/j.pnpbp.2009.04.010 [DOI] [PubMed] [Google Scholar]
- 20. Schachter M, Geaney DP, Grahame‐Smith DG, Cowen PJ, Elliott JM. Increased platelet membrane [3H]‐LSD binding in patients on chronic neuroleptic treatment. Br J Clin Pharmacol. 1985;19(4):453‐457. doi: 10.1111/j.1365-2125.1985.tb02670.x [DOI] [PMC free article] [PubMed] [Google Scholar]
- 21. Arora RC, Meltzer HY. Serotonin2 receptor binding in blood platelets of schizophrenic patients. Psychiatry Res. 1993;47(2):111‐119. doi: 10.1016/0165-1781(93)90041-e [DOI] [PubMed] [Google Scholar]
- 22. Pandey SC, Sharma RP, Janicak PG, Marks RC, Davis JM, Pandey GN. Platelet serotonin‐2 receptors in schizophrenia: effects of illness and neuroleptic treatment. Psychiatry Res. 1993;48(1):57‐68. doi: 10.1016/0165-1781(93)90113-u [DOI] [PubMed] [Google Scholar]
- 23. Muguruza C, Moreno JL, Umali A, Callado LF, Meana JJ, Gonzalez‐Maeso J. Dysregulated 5‐HT(2A) receptor binding in postmortem frontal cortex of schizophrenic subjects. Eur Neuropsychopharmacol. 2013;23(8):852‐864. doi: 10.1016/j.euroneuro.2012.10.006 [DOI] [PMC free article] [PubMed] [Google Scholar]
- 24. Galindo L, Moreno E, Lopez‐Armenta F, et al. Cannabis users show enhanced expression of CB1‐5HT2A receptor heteromers in olfactory neuroepithelium cells. Mol Neurobiol. 2018;55(8):6347‐6361. doi: 10.1007/s12035-017-0833-7 [DOI] [PubMed] [Google Scholar]
- 25. Franklin JM, Carrasco GA. Cannabinoid‐induced enhanced interaction and protein levels of serotonin 5‐HT(2A) and dopamine D(2) receptors in rat prefrontal cortex. J Psychopharmacol. 2012;26(10):1333‐1347. doi: 10.1177/0269881112450786 [DOI] [PMC free article] [PubMed] [Google Scholar]
- 26. Marchetti D, Spagnolo A, de Matteis V, Filograna L, de Giovanni N. Coronary thrombosis and marijuana smoking: a case report and narrative review of the literature. Drug Test Anal. 2016;8(1):56‐62. doi: 10.1002/dta.1898 [DOI] [PubMed] [Google Scholar]
- 27. Leweke FM, Mueller JK, Lange B, Rohleder C. Therapeutic potential of cannabinoids in psychosis. Biol Psychiatry. 2016;79(7):604‐612. doi: 10.1016/j.biopsych.2015.11.018 [DOI] [PubMed] [Google Scholar]
- 28. Saladrigas‐Manjon S, Ducic T, Galindo L, et al. Effects of cannabis use on the protein and lipid profile of olfactory neuroepithelium cells from schizophrenia patients studied by synchrotron‐based FTIR spectroscopy. Biomolecules. 2020;10(2):329‐329. doi: 10.3390/biom10020329 [DOI] [PMC free article] [PubMed] [Google Scholar]
- 29. Ibarra‐Lecue I, Pilar‐Cuellar F, Muguruza C, et al. The endocannabinoid system in mental disorders: evidence from human brain studies. Biochem Pharmacol. 2018;157:97‐107. doi: 10.1016/j.bcp.2018.07.009 [DOI] [PubMed] [Google Scholar]
- 30. Uriguen L, Garcia‐Fuster MJ, Callado LF, et al. Immunodensity and mRNA expression of A2A adenosine, D2 dopamine, and CB1 cannabinoid receptors in postmortem frontal cortex of subjects with schizophrenia: effect of antipsychotic treatment. Psychopharmacology (Berl). 2009;206(2):313‐324. doi: 10.1007/s00213-009-1608-2 [DOI] [PubMed] [Google Scholar]
- 31. de Campos‐Carli SM, Araujo MS, de Oliveira Silveira AC, et al. Cannabinoid receptors on peripheral leukocytes from patients with schizophrenia: evidence for defective immunomodulatory mechanisms. J Psychiatr Res. 2017;87:44‐52. doi: 10.1016/j.jpsychires.2016.12.001 [DOI] [PubMed] [Google Scholar]
- 32. Chadha R, Meador‐Woodruff JH. Downregulated AKT‐mTOR signaling pathway proteins in dorsolateral prefrontal cortex in schizophrenia. Neuropsychopharmacology. 2020;45(6):1059‐1067. doi: 10.1038/s41386-020-0614-2 [DOI] [PMC free article] [PubMed] [Google Scholar]
- 33. Jones CI, Bray S, Garner SF, et al. A functional genomics approach reveals novel quantitative trait loci associated with platelet signaling pathways. Blood. 2009;114(7):1405‐1416. doi: 10.1182/blood-2009-02-202614 [DOI] [PubMed] [Google Scholar]
- 34. Puighermanal E, Marsicano G, Busquets‐Garcia A, Lutz B, Maldonado R, Ozaita A. Cannabinoid modulation of hippocampal long‐term memory is mediated by mTOR signaling. Nat Neurosci. 2009;12(9):1152‐1158. doi: 10.1038/nn.2369 [DOI] [PubMed] [Google Scholar]
- 35. van Winkel R, Genetic Risk and Outcome of Psychosis (GROUP) Investigators . Outcome of psychosis I. Family‐based analysis of genetic variation underlying psychosis‐inducing effects of cannabis: sibling analysis and proband follow‐up. Arch Gen Psychiatry. 2011;68(2):148‐157. doi: 10.1001/archgenpsychiatry.2010.152 [DOI] [PubMed] [Google Scholar]
- 36. Morgan CJ, Freeman TP, Powell J, Curran HV. AKT1 genotype moderates the acute psychotomimetic effects of naturalistically smoked cannabis in young cannabis smokers. Transl Psychiatry. 2016;6:e738. doi: 10.1038/tp.2015.219 [DOI] [PMC free article] [PubMed] [Google Scholar]
- 37. Saunders C, Siuta M, Robertson SD, et al. Neuronal ablation of p‐Akt at Ser473 leads to altered 5‐HT1A/2A receptor function. Neurochem Int. 2014;73:113‐121. doi: 10.1016/j.neuint.2013.09.015 [DOI] [PMC free article] [PubMed] [Google Scholar]
- 38. Muguruza C, Lehtonen M, Aaltonen N, Morentin B, Meana JJ, Callado LF. Quantification of endocannabinoids in postmortem brain of schizophrenic subjects. Schizophr Res. 2013;148(1‐3):145‐150. doi: 10.1016/j.schres.2013.06.013 [DOI] [PubMed] [Google Scholar]
- 39. Minichino A, Senior M, Brondino N, et al. Measuring disturbance of the endocannabinoid system in psychosis: a systematic review and meta‐analysis. JAMA Psychiat. 2019;76(9):914‐923. doi: 10.1001/jamapsychiatry.2019.0970 [DOI] [PMC free article] [PubMed] [Google Scholar]
- 40. Dickens AM, Borgan F, Laurikainen H, et al. Links between central CB1‐receptor availability and peripheral endocannabinoids in patients with first episode psychosis. NPJ Schizophr. 2020;6(1):21. doi: 10.1038/s41537-020-00110-7 [DOI] [PMC free article] [PubMed] [Google Scholar]
- 41. Leweke FM, Giuffrida A, Koethe D, et al. Anandamide levels in erebrospinal fluid of first‐episode schizophrenic patients: impact of cannabis use. Schizophr Res. 2007;94(1‐3):29‐36. doi: 10.1016/j.schres.2007.04.025 [DOI] [PubMed] [Google Scholar]
- 42. di Marzo V, Maccarrone M. FAAH and anandamide: is 2‐AG really the odd one out? Trends Pharmacol Sci. 2008;29(5):229‐233. doi: 10.1016/j.tips.2008.03.001 [DOI] [PubMed] [Google Scholar]
- 43. Leweke FM, Giuffrida A, Wurster U, Emrich HM, Piomelli D. Elevated endogenous cannabinoids in schizophrenia. Neuroreport. 1999;10(8):1665‐1669. doi: 10.1097/00001756-199906030-00008 [DOI] [PubMed] [Google Scholar]
- 44. Pandey R, Mousawy K, Nagarkatti M, Nagarkatti P. Endocannabinoids and immune regulation. Pharmacol Res. 2009;60(2):85‐92. doi: 10.1016/j.phrs.2009.03.019 [DOI] [PMC free article] [PubMed] [Google Scholar]
- 45. Cabral GA, Ferreira GA, Jamerson MJ. Endocannabinoids and the immune system in health and disease. Handb Exp Pharmacol. 2015;231:185‐211. doi: 10.1007/978-3-319-20825-1_6 [DOI] [PubMed] [Google Scholar]
- 46. Park S, Miller BJ. Meta‐analysis of cytokine and C‐reactive protein levels in high‐risk psychosis. Schizophr Res. 2020;226:5‐12. doi: 10.1016/j.schres.2019.03.012 [DOI] [PubMed] [Google Scholar]
- 47. Doggui R, Elsawy W, Conti AA, Baldacchino A. Association between chronic psychoactive substances use and systemic inflammation: a systematic review and meta‐analysis. Neurosci Biobehav Rev. 2021;125:208‐220. doi: 10.1016/j.neubiorev.2021.02.031 [DOI] [PubMed] [Google Scholar]
- 48. Corsi‐Zuelli F, Marques L, da Roza DL, et al. The independent and combined effects of cannabis use and systemic inflammation during the early stages of psychosis: exploring the two‐hit hypothesis. Psychol Med. 2021;1‐11. doi: 10.1017/S0033291721000726 [DOI] [PubMed] [Google Scholar]
- 49. Keen L II, Pereira D, Latimer W. Self‐reported lifetime marijuana use and interleukin‐6 levels in middle‐aged African Americans. Drug Alcohol Depend. 2014;140:156‐160. doi: 10.1016/j.drugalcdep.2014.04.011 [DOI] [PubMed] [Google Scholar]
- 50. Parrish JC, Nichols DE. Serotonin 5‐HT(2A) receptor activation induces 2‐arachidonoylglycerol release through a phospholipase c‐dependent mechanism. J Neurochem. 2006;99(4):1164‐1175. doi: 10.1111/j.1471-4159.2006.04173.x [DOI] [PubMed] [Google Scholar]
Associated Data
This section collects any data citations, data availability statements, or supplementary materials included in this article.
Supplementary Materials
Data S1. Supporting Information
Table S1. Demographic characteristics of subjects with cannabis use disorder and matched controls.
Table S2. Demographic characteristics and antipsychotic treatment of subjects with schizophrenia and matched controls.
Table S3. Demographic characteristics and antipsychotic treatment of subjects with dual diagnostic and matched controls.
Table S4. Solvent A composition change in the chromatographic method.
Table S5. Retention times and chosen precursor ions, product ions, fragmentor voltages and collision energies for each of the measured analytes.
Data Availability Statement
The data that support the findings of this study are available from the corresponding author upon reasonable request.