

Abstract
Aim
To describe ribosome biogenesis during resistance training, its relation to training volume and muscle growth.
Methods
A training group (n = 11) performed 12 sessions (3‐4 sessions per week) of unilateral knee extension with constant and variable volume (6 and 3‐9 sets per session respectively) allocated to either leg. Ribosome abundance and biogenesis markers were assessed from vastus lateralis biopsies obtained at baseline, 48 hours after sessions 1, 4, 5, 8, 9 and 12, and after eight days of de‐training, and from a control group (n = 8). Muscle thickness was measured before and after the intervention.
Results
Training led to muscle growth (3.9% over baseline values, 95% CrI: [0.2, 7.5] vs. control) with concomitant increases in total RNA, ribosomal RNA, upstream binding factor (UBF) and ribosomal protein S6 with no differences between volume conditions. Total RNA increased rapidly in response to the first four sessions (8.6% [5.6, 11.7] per session), followed by a plateau and peak values after session 8 (49.5% [34.5, 66.5] above baseline). Total RNA abundance was associated with UBF protein levels (5.0% [0.2, 10.2] per unit UBF), and the rate of increase in total RNA levels predicted hypertrophy (0.3 mm [0.1, 0.4] per %‐point increase in total RNA per session). After de‐training, total RNA decreased (−19.3% [−29.0, −8.1]) without muscle mass changes indicating halted biosynthesis of ribosomes.
Conclusion
Ribosomes accumulate in the initial phase of resistance training with abundances sensitive to training cessation and associated with UBF protein levels. The average accumulation rate predicts muscle training‐induced hypertrophy.
Keywords: muscle hypertrophy, resistance training, ribosome biogenesis
1. INTRODUCTION
Skeletal muscle is a critical target for interventions that promote health across the lifespan, 1 with resistance training (RT) being the advocated remedy. Prolonged RT leads to changes in the balance between muscle protein breakdown and synthesis, with one bout of resistance exercise acutely increasing protein synthesis for up to 48 hours after exercise, 2 and subsequent repeated bouts leading to accumulation of muscle protein over time. 3 , 4 In recent years, this view has been supplemented by evidence suggesting that chronic RT leads to increased basal muscle protein synthesis rates, 5 , 6 , 7 which has been postulated to be associated with increased translational capacity, that is, accumulation of ribosomes. 7 , 8 This notion is supported by exercise‐induced increases in total RNA, a proxy marker of ribosome abundance, which is closely connected to protein synthesis 9 , 10 and muscle hypertrophy. 11 , 12 , 13 Conversely, inhibition of ribosomal RNA (rRNA) transcription and inhibition of its up‐stream transcription factors act to diminish muscle cell growth. 9 , 12 , 14
Biosynthesis of novel ribosomes is a complex, highly coordinated and energy demanding process that involves synthesis of both ribosomal proteins and the four mature rRNA transcripts. 14 , 15 , 16 Ribosomal accumulation is believed to be determined by the rates of pre‐rRNA transcription by RNA polymerase I (Pol I), which in turn is regulated by coordinated assembly of a complex of transcription factors at the rDNA promoter. 16 Specifically, activation of the of the upstream binding factor (UBF) through phosphorylation is needed to initiate transcription. 17 , 18 Such activation is at least partly controlled by the mechanosensitive mTOR pathway, with its inhibition being associated with blocked UBF phosphorylation and subsequent rRNA transcription. 19 , 20 Interestingly, the availability of UBF per se has been shown to be a determinant of rRNA transcription 21 through control of rDNA gene activity. 22
Resistance exercise is a potent and specific 23 stimuli for rRNA transcription as a single session leads to increases in pre‐rRNA. 24 , 25 Repeated bouts lead to the accumulation of mature rRNA reflected in total RNA and presumably functional ribosomes. 7 , 11 , 12 , 13 , 24 , 26 , 27 However, the true time course of ribosomal transcription and accumulation in response to RT remains largely unstudied, with a mere few studies having investigated exercise‐induced changes in rRNA over multiple time‐points, all of which are either limited to a selected few time‐points or a limited time frame. For example, two consecutive bouts of electrically evoked muscle contractions were associated with increased levels of total RNA, with peak values being observed 72 hours after the second bout. 26 Using voluntary contractions, peak values were reported after nine sessions, followed by a slight decrease to after 18 sessions, 27 resembling data from our lab where five sessions of RT led to marked increase in total RNA levels (per‐unit muscle tissue), followed by lower levels measured after the last training session of the 12 wk interventions (31 sessions). 13 Interestingly, during the initial phase of RT, total RNA accumulation seems to be volume‐dependent, as three sets per exercise in leg exercises led to augmented total RNA and rRNA levels compared to one set per exercise, coinciding with the differences in muscle hypertrophy seen after 12 weeks of RT. 13 These data suggest that ribosome accumulation reaches a plateau in the early phase of RT and that increases are sensitive to training volume in constant volume protocols.
Based on these observations we hypothesize that (1) ribosome accumulation occurs during the early phase (3‐4 weeks) of RT, within which this accumulation (2) reaches a plateau when RT volume is kept constant, (3) displays fluctuations in response to fluctuating training volume and (4) is partially reversed one week after cessation of RT. In addition to addressing these hypotheses we aimed to relate RNA accumulation to total UBF levels and muscle growth. We utilized a within‐participant unilateral training model where one leg was assigned constant volume (CONST, 6 sets per session) and the contra lateral leg variable volume (VAR, 6, 3 and 9 sets in sessions 1‐4, 5‐8 and 9‐12 respectively). Effects of training were assessed by comparison to a non‐training control group (CTRL).
2. RESULTS
All participants allocated to TRAIN successfully completed their prescribed RT on both legs, with the two volume conditions resulting in diverging volume profiles (load × repetitions) over the course of the study (Figure 1B). Exercise intensities (resistance at 10RM) increased similarly in both conditions from the first to the second (30%, 95% credible interval (CI): [21, 41]) and third (47% [35, 61]) training block, with each block consisting of four training sessions. Concomitantly, in TRAIN, isokinetic strength and thickness of m. vastus lateralis increased from baseline to after Session 12 compared to CTRL (isokinetic strength ~9.2%‐point difference; muscle thickness ~3.6%‐point difference, Figure 1C,D), a difference that was sustained to after eight days of de‐training (~6.7%‐point and ~3.5%‐point difference in change in isokinetic strength and muscle thickness, respectively; Figure 1C,D). Isometric strength showed the same general pattern to after Session 12 (~3.5%‐point difference), though with considerably larger degrees of uncertainty, as indicated by wider 95% CI normalization compared to CTRL after de‐training (~1.9%‐point; Figure 1C). No differences were observed between volume conditions for either strength or muscle thickness.
FIGURE 1.
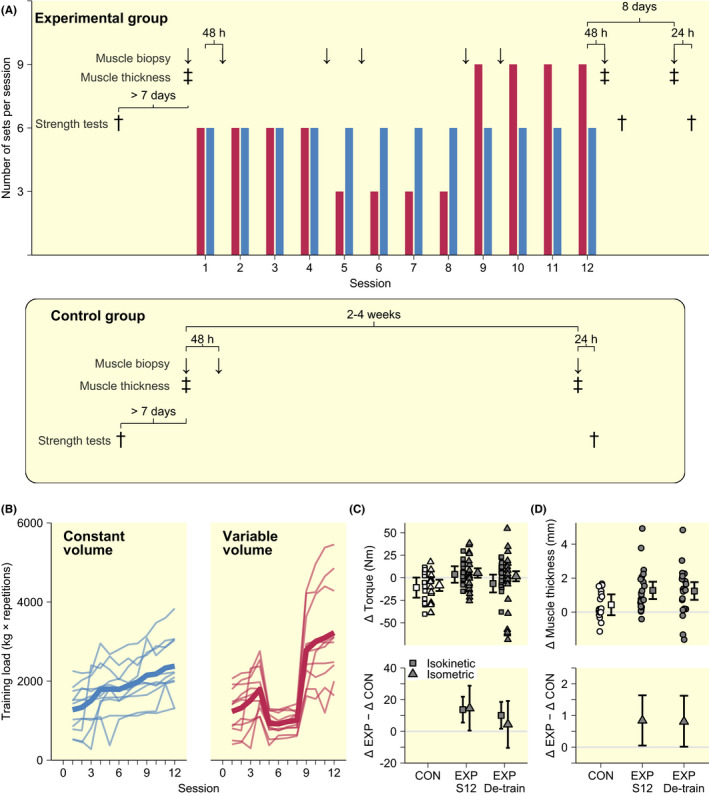
(A) Study design showing muscle biopsy sampling, thickness and strength assessments time points together with number of sets per session (CONST blue bars, VAR red bars). Assessments time points in the negative control group is shown in the lower panel. (B) Observed training loads in response to CONST and VAR volume protocols. Training outcomes are shown as within condition changes and in comparison to the control group (muscle strength, C; muscle thickness D). Intervals in C and D indicate 95% CI.
For both ribosomal protein S6 (rpS6) and UBF, protein levels increased linearly throughout the training intervention, with rpS6 showing estimated increments per session corresponding to 4.2% [1.2, 7.3] during block 1 (session 1‐4), 2.6% [−0.3, 5.5] during block 2 (session 5‐8) and 4.6% [1.2, 8.1] during block 3 (session 9‐12), and UBF showing increments corresponding to 7.3% [2.1, 13.0], 4.5% [−0.5, 9.8] and 6.1% [0.3, 12.1]. This general pattern was confirmed when comparing TRAIN to CTRL where UBF and rpS6 protein levels were higher in TRAIN compared to CTRL after Session 12, and remained elevated after eight days of rest (Figure 2A,B), with no robust differences being observed after the first training session (48 hours). Increases did not differ between volume‐conditions but for UBF, there was a tendency towards lower levels in VAR after Session 12 (−19.2% [−41.8, 13.0]). After de‐training, UBF‐levels tended to decrease in CONST (−22.3% [−43.5, 7.3]) while levels in VAR remained at elevated level compared to after Session 12 (7.6% [−22.6, 47.4]; interaction effect: 33.2% [−15.7, 110.9]). For rpS6, de‐training did not affect protein levels, which remained similar between volume conditions. At the mRNA level, UBF showed robust increase from before to 48 hours after the first session in TRAIN compared to CTRL (Figure 2D), while rpS6 showed no robust differences between TRAIN and CTRL at any time point. No differences were observed between volume conditions for either transcripts (Figure 2D,E).
FIGURE 2.
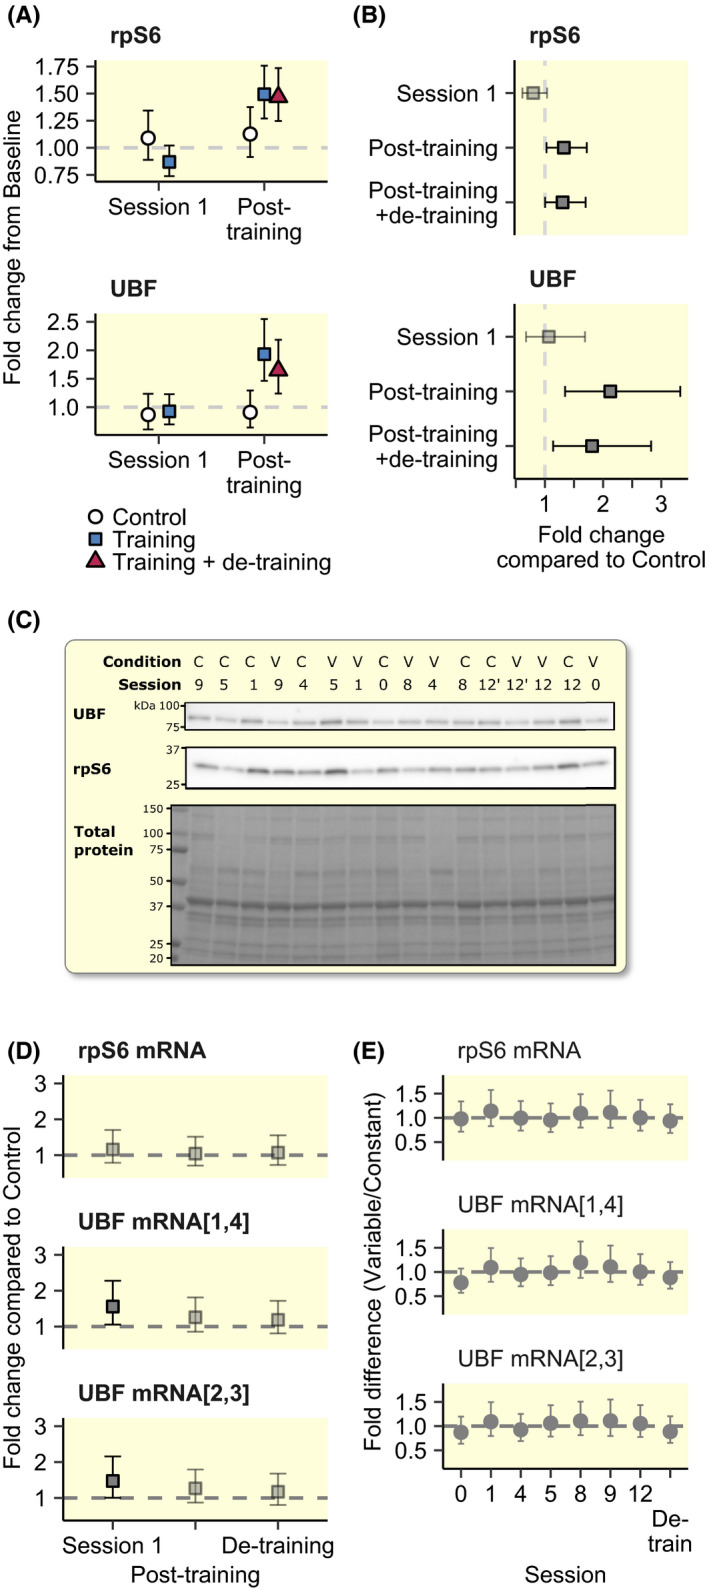
Protein (A and B) and mRNA abundances (D and E) of rpS6 and UBF. Non‐transparent gray points and error bars represent statistically robust results (a 95% CI not containing 0). C shows western blots and total protein stains from a representative participant. mRNA data are normalized per total RNA. Intervals in A, B, D and E indicate 95% CI
A single session of RT (Session 1) led to robust increases in precursor ribosomal RNA (pre‐rRNA 47S ETS and 45S ETS) abundance per unit tissue weight, measured as changes from baseline to 48 hours after exercise within TRAIN (Figure 3B), as well as compared to CTRL (Figure 3C). After Session 1, pre‐rRNA 47S ETS and 45S ETS levels remained at similar levels at all measured time‐points in TRAIN (Figure 3D), confirmed in comparison to CTRL after Session 12 (Figure 3C). Other rRNA transcripts showed increases in response to training with slightly different temporal patterns with exception of rRNA 5S which did not change and rRNA 5.8 which tended to follow other mature transcript spliced from pre‐rRNA 45S ETS, but without statistical robustness (Figure 3C,D). After eight days of rest, 18S and 28S remained at elevated levels compared to CTRL (Figure 3B). This general pattern of rRNA expression was reflected by total RNA abundance per unit tissue weight, which increased robustly and steadily in TRAIN throughout the initial part of the intervention (Figure 3E,G), leading to robust increase compared to CTRL after Session 12 (Figure 3F), followed by decreased levels after de‐training (−19.3%, [−29.0, −8.1]). For both rRNA expression and total RNA levels, the training‐associated increases in abundances occurred predominately during the first four sessions, evident as 8.6% [5.6, 11.7] increase per session, followed by sustained levels from sessions four to eight (1.8% [−1.0, 4.7] increase per session) and from sessions eight to twelve 0.0% [−3.0, 3.3], corresponding to 39.3% [24.4, 55.9], 49.5% [34.5, 66.5] and 49.8% [33.0, 68.9] increases from baseline to 48 hours after session 4, 8 and 12 respectively. In TRAIN, the two volume conditions led to similar changes for most variables (Figure 3D,G), with 45S ETS abundance only showing differential expression, evident as robustly higher levels in VAR compared to CONST after the 12th session (Figure 3D), coinciding with the increased training volume towards the end of the intervention for this condition.
FIGURE 3.
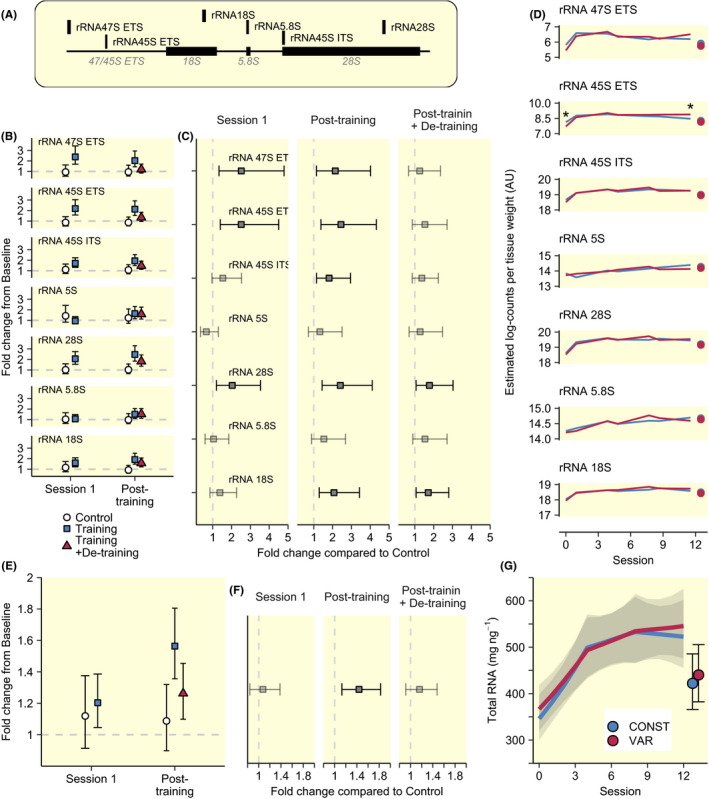
Total RNA and ribosomal RNA subspecies in response to resistance training. (A) shows primer locations targeting different ribosomal RNA subspecies in qPCR analyses. Ribosomal RNA species measured by qPCR and compared to control was affected by training (B,C), but did not show clear differences between volume conditions (D). Total RNA increased compared to non‐training controls to post‐training (12 sessions) and tended to normalize after de‐training (E,F). Time‐course analysis revealed the greatest increase during the first four sessions (G). Error bars shows 95% CI. Asterisk in D indicates robust differences between volume conditions (a 95% CI of pairwise differences not containing 0). Points in D and G show abundances after de‐training for reference
In TRAIN, total RNA levels were robustly predicted by UBF levels (after controlling for time), with 5.0% [0.2, 10.2] increases in total RNA per unit tissue weight coinciding with one unit increase in UBF levels (corresponding to one standard deviation; Table 1). In contrast, no evidence was found for a relationship between total RNA and rpS6 protein levels (Table 1).
TABLE 1.
Effect of UBF and rpS6 levels, sessions and de‐training on RNA‐levels
| Coefficient | Estimate a | SD | Lower 95% CI | Upper 95% CI |
|---|---|---|---|---|
| Intercept | 5.91 | 0.06 | 5.79 | 6.04 |
| UBF protein levels (SD‐units) | 0.05 | 0.02 | 0.00 | 0.10 |
| Session 1‐4 b | 0.09 | 0.02 | 0.05 | 0.12 |
| Session 4‐8 c | −0.08 | 0.03 | −0.13 | −0.02 |
| Session 8‐12 d | −0.02 | 0.03 | −0.08 | 0.04 |
| De‐training | −0.23 | 0.08 | −0.38 | −0.08 |
| Between participant variation | 0.11 | 0.05 | 0.03 | 0.23 |
| Between participant:leg variation | 0.04 | 0.03 | 0.00 | 0.11 |
| Residual SD | 0.23 | 0.01 | 0.20 | 0.26 |
| Intercept | 5.90 | 0.06 | 5.78 | 6.03 |
| rpS6 protein levels (SD‐units) | 0.02 | 0.03 | −0.03 | 0.07 |
| Session 1‐4 b | 0.09 | 0.02 | 0.06 | 0.12 |
| Session 4‐8 c | −0.08 | 0.03 | −0.13 | −0.02 |
| Session 8‐12 d | −0.02 | 0.03 | −0.08 | 0.04 |
| De‐training | −0.26 | 0.08 | −0.41 | −0.11 |
| Between participant variation | 0.11 | 0.05 | 0.03 | 0.24 |
| Between participant:leg variation | 0.04 | 0.03 | 0.00 | 0.11 |
| Residual SD | 0.23 | 0.02 | 0.20 | 0.26 |
The dependent variable is total RNA levels (log), n = 10.
Slope in response to session 1‐4.
Change in slope in session 4‐8.
Change in slope in session 8‐12.
In TRAIN, there was a robust positive relationship between rates of increase in total RNA in response to training and muscle growth measured as increases in m. vastus lateralis thickness (Table 2, Figure 4A), with changes in total RNA over the course of the training intervention being estimated in each leg using a regression model containing number of sessions as the independent variable. Conversely, there was a tendency towards a negative relationship between average total RNA levels at Session 6 and changes in muscle thickness (Table 2, Figure 4B), with the average total RNA levels estimated as the predicted value at Session 6 (estimated as the intercept‐term) from the model used to estimate the rate of total RNA increase per session.
TABLE 2.
Total RNA as a predictor of muscle growth
| Coefficient | Estimate a | SD | Lower 95% CI | Upper 95% CI |
|---|---|---|---|---|
| Intercept | 3.21 | 2.16 | −0.70 | 7.88 |
| Baseline muscle thickness | −0.15 | 0.09 | −0.35 | 0.02 |
| Sex (male) | 1.30 | 0.64 | 0.06 | 2.64 |
| Mean RNA at session 6 (SD units) | −0.27 | 0.27 | −0.76 | 0.32 |
| Mean total RNA increase per session (%) | 0.28 | 0.09 | 0.10 | 0.44 |
| Between participant variation | 0.71 | 0.39 | 0.09 | 1.64 |
| Residual SD | 1.00 | 0.13 | 0.78 | 1.30 |
The dependent variable is Δ Muscle thickness (mm).
FIGURE 4.
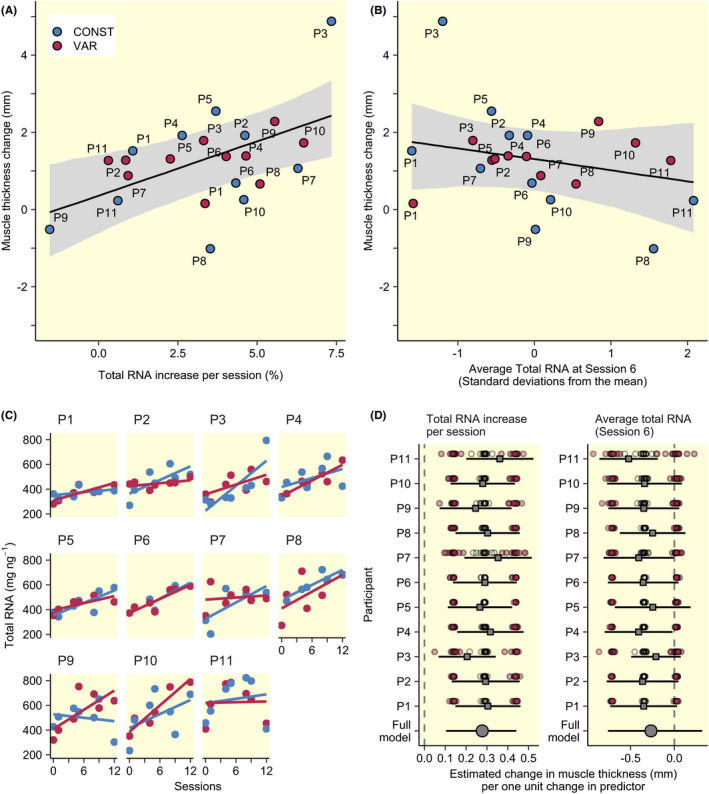
Predictions of muscle thickness increase based on total RNA increases (A) and total RNA abundance (B; see Table 2). Model estimates shown as black lines with 95% CI are averaged over values from men and women. Individual plots of estimates total RNA increases over time are shown in C together with results from leave‐one‐out analysis (D). Leave‐one‐out analysis shows the effect of removing a single participant (grey point and error bars) and individual values from the total RNA per time estimates where red points represent bounds of the 95% CI and circles represent mean estimates
To assess the robustness of the model for predicting muscle growth, individual relationships between sessions and total RNA levels (Figure 4C) were recalculated after the removal of single data points from each participant. The model predicting muscle growth was refitted using new estimates of changes in total RNA abundances and increases thereof per session. Each refitted model resulted in slightly different estimates (displayed as means and 95% CI in Figure 4D). No single data point influenced the results in any meaningful way. Next, we assessed the robustness by iteratively removing one participant from the data set, similarly this showed that estimates of the effect of total RNA increase on muscle growth was robust but the effect of average total RNA estimates were more variable (eg, Participants 11 and 3 in Figure 4D).
3. DISCUSSION
Here, we confirm that resistance training leads to increased abundance of markers of ribosome density, measured as total RNA, ribosomal RNA subspecies and rpS6 protein in previously untrained individuals compared to a non‐training control group. These markers accumulated progressively during the initial part of the intervention before they levelled out, establishing a plausible time course for changes in ribosomal concentration in response to RT that plateaus after ~8 sessions. This increase in total RNA was interconnected with increases in UBF protein abundance, suggesting UBF levels to play a role in regulation of rRNA transcription regulation in response to RT. Total RNA increases were not affected by weekly fluctuations in training volume. However, eight days of de‐training led to lowered levels of total RNA and rRNA content, suggesting that training cessation halts ribosome biogenesis. Finally, individual rates of increases in total RNA abundance predicted the magnitude of muscle growth, confirming the likely link between ribosomal biogenesis and muscle protein accretion 9 , 10 and muscle hypertrophy. 11 , 12 , 13
Total RNA seems to be a valid proxy marker of ribosomal density, as most of the RNA is assumed to be ribosomal RNA, 28 which in turn is a valid marker of translational capacity. 10 Several studies have shown that total RNA content is altered by RT, 7 , 11 , 12 , 13 , 24 , 26 , 27 , 29 , 30 as was also the case in the present data set. However, the time course of total RNA/rRNA changes in response to RT has so far remained speculative, with no study investigating responses to prolonged interventions with multiple sampling time points. In the present data, RT led to a clear session‐to‐session increase in total RNA per unit tissue weight in response to the first four sessions, whereupon the changes gradually levelled out before peaking after the 8th session, with the peak increase from baseline being ~50%, defining an accumulation phase. This corroborates well with previous suggestions of peak values being reached within four to nine sessions in young males and females, 13 , 27 and may be essential for preparing muscle fibres for subsequent growth. 11 , 13 , 27 After the 8th session, no meaningful increase or decrease were observed for total RNA or rRNA content within the training period, suggesting a plateau phase with attenuated net synthesis of novel ribosomes. Within this last part of the intervention, synthesis of novel rRNA still seemed to be elevated per weight unit muscle tissue compared to baseline, as suggested by sustained elevation of pre‐rRNA transcripts, coinciding with peak values of UBF protein levels. This may indicate that during the plateau phase, the ribosomal concentration is balanced by muscle growth. 31 This balance, measured as a constant ribosomal density in a growing cell, still requires the biosynthesis of ribosomes to match the volumetric expansion of the cell. As such, indirect measures of translational capacity such as the concentration of total RNA may mask the absolute increase in ribosomes that occurs during periods of muscle hypertrophy.
The observed rates of RNA accumulation over the entirety of the intervention were found to be a determinant of changes in muscle thickness (after controlling for average total RNA levels). Individuals with higher rates of accumulation showed larger accretion of muscle mass. This supports the notion that ribosomal biogenesis is an important determinant of RT‐induced muscle hypertrophy, with previous studies showing that increases in total RNA are positively correlated with increases in muscle mass, 7 , 11 , 32 differs between individuals displaying low versus high levels of muscle hypertrophy in response to RT 12 an contribute to explain RT volume‐dependent changes in muscle mass and strength. 13 In addition, suppression of ribosomal biogenesis in in vitro models leads to halted muscle cellular growth in some 9 , 12 , 19 but not all studies. 33 Conversely, individual variation in fixed amounts of total RNA was not found to determine muscle mass accretion, and higher levels of total RNA were instead associated with a tendency towards lowered muscle growth. Overall, the rate of increases in ribosomal density hence seems to be a better predictor for individual RT‐induced changes in muscle mass than absolute ribosomal density, suggesting that net increases in ribosomal biogenesis may be a core determinant of RT responsiveness. Interestingly, the interaction between rRNA synthesis rate and muscle mass accretion (but not between ribosomal content and muscle mass accretion) may shed light on observed differences in muscular responses to RT between young and old individuals. Whereas aged muscle display higher levels of total RNA at rest 24 they show reduced changes in total RNA levels in response to RT, 27 potentially explaining their alleged poorer overall hypertrophic responses. 27 Whether these cellular characteristics are related to, for example, differences in fibre type distributions 34 remains to be determined. Furthermore, ribosomal accumulation is unlikely to be the only ribosome‐derived trait that is important for training responsiveness. Evidence suggests that mechanical loading may lead to changes in ribosome characteristics 35 potentially leading to heterogeneous tissue‐specific ribosome populations. 36 , 37 Our results support a model where specialized, newly synthesized ribosomes contribute to muscle hypertrophy as the increase in ribosomal content but not absolute levels predicted muscle growth. We, however, acknowledge that the present study does not provide substantial insight into this perspective. Together, these results and perspectives emphasizes on the potentially crucial role of RT‐induced ribosomal synthesis for adaptations to training, making ribosomal responses to RT an interesting biomarker in relation to manipulation of training loads for specific populations.
In the present study, training induced increases in rRNA and total RNA coincided with increases in rpS6. Conversely, changes in total RNA levels and rpS6 in response to de‐training did not correspond, as rpS6 protein levels remained elevated after the de‐training period. The training induced increases in rpS6 seen in the present study are in agreement to those previously reported in young men, 4 but not in elderly men and women, where a decrease was observed in response to training despite increases in total RNA and rRNA. 12 Although increases were seen for both rpS6 and total RNA, rpS6 did not explain variation in total RNA (after controlling for the number of sessions). Together with a disconnect after the de‐training period, this suggest that regulation of rpS6 expression and ribosomal RNA transcription display differential temporal responses to RT. Such difference in temporal regulation of ribosomal RNA and proteins has previously been deduced in cell culture experiments. Briefly, inhibition of protein degradation led to accumulation of ribosomal proteins suggesting that excess amounts of ribosomal proteins are synthesized, imported into the nucleus and rapidly degraded if not incorporated into ribosomes. 38 This inherent capacity of cells to provide sufficient access to ribosomal proteins also suggests rRNA transcription (and not synthesis of ribosomal proteins) is not rate‐limiting during ribosomal biogenesis. 38 Currently, it remains unknown if RT leads to expansion of the pool of unbound ribosomal proteins in humans. Indeed, in the present study, the disconnect between rpS6 and total RNA after de‐training may have been associated with increased numbers of myonuclei, rather than accumulation of rpS6 in existing myonuclei, providing an alternative explanation to the elevated rpS6 levels (which accordingly may have been distributed over a larger number of nuclei). Interestingly, in a recent study, Murach and colleagues showed that newly acquired myonuclei (from satellite cell fusion) contribute to the ribosomal pool in myofibers. 39 Importantly, the present study was not designed to investigate these perspectives, and observations are limited to one single ribosomal protein, with no investigation of RT‐induced myonuclear accretion. A parallel mechanism that could further help explain our observations is the possibility of extra‐ribosomal functions in selected ribosomal proteins affecting their expression independent of ribosomal biogenesis. 40
UBF levels robustly explained total RNA levels over the course of the intervention. As these analyses were done while accounting for the number of training sessions, estimates are likely to be unbiased. Unrealistically strong relationships could have been otherwise expected as both the dependent variable (total RNA) and the covariate (UBF levels) varies with the number of sessions. From a mechanistic perspective, UBF is an important transcription factor for rDNA transcription as it, in its active state recruits a secondary transcription factor (SL1) to the rDNA promoter and enables transcription by RNA Pol I. 18 Activation of UBF is controlled by the mechanosensitive mTOR pathway, and rapamycin, a specific mTOR inhibitor, blocks UBF from recruiting SL1 and subsequent rRNA transcription. 19 , 20 Evidence from human exercise studies confirms training‐induced activation of UBF through phosphorylation. 11 , 41 In addition to exercise‐induced activation of UBF, mechanical loading also leads to increased levels of total UBF. 11 , 41 Increases in UBF was determined to be rapamycin insensitive after synergist ablation in mice 42 pointing to an effect observed in cell models where c‐Myc induces UBF mRNA transcription. 43 Interestingly, the availability of UBF has been shown to regulate rRNA transcription 21 through control of rDNA gene activity. 22 Together with our observations, this underlines the importance of UBF as a regulator of RT‐induced ribosomal biogenesis. However, the lack of measurements of UBF in the context of active chromatin interaction may have inhibited us from further explaining the role of UBF in response to the de‐training period.
After eight days of de‐training, total RNA and rRNA levels per weight unit muscle tissue returned toward baseline levels, though without concomitant reversal of muscle thickness, which remained at elevate levels. This was likely caused by attenuated rRNA transcription, a notion that was supported by reversal of pre‐rRNA abundances and possibly by lowered UBF protein levels, though this was not confirmed as statistically robust. The magnitude of the detraining‐associated decrease in total RNA (~20%) is similar to that seen in response to unloading of untrained human muscle over a similar time frame (7‐10 days). 44 , 45 This suggests that RT‐induced increases in ribosomal content is easily lost, likely driven by a combination of reduced synthesis and enhanced degradation (ribophagy). While the relative contribution of these two remains to be determined, inactivity has previously been shown to induce ribophagy in rat muscle (subjected to hindlimb suspension). 45 Future studies should investigate the interrelationship between ribosome biogenesis and ribophagy in response to training and detraining. We suspect that their relative importance for ribosomal homeostasis will vary substantially between different physiological perturbations, as they are regulated by a complex interconnection of stimuli and pathways. 15 , 16 , 46 For example, Kim et al showed that cancer cachexia is associated with reduced rDNA transcription (and hence reduced translational capacity), 47 contrasting the inactivity‐driven reduction in translational capacity which to a larger degree seems to involve ribophagy. 45
The de‐training effect on total RNA and rRNA seen in the present study supports the idea that ribosomal biogenesis is a cellular activity on demand, possibly relating to its relative expense 15 also in muscle tissue. Based on this notion, and the fact that RT volume is known to be a potent modulator of molecular mechanisms determining protein synthesis and ribosomal biogenesis including induction of c‐Myc expression, mTOR activation, 13 , 48 , 49 subsequent total RNA increases 13 and post exercise protein synthesis 49 and subsequent training outcomes, 13 , 50 we hypothesized that fluctuations in training volume would be reflected in markers of ribosomal biogenesis. When comparing VAR to CONST in the present study we found only one part of the pre‐rRNA, 45S ETS, to be differentially expressed and only so after Session 12 in favour of VAR together with a tendency towards rescued UBF levels after de‐training in response to increased volume in the VAR but not CONST protocol. These observations do not give support to a clear effect of fluctuations in training volume on total RNA levels or rRNA expression within a relatively short and training‐intensive intervention, though it should be noted that the time point with increased 45S ETS expression was preceded by a period of increased training volume, suggesting a potential interaction between time and volume. Indeed, both training protocols utilized in the present study increased muscle strength and induced muscle hypertrophy to a similar degree. From a general perspective, albeit volume is an important determinant of increases in muscle strength and mass, 50 , 51 differences in organization of training loads is likely of minor importance when training volumes are equated over time. 52 It is important to note that RT in the current study was performed with the same volume in the first four sessions, something that could have been more than enough to maximize rRNA transcription in previously untrained individuals. This is supported by the observation that pre‐rRNA increased rapidly initially in both protocols with minimal changes in response to subsequent sessions, regardless of exercise volume. The CONST protocol in the present study corresponded to volumes used in the moderate volume condition in a previous study from our lab (three sets in two exercises activating knee extensor muscles). 13 There, higher levels of total RNA were observed after four sessions in the moderate compared to a low volume protocol. 13 Interestingly, using a progressive volume protocol in well‐trained participants, increases in total RNA have been reported throughout six weeks of training. 29 Although this observation was done in well‐trained participants performing a high volume protocol without a control condition with constant volume, compared to constant volume protocols, 13 , 27 progressive volume may thus increase ribosomal abundance to a higher degree and provide a measure to avoid the plateau phase seen in the present study.
In conclusion, RT‐induced ribosome accumulation reached peak values in the initial phase of RT (eight sessions) and was interconnected with increases in UBF protein levels. The rate of total RNA accumulation predicted RT‐induced muscle hypertrophy. Fluctuations in training volume did not transfer to fluctuations in ribosomal biogenesis, but training cessation led to decreased ribosomal content.
4. MATERIALS AND METHODS
4.1. Study overview
Nineteen volunteers were recruited to the study. Eligible participants were non‐smokers between 18 and 35 years of age with a training history of less than one RT session per week during the six months leading up to the study. Exclusion criteria were consumption of dietary supplements or medication with known effects on muscle metabolism, injuries causing impaired strength and/or affecting their ability to perform RT, symptoms or history of disease, and known adverse reactions to local anaesthetics. Participants were allocated to either a training group (TRAIN, n = 11) or a non‐training control group (CTRL, n = 8; see Table 3 for participant characteristics; see Figure 1A for overview of the intervention). TRAIN performed a 12‐session RT protocol lasting for 3‐4 weeks, consisting of 10 repetition maximum (RM) unilateral knee‐extension, with the two legs conducting RT with different volume profiles, allowing within‐participant comparison of the effects of volume regimes. In TRAIN, one leg conducted RT with constant volume throughout the intervention (CONST, 6 sets per session) and the other leg performed RT with variable volume (VAR, 3 blocks of four sessions with 6, 3 and 9 sets per session respectively; Figure 1A). CTRL did not partake in RT and were instructed to continue their everyday activities. Muscle biopsies were sampled bilaterally in TRAIN before and 48 hours after the first session, as well as 48 hours after the fourth, fifth, eight, ninth and twelfth session, and after eight days of de‐training. Muscle biopsies were obtained from CTRL at three occasions; at baseline and 48 hours and 3‐5 weeks (average (SD) 3.6 (0.7)) after the first sampling event. TRAIN and CTRL performed strength assessments > seven days prior to the first biopsy sampling (TRAIN; CTRL), 72 hours after the twelfth session (TRAIN) and 24 hours after the last biopsy (TRAIN, following de‐training; CTRL). Appendicular lean mass (Dual‐energy X‐ray absorptiometry, DXA) and muscle thickness of m. vastus lateralis were assessed prior to the first biopsy (TRAIN and CTRL) as wells as before the second to last (TRAIN) and last (TRAIN and CTRL) biopsy.
TABLE 3.
Participant characteristics
| Experimental group | Control group | |||
|---|---|---|---|---|
| Female | Male | Female | Male | |
| n | 6 | 5 | 4 | 4 |
| Age (years) | 23.4 (2.9) | 25.7 (5.8) | 24.1 (3.5) | 25.5 (5.5) |
| Body mass, (kg) | 64.0 (9.2) | 77.5 (8.0) | 63.7 (0.5) | 76.0 (7.0) |
| Stature (cm) | 167.8 (8.1) | 177.2 (3.3) | 166.0 (3.7) | 181.8 (5.0) |
| Body mass index (kg m−2) | 22.7 (2.7) | 24.7 (2.7) | 23.2 (1.1) | 23.1 (3.2) |
| Body fat (%) | 30.8 (30.8) | 25.1 (25.1) | 30.3 (30.3) | 17.9 (17.9) |
All participants gave their informed written informed consent prior to data collection. The study was conducted according to the Declaration of Helsinki, approved by the local ethics committee (no. 2017‐10‐23) and the Norwegian center for research data (ref: 51549/3/AH), and pre‐registered (DOI: 10.17605/OSF.IO/WA96Y).
4.2. RT protocol
Prior to all RT sessions, participants performed a standardized warm‐up consisting of 5 minutes ergometer cycling (rating of perceived exertion (RPE): 12‐14), followed by ten repetitions of push‐ups, sit‐ups and back‐extensions. After warm‐up, participants performed unilateral knee‐extension with the prescribed number of sets. Each set was prescribed with 10 repetitions maximum (RM). When sets were completed with either fewer (8) or more (12) repetitions, the resistance was adjusted accordingly. Inter‐set rest periods were 90 seconds. Throughout the intervention RT sessions were alternatingly initiated by training the right and left leg, changing every other session. The contralateral leg was trained in the rest period between sets of the first leg, still allowing for complete rest between efforts (~60 seconds). The second session of each four‐session block (session 2, 6 and 10) was performed at a sub‐maximal resistance (~90% of the previous session) with the same number of repetitions (10). Within each session, participants also conducted two sets of three upper‐body exercises (bench press, lateral pull‐down and shoulder press; 10RM). After completion of each session participants were given a standardized drink to aid recovery (0.15 g kg−1 protein, 11.2 g kg−1 carbohydrates and 0.5 g kg−1 fat).
4.3. Muscle strength, body composition and muscle thickness assessments
Muscle strength was assessed as maximal voluntary isokinetic (90° sec−1) and isometric (60° angle, fully extended leg 0°) knee extension torque. After a brief warm‐up (5‐minute cycling, RPE 12‐14), participants were seated and secured in the individually adjusted dynamometer. Participants were instructed to gradually increase their effort during three warm‐up repetitions (50%, 60% and, 70% of subjective maximal effort). After a 30‐seconds rest period participants were instructed to perform three repetitions with maximal effort in the concentric phase. Sixty seconds after the isokinetic test the lever automatically moved to a 60° angle and participants were instructed to push against the lever enough to see feedback from the visual feedback system. After an additional 15‐seconds restitution period, participants were instructed to push against the lever with maximal effort. Within the same assessment session, participants remained seated in the dynamometer for measurement performed on both legs. The first measurement was alternated between legs every other session. For statistical treatment of the data, all successful attempts were used. The last strength assessment at baseline was performed at least seven days prior to the first biopsy sampling. At least one of the baseline strength tests was performed on separate day with two sessions allowed to be perform on the same day with a short rest between assessments. Post training assessments were performed 48 hours and eight days after the last session.
For determination of body composition participants were scanned using DXA (Lunar Prodigy densitometer, GE Healthcare, Madison, WI, USA) with the standard scanning mode (13‐25 cm). Participants were lying supine within the scanning bed reference lines, with a strap secured around the ankles to ensure a standardized body position in each scan. The scans were conducted with participants in a fasted state between 07.00 and 10.00 AM, with empty bladder and wearing only under‐wear. Prior to each scan, a phantom scan was run to prevent baseline drifting from affecting analyses. The same technician was used at each time point. Analyses was performed using GE enCORE version 17.0 software (GE Healthcare). Region of interest was customized for covering upper thigh, marked with a square from pubic symphysis to lateral part of tuberculum major, and distal to art. genu.
Muscle thickness (MT) was measured using a B‐mode ultra sound unit (SmartUS EXT‐1M, Telemed, Vilnius, Lithuania). Participants lay supine in a relaxed position for 20 minutes before assessments, with their feet strapped in a standardized position. A mark was set on the line 60% of the distance between Spinia Iliac Anterior Superior and the lateral femur condyle. MT of m. vastus lateralis was measured applying a water‐soluble transmission gel (Aquasonic 100 Ultrasound Transmission Gel; Parker Laboratories Inc, Fairfield, NJ, USA), and a 39 mm 12 MHz ultrasound probe was placed perpendicular to the site of interest without pressing the skin. When the quality of the image was satisfactory, evident as distinct upper and lower muscle fascia, three images were captured, where the probe was relocated to the same position between each image. Position of the probe was marked on the skin and subsequently marked on a transparent paper to ensure similar probe placement for both the right and left m. vastus lateralis at subsequent assessments. Analyses were done in ImageJ Fiji 53 with images cropped and coded to ensure blinding of the assessor.
4.4. Muscle biopsy sampling
Muscle specimens were sampled bilaterally from m. vastus laterlis under local anaesthesia (Lidokain 10 mg mL−1, Mylan, Mylan Ireland Limited, Dublin, Ireland) using a disposable needle (12‐14 gauge, Universal plus, Medax, Poggio Rusco, Italy), operated with a spring loaded device (Bard Magnum, Bard Norway, Rud, Norway). Two to four passes were made to get sufficient material. Material from all passes was quickly dissected free from connective and fat tissue and divided into one to two aliquots (depending on amount of available material). Aliquots were weighed and frozen in isopentan chilled to −80°C and stored at −80°C until further processing. Due to difficulties during the sampling procedure, we could not obtain a sample from one participant's leg belonging to TRAIN at baseline.
4.5. RNA and protein extraction
Frozen muscle tissue was homogenized in 1 mL of Trizol (ThermoFisher Scientific, Oslo, Norway) spiked with 0.04 ng of an external, non‐mammalian, RNA spike‐in (Lambda PolyA External Standard Kit, Takara Bio Europe, Saint‐Germain‐en‐Laye, France). The addition of the external spike‐in allowed for normalization of target RNA to muscle weight, see below. Mechanical disruption of the samples was achieved using Zirconium Oxide Beads (0.5 mm, Next Advance, Inc, New York, USA) and a bead mill (Bullet blender, Next Advance). Chloroform (200 μL) was added prior to centrifugation (12 000 g, 15 minutes at 4°C) to achieve phase separation. Four hundred fifty microlitre of the upper aqueous phase was transferred to a fresh tube and 500 μL of isopropanol was added to precipitate the RNA. After a 10 minutes incubation at room temperature, samples were centrifuged (12 000 g, 10 minutes at 4°C), after which a pellet formed. The pellet was washed three times in chilled 75% ethanol with centrifugation between each wash (7500 g, 5 minutes at 4°C). After the final wash all ethanol was removed and the pellet was eluted in 0.1X Tris‐EDTA buffer. RNA concentration and purity was assessed by spectrophotometry. All samples had 260/280 ratios > 1.95.
Protein was extracted from Trizol preparations according to the manufacturer's instructions and 54 with modifications. The remaining aqueous phase was removed and DNA was precipitated by the addition of 300 μL of absolute ethanol followed by gentle centrifugation (2000 g, 5 minutes at room temperature). An aliquot of the phenol‐ethanol phase, corresponding to ~1.75 mg of tissue, was transferred to to a fresh tube. After addition of at least two volumes of isopropanol and incubation (10 minutes at room temperature), samples were centrifuged (7500 g, 10 minutes 4°C) and a pellet formed. The pellet was washed three times in 95% ethanol with each wash separated by centrifugation (5000 g, 5 minutes at room temperature). After the last wash all liquid was removed and 45 μL of Kopec buffer 54 was added (5% SDS, 10 mM Tris, 140 mM NaCl and 20 mM EDTA, pH 8; containing protease and phosphatase inhibitors). Pellets were incubated at 50°C for three hours after which the majority of samples were dissolved. Any undissolved material was sedimented by centrifugation (10 000 g, 10 minutes at room temperature). Protein concentrations were measured (Pierce Detergent Compatible Bradford Assay, ThermoFisher Scientific). Sample were normalized to a common protein concentration, 4X Laemmli buffer (Bio‐Rad Norway AS, Oslo, Norway) was added and samples were boiled (95°C, 5 minutes) and stored at −20°C before later use.
4.6. Quantitative polymerase chain reaction (qPCR)
Complementary DNA (cDNA) was synthesized in technical duplicates from 500 ng of total RNA using random hexemer and anchored Oligo‐dT primers (Thermo Fisher Scientific) together with Superscript IV (Thermo Fisher Scientific) according to the manufacturer's instructions. qPCR reactions were performed with diluted cDNA (2 μL, 1:25 dilution), a SYBR‐green based commercial master mix (PowerUp™ SYBR™ Green Master Mix, Thermo Fisher) and, target‐specific primers (500 nM) in 10 μL reaction volumes using a real‐time detection system (QuantStudio 5 Real‐Time PCR System, Thermo Fisher Scientific). Fast cycling was used (1 second denaturing, 30 seconds annealing) after UNG (2 minutes, 50°C) and polymerase (2 minutes, 95°C) activation. Melt curves were collected from all reactions to confirm single product amplification. Primers were further evaluated by agarose gel electrophoresis which confirmed amplicon sizes and non‐template control experiments confirming no amplification without template. Primer sequences and their respective average performances are shown in Table 4.
TABLE 4.
Primer sequences and average performance
| Symbol | Transcript name | Sequence | Mean Cq (SD) and efficiency |
|---|---|---|---|
| rRNA47S ETS | 45S pre‐ribosomal RNA | F: 5′‐CTGTCGCTGGAGAGGTTGG‐3′ | 27.3 (1.9), E = 1.84 |
| R: 3′‐GGACGCGCGAGAGAACAG‐5′ | |||
| rRNA45S ETS | 45S pre‐ribosomal RNA | F: 5′‐GCCTTCTCTAGCGATCTGAGAG‐3′ | 24.0 (2.2), E = 1.89 |
| R: 3′‐CCATAACGGAGGCAGAGACA‐5′ | |||
| rRNA45S ITS | 45S pre‐ribosomal RNA | F: 5′‐TCCGAGACGCGACCTCAG‐3′ | 12.2 (2.2), E = 2.14 |
| R: 3′‐TCGCCGTTACTGAGGGAATC‐5′ | |||
| rRNA5.8S | 5.8S ribosomal RNA | F: 5′‐ACTCTTAGCGGTGGATCACTC‐3′ | 15.7 (1.9), E = 1.96 |
| R: 3′‐GTGTCGATGATCAATGTGTCCTG‐5′ | |||
| rRNA28S | 28S ribosomal RNA | F: 5′‐TGACGCGATGTGATTTCTGC‐3′ | 10.7 (1.8), E = 2.07 |
| R: 3′‐TAGATGACGAGGCATTTGGC‐5′ | |||
| rRNA18S | 18S ribosomal RNA | F: 5′‐TGCATGGCCGTTCTTAGTTG‐3′ | 10.3 (2.9), E = 1.98 |
| R: 3′‐AACGCCACTTGTCCCTCTAAG‐5′ | |||
| rRNA5S | 5S ribosomal RNA | F: 5′‐TACGGCCATACCACCCTGAAC‐3′ | 17.1 (2.2), E = 2.00 |
| R: 3′‐GGTCTCCCATCCAAGTACTAACC‐5′ | |||
| RPL32 | Ribosomal protein L32 | F: 5′‐AAGTTCCTGGTCCACAACG‐3′ | 22.0 (1.6), E = 1.93 |
| R: 3′‐CGGCACAGTAAGATTTGTTGC‐5′ | |||
| RPS6 | Ribosomal protein S6 | F: 5′‐TTGAAGTGGACGATGAACGC‐3′ | 22.3 (1.7), E = 1.96 |
| R: 3′‐GGACCACATAACCCTTCCATTC‐5′ | |||
| UBTF [1,4] | Upstream binding transcription factor | F: 5′‐CCGATTCAGGGAGGATCACC‐3′ | 28.4 (2.7), E = 1.87 |
| R: 3′‐ACCTCCTTCGTAGTGGCATC‐5′ | |||
| UBTF [2,3] | Upstream binding transcription factor | F: 5′‐CGGCCAGATGAGATCATGAGAG‐3′ | 28.0 (1.8), E = 1.88 |
| R: 3′‐GGGTGGACTTGGTGATACCC‐5′ | |||
| MYH7 | Myosin heavy chain 7 (MHCslow) | F: 5′‐AGGAGCTCACCTACCAGACG‐3′ | 19.5 (2.3), E = 1.93 |
| R: 3′‐TGCAGCTTGTCTACCAGGTC‐5′ | |||
| MYH2 | Myosin heavy chain 2 (M) | F: 5′‐CCAGGGTACGGGAGCTG‐3′ | 18.0 (1.9), E = 1.99 |
| R: 3′‐TCACTCGCCTCTCATGTTTG‐5′ | |||
| MYH1 | Myosin heavy chain 1 (M) | F: 5′‐GGCCAGGGTTCGTGAACTT‐3′ | 22.0 (2.5), E = 1.94 |
| R: 3′‐TGCGTAGACCCTTGACAGC‐5′ | |||
| Lambda | Lambda external reference | F: 5′‐Proprietary‐3′ | 22.2 (2.0), E = 1.98 |
| R: 3′‐Proprietary‐5′ |
Raw fluorescence data were exported from the QuantStudio software and estimates of quantification cycle (Cq) and amplification efficiency was derived for each reaction using the qpcR package. 55
4.7. Immunoblotting
Protein samples (20 μg) were separated on 4%‐20% Tris‐Glycin gels (Criterion TGX Precast Gels, Bio‐Rad) at 250 V for 45 minutes using the recommended running buffer (25 mM Tris, 192 mM Glycin, 0.1% SDS). All samples from the same participant were run on the same gel and all samples were run in at least duplicates. When samples were compared between participants, signals were expressed per a calibrator sample from each participant that in turn was measured on a separate gel with all calibrator samples. Due to technical difficulties, the calibrator sample from one participant was excluded from analysis, reducing the sample size in analyses between participants in TRAIN to n = 10 (Table 1). Separated samples were transferred to PVDF membranes (Immun‐Blot, Bio‐Rad) using wet transfer (25 mM Tris, 192 mM Glycine, 10% vol/vol methanol) at a constant voltage of 300 mA for 3 hours. Membranes were then stained to confirm transfer and enable total protein quantification using a reversible protein stain (Pierce Reversible Protein Stain, Thermo Fisher Scientific). Primary antibodies were acquired to detect UBF (F‐9, sc‐13125, Santa‐Cruz Biotechnology, Dallas, Texas, USA) and rpS6 (54D2, #2317, Cell Signaling Technology, Danvers, MA, USA). After blocking (Tris‐buffered saline blocking buffer, 20 mM Tris, 150 mM NaCl, 5% fat‐free milk, 0.1% Tween‐20), membranes were incubated over‐night with primary antibodies diluted in blocking buffer (UBF, 1:200; S6, 1:1000) followed by incubation with a secondary antibody conjugated to horseradish peroxidase (Anti‐mouse IgG, #7076, Cell Signaling Technology, 1:10 000). Membranes were washed 6 × 5 minutes after incubation with primary antibodies and 8 × 5 minutes after incubation with the secondary antibody. All incubation and washing steps were performed at 4°C using an automatic membrane processor (BlotCycler, Precision Biosystems, Mansfield, MA, USA). Chemiluminescent signals from membranes were detected after 5 minutes incubation in substrate (Super Signal West Femto Maximum Sensitivity Substrate, Thermo Fisher Scientific) using a documentation system. Total protein content was quantified from whole membrane images and defined as the mean gray value of the whole lane. Between‐lane gray values were used as background subtracted from protein values. Total protein quantification was done using ImageJ Fiji. 53 Chemiluminescence signals were quantified using Image Studio Lite (LI‐COR Biotechnology, Lincoln, NE, USA).
The average coefficient of variation across replicates were 20.2 and 22.8%, for rpS6 and UBF respectively.
4.8. Statistics and data analysis
Descriptive data are presented as mean and standard deviation (SD). The effect of training on muscle strength, muscle thickness, UBF/rpS6 protein, total RNA and gene abundances were assessed using mixed effects regression models. Time and group (TRAIN vs. CTRL) were treated as population (fixed) effects and leg nested within participant included as group level (random) effects. These analyses were performed on data with matching time points between TRAIN and CTRL with the exception that all post‐training data from TRAIN were included (post‐training and de‐training). Relative interactions between groups were estimated as Δ TRAIN ‐ Δ CTRL. The effects of different volume conditions and general time‐course patterns were assessed using all pairwise observations from the TRAIN group. For protein and total RNA data, segmented regression models were used to estimate changes over sessions in three segments (session 1‐4, 4‐8 and 8‐12; corresponding to blocks of different volume prescription in TRAIN). When no robust effects of volume conditions were detected, group averages are presented. Segmented models were fitted with time and volume condition as population effects and legs nested within participants as group level effects. Muscle strength, muscle thickness, protein and total RNA data was modeled after log transformation.
Gene abundance data were fitted with number of sessions as a categorical variable in comparisons of volume conditions, and Cq values converted to counts as suggested by Matz et al. 56 A Poisson‐lognormal model was used to fit these count data, using data from all genes and including group level effects for each technical duplicate, controlling for technical errors during sample preparation. An offset consisting of a normalization factor proportional to the amount of muscle used to prepare cDNA was used to model gene abundance per tissue weight. The external reference gene was used to calculate the normalization factor (External reference counts × muscle weight (mg) in each Trizol preparation). The offset was specified as a predictor with the coefficient fixed to 1.
A linear model was used to estimate the increase per session and average total RNA for every leg in the TRAIN group. These estimates were then used to estimate the effect of training‐induced increase per session and average total RNA abundance on muscle hypertrophy. For each leg, session was used as the independent variable centered on Session 6 and log transformed RNA per tissue weight as the dependent variable. Mean‐centring of the independent variable was done to obtain an estimate of the average RNA concentration per leg. This also assured that the slope and intercept did not correlate, something that could lead to issues with collinearity in subsequent modelling. A mixed effects model was subsequently fitted with differences in muscle thickness pre‐ to post‐training as the dependent variable and estimated percentage per session increases in total RNA, the mean total RNA scaled as standard deviations from the mean and sex as independent variables. Participants were used as group levels effect. The robustness of this model was assessed by leave‐one‐out analysis on the level of individual data points in the relationship between total RNA and sessions and on the level of participants (see Results).
All models were fitted using a Bayesian framework using either the brms 57 or MCMCglmm 58 package written for R. 59 Inference about effects of interest was drawn based on point estimates and their 95% credible intervals (CI). Credible intervals not containing null effects were interpreted as robust effects. Models were fitted with default priors. CIs were interpreted as containing the true population value with the specified certainty (95%), given the data and priors. Fitting performance was assessed by confirming convergence of at least four different chains of MCMC samples (graphically assessed and confirmed with ). Model performance was assessed from comparing simulated data from each model to observed data graphically (posterior predictive checks).
CONFLICT OF INTEREST
The authors do not have any conflict of interest to declare.
ACKNOWLEDGEMENTS
The authors express their gratitude to the participants who made this research possible.
Hammarström D, Øfsteng SJ, Jacobsen NB, Flobergseter KB, Rønnestad BR, Ellefsen S. Ribosome accumulation during early phase resistance training in humans. Acta Physiol. 2022;235:e13806. doi: 10.1111/apha.13806
Daniel Hammarström and Sjur J. Øfsteng contributed equally to this work.
Contributor Information
Daniel Hammarström, Email: daniel.hammarstrom@inn.no.
Sjur J. Øfsteng, Email: sjur.johansen.ofsteng@inn.no.
DATA AVAILABILITY STATEMENT
Data and code are available at github.com/dhammarstrom/ribo‐accum‐paper.
REFERENCES
- 1. Wolfe RR. The underappreciated role of muscle in health and disease. Am J Clin Nutr. 2006;84(3):475‐482. [DOI] [PubMed] [Google Scholar]
- 2. Phillips SM, Tipton KD, Aarsland A, Wolf SE, Wolfe RR. Mixed muscle protein synthesis and breakdown after resistance exercise in humans. Am J Physiol. 1997;273(Pt 1):E99‐E107. [DOI] [PubMed] [Google Scholar]
- 3. Phillips SM. A brief review of critical processes in exercise‐induced muscular hypertrophy. Sports Med. 2014;44(suppl. 1):S71‐S77. [DOI] [PMC free article] [PubMed] [Google Scholar]
- 4. Brook MS, Wilkinson DJ, Mitchell WK, et al. Skeletal muscle hypertrophy adaptations predominate in the early stages of resistance exercise training, matching deuterium oxide‐derived measures of muscle protein synthesis and mechanistic target of rapamycin complex 1 signaling. FASEB J. 2015;29(11):4485‐4496. [DOI] [PubMed] [Google Scholar]
- 5. Kim PL, Staron RS, Phillips SM. Fasted‐state skeletal muscle protein synthesis after resistance exercise is altered with training. J Physiol. 2005;568(Pt 1):283‐290. [DOI] [PMC free article] [PubMed] [Google Scholar]
- 6. Wilkinson SB, Phillips SM, Atherton PJ, et al. Differential effects of resistance and endurance exercise in the fed state on signalling molecule phosphorylation and protein synthesis in human muscle. J Physiol. 2008;586(15):3701‐3717. [DOI] [PMC free article] [PubMed] [Google Scholar]
- 7. Reidy PT, Borack MS, Markofski MM, et al. Post‐absorptive muscle protein turnover affects resistance training hypertrophy. Eur J Appl Physiol. 2017;117(5):853‐866. [DOI] [PMC free article] [PubMed] [Google Scholar]
- 8. Figueiredo VC, McCarthy JJ. The role of ribosome biogenesis in skeletal muscle hypertrophy. In: Sakuma K, ed. The Plasticity of Skeletal Muscle. Springer; 2017:141‐153. [Google Scholar]
- 9. West DWD, Baehr LM, Marcotte GR, et al. Acute resistance exercise activates rapamycin‐sensitive and ‐insensitive mechanisms that control translational activity and capacity in skeletal muscle. J Physiol. 2016;594(2):453‐468. [DOI] [PMC free article] [PubMed] [Google Scholar]
- 10. Millward DJ, Garlick PJ, James WPT, Nnanyelugo DO, Ryatt JS. Relationship between protein synthesis and RNA content in skeletal muscle. Nature. 1973;241:204. [DOI] [PubMed] [Google Scholar]
- 11. Figueiredo VC, Caldow MK, Massie V, Markworth JF, Cameron‐Smith D, Blazevich AJ. Ribosome biogenesis adaptation in resistance training‐induced human skeletal muscle hypertrophy. Am J Physiol Endocrinol Metab. 2015;309(1):E72‐E83. [DOI] [PubMed] [Google Scholar]
- 12. Stec MJ, Kelly NA, Many GM, Windham ST, Tuggle SC, Bamman MM. Ribosome biogenesis may augment resistance training‐induced myofiber hypertrophy and is required for myotube growth in vitro. Am J Physiol Endocrinol Metab. 2016;310(8):E652‐E661. [DOI] [PMC free article] [PubMed] [Google Scholar]
- 13. Hammarström D, Øfsteng S, Koll L, et al. Benefits of higher resistance‐training volume are related to ribosome biogenesis. J Physiol. 2020;598(3):543‐565. [DOI] [PubMed] [Google Scholar]
- 14. von Walden F, Liu C, Aurigemma N, Nader GA. mTOR signaling regulates myotube hypertrophy by modulating protein synthesis, rDNA transcription and chromatin remodeling. Am J Physiol Cell Physiol. 2016;311(4):C663‐C672. [DOI] [PubMed] [Google Scholar]
- 15. Warner JR. The economics of ribosome biosynthesis in yeast. Trends Biochem Sci. 1999;24(11):437‐440. [DOI] [PubMed] [Google Scholar]
- 16. Moss T, Langlois F, Gagnon‐Kugler T, Stefanovsky V. A housekeeper with power of attorney: the rRNA genes in ribosome biogenesis. Cell Mol Life Sci. 2007;64(1):29‐49. [DOI] [PMC free article] [PubMed] [Google Scholar]
- 17. Tuan JC, Zhai W, Comai L. Recruitment of TATA‐binding protein‐TAFI complex SL1 to the human ribosomal DNA promoter is mediated by the carboxy‐terminal activation domain of upstream binding factor (UBF) and is regulated by UBF phosphorylation. Mol Cell Biol. 1999;19(4):2872‐2879. [DOI] [PMC free article] [PubMed] [Google Scholar]
- 18. Lin CH, Platt MD, Ficarro SB, et al. Mass spectrometric identification of phosphorylation sites of rRNA transcription factor upstream binding factor. Am J Physiol Cell Physiol. 2007;292(5):C1617‐C1624. [DOI] [PubMed] [Google Scholar]
- 19. Nader GA, McLoughlin TJ, Esser KA. mTOR function in skeletal muscle hypertrophy: increased ribosomal RNA via cell cycle regulators. Am J Physiol Cell Physiol. 2005;289(6):C1457‐C1465. [DOI] [PubMed] [Google Scholar]
- 20. Hannan KM, Brandenburger Y, Jenkins A, et al. mTOR‐dependent regulation of ribosomal gene transcription requires S6K1 and is mediated by phosphorylation of the carboxy‐terminal activation domain of the nucleolar transcription factor UBF. Mol Cell Biol. 2003;23(23):8862‐8877. [DOI] [PMC free article] [PubMed] [Google Scholar]
- 21. Hannan RD, Stefanovsky V, Taylor L, Moss T, Rothblum LI. Overexpression of the transcription factor UBF1 is sufficient to increase ribosomal DNA transcription in neonatal cardiomyocytes: implications for cardiac hypertrophy. Proc Natl Acad Sci USA. 1996;93(16):8750‐8755. [DOI] [PMC free article] [PubMed] [Google Scholar]
- 22. Sanij E, Poortinga G, Sharkey K, et al. UBF levels determine the number of active ribosomal RNA genes in mammals. J Cell Biol. 2008;183(7):1259‐1274. [DOI] [PMC free article] [PubMed] [Google Scholar]
- 23. Figueiredo VC, Wen Y, Alkner B, et al. Genetic and epigenetic regulation of skeletal muscle ribosome biogenesis with exercise. J Physiol. 2021;599(13):3363‐3384. doi: 10.1113/jp281244 [DOI] [PubMed] [Google Scholar]
- 24. Stec MJ, Mayhew DL, Bamman MM. The effects of age and resistance loading on skeletal muscle ribosome biogenesis. J Appl Physiol. 2015;119(8):851‐857. [DOI] [PMC free article] [PubMed] [Google Scholar]
- 25. Nader GA, von Walden F, Liu C, et al. Resistance exercise training modulates acute gene expression during human skeletal muscle hypertrophy. J Appl Physiol. 2014;116(6):693‐702. [DOI] [PubMed] [Google Scholar]
- 26. Bickel CS, Slade J, Mahoney E, Haddad F, Dudley GA, Adams GR. Time course of molecular responses of human skeletal muscle to acute bouts of resistance exercise. J Appl Physiol. 2005;98(2):482‐488. [DOI] [PubMed] [Google Scholar]
- 27. Brook MS, Wilkinson DJ, Mitchell WK, et al. Synchronous deficits in cumulative muscle protein synthesis and ribosomal biogenesis underlie age‐related anabolic resistance to exercise in humans. J Physiol. 2016;594(24):7399‐7417. [DOI] [PMC free article] [PubMed] [Google Scholar]
- 28. Young VR. Chapter 40—The role of skeletal and cardiac muscle in the regulation of protein metabolism. In: Munro HN, ed. Mammalian Protein Metabolism. London: Academic Press; 1970:585‐674. [Google Scholar]
- 29. Haun CT, Vann CG, Mobley CB, et al. Pre‐training skeletal muscle fiber size and predominant fiber type best predict hypertrophic responses to 6 weeks of resistance training in previously trained young men. Front Physiol. 2019;10:297. doi: 10.3389/fphys.2019.00297 [DOI] [PMC free article] [PubMed] [Google Scholar]
- 30. Haddad F, Baldwin KM, Tesch PA. Pretranslational markers of contractile protein expression in human skeletal muscle: effect of limb unloading plus resistance exercise. J Appl Physiol. 2005;98(1):46‐52. [DOI] [PubMed] [Google Scholar]
- 31. Figueiredo VC, McCarthy JJ. Regulation of ribosome biogenesis in skeletal muscle hypertrophy. Physiology (Bethesda). 2019;34(1):30‐42. [DOI] [PMC free article] [PubMed] [Google Scholar]
- 32. Mobley CB, Haun CT, Roberson PA, et al. Biomarkers associated with low, moderate, and high vastus lateralis muscle hypertrophy following 12 weeks of resistance training. PLoS One. 2018;13(4):e0195203. [DOI] [PMC free article] [PubMed] [Google Scholar]
- 33. Crossland H, Timmons JA, Atherton PJ. A dynamic ribosomal biogenesis response is not required for IGF‐1‐mediated hypertrophy of human primary myotubes. FASEB J. 2017;31(12):5196‐5207. doi: 10.1096/fj.201700329R [DOI] [PMC free article] [PubMed] [Google Scholar]
- 34. Habets PE, Franco D, Ruijter JM, Sargeant AJ, Pereira JA, Moorman AF. RNA content differs in slow and fast muscle fibers: implications for interpretation of changes in muscle gene expression. J Histochem Cytochem. 1999;47(8):995‐1004. [DOI] [PubMed] [Google Scholar]
- 35. Chaillou T, Zhang X, McCarthy JJ. Expression of muscle‐specific ribosomal protein L3‐like impairs myotube growth. J Cell Physiol. 2016;231(9):1894‐1902. [DOI] [PMC free article] [PubMed] [Google Scholar]
- 36. Chaillou T. Ribosome specialization and its potential role in the control of protein translation and skeletal muscle size. J Appl Physiol. 2019;127(2):599‐607. doi: 10.1152/japplphysiol.00946.2018 [DOI] [PubMed] [Google Scholar]
- 37. Gupta V, Warner JR. Ribosome‐omics of the human ribosome. RNA. 2014;20(7):1004‐1013. [DOI] [PMC free article] [PubMed] [Google Scholar]
- 38. Lam YW, Lamond AI, Mann M, Andersen JS. Analysis of nucleolar protein dynamics reveals the nuclear degradation of ribosomal proteins. Curr Biol. 2007;17(9):749‐760. [DOI] [PMC free article] [PubMed] [Google Scholar]
- 39. Murach KA, Dungan CM, von Walden F, Wen Y. Epigenetic evidence for distinct contributions of resident and acquired myonuclei during long‐term exercise adaptation using timed in vivo myonuclear labeling. Am J Physiol‐Cell Physiol. 2022;322(1):C86‐C93. [DOI] [PMC free article] [PubMed] [Google Scholar]
- 40. Warner JR, McIntosh KB. How common are extraribosomal functions of ribosomal proteins? Mol Cell. 2009;34(1):3‐11. [DOI] [PMC free article] [PubMed] [Google Scholar]
- 41. Figueiredo VC, Roberts LA, Markworth JF, et al. Impact of resistance exercise on ribosome biogenesis is acutely regulated by post‐exercise recovery strategies. Physiol Rep. 2016;4(2):e12670. doi: 10.14814/phy2.12670 [DOI] [PMC free article] [PubMed] [Google Scholar]
- 42. Goodman CA, Frey JW, Mabrey DM, et al. The role of skeletal muscle mTOR in the regulation of mechanical load‐induced growth. J Physiol. 2011;589(Pt 22):5485‐5501. [DOI] [PMC free article] [PubMed] [Google Scholar]
- 43. Poortinga G, Hannan KM, Snelling H, et al. MAD1 and c‐MYC regulate UBF and rDNA transcription during granulocyte differentiation. EMBO J. 2004;23(16):3325‐3335. [DOI] [PMC free article] [PubMed] [Google Scholar]
- 44. Gamrin L, Berg HE, Essén P, et al. The effect of unloading on protein synthesis in human skeletal muscle: unloading and skeletal muscle biochemistry. Acta Physiol Scand. 1998;163(4):369‐377. [DOI] [PubMed] [Google Scholar]
- 45. Figueiredo VC, D'Souza RF, Van Pelt DW, et al. Ribosome biogenesis and degradation regulate translational capacity during muscle disuse and reloading. J Cachexia Sarcopenia Muscle. 2021;12(1):130‐143. doi: 10.1002/jcsm.12636 [DOI] [PMC free article] [PubMed] [Google Scholar]
- 46. Beese CJ, Brynjólfsdóttir SH, Frankel LB. Selective autophagy of the protein homeostasis machinery: ribophagy, proteaphagy and ER‐phagy. Front Cell Dev Biol. 2020;7:373. [DOI] [PMC free article] [PubMed] [Google Scholar]
- 47. Kim H‐G, Huot JR, Pin F, Guo B, Bonetto A, Nader GA. Reduced rDNA transcription diminishes skeletal muscle ribosomal capacity and protein synthesis in cancer cachexia. FASEB J. 2021;35(2):e21335. [DOI] [PMC free article] [PubMed] [Google Scholar]
- 48. Ahtiainen JP, Walker S, Silvennoinen M, et al. Exercise type and volume alter signaling pathways regulating skeletal muscle glucose uptake and protein synthesis. Eur J Appl Physiol. 2015;115(9):1835‐1845. [DOI] [PubMed] [Google Scholar]
- 49. Burd NA, Holwerda AM, Selby KC, et al. Resistance exercise volume affects myofibrillar protein synthesis and anabolic signalling molecule phosphorylation in young men. J Physiol. 2010;588(Pt 16):3119‐3130. [DOI] [PMC free article] [PubMed] [Google Scholar]
- 50. Schoenfeld BJ, Ogborn D, Krieger JW. Dose‐response relationship between weekly resistance training volume and increases in muscle mass: a systematic review and meta‐analysis. J Sports Sci. 2017;35(11):1073‐1082. [DOI] [PubMed] [Google Scholar]
- 51. Ralston GW, Kilgore L, Wyatt FB, Baker JS. The effect of weekly set volume on strength gain: a meta‐analysis. Sports Med. 2017;47(12):2585‐2601. [DOI] [PMC free article] [PubMed] [Google Scholar]
- 52. Grgic J, Mikulic P, Podnar H, Pedisic Z. Effects of linear and daily undulating periodized resistance training programs on measures of muscle hypertrophy: a systematic review and meta‐analysis. PeerJ. 2017;5:e3695. [DOI] [PMC free article] [PubMed] [Google Scholar]
- 53. Schindelin J, Arganda‐Carreras I, Frise E, et al. Fiji: an open‐source platform for biological‐image analysis. Nat Methods. 2012;9(7):676‐682. [DOI] [PMC free article] [PubMed] [Google Scholar]
- 54. Kopec AM, Rivera PD, Lacagnina MJ, Hanamsagar R, Bilbo SD. Optimized solubilization of TRIzol‐precipitated protein permits western blotting analysis to maximize data available from brain tissue. J Neurosci Methods. 2017;280:64‐76. [DOI] [PMC free article] [PubMed] [Google Scholar]
- 55. Ritz C, Spiess AN. qpcR: an R package for sigmoidal model selection in quantitative real‐time polymerase chain reaction analysis. Bioinformatics. 2008;24(13):1549‐1551. [DOI] [PubMed] [Google Scholar]
- 56. Matz MV, Wright RM, Scott JG. No control genes required: Bayesian analysis of qRT‐PCR data. PLoS One. 2013;8(8):e71448. [DOI] [PMC free article] [PubMed] [Google Scholar]
- 57. Bürkner P‐C. Brms: an R package for bayesian multilevel models using stan. Journal of Statistical Software. 2017;80:1‐28. [Google Scholar]
- 58. Hadfield JD. MCMC Methods for Multi‐Response Generalized Linear Mixed Models: TheMCMCglmmRPackage. Journal of Statistical Software. 2010;33:1‐22. [PMC free article] [PubMed] [Google Scholar]
- 59. R Core Team . R: A language and environment for statistical computing. R Foundation for Statistical Computing, Vienna, Austria. 2021. https://www.R‐project.org/. Accessed August 10, 2021.
Associated Data
This section collects any data citations, data availability statements, or supplementary materials included in this article.
Data Availability Statement
Data and code are available at github.com/dhammarstrom/ribo‐accum‐paper.