Abstract
The spinal cord of the tree pangolin is known to be very short compared to the overall length of the body and tail. Here, we provide a description of the tree pangolin spinal cord to determine whether the short length contributes to specific structural, and potentially functional, differences. The short spinal cord of the adult tree pangolin, at around 13 cm, terminates at the midthoracic level. Within this shortened spinal cord, we could identify six regions, which from rostral to caudal include the prebrachial, brachial, interramal, crural, postcrural, and caudal regions, with both the brachial and crural regions showing distinct swellings. The chemoarchitecture of coronal sections through these regions confirmed regional assignation, being most readily delineated by the presence of cholinergic neurons forming the intermediolateral column in the interramal region and the sacral parasympathetic nucleus in the postcrural region. The 10 laminae of Rexed were observed throughout the spinal cord and presented with an anatomical organization similar to that observed in other mammals. Despite the shortened length of the tree pangolin spinal cord, the regional and laminar anatomical organization is very similar to that observed in other mammals. This indicates that the functional aspects of the short tree pangolin spinal cord can be inferred from what is known in other mammals.
Keywords: Carnivora, cauda equina, Pholidota, RRID:AB_10000340, RRID:AB_11204707, RRID:AB_2079751, sensorimotor, spinal cord
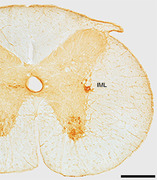
Graphical abstract: Immunohistochemical staining for choline acetyltransferase reveals the presence of the lamina 9 motor neurons and the sympathetic preganglionic cholinergic neurons of the intermediolateral nucleus (IML) within the interramal region of this coronal section through the spinal cord of the tree pangolin. In this image, dorsal is to the top and medial toward the left. Scale bar = 500 μm.
Abbreviations
- 10Sp
lamina 10 of the spinal gray
- 1Sp
lamina 1 of the spinal gray
- 2SpI
lamina 2 of the spinal gray, inner part
- 2SpO
lamina 2 of the spinal gray, outer part
- 3Sp
lamina 3 of the spinal gray
- 4Sp
lamina 4 of the spinal gray
- 5SpL
lamina 5 of the spinal gray, lateral part
- 5SpM
lamina 5 of the spinal gray, medial part
- 6Sp
lamina 6 of the spinal gray
- 6SpL
lamina 6 of the spinal gray, lateral part
- 6SpM
lamina 6 of the spinal gray, medial part
- 7Sp
lamina 7 of the spinal gray
- 8Sp
lamina 8 of the spinal gray
- 9Sp
lamina 9 of the spinal gray
- cc
central canal
- cccc
cholinergic central canal cluster
- CeCV
central cervical nucleus
- cu
cuneate fasciculus
- dl
dorsal lateral fasciculus (Lissauer)
- drn
dorsal root nerve
- gr
gracile fasciculus
- ICl
intercalated nucleus
- IML
intermediolateral column
- LatC
lateral cervical nucleus
- lf
lateral funiculus
- LSp
lateral spinal nucleus
- psdc
postsynaptic dorsal column pathway
- SD Com
sacral dorsal commissural nucleus
- SPSy
sacral parasympathetic nucleus
- vf
ventral funiculus
- vmf
ventral median fissure
- vwc
ventral white commissure
1. INTRODUCTION
The spinal cord is the neural interface between the brain and body, primarily carrying sensory information from the body to the brain and motor information from the brain to the effector organs of the body, but also having its own internal circuitry related to specific aspects of neural information processing. All vertebrates studied to date have a spinal cord, and the organization of the spinal cord does not vary dramatically across mammal species (e.g., Rexed, 1952, 1954; Sengul et al., 2013). Distinct shared features of the mammalian spinal cord include the central canal (cc), surrounded by the spinal gray matter that evinces a “butterfly‐wing” appearance in the coronal plane, which is in turn enveloped by white matter pathways forming funiculi (e.g., Sengul & Watson, 2012).
Tree pangolins show a range of locomotion styles, including quadrupedal walking on the ground, walking on the hind legs only using the prehensile tail for balance, and they can climb trees, even in the absence of branches, again employing the prehensile tail (Kingdon, 1971). Tree pangolins also burrow into ant and termite colonies, using primarily their forelimbs to access their prey (Swart et al., 1999). When threatened the tree pangolin undergoes volvation, the act of rolling into a ball for self‐defense, presenting the threat with the hard scales of its back and protecting the soft underbelly (Pocock, 1924). In addition, the integumentary anatomy of the pangolin contains the features typically observed across mammals (e.g., Lin et al., 2015; Weber, 1892). These features of the tree pangolin life history and corporeal morphology indicate that the tree pangolin spinal cord is probably like those observed in other mammalian species.
Despite this, two features of interest relating to the spinal cord have been described previously in the tree pangolin. The first observation is that of the short overall length of the spinal cord in the tree pangolin, which terminates at the midthoracic level (Imam et al., 2017) rather than caudally in the lumbar, sacral, or caudal regions of the vertebral canal as seen in other mammal species (e.g., Badlangana et al., 2007; Rexed, 1952, 1954; Sengul et al., 2013). The second observation of interest is the rostrally located decussation of the pyramidal tract (Chang, 1944; Imam et al., 2017), which has been noted to decussate at the level of the facial nerve nucleus (Imam et al., 2019c). Both these features have the potential to lead to changes in both the regional and architectural organization of the tree pangolin spinal cord.
Here, we finalize our series describing the anatomy of the central nervous system of the tree pangolin (Imam et al., 2017, 2018a, 2018b, 2019a, 2019b, 2019c, 2022a, 2022b, 2022c), by providing a detailed description of the external and internal anatomy of the spinal cord. Due to the foreshortening of the spinal cord of the tree pangolin (Imam et al., 2017), we employ a regional approach in this description, rather than the more commonly used vertebral level approach, as recommended by Sengul et al. (2013) for comparative studies.
2. MATERIALS AND METHODS
2.1. Specimen, Sectioning, and immunohistochemical staining
Adult tree pangolins (Manis tricuspis), caught from wild populations in Esejire, Osun State, Nigeria, were used in the current study (see Imam et al., 2017, for full details of animals, permits, and collection and treatment of tissue). All animals were treated and used according to the guidelines of the University of the Witwatersrand Animal Ethics Committee (AESC No. 2012/53/01), which parallels those of the National Institutes of Health (NIH) for the care and use of animals in scientific experimentation. In the current study, the spinal cord of one of these tree pangolins (MT3, a male with a body mass of 1.8 kg, and a brain mass of 9.7 g, see Imam et al., 2017) was used. This spinal cord was segmented, in the coronal plane, into 3‐mm long blocks along the entire length, with the rostral face of the block noted. Prior to sectioning, each spinal cord block was allowed to equilibrate in 30% sucrose in 0.1 M PB at 4°C. The blocks were then frozen in crushed dry ice and sectioned into 50‐μm‐thick sections on a freezing microtome, with a total of 12 sections of the entire cross‐sectional area of the spinal cord being taken from each block. These 12 sections were divided into four series, with three sections per series being stained for Nissl, neuronal nuclear marker (NeuN), choline acetyltransferase (ChAT), and calbindin. Details of staining protocol for Nissl, antibody characterization, specificity, and the protocol followed for all immunostains, have been provided previously (Imam et al., 2018a; Table 1). Nissl and NeuN stains were employed to reveal the cytoarchitecture and laminae of the spinal gray matter. The ChAT staining specifically reveals lamina 9 of the spinal gray, the cholinergic central canal cluster (cccc), and the intermediolateral column and sacral parasympathetic nucleus (SPSy) both of which are important for the definition of the interramal and postcrural region of the spinal cord, respectively. Calbindin staining is particularly useful for the definition of lamina 8 of the spinal gray and aids in the definition of other lamina.
TABLE 1.
Sources and dilution of antibodies used in the current study
| Antibody | Host | Immunogen | Manufacturer | Catalog no. | Reference | Dilution | RRID |
|---|---|---|---|---|---|---|---|
| ChAT | Goat | Human placental enzyme | Merck‐Millipore | AB144P | Kaiser et al., 2011; Laux et al., 2012 | 1:3000 | AB_2079751 |
| CB | Rabbit | Rat recombinant calbindin D‐28k | Swant | CB38a | Bunce et al., 2013 | 1:10,000 | AB_10000340 |
| NeuN | Rabbit | GST‐tagged recombinant protein corresponding to mouse NeuN | Merck‐Millipore | ABN78C3 | Ngwenya et al., 2016 | 1:500 | AB_11204707 |
Abbreviations: choline acetyltransferase (ChAT), calbindin (CB), neuronal nuclear marker (NeuN).
2.2. Analysis and iconography
A low‐power stereomicroscope was used to examine the sections and camera lucida drawings of the sections, outlining architectural borders, were made. Architectonic borders were first defined using the Nissl stain. The internal architecture of the gray and white matter of the spinal cord was then confirmed and refined using the immunohistochemical stains. The drawings were then scanned and redrawn using the Canvas Draw 6 program (Canvas GFX, Inc., FL, USA). These drawings were then measured in Image J to derive data relevant to the cross‐sectional surface areas described in the current study (Table 2). It should be noted here that the measurements provided were not corrected for shrinkage related to the histological processing and thus may be somewhat smaller than observed in the natural condition (Wehrl et al., 2015) and can only be regarded as a close approximation of the natural, unprocessed condition. The nomenclature, both specific and regional, used in the current study was based on that used by Sengul and Watson (2012), Sengul et al. (2013), and Watson et al. (2017). Digital photomicrographs were captured using a Zeiss Axioskop. No pixilation adjustments, or manipulation of the captured images were undertaken, except for the adjustment of contrast, brightness, and levels using Adobe Photoshop.
TABLE 2.
Data generated for area analyses reported in the current study of the tree pangolin spinal cord
| Region | Block | SC area (mm2) | WM area (mm2) | % WM | GM area (mm2) | % GM | CC area (mm2) | % CC |
|---|---|---|---|---|---|---|---|---|
| Prebrachial | 1 | 14.47 | 9.93 | 68.60 | 4.52 | 31.23 | 0.024 | 0.17 |
| 2 | 12.48 | 8.79 | 70.45 | 3.67 | 29.44 | 0.014 | 0.11 | |
| 3 | 13.28 | 9.28 | 69.93 | 3.98 | 29.95 | 0.016 | 0.12 | |
| Brachial | 4 | 15.69 | 10.55 | 67.22 | 5.10 | 32.53 | 0.040 | 0.26 |
| 5 | 16.36 | 10.71 | 65.45 | 5.60 | 34.22 | 0.054 | 0.33 | |
| 6 | 16.47 | 10.76 | 65.32 | 5.64 | 34.25 | 0.070 | 0.43 | |
| 7 | 15.24 | 9.73 | 63.86 | 5.45 | 35.75 | 0.058 | 0.38 | |
| Interramal | 8 | 11.72 | 7.91 | 67.53 | 3.77 | 32.17 | 0.034 | 0.29 |
| 9 | 9.99 | 7.08 | 70.84 | 2.87 | 28.76 | 0.040 | 0.41 | |
| 10 | 9.60 | 6.95 | 72.46 | 2.61 | 27.14 | 0.038 | 0.40 | |
| 11 | 8.73 | 6.34 | 72.60 | 2.36 | 27.03 | 0.032 | 0.37 | |
| 12 | 9.64 | 6.90 | 71.50 | 2.72 | 28.18 | 0.031 | 0.32 | |
| 13 | 9.17 | 6.57 | 71.64 | 2.56 | 27.96 | 0.036 | 0.40 | |
| 14 | 8.10 | 5.84 | 72.07 | 2.24 | 27.59 | 0.028 | 0.34 | |
| 15 | 8.47 | 6.13 | 72.40 | 2.31 | 27.27 | 0.028 | 0.33 | |
| 16 | 8.68 | 6.28 | 72.28 | 2.37 | 27.35 | 0.033 | 0.38 | |
| 17 | 8.36 | 5.94 | 71.08 | 2.39 | 28.65 | 0.022 | 0.27 | |
| 18 | 8.62 | 6.06 | 70.31 | 2.53 | 29.41 | 0.024 | 0.28 | |
| 19 | 8.73 | 6.01 | 68.87 | 2.69 | 30.85 | 0.024 | 0.28 | |
| 20 | 9.23 | 6.33 | 68.56 | 2.88 | 31.20 | 0.022 | 0.24 | |
| Crural | 21 | 10.03 | 6.59 | 65.71 | 3.40 | 33.93 | 0.036 | 0.36 |
| 22 | 11.19 | 7.12 | 63.62 | 4.03 | 35.98 | 0.044 | 0.40 | |
| 23 | 13.07 | 7.97 | 60.92 | 5.06 | 38.72 | 0.046 | 0.36 | |
| 24 | 13.85 | 8.37 | 60.46 | 5.44 | 39.29 | 0.034 | 0.25 | |
| 25 | 13.27 | 7.33 | 55.23 | 5.90 | 44.51 | 0.034 | 0.26 | |
| Postcrural | 26 | 9.61 | 5.13 | 53.41 | 4.47 | 46.48 | 0.010 | 0.10 |
| 27 | 7.12 | 4.02 | 56.47 | 3.09 | 43.44 | 0.006 | 0.08 | |
| 28 | 6.45 | 3.69 | 57.18 | 2.76 | 42.69 | 0.008 | 0.13 | |
| Caudal | 29 | 6.05 | 3.44 | 56.82 | 2.60 | 43.05 | 0.008 | 0.13 |
| 30 | 5.86 | 3.23 | 55.17 | 2.61 | 44.63 | 0.012 | 0.21 | |
| 31 | 5.60 | 3.14 | 56.07 | 2.45 | 43.69 | 0.014 | 0.25 | |
| 32 | 5.33 | 2.88 | 54.05 | 2.43 | 45.65 | 0.016 | 0.30 | |
| 33 | 5.06 | 2.69 | 53.11 | 2.36 | 46.54 | 0.018 | 0.36 | |
| 34 | 4.74 | 2.47 | 52.11 | 2.26 | 47.56 | 0.016 | 0.34 | |
| 35 | 4.42 | 2.28 | 51.59 | 2.12 | 47.97 | 0.020 | 0.45 | |
| 36 | 4.24 | 2.11 | 49.70 | 2.11 | 49.84 | 0.020 | 0.47 | |
| 37 | 4.15 | 2.00 | 48.21 | 2.13 | 51.40 | 0.016 | 0.39 | |
| 38 | 3.71 | 1.74 | 46.95 | 1.95 | 52.67 | 0.014 | 0.38 | |
| 39 | 3.20 | 1.35 | 42.05 | 1.83 | 57.20 | 0.024 | 0.75 | |
| 40 | 2.86 | 1.18 | 41.39 | 1.66 | 57.97 | 0.018 | 0.64 | |
| 41 | 1.65 | 0.63 | 38.15 | 1.01 | 61.36 | 0.008 | 0.49 | |
| 42 | 0.71 | 0.20 | 28.15 | 0.50 | 71.36 | 0.003 | 0.49 |
SC area—Cross‐sectional area of coronal section through spinal cord; WM area—Cross sectional area of spinal cord occupied by white matter; % WM—Percentage of cross‐sectional area of spinal cord occupied by white matter; GM area—Cross‐sectional area of spinal cord occupied by gray matter; % GM—Percentage of cross‐sectional area of spinal cord occupied by gray matter; CC area—Cross‐sectional area of spinal cord occupied by the central canal of the spinal cord; % CC—Percentage of cross‐sectional area of spinal cord occupied by the central canal of the spinal cord. Note that the areas provided are not corrected for shrinkage related to the histological processing procedures
3. RESULTS
As reported previously (Imam et al., 2017), the spinal cord of the tree pangolin is comparatively short, ending at the midthoracic level before giving rise to a cauda equina that occupies the vertebral canal through to the end of the caudal vertebrae (Figure 1). Our direct measurement of the pangolin spinal cord used in this study indicated that the spinal cord is 13 cm in length (Figures 1 and 2a). The spinal cord of the tree pangolin, based on measurements of the cross‐sectional area (Table 2), shows two distinct enlarged regions, which when associated with microscopic analyses (see below), indicate that the spinal cord can be segregated into six regions (Figure 2b). These regions are, from rostral to caudal, the prebrachial, brachial, interramal, crural, postcrural, and caudal regions (as defined by Sengul & Watson, 2012; Sengul et al., 2013). The two regions of increased cross‐sectional area correspond to the brachial (or the cervical enlargement) and crural (or the lumbar enlargement) regions of the spinal cord (Figure 2c). As the spinal cord of the tree pangolin does not extend throughout the vertebral canal, in the current description we adopt the regional approach, as matching the spinal nerves to the intervertebral foramina through which they pass, to obtain vertebral levels, was not practical at the time of specimen collection (or particularly meaningful in cross‐species comparisons, see Sengul & Watson, 2012; Sengul et al., 2013).
FIGURE 1.
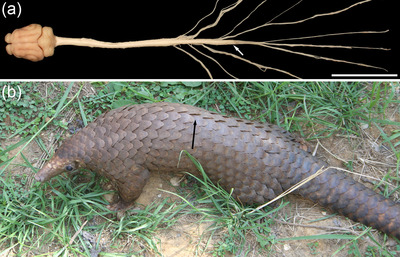
(a) Dorsal view of the central nervous system of the tree pangolin showing the approximately 13‐cm long spinal cord (termination of spinal cord indicated by the white arrow prior to the cauda equina), modified from Imam et al. (2017, fig. 4). Scale bar in (a) = 5 cm. (b) Photograph of the tree pangolin (Manis tricupsis) showing the approximate level of the termination of the spinal cord (black arrow). The length of the tree pangolin head and body ranges between 33 and 43 cm, while the tail extends between 49 and 63 cm caudal to the body
FIGURE 2.
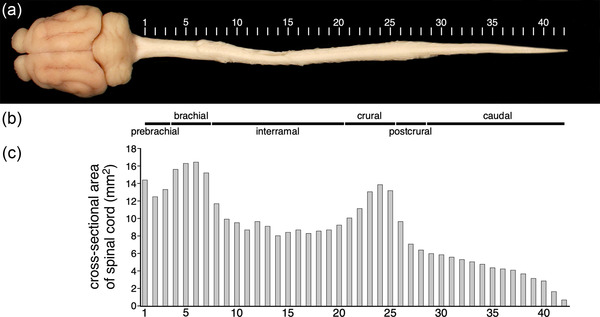
(a) Dorsal view of the central nervous system the tree pangolin (modified from Figure 1 by the digital removal of the spinal nerves) showing the levels (1–42, each approximately 3 mm apart) at which coronal sections were taken for analysis. These levels are referred to throughout this manuscript. (b) Due to the shortening of the tree pangolin spinal cord (which is approximately 13 cm in length), we adopt the regional terminology, rather than the more commonly used segmental terminology, for describing the tree pangolin spinal cord as outlined by Sengul et al. (2013). As with other mammals the tree pangolin spinal cord can be divided into six regions, these being, from rostral to caudal, the prebrachial (levels 1–3), brachial (levels 4–7), interramal (levels 8–20), crural (levels 21–25), postcrural (levels 26–28), and caudal (levels 29–42) regions (region delineation based on architectonic analysis, see below). (c) Graph depicting the cross‐sectional area of the spinal cord in the coronal plane. Note the enlargement of the spinal cord at the brachial and crural regions, which coincide with the input from the limbs (see Table 2 for data)
3.1. General organization of the gray and white matter of the tree pangolin spinal cord
As with all vertebrate spinal cords, the spinal cord of the tree pangolin exhibited a central region of gray matter surrounding by white matter. The proportion of the cross‐sectional area, in the coronal plane, of the spinal cord occupied by gray versus white matter varied along the length of the spinal cord, with the rostral portions having relatively larger proportions of the cross‐sectional area occupied by white matter, the proportion of which decreased caudally, with the caudal most portions of the spinal cord being predominately occupied by gray matter (Figures 3 and 4, 5, 6, 7, 8, 9; Table 2). The gray matter exhibits the commonly observed “butterfly‐wing” appearance, with gray matter from each side fusing at the midline around the cc of the spinal cord. Within the spinal gray matter, we could identify the dorsal, ventral, and intermediate columns, with the dorsal and ventral columns found along the entire length of the spinal cord, while the intermediate column was only identified in the interramal and postcrural regions. The spinal white matter encircled the spinal gray matter along the entire length of the spinal cord (Figures 4, 5, 6, 7, 8, 9), with distinct thickenings of the white matter in the dorsal, lateral, and ventral aspects, these thickenings being the dorsal, lateral, and ventral funiculi. In addition, the dorsolateral funiculus, overlying the dorsolateral border of the spinal gray matter could be observed along the entire length of the spinal cord.
FIGURE 3.
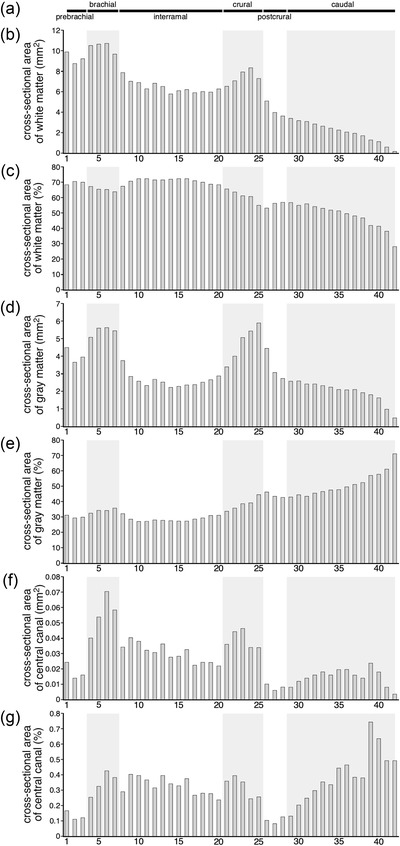
Graphs showing the absolute (b, d, f, data given in mm2) and proportional (c, e, g, data given as a percentage) areas occupied by white matter (b, c), gray matter (d, e), and the central canal (f, g) at the different levels of the tree pangolin spinal cord examined in the current study (Table 2). The six regions into which the spinal cord can be divided are shown at the top of the graphs (a) and are represented by alternating white and pale gray shading in the graphs (b–g). Note than in the brachial and crural regions, the absolute size of the area of the white matter (b), gray matter (d), and central canal (g), increases. In contrast, when represented as a proportion of the total cross‐sectional area of the spinal cord, the relative area occupied by white matter decreased slightly (c), for gray matter there are slightly increases (e), while that of the central canal varies (g)
FIGURE 4.
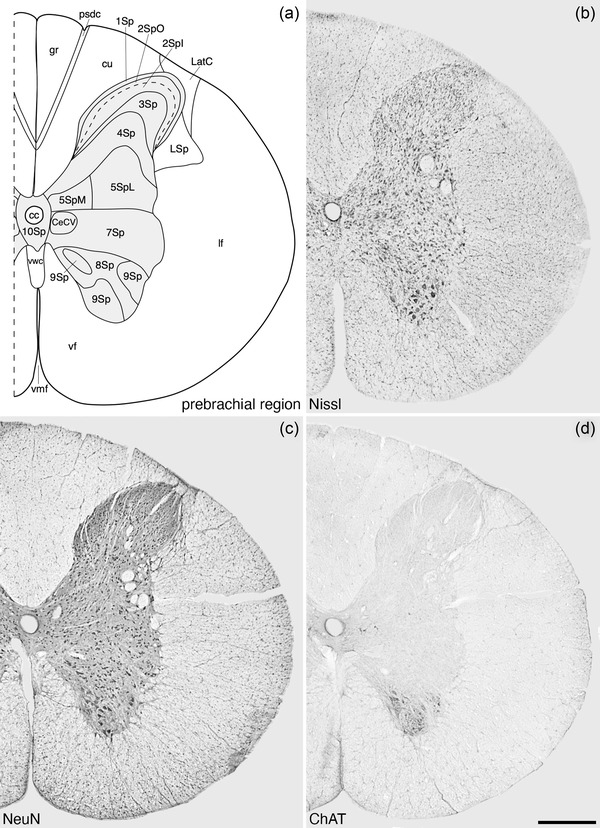
Architectonic reconstruction (a) and low magnification photomicrographs stained for Nissl (b), neuronal nuclear marker (NeuN, c), and choline acetyltransferase (ChAT, d) of coronal sections through the prebrachial region of the tree pangolin spinal cord. In all images, dorsal to the top and medial to the left and correspond to level 2 depicted in Figures 2 and 3. Scale bar in (d) = 500 μm and applies to all images. See list for abbreviations
FIGURE 5.
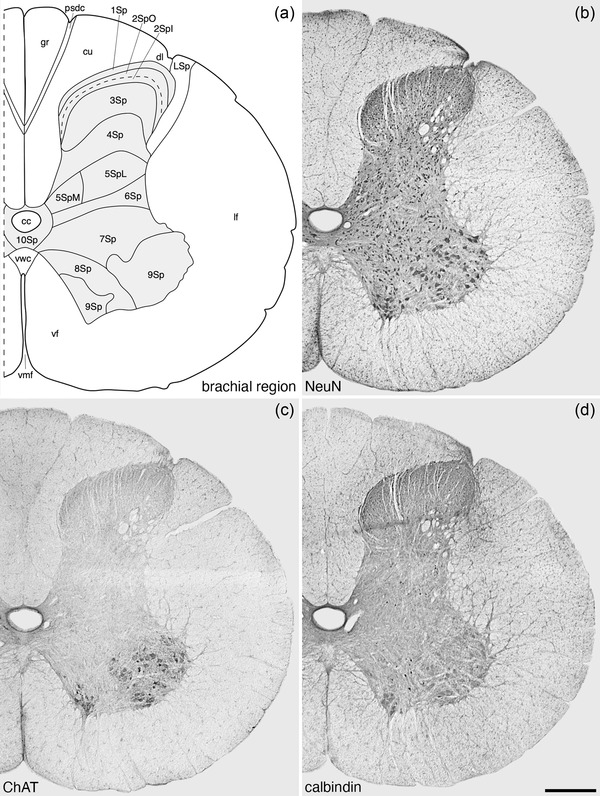
Architectonic reconstruction (a) and low magnification photomicrographs stained neuronal nuclear marker (NeuN, a), choline acetyltransferase (ChAT, c) and calbindin (d) of coronal sections through the brachial region of the tree pangolin spinal cord. In all images, dorsal to the top and medial to the left and correspond to level 4 depicted in Figures 2 and 3. Scale bar in (d) = 500 μm and applies to all images. See list for abbreviations
FIGURE 6.
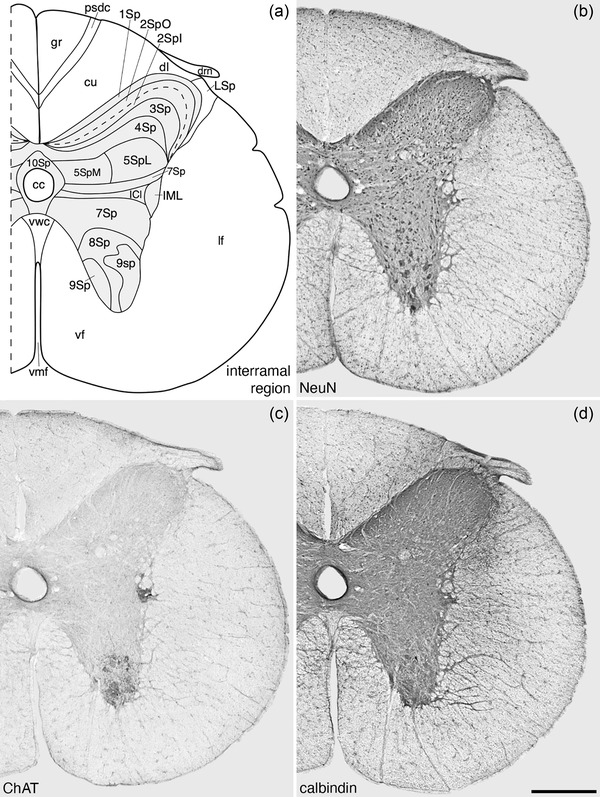
Architectonic reconstruction (a) and low magnification photomicrographs stained neuronal nuclear marker (NeuN, a), choline acetyltransferase (ChAT, c) and calbindin (d) of coronal sections through the interramal region of the tree pangolin spinal cord. In all images, dorsal to the top and medial to the left and correspond to level 16 depicted in Figures 2 and 3. Scale bar in (d) = 500 μm and applies to all images. See list for abbreviations
FIGURE 7.
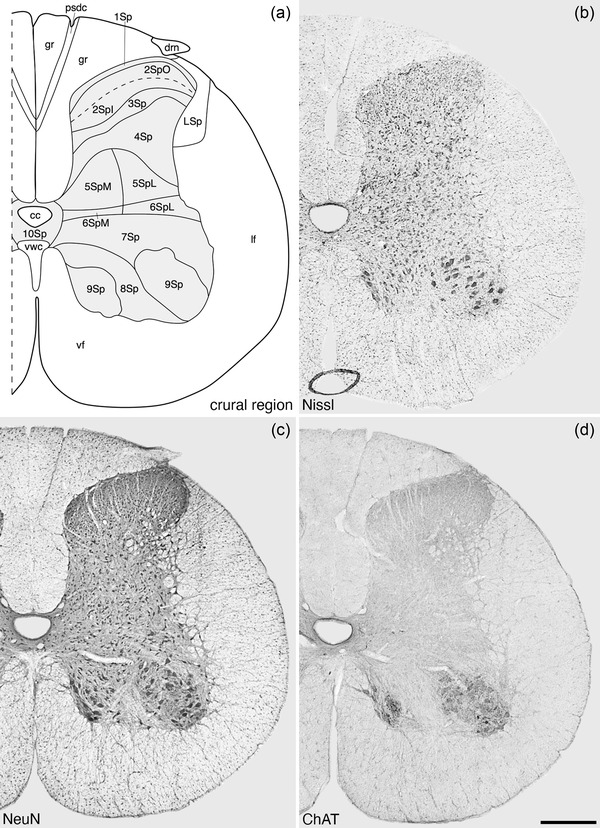
Architectonic reconstruction (a) and low magnification photomicrographs stained for Nissl (b), neuronal nuclear marker (NeuN, c), and choline acetyltransferase (ChAT, d) of coronal sections through the crural region of the tree pangolin spinal cord. In all images, dorsal to the top and medial to the left and correspond to level 23 depicted in Figures 2 and 3. Scale bar in (d) = 500 μm and applies to all images. See list for abbreviations
FIGURE 8.
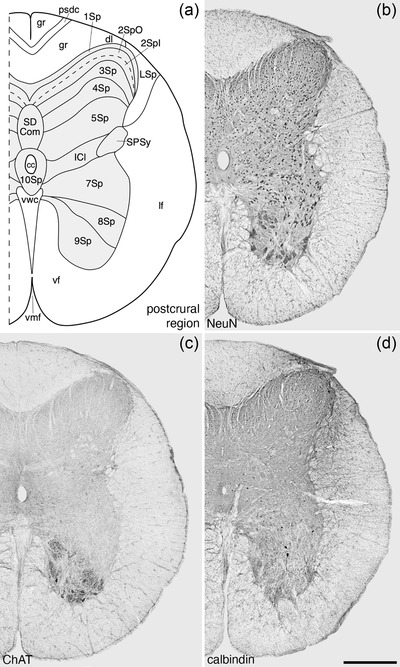
Architectonic reconstruction (a) and low magnification photomicrographs stained for Nissl (b), neuronal nuclear marker (NeuN, c), and choline acetyltransferase (ChAT, d) of coronal sections through the postcrural region of the tree pangolin spinal cord. In all images, dorsal to the top and medial to the left and correspond to level 23 depicted in Figures 2 and 3. Scale bar in (d) = 500 μm and applies to all images. See list for abbreviations
FIGURE 9.
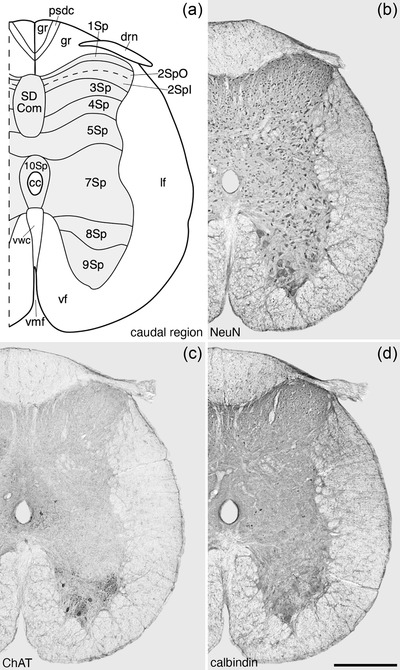
Architectonic reconstruction (a) and low magnification photomicrographs stained for Nissl (b), neuronal nuclear marker (NeuN, c), and choline acetyltransferase (ChAT, d) of coronal sections through the caudal region of the tree pangolin spinal cord. In all images, dorsal to the top and medial to the left and correspond to level 34 depicted in Figures 2 and 3. Scale bar in (d) = 500 μm and applies to all images. See list for abbreviations
The absolute cross‐sectional area of the spinal cord occupied by white matter shows a steady rostral to caudal decrease, but within the brachial and crural enlargements there are distinct enlargements in the cross‐sectional area of the white matter (Figure 3b; Table 2). This variation in white matter area is reflected in the proportional analysis, where we see a broad rostrocaudal decrease in the proportion of the cross‐sectional area of the spinal cord being occupied by white matter (Figure 3c; Table 2). Interestingly, there are two distinct decreases in this relative proportion that correspond to the brachial and crural regions (Figure 3c; Table 2). The absolute cross‐sectional area of the gray matter of the spinal cord also exhibits the general rostrocaudal decrease, but this is a less pronounced decrease than seen in the white matter (Figure 3d; Table 2). In this case, there are two evident increases in the cross‐sectional area of the gray matter that correspond to the brachial and crural enlargements (Figure 3d; Table 2). Proportionally, there is a steady increase in the proportion of the cross‐sectional area of the spinal cord occupied by gray matter, with small relative proportional increases being noted in the brachial and crural regions (Figure 3d; Table 2). The absolute cross‐sectional area of the cc of the spinal cord exhibits a loose rostrocaudal decrease; however, two distinct enlargements in the brachial and crural regions were noted (Figure 3f; Table 2). When examined as a proportion of the cross‐sectional area of the spinal cord, the proportion occupied by the cc appears relatively stable, although there appears to be a relative decrease in the postcrural region, and a relative increase in caudal region (Figure 3g; Table 2).
3.2. Cytoarchitecture of the tree pangolin spinal gray matter
The spinal gray matter exhibits the 10 laminae first described by Rexed (1952, 1954) in the cat, with laminae 1–6 constituting the dorsal horn, lamina 7 the intermediate gray matter, and laminae 8 and 9 forming the ventral horn. The gray matter surrounding the cc of the spinal cord is designated as lamina 10 (Figures 4, 5, 6, 7, 8, 9). These laminae were found along the entire length of the spinal cord, but lamina 6 was only observed in the brachial and crural regions.
3.2.1. Lamina 1 (the marginal layer or posteromarginal nucleus)
Lamina 1 of the spinal gray matter (1Sp), was observed in the most dorsolateral aspects of the spinal gray matter, forming the uppermost layer of the spinal gray along the entire length of the spinal cord (Figures 4, 5, 6, 7, 8, 9). This thin lamina (generally around 50 μm in depth) exhibited a moderate density of neurons of a range of soma shapes and sizes and only a very few small neurons in 1Sp were calbindin‐immunopositive (Figure 10).
FIGURE 10.
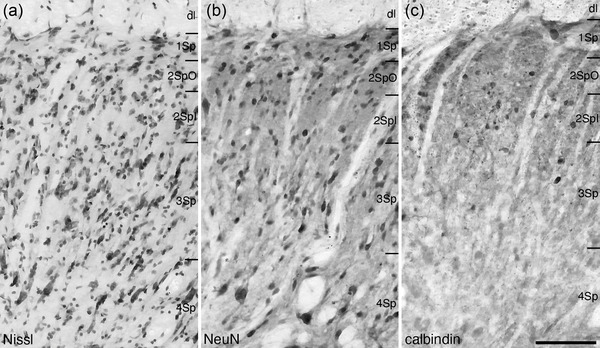
Photomicrographs of coronal sections through the dorsal horn of the tree pangolin spinal cord stained for Nissl (a), neuronal nuclear marker (NeuN, b), and calbindin (c) showing the architectonic appearance of Rexed laminae 1 – 4 (Sp1, Sp2O, Sp2I, Sp3, and Sp4). These photomicrographs correspond to level 5 depicted in Figures 2 and 3. In all photomicrographs, medial is to the left and the dorsal aspect has been slightly rotated (in a counterclockwise direction). Scale bar in (c) = 100 μm and applies to all images. See list for abbreviations
3.2.2. Lamina 2 (the substantia gelatinosa)
Lamina 2 of the spinal gray matter was comprised of both inner (2SpI) and outer (2SpO) parts (Figures 4, 5, 6, 7, 8, 9). In both the inner and outer parts, a moderate density of neurons was observed, with many of these neurons exhibiting round soma (Figure 10). Calbindin‐immunopositive neurons were observed in both parts, with relatively more of these neurons being found in 2SpI when compared with 2SpO (Figure 10c).
3.2.3. Lamina 3
Neurons of varying sizes, from smaller and round through to larger and elongated, were observed in lamina 3 of the spinal gray matter (3Sp) (Figures 4, 5, 6, 7, 8, 9, 10). All these neurons had soma that appears to be oriented in a radial plane. A few of the larger and smaller neurons found in 3Sp were also calbdinin‐immunopositive (Figure 10c).
3.2.4. Lamina 4
The density of neurons observed in lamina 4 (4Sp) was lower than that observed in 1Sp‐3Sp (Figures 4, 5, 6, 7, 8, 9, 10). As in 3Sp, there were a range of neuronal soma sizes, with substantially larger neurons being observed in 4Sp than 3Sp, while the smaller neurons were of a similar size (Figure 10a,b). Only scattered calbindin‐immunopositive neurons were observed in 4Sp (Figures 10c and 11b).
FIGURE 11.
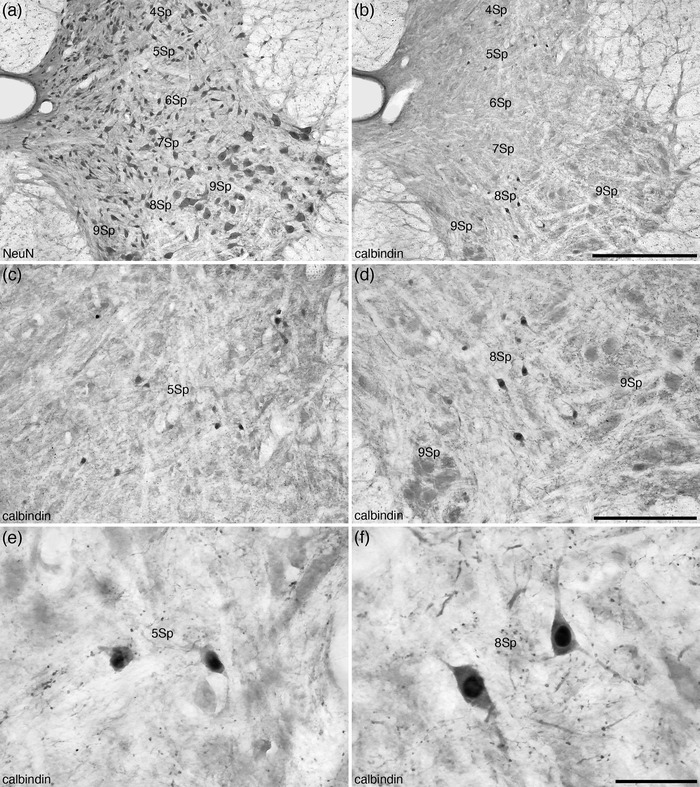
Photomicrographs of coronal sections through the dorsal and ventral horns of the tree pangolin spinal cord stained for neuronal nuclear marker (NeuN, a) and calbindin (b–f) at different magnifications showing the location of calbindin‐immunopositive neurons in laminae 4–9 (Sp4, Sp5, Sp6, Sp7, Sp8, and Sp9) of the spinal gray corresponding to level 4 depicted in Figures 2 and 3. Note that while calbindin‐immunopositive neurons are found in 4Sp, 5Sp, 7Sp, and 8Sp, those in 8Sp (f) are significantly larger than those observed in the other laminae in which they are present, such as Sp5 (e). In all images, dorsal is to the top and medial is to the left. Scale bar in (b) = 500 μm and applies to (a) and (b). Scale bar in (d) = 250 μm and applies to (c) and (d). Scale bar in (f) = 50 μm and applies to (e) and (f). See list for abbreviations
3.2.5. Lamina 5
The fifth lamina (5Sp) contained a slightly higher density of neurons than 4Sp, with several of these neurons being quite large and triangular in shape, while the remaining neurons evinced a range of shapes and types (Figures 4, 5, 6, 7, 8, 9 and 11a). These larger triangular shaped neurons were mostly observed in the more lateral aspect of the 5Sp, allowing division of the 5Sp into medial (5SpM) and lateral (5SpL) parts (Figure 11a). Calbindin‐immunopositive neurons were observed throughout the 5Sp in a similar density in both the medial and lateral parts (Figures 4, 5, 6, 7, 8, 9 and 11b,c).
3.2.6. Lamina 6
The relatively thin lamina 6 (6Sp) forms the base of the dorsal horn and was only observed in the brachial and crural regions (Figures 5, 7, and 11). A range of neuronal soma sizes and shapes were observed in this lamina (Figure 11a), and within the crural region we could identify both medial (6SpM) and lateral (6SpL) parts (Figure 7). A low density of calbindin‐immunopositive neurons were observed throughout this lamina, these neurons being of a similar size and shape as those observed in 5Sp (Figures 5, 7, and 11).
3.2.7. Lamina 7 (the intermediate gray)
Lamina 7 (7Sp) of the tree pangolin spinal gray matter, as is typical for mammals, formed the intermediate gray matter between the dorsal and ventral horns of the spinal cord. A moderate density of a variety of neuronal shapes, including triangular, bipolar, multipolar, and fusiform, and sizes, from smaller to larger, were observed in this lamina (Figures 4, 5, 6, 7, 8, 9 and 11a). As with the 6Sp, a low density of calbindin‐immunopositive neurons were observed throughout 7Sp, these neurons being of a similar size and shape as those observed in 5Sp and 6Sp (Figures 5, 7, and 11b).
3.2.8. Lamina 8
The organization of lamina 8 (8Sp) was more variable than laminae 1–7 in terms of its shape due to the varied shape of lamina 9 (see below). Despite this, 8Sp formed a distinct lamina throughout the gray matter of the spinal cord (Figures 4, 5, 6, 7, 8, 9) that was comprised of a range of neuronal sizes, from small to large, and shapes, including fusiform, triangular, and round (Figure 11a). A low density of relatively large calbindin‐immunopositive neurons were observed in 8Sp (Figure 11), although these are substantially smaller than the α‐motor neurons of lamina 9. These bipolar and multipolar calbindin‐immunopositive neurons were substantially larger than the calbindin‐immunopositive neurons observed in other lamina (Figure 11c‐f).
3.2.9. Lamina 9
Lamina 9 (9Sp) formed the base of the ventral horn of the spinal gray matter, with the large α‐motor neurons being the most conspicuous neuronal type observed, although smaller neurons are present in this lamina (Figure 11a). The α‐motor neurons of the 9Sp, from the prebrachial to the crural regions, were observed to form two clusters, a smaller medially located and a larger laterally located cluster (Figures 4, 5, 6, 7, 11, and 12a–d). This distinction became less clear at the postcrural level (Figures 8 and 12e), and at the caudal level no clear mediolateral cluster distinction was evident (Figures 9 and 12f). No calbindin‐immunopositive neurons were observed in 9Sp. The large α‐motor neurons are characteristically ChAT‐immunopositive (Figure 12).
FIGURE 12.
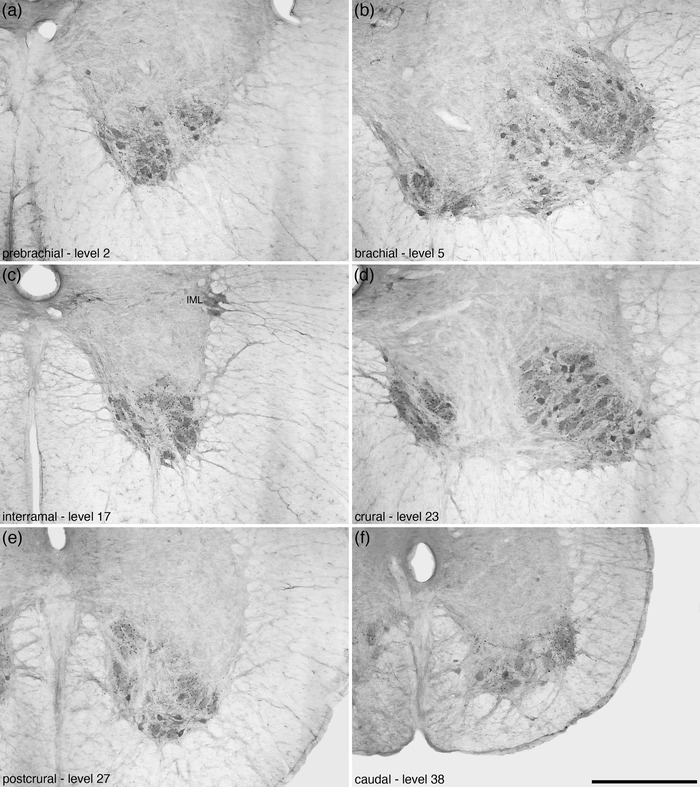
Photomicrographs of coronal sections through the ventral horn of the tree pangolin spinal cord stained for choline acetyltransferase (ChAT) showing the variation in the appearance of lamina 9 of the spinal gray (9Sp) in the different regions of the spinal cord, from rostral (a) to caudal (f). In each image, the region is labeled, as well as the level corresponding to that depicted in Figures 2 and 3. Note that the distinction of these large motoneuron clusters is most apparent in the brachial (b) and crural (d) regions, which correspond to the regions where output to the limbs originates. In all images, dorsal is to the top and medial is to the left. Scale bar in (f) = 500 μm and applies to all images
3.2.10. Lamina 10 (area 10 of Rexed or central gray of the spinal cord)
Lamina 10 (10Sp) was observed as a thin layer surrounding the cc of the spinal cord along its entire length (Figures 4, 5, 6, 7, 8, 9 and 13). A variety of neuronal types were observed in this lamina, ranging from larger triangular shaped neurons, smaller multipolar neurons, and fusiform‐shaped neurons (Figure 13a–d). A low density of relatively small calbindin‐immunopositive neurons were observed scattered throughout the 10Sp. One of the more distinct features of the 10Sp was the presence of the cccc in the lateral aspect of 10Sp (Figure 13e,f).
FIGURE 13.
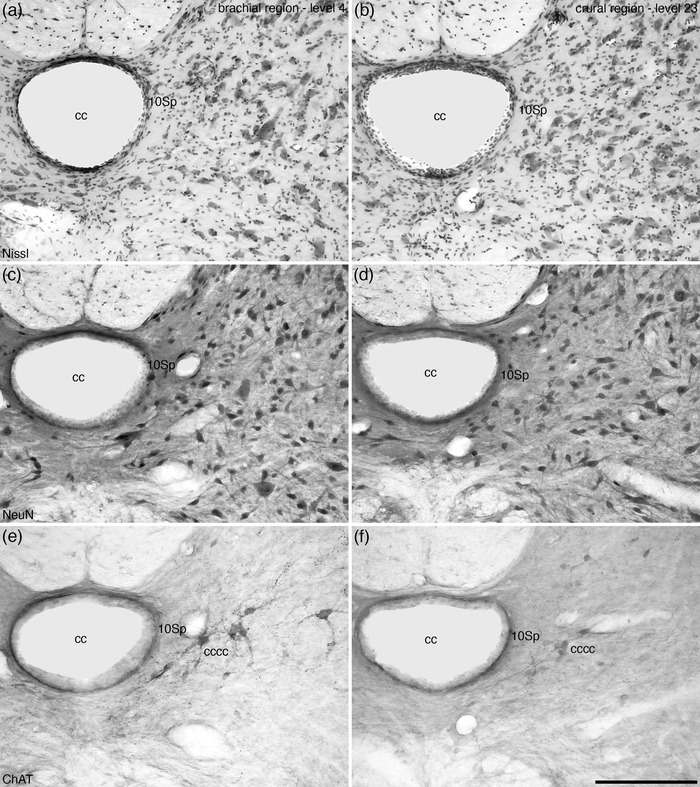
Photomicrographs of coronal sections through the central gray matter of the tree pangolin spinal cord stained for Nissl (a, b), neuronal nuclear marker (NeuN, c, d), and choline acetyltransferase (ChAT, e, f) from the brachial (level 4 in Figure 2) and crural (level 23 in Figures 2 and 3) regions showing the appearance of lamina 10 of the spinal gray (10Sp). Note the presence of the cholinergic central canal cluster (cccc) at the lateral aspect of Sp10. The architecture of Sp10 is similar throughout the tree pangolin spinal cord. In all images, dorsal is to the top and medial is to the left. Scale bar in (f) = 250 μm and applies to all. See list for abbreviations
3.2.11. Nuclei within the Rexed laminae of the gray matter
In addition to the 10 laminae of Rexed, there are several nuclei typically reported as occurring within different lamina and regions of the spinal gray matter, including the dorsal nucleus (the column of Clarke), internal basilar nucleus, sympathetic preganglionic cell groups, SPSy, central cervical nucleus (CeCV), intermediomedial nucleus, lumbar dorsal commissural nucleus, sacral dorsal commissural, sacral precerebellar nucleus (Stilling's sacral nucleus), and the lumbar precerebellar nucleus (Sengul & Watson, 2012). With the range of stains used in the current study, we could not reliably identify the dorsal nucleus, the internal basilar nucleus, the intermediomedial nucleus, the lumbar dorsal commissural nucleus, and the sacral and lumbar precerebellar nuclei in the spinal gray matter of the tree pangolin; however, we could identify the sympathetic preganglionic cell groups, the SPSy, the CeCV, and the sacral dorsal commissural nucleus (SD Com).
The sympathetic preganglionic cell groups include the intermediolateral nucleus (IML) and the intercalated nucleus (ICl). The IML was observed at the most lateral edge of 7Sp within the interramal region of the spinal gray of the tree pangolin forming the intermediolateral horn (Figure 6). The IML was a definitive feature of the interramal region, allowing the delineation of this region, and was comprised of a cluster of strongly ChAT‐immunopositive neurons with dendrites extending into the lateral funiculus (lf; Figures 6, 12, and 14a,c,e). Associated with the IML was the ICl of the interramal region which contained several ChAT‐immunopositive dendrites extending from the cccc found in 10Sp toward the IML (Figure 12c). The ICl of the interramal region was observed to split the interramal portion of 7Sp (Figure 6a).
FIGURE 14.
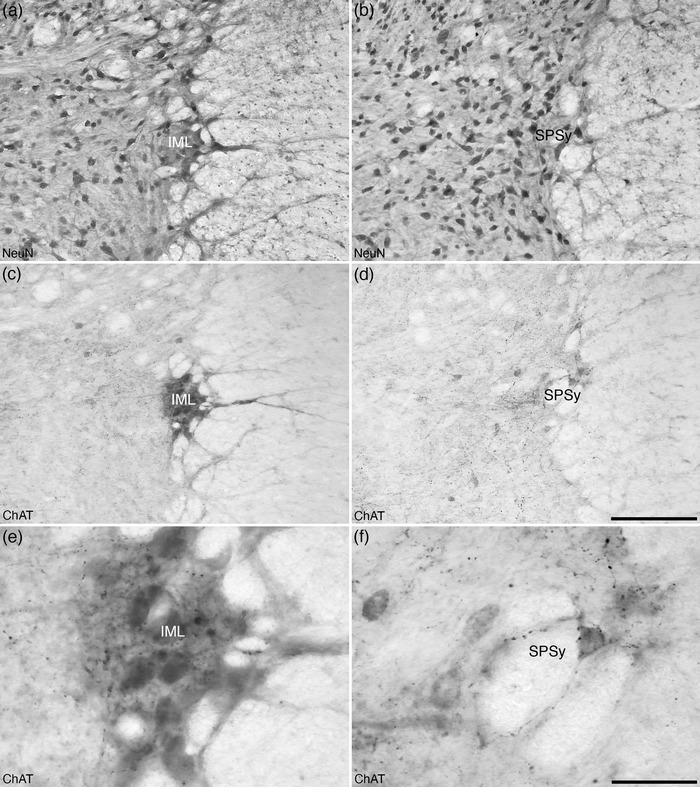
Photomicrographs of coronal sections through the lateral gray matter of the spinal cord of the tree pangolin stained for neuronal nuclear marker (NeuN, a, b) and choline acetyltransferase (ChAT, c‐f) showing the cholinergic sympathetic preganglionic cells of the intermediolateral nucleus (IML, a, c, e), and the cholinergic sacral parasympathetic nucleus (SPSy, b, d, f). Images (a), (c), and (e) are taken from the level corresponding to level 14 depicted in Figure 2 in the interramal region, while images (b), (d), and (f) are taken from the level corresponding to level 27 depicted in Figures 2 and 3, corresponding to the postcrural region. In all images, dorsal is to the top and medial is to the left. Scale bar in (d) = 200 μm and applies to images (a)–(d). Scale bar in (f) = 50 μm and applies to images (e) and (f)
The SPSy was identified within the lateral aspect of 7Sp within the postcrural region of the tree pangolin spinal cord and formed the intermediolateral horn within this region (Figure 8). The SPSy contained weakly ChAT‐immunopositive neurons (Figure 14b,d,f). The SPSy was a defining feature used to demarcate the postcrural region in the current study. Associated with the SPSy was the ICl of the postcrural region (Figure 8). This nucleus evinced an appearance and relationship to the cccc like that of the ICl of the interramal region (see above).
The CeCV was observed in the medial aspect of 7Sp, adjacent to the lateral border of 10Sp, ventral to the cccc, in the prebrachial region of the tree pangolin spinal cord (Figure 4). Within the CeCV, we could identify relatively larger multipolar neurons (compared to the surrounding gray matter), as well as smaller triangular and fusiform‐shaped neurons (Figure 4). No calbindin‐immunopositive neurons were identified in the CeCV.
We could not identify a distinct lumbar dorsal commissural nucleus in the tree pangolin, possibly due to the difficulty in determining specific vertebral levels of the spinal cord in the tree pangolin (see above), and the lack of a distinct lumbar dorsal commissural nucleus in the crural region of the tree pangolin spinal gray (Figure 7), the crural region likely corresponding to the lumbar region of other species. In contrast, a SD Com was noted in both the postcrural and caudal regions of the tree pangolin spinal gray (Figures 8 and 9). This nucleus was located at the midline, dorsal to the 10Sp, and medial to the 1Sp–5Sp laminae (Figures 8 and 9). A lower density of neurons than in the surrounding gray matter was observed in the SD Com, and these neurons were in the smaller range of the neurons seen in 1Sp–10Sp.
3.3. The spinal white matter of the tree pangolin
As outlined above, the spinal white matter of the tree pangolin spinal cord surrounded the gray matter along the entire length of the spinal cord, forming three distinct thickenings (the dorsal, lateral, and ventral funiculi), and the thinner dorsolateral funiculus (Figures 4, 5, 6, 7, 8, 9). In addition to the white matter pathways forming this region, two nuclei were identified, these being the lateral cervical and lateral spinal nuclei. With the range of stains used in the current study, parcellation of the ventral and lateral funiculi into the various tracts forming these funiculi was not possible. In contrast, the stains used revealed that the dorsal funiculus could be parcellated into gracile and cuneate fasciculus (cu) separated by the postsynaptic dorsal column pathway (psdc), with the cu only being observed in the prebrachial, brachial, and rostral half of the interramal regions (Figures 4, 5, 6, 7, 8, 9). From the caudal half of the interramal region through to the end of the caudal region of the spinal cord, the dorsal funiculus was comprised of the gracile funiculus and the psdc. The dorsal funiculus is, for the most part, made up of both left and right halves, but in the caudal region of the spinal cord, this bilateral organization appears to disappear, with the dorsal funiculus, comprised of the gracile fasciculus (gr), forming an unpaired white matter funiculus (Figure 15). This absence of lateralization of the dorsal funiculus in the caudal region of the tree pangolin spinal cord may be related to the glabrous tip of the tail (Figure 15f) used by the tree pangolin during prehensile actions of the tail during climbing and bipedal walking.
FIGURE 15.
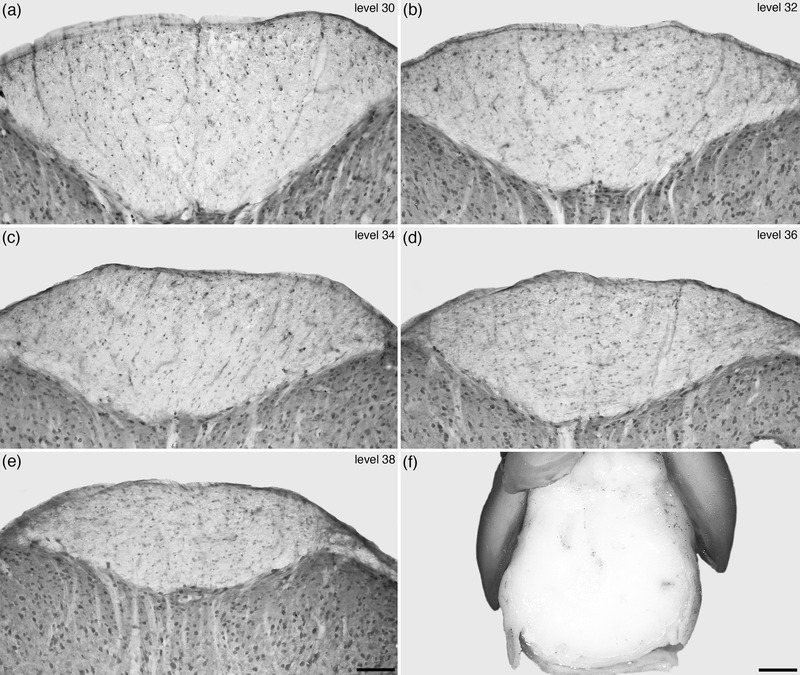
Photomicrographs (a–e) of coronal sections through the spinal cord of the tree pangolin stained for neuronal nuclear marker (NeuN) showing the appearance of the dorsal funiculus in the caudal region of the spinal cord, from levels 30, 32, 34, 36, and 38 depicted in Figures 2 and 3. At levels 30 and 32 the distinct bilaterality of the dorsal funiculus is evident, however, in the more caudal levels (34, 36, 38) this bilaterality becomes increasingly obscured, being faintly visible at level 34 (see also Figure 9d), but then not visible at levels 36 and 38. (f) Photograph of a glabrous skin pad located at the very tip of the ventral aspect of the tree pangolin tail, presumably used for sensory feedback during manipulation and movement of the semi‐prehensile tail. The lack of distinct bilaterality in the most caudal aspects of the dorsal funiculus in the tree pangolin spinal cord may relate to the presence of this glabrous pad. In images (a–e), dorsal is to the top. In image (f) rostral is to the top. Scale bar in (e) = 100 μm and applies to (a–e). Scale bar in (f) = 2 mm
The lateral cervical nucleus (LatC) was located within the white matter of the dorsolateral funiculus on the dorsolateral margin of the prebrachial region of the tree pangolin spinal cord (Figure 4). The neurons forming this nucleus were loosely scattered through the white matter pathways passing through this region, with these neurons being mostly multipolar in type. The lateral spinal nucleus (LSp) was observed to occupy the white matter ventral and lateral to the dorsal horn, along the entire extent of the spinal cord but appearing to wane in the caudal region (Figures 4, 5, 6, 7, 8, 9). The neurons forming the LSp were like those observed in the LatC, although more numerous, and several of these neurons and their dendrites showed distinct calbindin‐immunoreactivity (Figures 5, 6, and 8d).
4. DISCUSSION
The spinal cord of the tree pangolin possesses a mixture of, primarily, features that can be considered quite typical of mammals, in terms of the regional and architectonic anatomy, but is unusual in terms of the length, being considerably shorter in length than one might predict given the body length and overall body size. In the current study we were able to, for the most part, reveal the detailed architectonic organization of the tree pangolin spinal cord. Despite this, certain aspects, such as some of the specifically named nuclei of the spinal cord (see Section 3.2.11), could not be identified with certainty with the range of stains used in the current study, although this does not preclude their presence in the tree pangolin. Further studies, potentially employing more markers, or other methodological approaches, may identify these nuclei in this species. As indicated earlier, in the current study, due to the known shortness of the tree pangolin spinal cord (Imam et al., 2017), we have used the regional approach in our description, as recommended for cross‐species comparison by Sengul et al. (2013). This approach proved to be very useful for the current description, as it was not feasible to determine the precise vertebral level of all the spinal nerves that comprise the extensive cauda equina in the tree pangolin.
4.1. General similarities of the tree pangolin spinal cord to other mammals
The vast majority of observations made in the current study of the tree pangolin spinal cord support the notion that the mammalian spinal cord undergoes very little modification in the distinct lineages that comprise the class. The general appearance of the tree pangolin spinal cord corresponds with that observed in other mammals, including enlargements of the brachial and crural regions, which correspond to the cervical and lumbar enlargements described in other mammals using the vertebral level descriptors not employed in the current study. The division of the tree pangolin spinal cord into six regions (Sengul et al., 2013) was supported by the brachial and crural enlargements, the presence of the cholinergic sympathetic preganglionic cell group termed the IML as a defining feature of the interramal region, and the cholinergic SPSy as a defining feature of the postcrural region. These distinct features, along with several other minor features, such as variations in the proportions of gray and white matter, allowed the assignation of the regions of the spinal cord described in the current study.
These similarities extended to the presence, appearance, and regional absences, of the 10 Rexed laminae throughout the spinal gray matter in the tree pangolin. Laminae 1–6 formed the dorsal horn, lamina 7 the intermediate gray matter, laminae 8 and 9 the ventral horn, and lamina 10 surrounded the cc of the spinal cord. Lamina 6 varied in its occurrence, being observed only in the brachial and crural regions of the spinal gray, while the ICl was only observed in the interramal and postcrural regions. These variations in the occurrence of specific lamina support the regional delineations outlined herein. In lamina 9 of the spinal gray we observed, for the most part, two specific clusters of motor neurons, one more medial and one more lateral, which appear to correlate, respectively, to the flexor and extensor organization of the motor neurons of this lamina of the spinal cord observed in other mammals (e.g., Kiehn, 2006). Thus, despite its short length, the spinal cord of the tree pangolin reveals an appearance that is remarkably similar and readily comparable to that observed in other mammals, including the presence of certain neurotransmitters in neurons of certain lamina (e.g., Sengul et al., 2013). While many different neurochemical phenotypes have been identified in the spinal cord of mammals, in the current study only two were investigated, the cholinergic and calbindin‐containing neurons. Cholinergic neurons were revealed in the IML and SPSy, which are definitive of the interramal and postcrural regions, as well as the cccc and the motor neurons of lamina 9. This distribution of cholinergic neurons is identical to that seen in other mammals (e.g., Sengul et al., 2013). Similarly, the distribution and relative densities of calbindin‐containing neurons observed in the current study are similar to that observed in the rat (e.g., Ren & Ruda, 1994; Yoshida et al., 1990), and are very similar to that observed in the more closely phylogenetically related cat, where smaller calbindin‐immunopositive neurons were observed in the dorsal horn and larger calbindin‐immunopositive neurons were observed in the ventral laminae (Merkulyeva et al., 2016). Given these extensive anatomical similarities, it would be reasonable at this stage to assume that the functionality, both general and specific, of the gray and white matter of the spinal cord in the tree pangolin, is very similar to that observed in other mammals; however, directed studies would be needed to confirm this assumption, as variances that have not been detected in the current study may exist.
4.2. Differences of the tree pangolin spinal cord to other mammals
The major, and most obvious, variation of the spinal cord of the tree pangolin is its short length, which at 13 cm is very short for a species that can measure, from tip of the nose to tip of the tail between 60 and 105 cm (head and body 25–43 cm, tail 35–62 cm) (Kingdon, 1971). This short length of the spinal cord appears to be a derived feature of the Philodota lineage, as the closely related carnivores have spinal cords that terminate at the sacral level (e.g., cat—Burke et al., 1977; Rexed, 1952, 1954; dog—Evans & de Lahunta, 2013), as do the related Cetartiodactyla (e.g., Badlangana et al., 2007; Breathnach, 1960) and Perissodactyla (e.g., Mayhew, 1989). We previously indicated (Imam et al., 2017) that this short spinal cord length in the tree pangolin may be the result of anisotropic growth between the spinal cord and vertebral column, supported by the observation that the body and tail length of the Chinese pangolin (Manis pentadactyla) almost doubles in length in the first 6 months of life (Masui, 1967). However, to be certain that the short adult length of the spinal cord in the tree pangolin, and probably other pangolin species, is the result of anisotropic growth, studies of the developing spinal cord are required.
The presence of a very short spinal cord has also been noted in the short‐beaked echidna (an egg‐laying monotreme mammal), where it was reported that the spinal cord was approximately 10 cm long, terminating at the seventh to eighth thoracic level, while the vertebral column is approximately 40 cm in length (Ashwell & Zhang, 1997). Ashwell (2013) proposed that this short spinal cord length in the echidna is related to volvation as a defensive posture, a longer spinal cord being mechanically incompatible with this defensive body position. The current findings in the tree pangolin would support this notion, as the tree pangolin undergoes a similar flexion of the vertebral column when creating this defensive posture. Despite this, two other species that have modified external defensive structures of the skin (spines and “armor”) and exhibit volvation under threat, the African pygmy hedgehog and the nine‐banded armadillo, have spinal cords that are not shorter than seen typically in mammals (African pygmy hedgehog—Igado et al., 2021; nine‐banded armadillo—Shuddemagen, 1907). Thus, while the mechanical hypothesis of Ashwell (2013) may be applicable to tree pangolins and echidnas, it does not appear to apply to all mammals that use volvation as a defensive mechanism. Kappers et al. (1936) proposed that shortened spinal cords in mammals was related to the lack of tail musculature in the species where this occurred, which may apply to the echidna, but is not applicable to the tree pangolin, which not only has extensive tail musculature, but, as shown here, has a specific tactile sensory specialization located at the tip of the tail. One feature of note shared by the tree pangolin and the echidna is the rostral decussation of the pyramidal tract (Chang, 1944; Goldby, 1939; Imam et al., 2019c), this rostral decussation presumably allowing for more fibers to innervate the hypoglossal nucleus for control of the tongue during eating (Imam et al., 2019c). This hypoglossal innervation of pyramidal fibers and their rostral decussation may play a role in the extreme shortening of the spinal cord in both species, although this needs further investigation to confirm or refute.
Despite this rostrally located pyramidal decussation in the pangolins (Chang, 1944; Imam et al., 2017, 2019c), no specific variations in the architecture of the gray matter of the spinal cord that may be related to this were noted in the current study. The descending pyramidal tract of the tree pangolin courses in the ventrolateral aspect of the medulla oblongata (Imam et al., 2019c), and likely continues caudally in this region into the spinal cord before occupying a position likely to be similar to that observed in the domestic cat within the dorsal and lateral aspect of the lf (e.g., Armand, 1982; Welnairz et al., 2017). In this sense, despite the rostral decussation of the pyramidal tract, which is likely driven by the expansion of the hypoglossal nucleus for control of the tongue (Imam et al., 2019c), it would appear that the function of the corticospinal tract would be consistent with what has been observed in other mammals.
The final unusual feature of note observed in the tree pangolin spinal cord was the lack of clear bilaterality of the gr for the caudal most approximately 20 mm of the spinal cord (to the conus medullaris). As mentioned above, we speculate that this may be related to the presence of the glabrous pad at the tip of the tail, which presumably has sensory receptors similar to those in the glabrous skin of other mammals (e.g., Merkel cells, Meissner corpuscles, Ruffini endings, and Pacinian corpuscles, Corniani & Saal, 2020). This sensory surface is likely used during prehensile actions of the tail when the tree pangolin is climbing and walking in a bipedal manner; however, it is unclear why the caudal most portion of the gr in the tree pangolin is not bilateral in appearance, as other species with tails, such as rodents and monkeys present with a bilateral gr throughout the spinal cord (e.g., Sengul et al., 2013). Speculatively, the glabrous pad of the tree pangolin prehensile tail may provide sensory information critical to bilateral balance and equilibrium during climbing and bipedal walking that is more advantageous to process simultaneously on both sides of the nervous system. It would be of interest to determine whether a lack of bilaterality of the caudal most aspect of gr occurs in the ateline primates (spider and woolly monkeys). Ateline primates have a prehensile tail and a hairless friction pad (Organ et al., 2011) similar to that observed in the tree pangolin, and, given the dexterity provided to them by their prehensile tail, a similar, or even more exaggerated, structure of the caudal‐most portion of the gr may lend circumstantial support to the speculation of simultaneous bilateral processing of sensory information as hypothesized above.
AUTHOR CONTRIBUTIONS
Paul R. Manger conceptualized the study. Aminu Imam, Adhil Bhagwandin, Moyosore S. Ajao, and Paul R. Manger obtained the brains and spinal cords. Aminu Imam, Adhil Bhagwandin, and Paul R. Manger performed the staining and analysis. Aminu Imam and Paul R. Manger wrote the manuscript, and the remaining authors contributed to the editing and improvement of the early drafts of the manuscript. All authors had full access to all data in the study and take responsibility for the integrity of the data and the accuracy of the data analysis.
CONFLICT OF INTEREST
The authors declare that there is no conflict of interest that could be perceived as prejudicing the impartiality of the research reported.
ACKNOWLEDGMENT
We thank Dr. Elizabeth Ebewele of the Department of Forestry, Federal Ministry of Environment, Nigeria, for her assistance in helping to facilitate the issuance of the CITES permit.
Imam, A. , Bhagwandin, A. , Ajao, M. S. , & Manger, P. R. (2022). The brain of the tree pangolin (Manis tricuspis). X. The spinal cord. Journal of Comparative Neurology, 530, 2692–2710. 10.1002/cne.25350
Funding information
The National Research Foundation‐Third World Academy of Science African Renaissance Doctoral Fellowship (AI), and the South African National Research Foundation (PRM).
DATA AVAILABILITY STATEMENT
Data have not been shared due to this study being based on histological sections.
REFERENCES
- Ashwell, K. W. S. (2013). Overview of the monotreme nervous system structure and evolution. In Ashwell K. W. S. (Ed.), Neurobiology of monotremes: Brain evolution in our distant mammalian cousins (pp. 69–106). CSIRO Publishing. [Google Scholar]
- Ashwell, K. W. S. , & Zhang, L. L. (1997). Cyto‐ and myeloarcitectonic organisation of the spinal cord of an echidna (Tachyglossus aculeatus). Brain, Behavior & Evolution, 49, 276–294. 10.1159/000112998 [DOI] [PubMed] [Google Scholar]
- Armand, J. (1982). The origin, course and terminations of corticospinal fibers in various mammals. Progress in Brain Research, 57, 329–360. 10.1016/S0079-6123(08)64136-9 [DOI] [PubMed] [Google Scholar]
- Badlangana, N. L. , Bhagwandin, A. , Fuxe, K. , & Manger, P. R. (2007). Observations on the giraffe central nervous system related to the corticospinal tract, motor cortex and spinal cord: What difference does a long neck make? Neuroscience, 148, 522–534. 10.1016/j.neuroscience.2007.06.005 [DOI] [PubMed] [Google Scholar]
- Breathnach, A. S. (1960). The cetacean central nervous system. Biological Reviews, 35, 187–230. 10.1111/j.1469-185X.1960.tb01414.x [DOI] [Google Scholar]
- Bunce, J. G. , Zikopoulos, B. , Feinberg, M. , & Barbas, H. (2013). Parallel prefrontal pathways reach distinct excitatory and inhibitory systems in memory‐related rhinal cortices. Journal of Comparative Neurology, 521, 4260–4283. 10.1002/cne.23413 [DOI] [PMC free article] [PubMed] [Google Scholar]
- Burke, R. E. , Strick, P. L. , Kanda, K. , Kim, C. C. , & Walmsley, B. (1977). Anatomy of medial gastrocnemius and soleus motor nuclei in cat spinal cord. Journal of Neurophysiology, 40, 667–680. 10.1152/jn.1977.40.3.667 [DOI] [PubMed] [Google Scholar]
- Chang, H. T. (1944). High level decussation of the pyramids in the pangolin (Manis pentadactyla dalmanni). Journal of Comparative Neurology, 81, 333–338. 10.1002/cne.900810307 [DOI] [Google Scholar]
- Corniani, G. , & Saal, H. P. (2020). Tactile innervation densities across the whole body. Journal of Neurophysiology, 124, 1229–1240. 10.1152/jn.00313.2020 [DOI] [PubMed] [Google Scholar]
- Evans, H. E. , & de Lahunta, A. (2013). Miller's anatomy of the dog (4th ed.). Elsevier. [Google Scholar]
- Goldby, F. (1939). An experimental investigation of the motor cortex and pyramidal tract of Echidna aculeata . Journal of Anatomy, 73, 509–524. [PMC free article] [PubMed] [Google Scholar]
- Igado, O. O. , Braimah, S. F. , & Obasa, A. A. (2021). Gross morphology of the brain and spinal cord of the African pygmy hedgehog (Atelerix albiventris). Folia Veterninaria, 65, 15–21. 10.2478/fv-2021-0023 [DOI] [Google Scholar]
- Imam, A. , Ajao, M. S. , Bhagwandin, A. , Ihunwo, A. O. , & Manger, P. R. (2017). The brain of the tree pangolin (Manis tricuspis). I. General appearance of the central nervous system. Journal of Comparative Neurology, 525, 2571–2582. 10.1002/cne.24222 [DOI] [PubMed] [Google Scholar]
- Imam, A. , Bhagwandin, A. , Ajao, M. S. , Ihunwo, A. O. , Fuxe, K. , & Manger, P. R. (2018b). Brain of the tree pangolin (Manis tricuspis). III. The unusual locus coeruleus complex. Journal of Comparative Neurology, 526, 2570–2584. 10.1002/cne.24519 [DOI] [PubMed] [Google Scholar]
- Imam, A. , Bhagwandin, A. , Ajao, M. S. , Ihunwo, A. O. , & Manger, P. R. (2019a). The brain of the tree pangolin (Manis tricuspis). IV. The hippocampal formation. Journal of Comparative Neurology, 527, 2393–2412. 10.1002/cne.24519 [DOI] [PubMed] [Google Scholar]
- Imam, A. , Bhagwandin, A. , Ajao, M. S. , & Manger, P. R. (2019b). The brain of the tree pangolin (Manis tricuspis). V. The diencephalon and hypothalamus. Journal of Comparative Neurology, 527, 2413–2439. 10.1002/cne.24619/ [DOI] [PubMed] [Google Scholar]
- Imam, A. , Bhagwandin, A. , Ajao, M. S. , & Manger, P. R. (2022a). The brain of the tree pangolin (Manis tricuspis). VII. The amygdaloid body. Journal of Comparative Neurology, published online. 10.1002/cne.25345 [DOI] [PMC free article] [PubMed] [Google Scholar]
- Imam, A. , Bhagwandin, A. , Ajao, M. S. , & Manger, P. R. (2022b). The brain of the tree pangolin (Manis tricuspis). VIII. The subpallial telencephalon. Journal of Comparative Neurology, published online. 10.1002/cne.25353 [DOI] [PMC free article] [PubMed] [Google Scholar]
- Imam, A. , Bhagwandin, A. , Ajao, M. S. , & Manger, P. R. (2022c). The brain of the tree pangolin (Manis tricuspis). IX. The pallial telencephalon. Journal of Comparative Neurology, published online. 10.1002/cne.25349 [DOI] [PMC free article] [PubMed] [Google Scholar]
- Imam, A. , Bhagwandin, A. , Ajao, M. S. , Spocter, M. A. , Ihunwo, A. O. , & Manger, P. R. (2018a). The brain of the tree pangolin (Manis tricuspis). II. The olfactory system. Journal of Comparative Neurology, 526, 2548–2569. 10.1002/cne.24510 [DOI] [PubMed] [Google Scholar]
- Imam, A. , Bhagwandin, A. , Ajao, M. S. , Spocter, M. A. , & Manger, P. R. (2019c). The brain of the tree pangolin (Manis tricuspis). V. The brainstem and cerebellum. Journal of Comparative Neurology, 527, 2440–2473. 10.1002/cne.24721 [DOI] [PubMed] [Google Scholar]
- Kaiser, A. , Alexandrova, O. , & Grothe, B. (2011). Urocortin‐expressing olivocochlear neurons exhibit tonotopic and developmental changes in the auditory brainstem and in the innervation of the cochlea. Journal of Comparative Neurology, 519, 2758–2778. 10.1002/cne.22650 [DOI] [PubMed] [Google Scholar]
- Kappers, C. A. , Huber, G. C. , & Crosby, E. C. (1936). The comparative anatomy of the nervous system of vertebrates including man. Macmillan. [Google Scholar]
- Kiehn, O. (2006). Locomotor circuits in the mammalian spinal cord. Annual Review of Neuroscience, 29, 279–307. 10.1146/annurev.neuro.29.051605.112910 [DOI] [PubMed] [Google Scholar]
- Kingdon, J. (1971). East African mammals: An atlas of evolution in Africa. I. Academic Press. [Google Scholar]
- Laux, A. , Delalande, F. , Mouheiche, J. , Stuber, D. , van Dorsselaer, A. , Bianchi, E. , Bezard, E. , Poisbeau, P. , & Goumon, Y. (2012). Localization of endogenous morphine‐like compounds in the mouse spinal cord. Journal of Comparative Neurology, 520, 1547–1561. 10.1002/cne.22811 [DOI] [PubMed] [Google Scholar]
- Lin, M. F. , Chang, C. Y. , Yang, C. W. , & Dierenfeld, E. S. (2015). Aspects of digestive anatomy, feed intake and digestion in the Chinese pangolin (Manis pentadactyla) at Taipei zoo. Zoo Biology, 34, 262–270. 10.1002/zoo.21212 [DOI] [PubMed] [Google Scholar]
- Masui, M. (1967). Birth of a Chinese pangolin Manis pentadactyla at Ueno zoo, Tokyo. International Zoo Yearbook, 7, 114–116. 10.1111/j.1748-1090.1967.tb00340.x [DOI] [Google Scholar]
- Mayhew, I. G. (1989). Large animal neurology: A handbook for veterinary clinicians. Lea & Febiger. [Google Scholar]
- Merkulyeva, N. , Veshchitskii, A. , Makarov, F. , Gerasimenko, Y. , & Musienko, P. (2016). Distribution of 28 kDa calbindin‐immunopositive neurons in the cat spinal cord. Frontiers in Neuroanatomy, 9, 166. 10.3389/fnana.2015.00166 [DOI] [PMC free article] [PubMed] [Google Scholar]
- Ngwenya, A. , Patzke, N. , Manger, P. R. , & Herculano‐Houzel, S. (2016). Continued growth of the central nervous system without mandatory addition of neurons in the Nile crocodile (Crocodylus niloticus). Brain, Behavior and Evolution, 87, 19–38. 10.1159/000443201 [DOI] [PubMed] [Google Scholar]
- Organ, J. M. , Muchlinski, M. N. , & Deane, A. S. (2011). Mechaoreceptivity of prehensile tail skin varies between Ateline and Cebine primates. Anatomical Record, 294, 2064–2072. 10.1002/ar.21505 [DOI] [PubMed] [Google Scholar]
- Pocock, R. I. (1924). The external characters of the pangolins (Manidae). Proceedings of the Zoological Society of London, 2, 707–723. 10.1111/j.1096-3642.1924.tb03310.x [DOI] [Google Scholar]
- Ren, K. , & Ruda, M. A. (1994). A comparative study of the calcium‐binding proteins calbindin‐D28K, calretinin, calmodulin and parvalbumin in the rat spinal cord. Brain Research Reviews, 19, 163–179. 10.1016/0165-0173(94)90010-8 [DOI] [PubMed] [Google Scholar]
- Rexed, B. (1952). The cytoarchitectonic organization of the spinal cord in the cat. Journal of Comparative Neurology, 96, 414–495. 10.1002/cne.900960303 [DOI] [PubMed] [Google Scholar]
- Rexed, B. (1954). A cytoarchitectonic atlas of the spinal cord in the cat. Journal of Comparative Neurology, 96, 297–397. 10.1002/cne.901000205 [DOI] [PubMed] [Google Scholar]
- Sengul, G. , & Watson, C. (2012). Spinal cord. In Watson C., Paxinos G., & Puelles L. (Eds.), The mouse nervous system (pp. 424–458). Elsevier. 10.1016/B978-0-12-369497-3.10013-5 [DOI] [Google Scholar]
- Sengul, G. , Watson, C. , Tanaka, I. , & Paxinos, G. (2013). Atlas of the spinal cord of the rat, mouse, marmoset, rhesus, and human. Elsevier. [Google Scholar]
- Shuddemagen, L. C. (1907). On the anatomy of the central nervous system of the nine‐banded armadillo (Tatu novemcinctum Linn.). Biological Bulletin, 12, 285–302. [Google Scholar]
- Swart, J. M. , Richardson, P. R. K. , & Ferguson, J. W. H. (1999). Ecological factors affecting the feeding behaviour of pangolins (Manis temminckii). Journal of Zoology, 247, 281–292. https://doi.org.10.1111/j.1469‐7998.1999.TB00992.x [Google Scholar]
- Watson, C. , Mitchelle, A. , & Puelles, L. (2017). A new mammalian brain ontology based on developmental gene expression. In Kaas J. H. (Ed.), Evolution of nervous systems, (2nd ed., Vol. 2. pp. 53–75). Academic Press, Elsevier. 10.1016/B978-0-12-804042-3.00030-0 [DOI] [Google Scholar]
- Weber, M. (1892). Beitrage zur Anatomie und Entwickelung des Genus Manis . In Zoologische Ergebnisse einer Reise der Niederländisch Ost‐indien II, Leyden.
- Wehrl, H. F. , Bezrukov, I. , Wiehr, S. , Lehnhoff, M. , Fuchs, K. , Mannheim, J. G. , Quintanilla‐Martinez, L. , Kohlhofer, U. , Kneilling, M. , Pichler, B. J. , & Sauter, A. W. (2015). Assessment of murine brain tissue shrinkage caused by different histological fixatives using magnetic resonance and computed tomography imaging. Histology and Histopathology, 30, 601–613. 10.14670/HH-30.601 [DOI] [PubMed] [Google Scholar]
- Welnairz, Q. , Dusart, I. , & Roze, E. (2017). The corticospinal tract: Evolution, development, and human disorders. Developmental Neurobiology, 77, 810–829. 10.1002/dneu.22455 [DOI] [PubMed] [Google Scholar]
- Yoshida, S. , Senba, E. , Kubota, Y. , Hagihira, S. , Yoshiya, I. , Emson, P. C. , & Tohyama, M. (1990). Calcium‐binding proteins calbindin and parvalbumin in the superficial dorsal horn of the rat spinal cord. Neuroscience, 37, 839–848. 10.1016/0306-4522(90)90113-i [DOI] [PubMed] [Google Scholar]
Associated Data
This section collects any data citations, data availability statements, or supplementary materials included in this article.
Data Availability Statement
Data have not been shared due to this study being based on histological sections.


