

Abstract
Abrocitinib is an oral Janus kinase 1 (JAK1) inhibitor currently approved in the United Kingdom for the treatment of moderate‐to‐severe atopic dermatitis (AD). As patients with AD may use medications to manage comorbidities, abrocitinib could be used concomitantly with hepatic and/or renal transporter substrates. Therefore, we assessed the potential effect of abrocitinib on probe drugs and endogenous biomarker substrates for the drug transporters of interest. In vitro studies indicated that, among the transporters tested, abrocitinib has the potential to inhibit the activities of P‐glycoprotein (P‐gp), breast cancer resistance protein (BCRP), organic anion transporter 3 (OAT3), organic cation transporter 1 (OCT1), and multidrug and toxin extrusion protein 1 and 2K (MATE1/2K). Therefore, subsequent phase I, two‐way crossover, open‐label studies in healthy participants were performed to assess the impact of abrocitinib on the pharmacokinetics of the transporter probe substrates dabigatran etexilate (P‐gp), rosuvastatin (BCRP and OAT3), and metformin (OCT2 and MATE1/2K), as well as endogenous biomarkers for MATE1/2K (N1‐methylnicotinamide (NMN)) and OCT1 (isobutyryl‐L‐carnitine (IBC)). Co‐administration with abrocitinib was shown to increase the plasma exposure of dabigatran by ~ 50%. In comparison, the plasma exposure and renal clearance of rosuvastatin and metformin were not altered with abrocitinib co‐administration. Similarly, abrocitinib did not affect the exposure of NMN or IBC. An increase in dabigatran exposure suggests that abrocitinib inhibits P‐gp activity. By contrast, a lack of impact on plasma exposure and/or renal clearance of rosuvastatin, metformin, NMN, or IBC suggests that BCRP, OAT3, OCT1, and MATE1/2K activity are unaffected by abrocitinib.
Study Highlights.
WHAT IS THE CURRENT KNOWLEDGE ON THIS TOPIC?
☑ Abrocitinib, a JAK1 inhibitor, is approved for the treatment of moderate‐to‐severe atopic dermatitis. The potential for drug–drug interactions between abrocitinib and drug transporter substrates is unknown.
WHAT QUESTION DID THIS STUDY ADDRESS?
☑ In vitro studies and phase I clinical trials investigated whether abrocitinib affected P‐gp, BCRP, MATE1/MATE2K, OAT1/OAT3, OATP1B1/OATP1B3, or OCT1/OCT2 drug transporter activity.
WHAT DOES THIS STUDY ADD TO OUR KNOWLEDGE?
☑ This is the first study to identify clinical inhibition of P‐gp activity by abrocitinib. Abrocitinib did not affect BCRP, OAT3, OCT1, and MATE1/2K transporter activity as assessed by rosuvastatin and metformin pharmacokinetics in addition to NMN and IBC.
HOW MIGHT THIS CHANGE CLINICAL PHARMACOLOGY OR TRANSLATIONAL SCIENCE?
☑ Caution should be exercised when abrocitinib is co‐administered with P‐gp substrates with a narrow therapeutic index. The NMN and IBC data add to the current body of evidence and further support the utility of these compounds as biomarkers for assessing MATE 1/2K and OCT1 transporter activity.
Atopic dermatitis (AD) is a common, chronic, inflammatory skin disorder characterized by flaky skin lesions and intense pruritus. 1 Several cytokines that require Janus kinase 1 (JAK1) for signal transduction have been implicated in AD pathophysiology, which indicates that selective inhibition of JAK1 may be a compelling approach to treatment. 2 Abrocitinib, an oral, once‐daily JAK1 selective inhibitor, is approved for the treatment of moderate‐to‐severe AD in eligible patients. 3 , 4 , 5 , 6 Abrocitinib has demonstrated efficacy and safety, including rapid and persistent relief of itch, in phase III trials. 7 , 8 , 9 As patients with AD may use other medications to manage comorbidities, 10 it is important to understand whether abrocitinib interacts with drug transporters, and thus has the potential to modulate the metabolism of currently available medications.
Membrane drug transporters are expressed throughout the body and mediate the cellular flux of both endogenous and exogenous substances. 11 Several of these transporters, including P‐glycoprotein (P‐gp; also called multidrug resistance protein 1 (MDR1)), breast cancer resistance protein (BCRP), multidrug and toxin extrusion protein 1 and 2K (MATE1/MATE2K), organic anion transporters 1 and 3 (OAT1/OAT3), organic anion transporting polypeptide 1B1 and 1B3 (OATP1B1/OATP1B3), and organic cation transporters 1 and 2 (OCT1/OCT2), are known to interact with currently available drugs. 12 , 13
Clinical assessment of potential drug–drug interactions (DDIs) has traditionally been conducted using exogenous probe substrates for drug‐metabolizing enzymes or drug transporters. 14 More recently, however, monitoring endogenous biomarkers for drug transporters has been suggested as a potential alternative means of assessing DDI risk in vivo. 15 , 16 , 17 , 18 , 19 Using endogenous rather than exogeneous substrates as probes reduces the pill burden on participants, can enable the assessment of multiple transporters within the same clinical study, and may eliminate the need to conduct a standalone clinical DDI study entirely. 16 , 20 N1‐methylnicotinamide (NMN), a metabolite of niacin, is reported to be an endogenous biomarker for assessing renal MATE1, MATE2K, and OCT2 activity, 18 , 20 , 21 whereas isobutyryl‐L‐carnitine (IBC) has been proposed as a potential surrogate for the evaluation of hepatic OCT1 activity. 16 , 22 , 23
In this paper, we describe a series of preclinical in vitro and phase I clinical studies conducted to evaluate the potential effect of abrocitinib on drug transporter inhibition by assessing the pharmacokinetics of dabigatran etexilate, rosuvastatin, metformin, and endogenous biomarkers. Dabigatran etexilate is a sensitive substrate of intestinal P‐gp and is the prodrug of the direct thrombin inhibitor, dabigatran. 24 , 25 Although only the prodrug is a P‐gp substrate, the plasma pharmacokinetics of the active moiety dabigatran can be used as a surrogate for changes in intestinal dabigatran etexilate exposure. The β‐hydroxy β‐methylglutaryl‐coenzyme A (HMG‐CoA) reductase inhibitor rosuvastatin is a substrate of BCRP, OAT3, and OATP1B1/OATP1B3. 26 , 27 Metformin, a biguanide analog indicated for type 2 diabetes mellitus, is a sensitive substrate of MATE1/2K and OCT2. 28 , 29 , 30 Metformin is also a substrate of OCT1. However, because its parent form mostly undergoes renal elimination, modulation of OCT1 (a hepatic uptake transporter) has not been shown to significantly impact plasma exposures of metformin. 31 As such, the endogenous biomarker IBC was assessed in ad hoc analyses to further evaluate the impact of abrocitinib on OCT1 activity. NMN, an endogenous biomarker for MATE1/2K and OCT2 activity, was also assessed in this study to correlate any changes in exposure with metformin, a common drug probe for these transporters. 12 , 32
METHODS
In vitro studies
Methods underlying the in vitro studies are presented in the Supplementary Methodology .
Clinical study design and participants
All trials were reviewed and approved by the Independent Ethics Committee for the investigational site and conducted in accordance with the Helsinki Declaration of 1975.
Three phase I, two‐way crossover, open‐label studies in healthy participants examined the potential of abrocitinib to impact the pharmacokinetics of dabigatran (ClinicalTrials.gov Identifier: NCT03742336), rosuvastatin (NCT03806101), or metformin (NCT03796182). Probe drugs (dabigatran etexilate (75 mg), rosuvastatin (10 mg), metformin (500 mg)) were administered alone (reference) and in combination with abrocitinib (200 mg; test), with a ≥ 3‐day washout period between probe drug doses. In order to best evaluate transporter inhibition over the entire assessment period, abrocitinib was administered once daily over the pharmacokinetic sample collection interval mimicking clinical dosing. However, in the dabigatran etexilate study, only a single dose of abrocitinib was administered, as the focus of this study was to assess potential intestinal P‐gp inhibition. Treatment schedules in each study are shown in Figure 1 .
Figure 1.
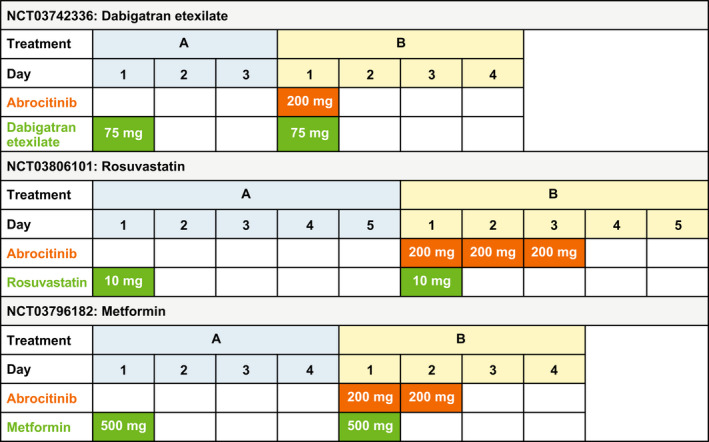
Treatment schedule for clinical pharmacokinetic studies. All studies were randomized, with a two‐way crossover design. In each study, participants were randomized 1:1 into 1 of 2 treatment sequences, in which treatment A was followed by treatment B or vice versa, with a washout period between treatments.
Main inclusion criteria across the studies were: healthy female or male participants aged 18–55 years of age (inclusive); body mass index of 17.5–30.5 kg/m2, and body weight of > 50 kg/110 lbs. All participants provided informed written consent prior to enrollment. Main exclusion criteria were: evidence/history of clinically significant disease; evidence/history of clinically significant dermatological condition or visible rash present during examination; any condition possibly affecting drug absorption; use of prescription/nonprescription drugs and dietary or herbal supplements within 7–28 days or 5 half‐lives (whichever is longer) prior to the first dose of study medication; positive urine drug test; and participants, who according to the substrate product label, would be at increased risk if dosed with the substrate drug. Additional patient lifestyle considerations are presented in the Supplementary Methodology .
The sample size for each study was chosen based on the assumed intra‐participant variability to have adequate precision of the estimated effects. A larger sample size was required for the dabigatran etexilate study given its higher pharmacokinetic variability. Details of sample size calculations are presented in the Supplementary Methodology .
Sample collection
Blood samples were collected in all three studies for plasma isolation. Serial blood samples were collected during each period over 36 hours after dose for dabigatran, metformin, and rosuvastatin plasma concentration analysis, respectively, and additionally at 48 and 72 hours after the dose for rosuvastatin plasma concentration analysis. Serial blood samples were also collected for up to 24 hours post‐metformin dose for NMN and IBC assessment. In addition, urine was collected for assessment of rosuvastatin, metformin, and NMN concentrations. Detailed descriptions of blood and urine sample collection timepoints are presented in the Supplementary Methodology .
Bioanalytical methodology for pharmacokinetic samples
Total dabigatran (including free dabigatran and dabigatran‐acyl‐β‐D‐glucuronide) and stable isotope‐labeled internal standard (SLIS) dabigatran‐d7 were isolated from plasma using a solid phase extraction procedure. Analyte concentration was measured relative to a dabigatran‐acyl‐β‐D‐glucuronide reference standard of known concentration. Following extraction and processing, samples were analyzed by high‐performance liquid chromatography tandem mass spectrometry (LC‐MS/MS) using an ACE 3 C18, 50 mm × 4.6 mm, 3 µm column under positive mode with a TurboIonSpray interface.
Rosuvastatin and SLIS rosuvastatin‐d3 were isolated from plasma using a liquid‐liquid extraction procedure. After processing, samples were analyzed by ultra‐high performance LC‐MS/MS using an ACE 3 C18, 30 mm × 3 mm, 3 µm column under positive mode with a TurboIonSpray interface.
Rosuvastatin and its SLIS rosuvastatin‐d3 were isolated from urine using an automated liquid‐liquid extraction procedure. After processing, the samples were injected into LC‐MS/MS using an ACE 3 C18, 30 mm × 30 mm, 3 μm column under positive mode with a TurboIonSpray interface.
Metformin and SLIS metformin‐D6 were extracted from tripotassium ethylenediaminetetraacetic acid (K3EDTA) plasma by a protein precipitation extraction procedure. Compounds were detected and quantified by high‐performance LC‐MS/MS in positive ion mode with a TurboIonSpray interface. Metformin and its SLIS metformin‐D6 were extracted from urine by a dilution extraction procedure. The compounds were detected and quantified by tandem mass spectrometry in positive ion mode on an AB Sciex API 4000TM equipped with a TurboIonSpray interface.
Bioanalytical methodology for biomarker measurements
Mass spectrometry‐mediated quantification of NMN and IBC was conducted according to Luo et al. 16 , 20 Plasma and diluted urine samples were spiked with SLIS (D3‐1‐methylnicotinamide iodide for NMN; D3‐isobutyryl‐L‐carnitine for IBC). 16 Acetonitrile was added to precipitate proteins before samples were centrifuged and placed in an autosampler for direct injection onto the LC‐MS/MS or LC‐MS/high‐resolution mass spectrometry systems for NMN and IBC measurements, respectively. 16 , 20 Details of instrument calibration, inter‐ and intra‐day accuracy, and precision are presented in the Supplementary Methodology .
Genotyping
In the rosuvastatin study, whole blood samples were collected for discrimination of allelic variants of ABCG2 (421C>A (rs2231142) and 376C>T (rs72552713)). Sample preparation and DNA extraction/genotype assays are described in the Supplementary Methodology .
Statistical methodology and pharmacokinetic parameters
Plasma pharmacokinetic parameters were derived from the concentration‐time profiles using either the linear/log trapezoidal method or log‐linear regression analysis. Renal clearance was calculated as the cumulative amount of drug recovered unchanged in urine divided by the area under the concentration time curve (AUC). Actual pharmacokinetic sampling times were used in the derivation of pharmacokinetic parameters.
Natural log transformed parameters (AUC from zero to infinity (AUCinf; probe drugs), AUC from time zero to 24 hours (AUC24; endogenous biomarkers), maximum plasma concentration (Cmax)) of each substrate, and renal clearance (CLr) of rosuvastatin, metformin, and NMN were analyzed using a mixed effect model with sequence, period, and treatment as fixed effects and participant within sequence as a random effect. Estimates of the adjusted mean differences (test‐reference) and corresponding 90% confidence intervals (CIs) were obtained from the model. The adjusted mean differences and 90% CIs for the differences were exponentiated to provide estimates of the ratio of adjusted geometric means (test/reference) and 90% CIs for the ratios. Additionally, in the metformin study, a Pearson correlation coefficient (r) was calculated based on individual changes from baseline for metformin CLr versus NMN CLr.
The safety population was defined as all participants who received at least one dose of study drug. Safety data are summarized descriptively.
RESULTS
In vitro DDI risk studies
Risk assessment of the inhibitory potency of abrocitinib for 10 different drug transporters revealed potential clinical DDI risk for P‐gp, BCRP, OAT3, OCT1, and MATE1/2K (Table 1 ).
Table 1.
Assessment of perpetrator transporter DDI risk for abrocitinib
| Transporter | IC50 (μM) | Ki (μM)a |
0.1 × molar dose/250 mL (μM) |
25 × Iin,max,u (μM) |
50 × Cmax,u (μM) |
DDI criteriab | DDI riskc |
|---|---|---|---|---|---|---|---|
| Intestinal | |||||||
| MDR1/P‐gp | 100 | 100 | 247 | Ki ≤ (0.1 × Dose/250 mL) | Y | ||
| BCRP | 9.8 | 9.8 | 247 | Ki ≤ (0.1 × Dose/250 mL) | Y | ||
| Systemic | |||||||
| MDR1/P‐gp | 100 | 100 | 65 | Ki ≤ (50 × Cmax,u) | N | ||
| BCRP | 9.8 | 9.8 | 65 | Ki ≤ (50 × Cmax,u) | Y | ||
| OATP1B1 | > 300 | > 300 | 228 | Ki ≤ (25 × Iin,max,u) | N | ||
| OATP1B3 | > 300 | > 300 | 228 | Ki ≤ (25 × Iin,max,u) | N | ||
| OAT1 | > 300 | > 150 | 65 | Ki ≤ (50 × Cmax,u) | N | ||
| OAT3 | 26 | 26 | 65 | Ki ≤ (50 × Cmax,u) | Y | ||
| OCT1 | 44 | 44 | 228 | Ki ≤ (25 × Iin,max,u) | Y | ||
| OCT2 | > 300 | > 300 | 65 | Ki ≤ (50 × Cmax,u) | N | ||
| MATE1 | 5.5 | 5.5 | 65 | Ki ≤ (50 × Cmax,u) | Y | ||
| MATE2K | 10.7 | 10.7 | 65 | Ki ≤ (50 × Cmax,u) | Y | ||
BCRP, breast cancer resistance protein; Cmax, maximum plasma concentration; DDI, drug‐drug interaction; Iin,max,u, unbound maximum hepatic inlet concentration; IC50, half‐maximal inhibitory concentration; Ki, inhibition constant; MATE 1, multidrug and toxin extrusion protein 1; MATE2K, multidrug and toxin extrusion protein 2K; MDR1/P‐gp, multi‐drug resistance protein 1/P‐glycoprotein; OAT 1, organic anion transporter 1; OAT 3, organic anion transporter 3; OATP1B1, organic anion transporting polypeptide 1B1; OATP1B3, organic anion transporting polypeptide 1B3; OCT1, organic cation transporter 1; OCT 2, organic cation transporter 2.
For MDR1/P‐gp, BCRP, OATPs, OAT3, OCTs, and MATEs, the Ki is estimated to be equal to the IC50 because the substrate concentrations used in these assays were no more than one tenth of the reported Km values 41 , 42 and in‐house Km data (data available upon request). For OAT1 transporter, the Ki is estimated to be one‐half of the IC50 because the substrate concentrations used in these assays were near the reported Km values (data available upon request).
European Medicines Agency (EMA), Guideline on the investigation of drug interactions, CPMP/EWP/560/95/Rev.1 Corr.2, 2012. EMA guidelines were used to determine clinical drug transporter DDI strategy as EMA guidelines are similar or more conservative compared to the US Food and Drug Administration (FDA) guidelines.
DDI risk assessments were based on an abrocitinib steady‐state unbound plasma Cmax of 404 ng/mL (1.3 μM) at a maximum clinical dose of 200 mg once daily in participants with atopic dermatitis. Theoretical gut concentration (Igut) was estimated to be 0.8 mg/mL (200 mg/250 mL) or 2.47 mM (MW 323.4). Theoretical liver inlet concentration (Iin,max,u = fu × (Cmax + ((fafg × ka × Dose/Qh)/B/P)) was estimated to be 9.1 μM, based on plasma fraction unbound (fu) = 0.36, blood/plasma ratio (B/P) = 1.07, fraction absorbed (fafg) = 0.91, absorption rate constant (ka) = 0.067/minute, and liver blood flow (Qh) of 1620 mL/minute.
Participant demographics
Twenty participants were enrolled in the dabigatran study, and 12 participants each were enrolled in the rosuvastatin and metformin studies. All participants completed their respective studies. All participants were healthy men between 24 and 51 years of age (Table 2 ).
Table 2.
Participant demographics
| Dabigatran study (N = 20) | Rosuvastatin study (N = 12) | Metformin study (N = 12) | |
|---|---|---|---|
| Male, n (%) | 20 (100) | 12 (100) | 12 (100) |
| Age, years | |||
| Median (range) | 40.5 (26.0–50.0) | 36.0 (26.0–47.0) | 40.0 (24.0–51.0) |
| Mean ± SD | 38.6 ± 7.92 | 36.5 ± 6.02 | 39.0 ± 8.42 |
| Race, n (%) | |||
| White | 14 (70.0) | 10 (83.3) | 10 (83.3) |
| Black or African American | 3 (15.0) | 0 | 1 (8.3) |
| Asian | 3 (15.0) | 2 (16.7) | 0 |
| Native Hawaiian/other/Pacific Islander | 0 | 0 | 1 (8.3) |
| Other | 0 | 0 | 0 |
| Ethnicity, n (%) | |||
| Hispanic or Latino | 0 | 0 | 1 (8.3) |
| Not Hispanic or Latino | 20 (100) | 12 (100) | 11 (91.7) |
| BMI, kg/m2, mean ± SD | 25.4 ± 2.57 | 25.4 ± 2.97 | 25.8 ± 2.84 |
BMI, body mass index.
Pharmacokinetic data from all participants were included in the analyses, except for two participants in the metformin DDI study. These participants were excluded from urine pharmacokinetic analysis (1 for metformin and 1 for NMN) due to protocol deviations involving urine collection and processing occurring during the abrocitinib + metformin treatment phase.
ABCG2 genotyping
Genotype data for ABCG2, the gene that encodes for BCRP, were available for all participants enrolled in the rosuvastatin study. All participants carried the wild‐type alleles for ABCG2 376C>T. However, based on ABCG2 421C>A analyses, one participant carried the alleles associated with reduced BCRP activity (421A/A). 33 All others had genotypes associated with normal BCRP function (421C/C (n = 7); 421C/A (n = 4)).
Probe drug and endogenous biomarker pharmacokinetics
The mean plasma concentration‐time curves for dabigatran (total), rosuvastatin, and metformin in the presence and absence of abrocitinib are shown in Figure 2 . Co‐administration with abrocitinib increased AUCinf and Cmax of dabigatran by 53% and 40%, respectively, whereas rosuvastatin and metformin plasma exposure and CLr were unaffected by co‐administration with abrocitinib, with the 90% CIs of the adjusted geometric mean ratios falling wholly within the acceptance range of 80–125%. Consistent with the overall rosuvastatin study population, no significant impact of abrocitinib on rosuvastatin exposure was observed in the participant that had reduced BCRP activity based on ABCG2 genotype. Pharmacokinetic parameters (AUCinf, Cmax, CLr, time to Cmax (Tmax), and terminal plasma half‐life) for dabigatran, rosuvastatin, and metformin each in the presence and absence of abrocitinib are listed in Table 3 .
Figure 2.
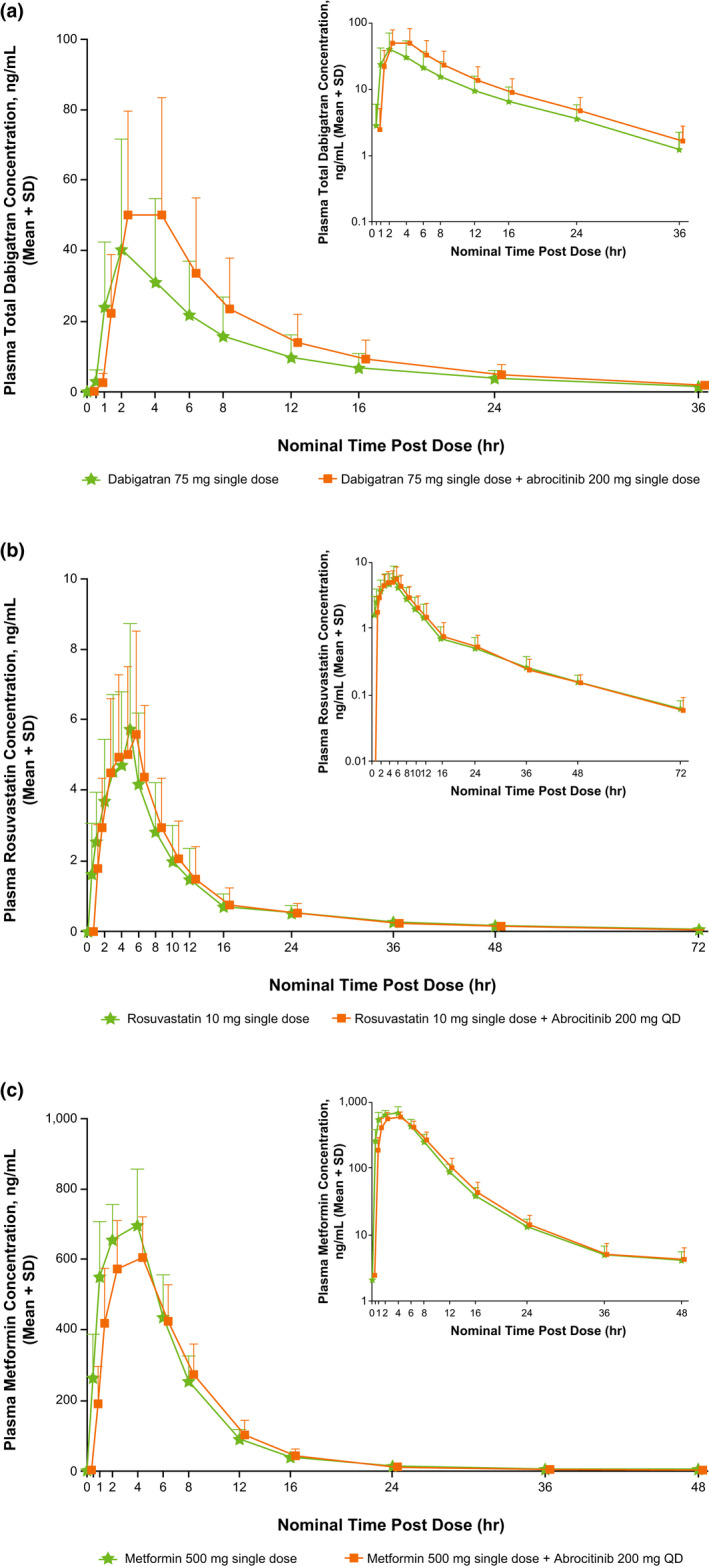
Mean (+ SD) plasma concentration‐time curves for (a) dabigatran, (b) rosuvastatin, and (c) metformin alone and with abrocitinib, with semi‐log scale plasma concentration‐time curves inset in top right corners. QD, once‐daily.
Table 3.
Pharmacokinetics following the administration of a single dose of probe drug with and without co‐administration of abrocitinib (200 mg) in healthy adult participants
| Substrate | Parameter | Substrate alonea | Abrocitinib + substratea | Ratio of abrocitinib + substrate vs. substrate alone AGm (90% CI) |
|---|---|---|---|---|
|
Dabigatran (75 mg) N = 20 |
AUCinf, ng hour/mL | 295 (79) | 447 (77) | 1.53 (1.09–2.15) |
| Cmax, ng/mL | 30.2 (96) | 42.3 (125) | 1.40 (0.92–2.13) | |
| Tmax, houra | 2.00 (1.00–2.02) | 2.00 (1.00–4.03) | ||
| t1/2, hourb | 8.93 ± 2.28 | 8.04 ± 0.80 | ||
|
Rosuvastatin (10 mg) N = 12 |
AUCinf, ng•hour/mL | 57.6 (40) | 56.4 (42) | 1.02 (0.93–1.12)c |
| Cmax, ng/mL | 5.38 (53) | 5.31 (51) | 0.99 (0.86–1.14)c | |
| CLr, L/hour | 14.6 (17) | 13.3 (26) | 0.91 (0.83–1.01)c | |
| Tmax, houra | 5.00 (2.00–5.00) | 5.00 (2.00–6.00) | ||
| t1/2, hourb | 16.4 ± 3.15 | 16.4 ± 5.14 | ||
|
Metformin (500 mg) N = 12 |
AUCinf, ng•hour/mL | 5202 (19) | 5050 (16) | 0.93 (0.85–1.03)c |
| Cmax, ng/mL | 721 (20) | 635 (14) | 0.88 (0.81–0.96)c | |
| CLr, L/hour | 33.3 (28) | 32.2 (39)b | 0.99 (0.82–1.18)c | |
| Tmax, houra | 4.00 (1.00–4.00) | 4.00 (2.00–4.00) | ||
| t1/2, hourb | 9.26 ± 3.52 | 8.32 ± 4.25 |
AGm, adjusted geometric mean; AUCinf, area under the concentration‐time curve from time 0 to infinity; CI, confidence interval; CLr, renal clearance; Cmax, maximum plasma concentration; Tmax, time to Cmax; t1/2, terminal plasma half‐life.
Geometric mean (geometric % coefficient of variation) for all except median (range) for Tmax and arithmetic mean ± SD for t1/2.
n = 11.
The 90% CI contained within the acceptance interval of 80–125%.
The mean Tmax curves for NMN and IBC after a single dose of metformin alone and co‐administered with abrocitinib are shown in Figure 3 . Co‐administration of abrocitinib with metformin did not alter AUC24 or Cmax of NMN (Figure 3a ) or IBC (Figure 3b ) compared with metformin alone. As expected, diurnal variation of NMN concentration was observed, as shown in Figure 3a . The pharmacokinetic parameters for NMN and IBC in the presence of metformin with and without abrocitinib are listed in Table 4 . The 90% CIs for NMN and IBC adjusted geometric mean ratios for AUC24, Cmax, and CLr (NMN only), were wholly within the acceptance range (with the exception of NMN Cmax which fell slightly below the range), establishing that there was no DDI in the presence of abrocitinib. A positive correlation was shown between individual participant ratios of metformin and NMN CLr, with a Pearson correlation coefficient (r) of 0.64 (Figure 3c ).
Figure 3.
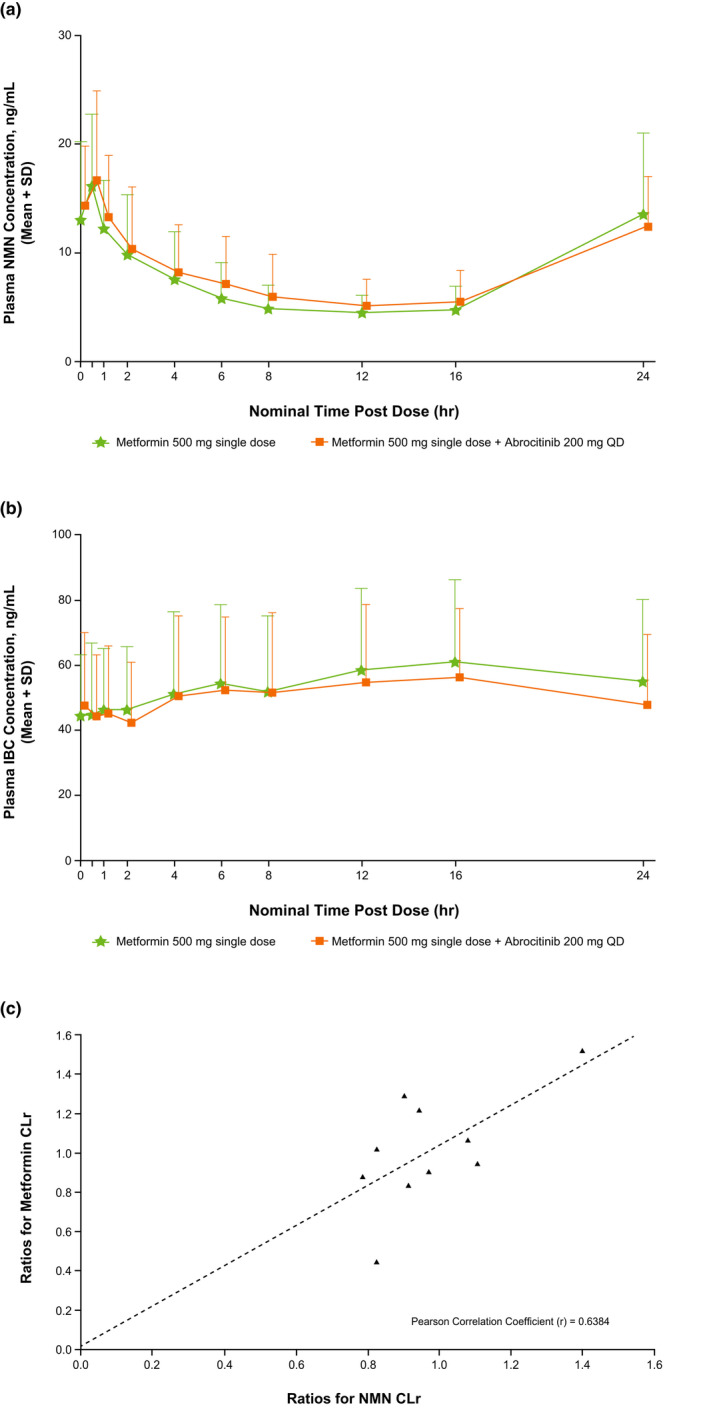
Mean (+ SD) plasma concentration‐time curves for (a) NMN and (b) IBC.a Panel (c) shows a scatterplot of individual ratios for metformin CLr vs. NMN CLr.b
CLr, renal clearance; IBC, isobutyryl‐l‐carnitine; NMN, N1‐methylnicotinamide; QD, once daily.
aLog plots were not generated as NMN and IBC are endogenous compounds;
bOnly 10 of the 12 study participants are included in this figure and contributed to the Pearson correlation coefficient calculation due to missing metformin CLr or NMN CLr values for metformin + abrocitinib treatment period.
Table 4.
Pharmacokinetics of the endogenous biomarkers NMN and IBC following administration of a single dose of metformin (500 mg) with and without the co‐administration of abrocitinib (200 mg) in healthy adult participants
| Pharmacokinetic parameter |
Metformin alone N = 12 a |
Abrocitinib + metformin N = 12 a |
Ratio of abrocitinib + metformin vs. metformin alone AGm (90% CI) |
|---|---|---|---|
| NMN | |||
| AUC24, ng•hour/mL | 159 (41) | 171 (40) | 1.08 (0.98–1.19)c |
| Cmax, ng/mL | 17.2 (40) | 15.8 (42) | 0.92 (0.79–1.07) |
| CLr, L/hour | 31.9 (28) | 31.2 (26)b | 0.96 (0.89–1.05)c |
| Tmax, hour | 0.50 (0.00–23.8) | 0.50 (0.00–23.8) | |
| IBC | |||
| AUC24, ng•hour/mL | 1187 (56) | 1122 (52) | 0.95 (0.85–1.05)c |
| Cmax, ng/mL | 59.7 (56) | 56.6 (55) | 0.95 (0.85–1.06)c |
| Tmax, hour | 16.0 (0.00–23.8) | 14.0 (0.00–23.8) |
AGm, adjusted geometric mean; AUC24, area under the plasma concentration‐time profile from time 0 to the quantifiable concentration 24 hours post‐dose; CI, confidence interval; CLr, renal clearance; Cmax, maximum plasma concentration; IBC, isobutyryl‐L‐carnitine; NMN, N1‐methylnicotinamide; Tmax, time to Cmax.
Geometric mean (geometric % coefficient of variation) for all except median (range) for Tmax.
n = 11.
The 90% CI contained within the acceptance interval of 80–125%.
Safety
No serious or severe adverse events (AEs) were reported in any of the pharmacokinetic studies. There were no AE‐related dose reductions or temporary discontinuations due to AEs. Incidence of treatment‐emergent adverse events (TEAEs) and treatment‐related adverse events (TRAEs) is shown in Table S1 . TRAEs that were reported in ≥ 2 participants treated with abrocitinib in the dabigatran study were abdominal discomfort and nausea in two participants treated with dabigatran plus abrocitinib vs. in one participant treated with dabigatran alone, and headache in four participants treated with dabigatran plus abrocitinib vs. in two participants treated with dabigatran alone; in the rosuvastatin study, these were nausea in two participants treated with rosuvastatin plus abrocitinib; and in the metformin study, these were diarrhea in four participants treated with metformin plus abrocitinib vs. in three participants treated with metformin alone. TEAEs that occurred were mainly mild in severity and were spread evenly among treatment groups.
DISCUSSION
Preclinical in vitro studies described in this paper suggested the potential for abrocitinib to inhibit several drug transporters, including intestinal P‐gp, BCRP, renal OAT3, MATE1, MATE2K, and hepatic OCT1. Despite triggering DDI risk cutoffs set by regulatory agencies, the subsequently conducted clinical studies found no impact of abrocitinib on the exposure to rosuvastatin and metformin. However, abrocitinib did increase the exposure of dabigatran in healthy adult participants, when co‐administered with dabigatran etexilate, a P‐gp substrate.
Rosuvastatin is a known probe substrate for intestinal and liver BCRP and thus inhibition of BCRP is expected to increase rosuvastatin plasma concentration. 26 Single‐nucleotide polymorphisms for ABCG2, the gene encoding for BCRP, have been associated with higher rosuvastatin AUC (~ 2‐fold increase with 421A/A vs. wild‐type). 33 The magnitude of any potential change in rosuvastatin exposure in the presence of abrocitinib could be limited in these participants, although genotype did not appear to play a role given the lack of DDIs with abrocitinib observed in the study. However, the one participant who had the ABCG2 421A/A genotype did have the highest rosuvastatin exposure in the study (~ 2‐fold the geometric mean). Rosuvastatin is also a substrate for OAT3, which contributes to its active renal secretion, therefore inhibition of OAT3, located on the basolateral membrane of proximal tubule epithelial cells, could further increase rosuvastatin plasma concentration. However, given that CLr is not a major clearance pathway of rosuvastatin, with only 10% of the parent drug recovered in urine after oral dosing, the impact of OAT3 inhibition on rosuvastatin plasma concentration may be limited. 34 As such, rosuvastatin CLr was selected as a marker for assessing changes in OAT3 activity.
A recent study has demonstrated that probenecid, a recommended index OAT3 inhibitor, has a comparable effect on the CLr of both rosuvastatin and the prototypical OAT3 probe substrate furosemide. The approximate five‐fold (80%) decrease in CLr of either substrate in the presence of probenecid suggests that the CLr of rosuvastatin is a sensitive endpoint to assess inhibition of OAT3 in vivo. 35 In the current study, rosuvastatin plasma AUC and CLr were not impacted by co‐administration with abrocitinib, indicating a lack of impact on OAT3 or BCRP activity. In addition, these results also confirm our in vitro data suggesting that abrocitinib is not an inhibitor of OATP1B1/OATP1B3, given that rosuvastatin is also a sensitive substrate for these drug transporters. 26
In vitro, abrocitinib was shown to be a more potent inhibitor of BCRP (half‐maximal inhibitory concentration (IC50) = 9.8 µM) compared with P‐gp (IC50 = 100 µM). One may speculate on why abrocitinib did not alter rosuvastatin exposures in contrast to the DDI observed with dabigatran etexilate. An important consideration in the application of any static in vitro predictive tool is its translation in vivo. Although imperfect, the Igut/IC50 value of ≥ 10 criterion appears to better predict a potential P‐gp DDI than it does when applied to BCRP. 36 , 37 In fact, in the absence of OATP1B1 inhibition (which applies to abrocitinib), BCRP Igut/IC50 values of 100–1000 did not necessarily result in an observed clinically meaningful DDI with rosuvastatin.
Co‐administration of abrocitinib with metformin, a sensitive MATE1/2K probe substrate primarily excreted unchanged in the urine, did not affect metformin exposure or CLr, indicating that abrocitinib did not inhibit MATE1 or MATE2K. In our clinical metformin study, we also investigated the potential utility of two endogenous compounds, NMN and IBC, as biomarkers for specific drug transporter activities. 16 , 18 , 20 , 21 Although it was not necessary to assess NMN, given that metformin is a sensitive substrate for the same drug transporters, its inclusion in this study provided an opportunity to generate additional data with this emerging biomarker. Consistent with the pharmacokinetic findings for metformin, co‐administration of abrocitinib with metformin did not alter the pharmacokinetics of NMN (also an MATE1/2K substrate). The metformin and NMN pharmacokinetic results were consistent with our in vitro data indicating that abrocitinib is not an inhibitor of OCT2 as both metformin and NMN are also OCT2 substrates. Although there was no mean impact on metformin and NMN exposure, a positive correlation was observed between the range of intra‐participant changes in CLr for NMN and metformin (Pearson correlation coefficient = 0.64), further supporting the role of this endogenous compound as a biomarker for MATE1/2K and OCT2 activity.
The pharmacokinetics for IBC (an endogenous OCT1 substrate) 16 were not altered with co‐administration of abrocitinib and metformin (compared with metformin alone) indicating that abrocitinib is not a clinical inhibitor of OCT1. Given that acylcarnitine species, like IBC, are biosynthesized in the liver and transport by OCT1 is bidirectional, decreased activity of OCT1 has been shown to correlate with lower plasma IBC exposures. 16 , 38 , 39 Although metformin is also a substrate for OCT1, modulation of hepatic OCT1 activity has not been shown to significantly impact plasma exposures of metformin as it is primarily eliminated in urine in its parent form which makes IBC a more sensitive substrate for evaluating OCT1 activity. 31 Our endogenous biomarker results with NMN and IBC were consistent with metformin results, all of which indicate a lack of abrocitinib‐mediated MATE1, MATE2K, OCT1, or OCT2 transporter inhibition, and add to the body of evidence supporting the utility of NMN and IBC as endogenous biomarkers for assessment of transporter activity. Although metformin was administered in both test and reference treatment phases, it has not been shown to alter the exposures of either NMN 18 or IBC (unpublished data) and is therefore not expected to impact the interpretation of the endogenous biomarker results.
A single dose of abrocitinib co‐administered with dabigatran etexilate (a sensitive P‐gp probe substrate and prodrug of active drug dabigatran) 25 increased plasma exposure of total dabigatran compared with dabigatran alone. MATE1 and MATE2K have been suggested to play important roles in the renal clearance of dabigatran. 40 Although in vitro results suggested potential MATE1 and MATE2K inhibition with abrocitinib, no clinical DDIs with the MATE1/2K substrate metformin were detected, indicating that the observed increase in dabigatran plasma exposure in vivo was primarily due to P‐gp inhibition.
In the dabigatran etexilate DDI study, a dose of 75 mg was administered, which is lower than the recommended dose approved in Europe and the United States for patients with normal renal function (150–300 mg). 25 The magnitude of the interaction observed with dabigatran etexilate at 75 mg would likely be comparable to approved doses given that dabigatran pharmacokinetics are linear across this dose range (up to 400 mg). 41 Consistent with labeling for dabigatran, wherein caution is advised for concomitant use of dabigatran and other medications that cause P‐gp interactions of similar magnitude as abrocitinib (e.g., amiodarone and quinidine, which also increase dabigatran exposures by 50–60%), 25 caution should be exercised for concomitant administration of abrocitinib with dabigatran.
The clinical inhibition of P‐gp by abrocitinib observed in the dabigatran study has implications for the potential increase in exposure of other P‐gp substrates that have a narrow therapeutic index (e.g., digoxin and cyclosporine). The systemic exposure of digoxin, for instance, can be modulated by inhibition of both intestinal and/or systemic P‐gp. As abrocitinib has a low risk of inhibiting systemic P‐gp transport (Table 1 ) and the absolute bioavailability of digoxin is already high (~ 75–78%) 42 , 43 , 44 and limited by the maximum of 100%, it is anticipated that the effect of abrocitinib on digoxin concentrations would be modest with a maximum ~ 30% increase in AUC assuming complete P‐gp inhibition. Although the impact of abrocitinib on digoxin pharmacokinetics has not been formally evaluated, caution should be exercised when digoxin and abrocitinib are co‐administered.
The majority of DDI risks predicted by IC50 and inhibition constant valued obtained in our in vitro studies did not manifest in the subsequently conducted clinical pharmacokinetic studies. This is not unexpected, as DDI risk thresholds according to regulatory guidelines are known to be conservative to limit false‐negative guidelines. 16 , 32 , 45 In fact, a recent analysis suggested that when using these criteria, ~ 30% of flagged DDIs are false‐positives. 46 The discrepancy between preclinical and clinical results presented in this paper is in line with the growing notion that phase I clinical studies using drug probes based on in vitro DDI risk assessments may be exposing human participants to drugs unnecessarily. 16 Therefore, assessment of endogenous biomarkers for hepatic and/or renal drug transporters within single or multiple ascending dose studies has the potential to help identify false‐positives in early clinical development, along with the ability to assess DDI risk across a wide dose range. To our knowledge, no ideal endogenous biomarkers for the assessment of intestinal drug transporters (e.g., P‐gp and BCRP) have been identified.
Abrocitinib co‐administered with a single oral dose of dabigatran etexilate, rosuvastatin, or metformin was well‐tolerated among the small population of healthy volunteers enrolled in these studies. The rates of TEAEs were similar between the treatment periods within each study, and AEs were mild or moderate in severity.
Limitations
Although study recruitment was open to both women and men, these phase I clinical trials included men only. The literature suggests that there are no substantial sex differences in intestinal P‐gp activity, 47 and thus an interaction of similar magnitude to what we observed in men with dabigatran etexilate in the presence of abrocitinib would be expected in women. Any potential differences in BCRP, MATE1/2K, OAT3, or OCT1 activity by sex would not be of concern given the lack of clinical DDIs observed with substrates of these transporters. As carriers of the SLC22A1 (OCT1) genotype associated with high OCT1 activity were shown to have approximately three‐fold higher plasma IBC concentrations compared to those with low OCT1 activity, 22 there is a potential impact on the interpretation of any DDI observed with OCT1 substrates. SLC22A1 genotype was not retrospectively assessed as part of the IBC ad hoc analyses in the metformin study given that abrocitinib was not shown to alter IBC exposure.
Due to study design limitations, these clinical pharmacokinetic analyses were conducted in an overtly healthy population. Drug transporter DDI assessment with acute treatment in healthy participants may not be generalizable to chronic treatment in patients with AD and comorbidities. Studies to determine whether there are differences in transporter activity between healthy participants and those with AD are lacking. However, in most cases, drug transporter activity is reduced in the inflammatory state; thus, assessment of potential transporter inhibition is likely to be more sensitive in healthy volunteers. 48
CONCLUSIONS
Abrocitinib inhibited the clinical activity of P‐gp, thereby increasing the exposure of dabigatran. However, in discordance with in vitro data, abrocitinib did not clinically impact the activity of BCRP, OAT3, OCT1, or MATE1/2K transporters, as evidenced by a lack of change in exposure and/or CLr of rosuvastatin, metformin, NMN, or IBC. In these phase I clinical studies, co‐administration of abrocitinib with dabigatran etexilate, rosuvastatin, or metformin was well‐tolerated with no clinically significant safety issues in healthy adult participants. Our findings also add to the body of evidence supporting the utility of NMN and IBC as endogenous biomarkers for assessment of transporter activity.
FUNDING
These trials were sponsored by Pfizer Inc.
CONFLICT OF INTEREST
All authors are employees and stockholders of Pfizer Inc.
AUTHOR CONTRIBUTIONS
M.V., W.B., S.T., S.M., M.D., and B.M. wrote the manuscript. M.V., W.B., C.C., V.L., A.D., D.G., S.M., M.D., A.D.R., and B.M. designed the research. S.T., N.R., and L.L. performed the research. M.V., W.B., C.C., V.L., A.D., D.G., S.T., S.M., M.D., A.D.R., and B.M. analyzed the data. L.L. contributed new reagents/analytical tools.
Supporting information
Table S1
Table S2
Table S3
Table S4
ACKNOWLEDGMENTS
The authors thank the Pfizer Inc. (Groton, CT) colleagues Mark West and Sarah Lazzaro for generating the OATP1B1/3 and vesicle BCRP/P‐gp inhibition data, respectively. Editorial and medical writing support under the guidance of the authors was provided by Megan Elder, PhD, and Josh Rodman, PhD, at ApotheCom, San Francisco, CA, USA, and was funded by Pfizer Inc., New York, NY, USA, in accordance with Good Publication Practice (GPP3) guidelines (Ann Intern Med. 2015;163:461–464).
Clinical trial registration numbers:
Dabigatran study: ClinicalTrials.gov Identifier, NCT03742336; EudraCT, 2018‐003579‐36.
Rosuvastatin study: ClinicalTrials.gov Identifier, NCT03806101; EudraCT, 2018‐003425‐28.
Metformin study: ClinicalTrials.gov Identifier, NCT03796182; EudraCT, 2018‐003683‐31.
- 1. Silverberg, J.I. et al. Patient burden and quality of life in atopic dermatitis in US adults: a population‐based cross‐sectional study. Ann. Allergy Asthma Immunol. 121, 340–347 (2018). [DOI] [PubMed] [Google Scholar]
- 2. Brunner, P.M. , Guttman‐Yassky, E. & Leung, D.Y. The immunology of atopic dermatitis and its reversibility with broad‐spectrum and targeted therapies. J. Allergy Clin. Immunol. 139, S65–S76 (2017). [DOI] [PMC free article] [PubMed] [Google Scholar]
- 3. Japan's MHLW Approves Pfizer's Cibinqo® (abrocitinib) for Adults and Adolescents with Moderate to Severe Atopic Dermatitis . News release. Published September 30, 2021. https://www.pfizer.com/news/press‐release/press‐release‐detail/japans‐mhlw‐approves‐pfizers‐cibinqor‐abrocitinib‐adults#:~:text=(NYSE: PFE) today announced,and older with inadequate response. Accessed April 26, 2022.
- 4. UK's MHRA Grants Marketing Authorisation for Pfizer's Cibinqo® (abrocitinib) for Adults and Adolescents with Moderate‐to‐Severe Atopic Dermatitis . News release. Published September 9, 2021. https://www.pfizer.com/news/press‐release/press‐release‐detail/uks‐mhra‐grants‐marketing‐authorisation‐pfizers‐cibinqor#:~:text=(NYSE: PFE) today announced,AD) in adults and adolescents. Accessed April 26, 2022.
- 5. European Commission Approves Pfizer's Cibinqo® (abrocitinib) for the Treatment of Adults with Moderate‐to‐Severe Atopic Dermatitis . News release. Published December 10, 2021. https://www.pfizer.com/news/press‐release/press‐release‐detail/european‐commission‐approves‐pfizers‐cibinqor‐abrocitinib. Accessed April 26, 2022.
- 6. FDA Approves Pfizer’s Cibinqo® (abrocitinib) for Adults with Moderate‐to‐Severe Atopic Dermatitis . News release. Published January 14, 2022. https://www.businesswire.com/news/home/20220114005394/en. Accessed April 26, 2022.
- 7. Bieber, T. et al. Abrocitinib versus placebo or dupilumab for atopic dermatitis. N. Engl. J. Med. 384, 1101–1112 (2021). [DOI] [PubMed] [Google Scholar]
- 8. Nezamololama, N. , Crowley, E.L. , Gooderham, M.J. & Papp, K. Abrocitinib: a potential treatment for moderate‐to‐severe atopic dermatitis. Expert Opin. Investig. Drugs 29, 911–917 (2020). [DOI] [PubMed] [Google Scholar]
- 9. Crowley, E.L. , Nezamololama, N. , Papp, K. & Gooderham, M.J. Abrocitinib for the treatment of atopic dermatitis. Expert Rev. Clin. Immunol. 16, 955–962 (2020). [DOI] [PubMed] [Google Scholar]
- 10. Silverberg, J.I. Comorbidities and the impact of atopic dermatitis. Ann. Allergy Asthma Immunol. 123, 144–151 (2019). [DOI] [PubMed] [Google Scholar]
- 11. Liang, Y. , Li, S. & Chen, L. The physiological role of drug transporters. Protein Cell 6, 334–350 (2015). [DOI] [PMC free article] [PubMed] [Google Scholar]
- 12. US Department of Health and Human Services . In vitro drug interaction studies — Cytochrome P450 enzyme‐ and transporter‐mediated drug interactions guidance for industry. Published January 2020. https://www.fda.gov/regulatory‐information/search‐fda‐guidance‐documents/vitro‐drug‐interaction‐studies‐cytochrome‐p450‐enzyme‐and‐transporter‐mediated‐drug‐interactions. Accessed February 14, 2022.
- 13. Giacomini, K.M. et al. International Transporter Consortium commentary on clinically important transporter polymorphisms. Clin. Pharmacol. Ther. 94, 23–26 (2013). [DOI] [PubMed] [Google Scholar]
- 14. Tornio, A. , Filppula, A.M. , Niemi, M. & Backman, J.T. Clinical studies on drug‐drug interactions involving metabolism and transport: methodology, pitfalls, and interpretation. Clin. Pharmacol. Ther. 105, 1345–1361 (2019). [DOI] [PMC free article] [PubMed] [Google Scholar]
- 15. Mariappan, T.T. , Shen, H. & Marathe, P. Endogenous biomarkers to assess drug‐drug interactions by drug transporters and enzymes. Curr. Drug Metab. 18, 757–768 (2017). [DOI] [PubMed] [Google Scholar]
- 16. Luo, L. et al. A multiplexed HILIC‐MS/HRMS assay for the assessment of transporter inhibition biomarkers in phase i clinical trials: isobutyryl‐carnitine as an organic cation transporter (OCT1) biomarker. Anal. Chem. 92, 9745–9754 (2020). [DOI] [PubMed] [Google Scholar]
- 17. Chu, X. et al. Clinical probes and endogenous biomarkers as substrates for transporter drug‐drug interaction evaluation: perspectives from the international transporter consortium. Clin. Pharmacol. Ther. 104, 836–864 (2018). [DOI] [PubMed] [Google Scholar]
- 18. Miyake, T. et al. Identification of appropriate endogenous biomarker for risk assessment of multidrug and toxin extrusion protein‐mediated drug‐drug interactions in healthy volunteers. Clin. Pharmacol. Ther. 109, 507–516 (2021). [DOI] [PMC free article] [PubMed] [Google Scholar]
- 19. Mori, D. et al. Dose‐dependent inhibition of OATP1B by rifampicin in healthy volunteers: comprehensive evaluation of candidate biomarkers and OATP1B probe drugs. Clin. Pharmacol. Ther. 107, 1004–1013 (2020). [DOI] [PMC free article] [PubMed] [Google Scholar]
- 20. Luo, L. et al. LC‐MS/MS assay for N(1)‐methylnicotinamide in humans, an endogenous probe for renal transporters. Bioanalysis 10, 673–689 (2018). [DOI] [PubMed] [Google Scholar]
- 21. Müller, F. et al. N(1)‐methylnicotinamide as an endogenous probe for drug interactions by renal cation transporters: studies on the metformin‐trimethoprim interaction. Eur. J. Clin. Pharmacol. 71, 85–94 (2015). [DOI] [PubMed] [Google Scholar]
- 22. Jensen, O. , Matthaei, J. , Klemp, H.G. , Meyer, M.J. , Brockmöller, J. & Tzvetkov, M.V. Isobutyrylcarnitine as a biomarker of OCT1 activity and interspecies differences in its membrane transport. Front. Pharmacol. 12, 674559 (2021). [DOI] [PMC free article] [PubMed] [Google Scholar]
- 23. Matthaei, J. et al. Effects of genetic polymorphism in CYP2D6, CYP2C19, and the organic cation transporter OCT1 on amitriptyline pharmacokinetics in healthy volunteers and depressive disorder patients. Front. Pharmacol. 12, 688950 (2021). [DOI] [PMC free article] [PubMed] [Google Scholar]
- 24. Stangier, J. & Clemens, A. Pharmacology, pharmacokinetics, and pharmacodynamics of dabigatran etexilate, an oral direct thrombin inhibitor. Clin. Appl. Thromb. Hemost. 15(Suppl. 1), 9s–16s (2009). [DOI] [PubMed] [Google Scholar]
- 25. Boehringer Ingelheim Pharmaceuticals Inc. Pradaxa® (Dabigatran Etexilate Mesylate) Capsules for Oral Use (Initial U.S., Ridgefield, CT, 2014). [Google Scholar]
- 26. AstraZeneca . Crestor (Rosuvastatin Calcium) Tablets (AstraZeneca, Osaka, Japan, 2015). [Google Scholar]
- 27. Windass, A.S. , Lowes, S. , Wang, Y. & Brown, C.D. The contribution of organic anion transporters OAT1 and OAT3 to the renal uptake of rosuvastatin. J. Pharmacol. Exp. Ther. 322, 1221–1227 (2007). [DOI] [PubMed] [Google Scholar]
- 28. Stage, T.B. , Brøsen, K. & Christensen, M.M. A comprehensive review of drug‐drug interactions with metformin. Clin. Pharmacokinet. 54, 811–824 (2015). [DOI] [PubMed] [Google Scholar]
- 29. Kimura, N. et al. Metformin is a superior substrate for renal organic cation transporter OCT2 rather than hepatic OCT1. Drug Metab. Pharmacokinet. 20, 379–386 (2005). [DOI] [PubMed] [Google Scholar]
- 30. Bristol‐Meyers Squibb Company . Glucophage (metformin hydrochloride) Tablets, for Oral Use. Glucophage XR (metformin hydrochloride) Extended‐Release Tablets, for Oral Use (Bristol‐Meyers Squibb Company, Princeton, NJ, 2018). [Google Scholar]
- 31. Zamek‐Gliszczynski, M.J. et al. ITC commentary on metformin clinical drug‐drug interaction study design that enables an efficacy‐ and safety‐based dose adjustment decision. Clin. Pharmacol. Ther. 104, 781–784 (2018). [DOI] [PubMed] [Google Scholar]
- 32. European Medicines Agency EMA . Guideline on the investigation of drug interactions. Published June 21, 2012. https://www.ema.europa.eu/en/documents/scientific‐guideline/guideline‐investigation‐drug‐interactions‐revision‐1_en.pdf. Accessed April 16, 2021.
- 33. Keskitalo, J.E. , Zolk, O. , Fromm, M.F. , Kurkinen, K.J. , Neuvonen, P.J. & Niemi, M. ABCG2 polymorphism markedly affects the pharmacokinetics of atorvastatin and rosuvastatin. Clin. Pharmacol. Ther. 86, 197–203 (2009). [DOI] [PubMed] [Google Scholar]
- 34. McTaggart, F. et al. Preclinical and clinical pharmacology of Rosuvastatin, a new 3‐hydroxy‐3‐methylglutaryl coenzyme A reductase inhibitor. Am. J. Cardiol. 87, 28b–32b (2001). [DOI] [PubMed] [Google Scholar]
- 35. Wiebe, S.T. et al. Validation of a drug transporter probe cocktail using the prototypical inhibitors rifampin, probenecid, verapamil, and cimetidine. Clin. Pharmacokinet. 59, 1627–1639 (2020). [DOI] [PMC free article] [PubMed] [Google Scholar]
- 36. Zhou, T. , Arya, V. & Zhang, L. Comparing various in vitro prediction methods to assess the potential of a drug to Inhibit P‐glycoprotein (P‐gp) transporter in vivo. J. Clin. Pharmacol. 59, 1049–1060 (2019). [DOI] [PubMed] [Google Scholar]
- 37. Costales, C. et al. Quantitative prediction of breast cancer resistant protein mediated drug‐drug interactions using physiologically‐based pharmacokinetic modeling. CPT Pharmacometrics Syst. Pharmacol. 10, 1018–1031 (2021). [DOI] [PMC free article] [PubMed] [Google Scholar]
- 38. Kim, H.I. et al. Fine mapping and functional analysis reveal a role of SLC22A1 in acylcarnitine transport. Am. J. Hum. Genet. 101, 489–502 (2017). [DOI] [PMC free article] [PubMed] [Google Scholar]
- 39. Ramsay, R.R. , Gandour, R.D. & van der Leij, F.R. Molecular enzymology of carnitine transfer and transport. Biochim. Biophys. Acta 1546, 21–43 (2001). [DOI] [PubMed] [Google Scholar]
- 40. Shen, H. , Yao, M. , Sinz, M. , Marathe, P. , Rodrigues, A.D. & Zhu, M. Renal excretion of dabigatran: the potential role of Multidrug and Toxin Extrusion (MATE) proteins. Mol. Pharm. 16, 4065–4076 (2019). [DOI] [PubMed] [Google Scholar]
- 41. Stangier, J. , Rathgen, K. , Stähle, H. , Gansser, D. & Roth, W. The pharmacokinetics, pharmacodynamics and tolerability of dabigatran etexilate, a new oral direct thrombin inhibitor, in healthy male subjects. Br. J. Clin. Pharmacol. 64, 292–303 (2007). [DOI] [PMC free article] [PubMed] [Google Scholar]
- 42. Beveridge, T. , Nüesch, E. & Ohnhaus, E.E. Absolute bioavailability of digoxin tablets. Arzneimittelforschung 28, 701–703 (1978). [PubMed] [Google Scholar]
- 43. Manninen, V. , Reissell, P. & Ojala, K. Maximal bioavailability of digoxin from tablets and oral solution in steady state. Acta Med. Scand. 199, 487–489 (1976). [DOI] [PubMed] [Google Scholar]
- 44. Binnion, P.F. A comparison of the bioavailability of digoxin in capsule, tablet, and solution taken orally with intravenous digoxin. J. Clin. Pharmacol. 16, 461–467 (1976). [PubMed] [Google Scholar]
- 45. US Food and Drug Administration . In vitro metabolism and transporter‐mediated drug‐drug interaction studies. Guidance for industry. Published October 2017. https://www.fda.gov/files/drugs/published/In‐Vitro‐Metabolism‐‐and‐Transporter‐‐Mediated‐Drug‐Drug‐Interaction‐Studies‐Guidance‐for‐Industry.pdf. Accessed April 16, 2021.
- 46. Vaidyanathan, J. , Yoshida, K. , Arya, V. & Zhang, L. Comparing various in vitro prediction criteria to assess the potential of a new molecular entity to inhibit organic anion transporting polypeptide 1B1. J. Clin. Pharmacol. 56(Suppl. 7), S59–S72 (2016). [DOI] [PubMed] [Google Scholar]
- 47. Paine, M.F. , Ludington, S.S. , Chen, M.L. , Stewart, P.W. , Huang, S.M. & Watkins, P.B. Do men and women differ in proximal small intestinal CYP3A or P‐glycoprotein expression? Drug Metab. Dispos. 33, 426–433 (2005). [DOI] [PubMed] [Google Scholar]
- 48. Fernandez, C. , Buyse, M. , German‐Fattal, M. & Gimenez, F. Influence of the pro‐inflammatory cytokines on P‐glycoprotein expression and functionality. J. Pharm. Pharm. Sci. 7, 359–371 (2004). [PubMed] [Google Scholar]
Associated Data
This section collects any data citations, data availability statements, or supplementary materials included in this article.
Supplementary Materials
Table S1
Table S2
Table S3
Table S4