

Abstract
Background
Ex vivo lung perfusion (EVLP) is used to assess and preserve lungs prior to transplantation. However, its inherent immunomodulatory effects are not completely understood. We examine perfusate and tissue compartments to determine the change in immune cell composition in human lungs maintained on EVLP.
Methods
Six human lungs unsuitable for transplantation underwent EVLP. Tissue and perfusate samples were obtained during cold storage and at 1‐, 3‐ and 6‐h during perfusion. Flow cytometry, immunohistochemistry, and bead‐based immunoassays were used to measure leukocyte composition and cytokines. Mean values between baseline and time points were compared by Student's t test.
Results
During the 1st hour of perfusion, perfusate neutrophils increased (+22.2 ± 13.5%, p < 0.05), monocytes decreased (−77.5 ± 8.6%, p < 0.01) and NK cells decreased (−61.5 ± 22.6%, p < 0.01) compared to cold storage. In contrast, tissue neutrophils decreased (−22.1 ± 12.2%, p < 0.05) with no change in monocytes and NK cells. By 6 h, perfusate neutrophils, NK cells, and tissue neutrophils were similar to baseline. Perfusate monocytes remained decreased, while tissue monocytes remained unchanged. There was no significant change in B cells or T cell subsets. Pro‐inflammatory cytokines (IL‐1b, G‐CSF, IFN‐gamma, CXCL2, CXCL1 granzyme A, and granzyme B) and lymphocyte activating cytokines (IL‐2, IL‐4, IL‐6, IL‐8) increased during perfusion.
Conclusions
Early mobilization of innate immune cells occurs in both perfusate and tissue compartments during EVLP, with neutrophils and NK cells returning to baseline and monocytes remaining depleted after 6 h. The immunomodulatory effect of EVLP may provide a therapeutic window to decrease the immunogenicity of lungs prior to transplantation.
Keywords: donor leukocyte, ex vivo lung perfusion, immune modulation
1. INTRODUCTION
Lung transplantation is an established treatment for patients with end‐stage lung disease, but long‐term survival is limited by allograft dysfunction. 1 , 2 , 3 Normothermic ex vivo lung perfusion (EVLP) is used to assess and maintain donor lungs at normothermic and physiologic conditions and offers the potential for conditioning donor lungs prior to transplantation. 4 , 5 , 6 , 7 , 8 Various therapeutic interventions such as gene therapy, thrombolysis, photodynamic therapy, steroids and antibiotics have been proposed to optimize donor lungs while they are on EVLP to improve transplant outcomes. 9 , 10 , 11 , 12 , 13
One potential EVLP application is to alter lung allograft immunogenicity. During transplantation, leukocytes from the interstitium of the donor organs (passenger leukocytes) are mobilized and migrate to the recipient after transplantation while circulating recipient leukocytes repopulate the allograft. 14 This bidirectional exchange of donor and recipient leukocytes potentially contributes to donor‐specific tolerance 14 or graft‐versus‐host stimulation. 15 , 16 However, the effect of EVLP on leukocyte migration is not completely understood. Previous research has shown that nonclassical monocytes rapidly mobilize into the perfusate during EVLP in humans, 17 while T cells and B cells were enriched in the perfusate in a rat model. 18 It is unclear if EVLP affects lung tissue‐resident (parenchymal) leukocytes.
In this study, we aimed to characterize the movement of passenger and parenchymal leukocytes between perfusate and tissue compartments in donor lungs during EVLP. We hypothesize that leukocytes migrate between the perfusate and tissue compartments during EVLP, thus altering the immune cell composition of lung tissue. This would suggest that EVLP itself may have an intrinsic immune modulating effect on donor lung grafts that may prove advantageous for transplant allograft function.
2. MATERIAL AND METHODS
2.1. Human donor lung procurement
Six non‐transplantable human donor lungs available for research were included in our study (Supplemental Table 1). Inclusion criteria were brain dead donors located within 1 h driving distance from our medical center. Exclusion criteria were donors who had history of prior sternotomy, P/F ratio less than 100 at the time of donor lung offer, and traumatic injuries to intrathoracic organs. Three donors were rejected from clinical transplant due to pneumonia, two for asthma, and one for lymphadenopathy. Donor age ranged from 36 to 60, with median age 51. Following cross clamp, pulmonary arteriotomy and left atriotomy was performed. The bilateral lung block was removed. On the back table, the lung grafts were antegrade and retrograde flushed with cold Organ Care System (OCS) preservative solution (TransMedics, Inc, Andover, MA). The lung grafts were then transported on ice. The use of human donor organs for research purposes was approved by Gift of Hope Tissue and Organ Network, Itasca, Illinois. The study was exempt by the Institutional Review Board at the University of Chicago (IRB19‐1942).
2.2. Ex vivo lung perfusion
Our lung perfusion platform was adapted from protocols by two well‐established ex vivo lung perfusion groups in an attempt to maximize both clinical applicability and research data. 19 , 20 The EVLP circuit consisted of a Sarns disposable centrifugal pump (Terumo, Ann Arbor, MI), CAPIOX FX Advance oxygenator with integrated hardshell venous reservoir (Terumo, Ann Arbor, MI), a collection sink coated with polytetrafluoroethylene, and a combination of 1/4 in. and 3/8‐in. perfusion tubing (Medtronic, Minneapolis, MN) (Supplemental Figure 1). There was no leukocyte filter in the system. The circuit was primed with 3 L of DME‐H21 high glucose (4500 mg/L) media (Thermo Fisher Scientific, Waltham, MA) containing 5% bovine serum albumin. 20 The main pulmonary artery was cannulated with 3/8‐in. perfusion tubing via a 3/8 × 3/8 in. intersept tubing connector (Medtronic, Minneapolis, MN). The left atrium was left open to facilitate open unobstructed drainage. Perfusion was initiated immediately after the lungs were removed from ice storage. The perfusate temperature was incrementally increased to goal temperature of 36.7–37℃ over 20 min. Oxygenation and ventilation were initiated when the temperature reached 33℃. 19 The pump flow rate was adjusted to maintain a pulmonary arterial pressure less than 20 mmHg. 20 We delivered continuous positive airway pressure (CPAP) at 15–20 cmH2O at FiO2 21%. 20 Gas mixture of 8% CO2, 3% O2, and 89% N2 was used to de‐oxygenate the perfusate. 19 Throughout EVLP, no additional perfusate was added.
We adjusted the pump flow rate to maintain a pulmonary arterial pressure less than 20 mmHg, which allowed us to perfuse bilateral lung blocks at rates between 1 and 1.5 L/min. This approach was required due to the marginal quality of lungs used in our study and lies between previously published protocols (flow rate about 0.2 L/min to maintain a pulmonary arterial pressure of 10–12 mmHg 20 versus flow rate at 40% of donor predicted cardiac output. 19
2.3. Physiological measurements during EVLP
Pulmonary arterial pressure was measured hourly via a pressure valve placed at approximately the level of the left atrium. Measuring lung compliance was not feasible since the lungs were maintained on CPAP. 20 Tissue wedges (about 100 mg) were serially collected to determine pulmonary edema by calculating the tissue wet‐dry ratio (ratio of gross weight of the tissue wedge immediately after tissue biopsy to gross weight of the same tissue wedge 5 days after dehydration at room temperature in a negative pressure hood). At each hour of perfusion, FIO2 was increased to 100% for 5 min and 3 ml of perfusate was collected upstream and downstream of the organ for blood gas analysis using an iSTAT blood gas analyzer (Abbott Labs, Chicago, IL).
2.4. Sample processing
Before initiation of perfusion (0th hour), perfusate samples from retrograde flush with cold phosphate‐buffered saline and tissue samples via wedge biopsies were obtained. During perfusion, perfusate samples (about 300 ml) and tissue samples from periphery of lobes (about 500 mg–1500 mg) were obtained at the 1st, 3rd, and 6th hour of perfusion. Perfusate samples were spun down at 400 G and treated with ammonium‐chloride‐potassium buffer (Gibco|Thermo Fisher Scientific, Waltham, MA) to lyse remaining red blood cells. Lung tissue was mechanically disrupted and enzymatically digested at 37°C for 90 min using 100 U/ml Type I collagenase (Gibco|Thermo Fisher Scientific, Waltham MA) in Hank's Balanced Salt Solution (HBSS) prior to filtration through 100‐micron filters (Fisher Scientific, Waltham, MA). Samples were then washed and resuspended in phosphate‐buffered saline.
2.5. Flow cytometry
Flow cytometry was used to quantify the distribution of different donor leukocytes in both the graft and perfusate compartments. Isolated cells were washed and stained with Zombie viability dye (Biolegend, San Diego, CA) in phosphate‐buffered saline, treated with Human Fc Receptor Blocking Solution (Biolegend), and then stained with the following markers prior to fixing with 2% formaldehyde (Fisher Scientific): anti‐CD3 (Biolegend), anti‐CD4 (Biolegend), anti‐CD8 (Biolegend), anti‐CD14 (Biolegend), anti‐CD16 (Biolegend), anti‐CD19 (Biolegend), anti‐CD45 (Invitrogen, Waltham, MA), anti‐CD56 (Miltenyl Biotec, Bergisch Gladbach, Germany), anti‐CD66b (Biolegend) (Supplemental Table 2). Data were acquired on an Aurora spectral flow cytometer (Cytek Biosciences, Fremont, CA) and analyzed using FlowJo Software (Version 10; FlowJo LLC, Ashland, OR) (Supplemental Figure 2).
2.6. Histology and immunohistochemistry
Tissue samples were fixed in 10% neutral buffered formalin (Scigen, Gardena, CA) for 24–36 h prior to embedding in paraffin. Sections were then stained with hematoxylin and eosin to evaluate airway and alveoli structural integrity and anti‐CD31 (Abcam, Cambridge, UK) to evaluate vasculature structural integrity.
To quantify T regulatory cells, sections were stained with anti‐CD3 (BioCare medical, Pacheco, CA), anti‐CD4 (BioCare Medical), DAPI (Akoya Biosciences, Marlborough, MA) and FOXP3 (BioCare medical) (Supplemental table 3), and slides were scanned by Vectra Polaris System (Akoya Biosciences) and analyzed with Inform Automated Image Analysis Software (Akoya Biosciences). A minimum of five region of interests (ROI) (931 um × 698 um) were selected within each slide, in which number of tissue regulatory T cells (Treg cells) and CD3+ T cells were counted. The percentage of Treg cells out of all CD3+ T cells was calculated for each ROI.
2.7. Cytokine analysis
Three milliliters of perfusate downstream from the organ were collected in blood collection tubes without anticoagulant additive prior to perfusion and at 1st, 3rd, and 6th hour of perfusion. Samples were spun down at 1200 RPM to obtain sera, which were immediately frozen on dry ice. The samples were then processed using a Cytokine & Chemokine 17‐Plex Human ProcartaPlex Panel (Thermo Fisher Scientific, Waltham, MA) to measure G‐CSF, GM‐CSF, Granzyme A, Granzyme B, CXCL1, IFN‐gamma, IL‐1 beta, IL‐2, IL‐4, IL‐6, IL‐8 (CXCL8), IL‐10, IL‐17A (CTLA‐8), MCP‐1 (CCL2), MIP‐2 alpha (CXCL2), and TNF alpha. All samples were run in triplicates. Analyte fluorescence intensities were measured using the Luminex 200 instrument system (Thermo Fisher Scientific). Concentration of various cytokines (pg/mL) were calculated based on standard curves of analyte concentration versus median fluorescence intensity.
2.8. Statistical analysis
Using flow cytometry, the frequency of each immune cell type out of the total number of CD45+ cells was calculated in both perfusate and lung tissue for each time point. The frequency of each monocyte subset out of the total frequency of monocytes was also calculated in both tissue compartments for each time point. To illustrate the time dependent, dynamic effect of EVLP on each individual cell type in either compartment, percentage change of each cell type frequency at various time points (1stst, 3rd, or 6th hour) relative to 0th hour (cold storage) was calculated [percentage change = 100%* (frequency at various times points – cell frequency at 0th hour)/(cell frequency at 0th hour)]. Student's t test was used to determine if the frequency changes for each immune cell type relative to 0th hour were statistically significant (p < 0.05). ANOVA test was also used to evaluate whether consistent trends exist in changes in immune profile across all lungs included in the study.
Mean and standard deviation of concentration (pg/ml) of each cytokine at each time point were calculated for all organs. Student's t test was used to determine if concentration changes between time points were significant. ANOVA test was also used to evaluate whether consistent trends exist in changes in cytokine profile across all lungs included in the study.
Using immunohistochemistry, the frequency of regulatory T cells out of total number of CD3+ T cells were calculated for all ROI's from each tissue slide taken from time point 0th and 6th hour. A mean regulatory T cell frequency was assigned to each organ for each time point by averaging all ROI values. Student's t test was used to compare regulatory T cell percentages of all organs between time points 0th and 6th hour.
3. RESULTS
3.1. Lung physiological characteristics are preserved
EVLP was maintained for 6 h. One lung (lung 11) had pulmonary artery pressure persistently > 40 mm Hg with histology consistent with chronic intra‐alveolar hemorrhage (likely secondary to donor history of chronic left heart failure) (Supplemental Figure 3), thus was excluded from statistical analysis. The remaining lungs (n = 5) had stable PA pressure (mean PA pressure at 6 h 13.6 ± 6.1 mmHg), perfusion flow rate (mean perfusion flow rate at 6 h 1.2 ± 0.1 L/min), perfusate pH (mean perfusate pH at 6 h 7.42 ± 0.1) and P/F ratio (mean P/F ratio at 6 h 247 ± 18) (Figure 1). There was no significant increase in pulmonary edema with similar wet:dry ratio throughout 6 h of EVLP (n = 5) (0 h: 5.85 ± 0.90, 1 h: 5.49 ± 0.30, 3 h: 5.88 ± 0.35, 6 h: 6.45 ± 1.28, p = 0.58) (Figure 1). Histology showed that the structural integrity of vasculature, alveoli, pulmonary interstitial, and airway was maintained after 6 h of EVLP (Figure 2).
FIGURE 1.
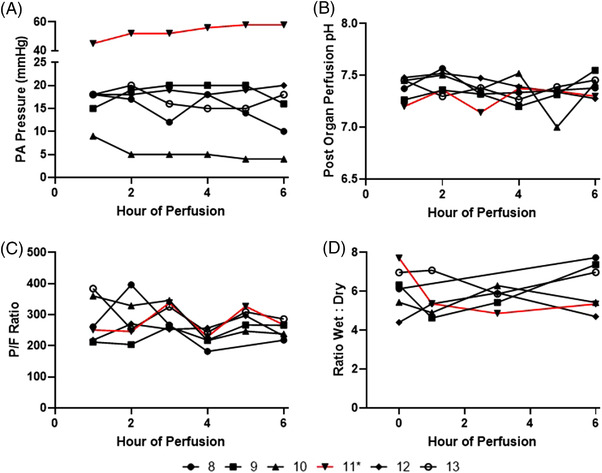
Physiologic data of ex vivo lung perfusion of six human lungs. (A) Pulmonary artery pressure. (B) Post organ perfusate pH. (C) P/F ratio – ratio of partial pressure of oxygen (PaO2) of perfusate downstream of organ to fraction of inspired oxygen (FiO2). (D) Ratio wet:dry. * – Lung 11 (red) demonstrated persistently elevated pulmonary artery perfusion pressure in addition to histology suggestive of chronic intra‐alveolar hemorrhage
FIGURE 2.
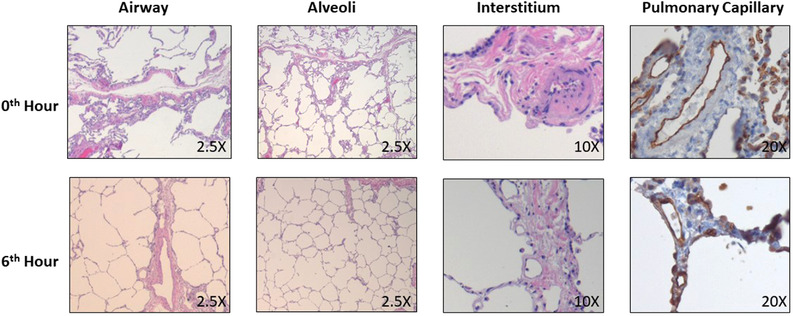
Representative histology for donor lung demonstrated structural integrity after 6 h of perfusion. H&E staining was used to identify airway (2.5×), alveoli (2.5×) and interstitial compartment (10×), while CD31 immunohistochemistry was used to identify pulmonary capillaries (20×). (All slides obtained from lung 8)
3.2. EVLP alters the cellular composition of perfusate and lung parenchyma
EVLP altered the cellular composition of perfusates and tissue over time. Neutrophils were the most abundant immune cell in perfusate and lung tissue prior to initiation of perfusion (63.3 ± 5.9% and 40.6 ± 13.6%, respectively). Despite decrease in cell frequency, neutrophils remained the most abundant immune cell types in perfusate and lung tissue at 6th hour of perfusion (60.0 ± 14.2 % and 25.39±16.7%, respectively) (Table 1). To serially determine the changes in frequency of each immune cell type in both perfusate and tissue compartments during EVLP, %Δ of each cell type at various time points relative to 0th hour was calculated.
TABLE 1.
Composition of leukocytes in perfusate and tissue over time as percentage of CD45+ cells (mean ± standard deviation)
| PERFUSATE | Hour | CD4 T cell | CD8 T cell | B Cell | NK Cell | NK T Cell | Neutrophil | Eosinophil | CM | IM | NCM | |
|---|---|---|---|---|---|---|---|---|---|---|---|---|
| 0 | 1.1 ± 0.7% | 3.41 ± 3.7% | 1.61 ± 1.4% | 6.31 ± 1.7% | 4.81 ± 4.2% | 63.31 ± 5.9% | 3.11 ± 2.2% | 9.31 ± 2.9% | 3.71 ± 2.2% | 0.81 ± 0.5% | ||
| 1 | 1.81 ± 0.8% | 5.21 ± 7.7% | 1.91 ± 1.6% | 2.41 ± 1.6% | 3.0 ± 2.8% | 76.8 ± 6.8% | 2.7 ± 2.1% | 1.9 ± 0.8% | 0.1 ± 0.1% | 1.0 ± 1.2% | ||
| 3 | 2.6 ± 1.4% | 13.4 ± 18.3% | 2.3 ± 1.9% | 4.0 ± 2.1% | 9.2 ± 8.3% | 57.3 ± 16.7% | 4.7 ± 3.6% | 1.3 ± 0.5% | 0.1 ± 0.0% | 0.6 ± 0.4% | ||
| 6 | 3.4 ± 3.7% | 7.2 ± 10.7% | 2.3 ± 2.0% | 5.7 ± 3.1% | 5.1 ± 4.4% | 60.0 ± 14.2% | 8.3 ± 6.3% | 2.7 ± 1.7% | 0.2 ± 0.2% | 0.3 ± 0.2% | ||
| TISSUE | Hour | CD4 T cell | CD8 T cell | B Cell | NK Cell | NK T Cell | Neutrophil | Eosinophil | CM | IM | NCM | Macrophages |
| 0 | 4.0 ± 2.3% | 2.7 ± 1.6% | 0.3 ± 0.2% | 1.3 ± 0.9% | 1.9 ± 0.8% | 40.6 ± 13.6% | 11.8 ± 14.6% | 7.4 ± 3.5% | 1.7 ± 1.6% | 0.8 ± 0.6% | 14.3 ± 11.1% | |
| 1 | 4.8 ± 3.1% | 3.9 ± 2.5% | 0.3 ± 0.1% | 0.9 ± 0.3% | 1.2 ± 0.6% | 35.7 ± 13.7% | 13.0 ± 16.6% | 10.1 ± 8.6% | 5.1 ± 4.6% | 0.8 ± 0.7% | 11.0 ± 10.7% | |
| 3 | 4.5 ± 2.4% | 3.3 ± 2.4% | 0.3 ± 0.1% | 0.6 ± 0.2% | 1.1 ± 0.3% | 34.6 ± 19.0% | 12.1 ± 14.2% | 16.7 ± 16.5% | 2.9 ± 2.8% | 0.3 ± 0.3% | 15.6 ± 17.2% | |
| 6 | 4.3 ± 3.8% | 3.6 ± 3.3% | 0.4 ± 0.2% | 1.1 ± 1.1% | 2.9 ± 3.3% | 25.3 ± 16.7% | 9.1 ± 13.9% | 11.3 ± 5.9% | 8.9 ± 8.8% | 0.3 ± 0.1% | 22.0 ± 15.3% |
Abbreviations: NK cell, natural killer cell; NK T cell, natural killer T cell; CM, classical monocytes; IM, intermediate monocytes; NCM, nonclassical monocytes.
At the first hour of perfusion, perfusate neutrophil increased (+22.2 ± 13.5%) while tissue neutrophils decreased (−22.1 ± 12.2%). The change in neutrophils were no longer apparent by the 3rd hour of perfusion, and by the 6th hour of perfusion the neutrophil frequencies in both tissue compartments were comparable to 0th hour. Perfusate total monocytes frequency decreased significantly (−77.5 ± 8.6%) at the 1st hour of perfusion and remained decreased throughout perfusion, with no significant change in tissue total monocyte frequency. No significant trends were observed in tissue and perfusate eosinophil frequencies (Figure 3).
FIGURE 3.
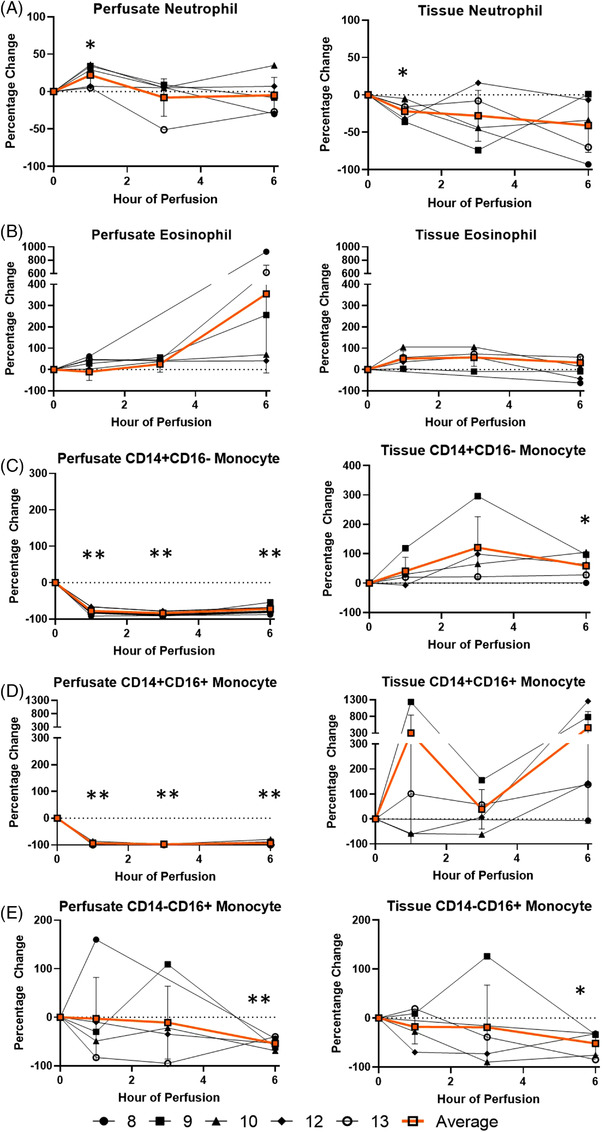
Percentage change of each myeloid immune cell frequency during perfusion. A percentage change of 0% suggests there is no change in the innate immune cell frequency from time point 0th hour. Average values of percentage changes (orange line) as well as standard deviations were calculated (vertical bar). A two‐sided, paired t test was performed to compare percentages of each time point to those at time 0 h. (*: p < 0.05; **: p < 0.01). (A) Neutrophil percentage change in perfusate (ANOVA p value = 0.14) and lung tissue (ANOVA p value = 0.21). (B) Eosinophil percentage change in perfusate (ANOVA p value = 0.05) and lung tissue (ANOVA p value < 0.01). (C) Classocal monocyte percentage change in perfusate (ANOVA p value < 0.01) and lung tissue (ANOVA p value = 0.10). (D) Intermediate monocyte percentage change in perfusate (ANOVA p value < 0.01) and lung tissue (ANOVA p value = 0.29). (E) Non‐classical monocyte percentage change in perfusate (ANOVA p value = 0.51) and lung tissue (ANOVA p value = 0.48)
Among monocyte subsets, perfusate classical and intermediate monocytes frequency decreased (−77.8 ± 9.9% and −94.1 ± 5.1%, respectively) at the 1st hour, and remained decreased throughout duration of EVLP in the perfusate, with no change in non‐classical monocytes frequency (Figure 3). Meanwhile, while there was no significant change in tissue monocytes throughout duration of perfusion, tissue classical monocyte frequency increased at 6th hour of perfusion (+58.9 ± 39.9%) and tissue nonclassical monocyte frequency decreased at 6th hour of perfusion (−51.8 ±2 3.6%).
Among cells of lymphoid lineage, perfusate NK cell frequency decreased (−61.5 ± 22.6%) with no significant change in tissue NK cells throughout the entire duration of perfusion (Figure 4). The decrease in perfusate NK cell was no longer significant at the 6th hour of perfusion, comparable to baseline frequency. There was no significant change in cell frequencies of perfusate or tissue NK T cells, T cells and B cells throughout 6 h of EVLP.
FIGURE 4.
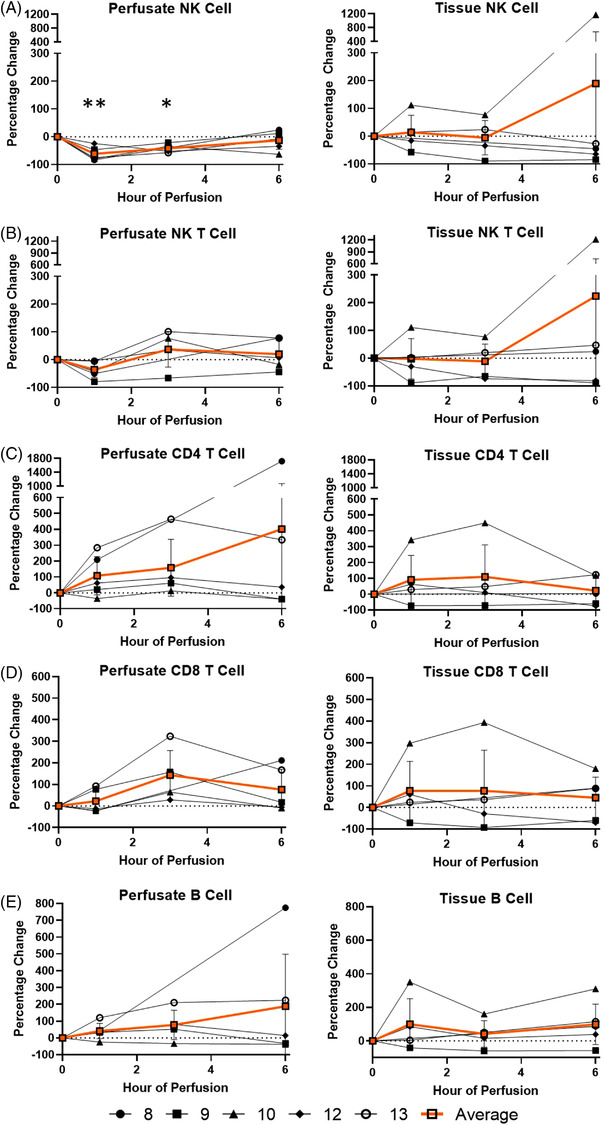
Percentage change of each lymphoid immune cell frequency during perfusion. A percentage change of 0% suggests there is no change in the innate immune cell frequency from time point 0th hour. Average values of percentage changes (orange line) as well as standard deviations were calculated (vertical bar). A two‐sided, paired t test was performed to compare percentages of each time point to those at time 0 h. (*: p < 0.05; **: p < 0.01). (A) NK cell percentage change in perfusate (ANOVA p value < 0.01) and lung tissue (ANOVA p value = 0.70). (B) NK T cell percentage change in perfusate (ANOVA p value = 0.30) and lung tissue (ANOVA p value = 0.58). (C) CD4 T cell percentage change in perfusate (ANOVA p value = 0.47) and lung tissue (ANOVA p value = 0.63). (D) CD8 T cell percentage change in perfusate (ANOVA p value = 0.10) and lung tissue (ANOVA p value = 0.81). (E) B cell percentage change in perfusate (ANOVA p value = 0.44) and lung tissue (ANOVA p value = 0.51)
CD3+CD4+FoxP3+ regulatory T cells (Treg) were quantified in the tissue by immunohistochemistry (Figure 5A). There was no significant T reg cell frequency difference between that of baseline and end of perfusion (18.9±17.1% versus 16.4±14.2%, n = 5, Figure 5B).
FIGURE 5.
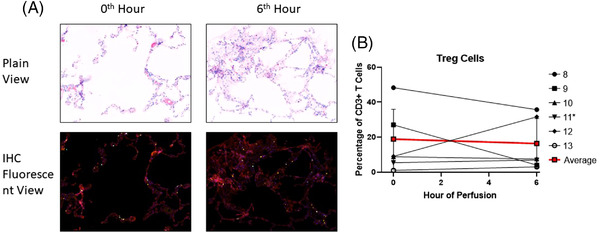
Identification of Treg cells using immunohistochemistry (ROI: 931 um × 698 um). (A) Representative immunohistochemistry histology. DAPI‐ Blue; CD3‐ Cyan; CD4‐Yellow; FoxP3‐Red. (Taken from Lung 8). (B) Tissue regulatory T cell percentages prior to (0 h) and following EVLP (6 h). *Lung 11 was excluded from calculation of average values
Percentage changes of all cell lineages in lung 11, which was excluded from statistical analysis due to pulmonary artery pressure persistently > 40 mm Hg with histology consistent with chronic intra‐alveolar hemorrhage, can be found in supplemental figures (Supplemental Figures 4 and 5).
3.3. EVLP upregulates inflammatory cytokines
Pro‐inflammatory cytokines IL‐1b, G‐CSF, IFN‐gamma, CXCL2, CXCL1 granzyme A and granzyme B significantly increased by 6th hour of perfusion compared to their levels in cold storage. Likewise, lymphocyte activating cytokines (IL‐2, IL‐4, IL‐6, IL‐8) significantly increased during perfusion (Table 2). IL‐10, an immunosuppressive cytokine that inhibits numerous T‐cell and antigen‐presenting cell functions, 21 increased by ten‐thousand‐fold at 6th hour of EVLP compared to cold storage baseline, almost reaching statistical significance. However, IFN‐gamma, an inflammatory cytokine produced by cells of lymphoid lineages including as T cells and NK T cells, 22 remained less than 1 ng/ml at the 6th hour of perfusion.
TABLE 2.
Cytokine concentrations (pg/ml) in perfusates during 6 h of EVLP. Data are presented as mean ± standard deviation
| 0th hour of EVLP concentration (pg/ml) | 1st hour of EVLP concentration (pg/ml) | 1st hour vs 0th hour p‐ value | 3rd hour of EVLP concentration (pg/ml) | 3rd hour vs 0th hour p‐value | 3rd hour vs 1st hour p‐ value | 6th hour of EVLP concentration (pg/ml) | 6th hour vs 0th hour p‐value | 6th hour vs 1st hour p‐value | ANOVA p‐value | |
|---|---|---|---|---|---|---|---|---|---|---|
| IL‐1b | 0.63 ± 0.89 | 1.79 ± 2.71 | 0.381 | 6.83 ± 5.01 | 0.025 | 0.087 | 47.73 ± 44.41 | 0.039 | 0.044 | 0.012 |
| IL‐2 | 0.43 ± 0.15 | 1.01 ± 0.66 | 0.083 | 2.20 ± 0.73 | 0.001 | 0.031 | 3.38 ± 1.70 | 0.003 | 0.016 | 0.001 |
| IL‐4 | 1.29 ± 0.33 | 3.34 ± 2.05 | 0.051 | 7.52 ± 1.56 | 0.000 | 0.008 | 7.18 ± 1.27 | 0.000 | 0.005 | 0.000 |
| IL‐6 | 133.81 ± 141.80 | 14138.66 ± 21148.50 | 0.169 | 58641.39 ± 7374.58 | 0.000 | 0.003 | 45410.17 ± 17766.11 | 0.000 | 0.030 | 0.000 |
| IL‐8 (CXCL8) | 43.81 ± 39.11 | 2562.27 ± 2390.50 | 0.040 | 8140.12 ± 4844.56 | 0.005 | 0.051 | 4585.73 ± 3013.34 | 0.007 | 0.267 | 0.005 |
| IL‐10 | 0.31 ± 0.25 | 134.31 ± 116.23 | 0.028 | 689.84 ± 565.39 | 0.024 | 0.063 | 3093.96 ± 3598.25 | 0.083 | 0.096 | 0.058 |
| IL‐17 (CTLA‐8) | 0.10 ± 0.07 | 0.31 ± 0.20 | 0.052 | 0.70 ± 0.35 | 0.005 | 0.071 | 1.25 ± 1.35 | 0.085 | 0.153 | 0.093 |
| G‐CSF(CSF‐3) | 18.17 ± 6.81 | 56.00 ± 71.90 | 0.269 | 1654.91 ± 1355.45 | 0.025 | 0.028 | 10846.32 ± 6593.90 | 0.004 | 0.004 | 0.000 |
| IFN‐gamma | 0.03 ± 0.05 | 0.24 ± 0.24 | 0.091 | 0.37 ± 0.16 | 0.002 | 0.367 | 0.35 ± 0.21 | 0.009 | 0.454 | 0.037 |
| GM‐CSF | 0.56 ± 0.67 | 2.51 ± 1.68 | 0.036 | 8.71 ± 5.86 | 0.014 | 0.052 | 20.51 ± 25.47 | 0.110 | 0.146 | 0.115 |
| TNF‐alpha | 0.33 ± 0.22 | 263.55 ± 337.25 | 0.112 | 504.82 ± 846.20 | 0.219 | 0.577 | 1561.36 ± 2631.16 | 0.214 | 0.300 | 0.349 |
| MCP‐1 (CCL2) | 564.95 ± 569.53 | 1197.03 ± 677.88 | 0.141 | 1710.44 ± 547.66 | 0.014 | 0.249 | 1225.90 ± 486.31 | 0.077 | 0.940 | 0.054 |
| MIP‐2a (CXCL2) | 10.13 ± 8.60 | 1066.65 ± 1036.97 | 0.046 | 3116.81 ± 877.28 | 0.000 | 0.011 | 3026.05 ± 674.26 | 0.000 | 0.005 | 0.000 |
| CXCL1 | 3.72 ± 2.14 | 206.44 ± 173.12 | 0.026 | 694.96 ± 322.13 | 0.001 | 0.018 | 631.61 ± 288.32 | 0.001 | 0.018 | 0.000 |
| Granzyme A | 7.31 ± 4.19 | 26.34 ± 15.07 | 0.022 | 37.18 ± 13.83 | 0.001 | 0.294 | 45.94 ± 15.27 | 0.000 | 0.068 | 0.001 |
| Granzyme B | 0.68 ± 0.17 | 3.20 ± 2.02 | 0.020 | 5.87 ± 2.25 | 0.001 | 0.093 | 17.98 ± 11.11 | 0.006 | 0.015 | 0.001 |
4. DISCUSSION
EVLP is now being increasingly used in human lung transplantation. 23 , 24 , 25 , 26 However, little is known about the effects of EVLP on immune cell composition and migration. During transplantation, the bidirectional migration of donor and recipient leukocytes may contribute to donor‐specific tolerance 14 or graft‐versus‐host stimulation. 15 , 16 Previous studies have suggested that using a leukocyte filter during EVLP may modulate the immune cell profile of an allograft, leading to a lung graft with less immunogenicity compared one maintained on cold storage. 17 Our study characterized the temporal change of donor leukocyte composition in both perfusate and lung parenchyma compartments associated with EVLP itself. This may have important clinical implications since modulating graft immunogenicity and altering donor passenger leukocyte composition prior to implant could improve graft survival by decreasing primary graft dysfunction and ischemia‐reperfusion injury. 27 , 28 , 29
Activation of the innate immune system within the donor allografts occurred early during EVLP, with simultaneous increase in perfusate neutrophils, decrease in tissue neutrophils and 150–300‐fold increase of neutrophil activating cytokines (CXCL2 and CXCL1) at 1st hour of perfusion. This may be due to exposure of circulating blood cells to the non‐endothelialized surfaces of the perfusion circuit 30 or ischemia‐reperfusion injury, where reactive oxygen species direct migration of activated neutrophils into the reperfused tissue. 31 , 32 However, these alterations in neutrophil populations appeared to be short‐lived since neutrophil frequencies in both perfusate and tissue compartments were no longer different than baseline by the 3rd hour of perfusion. This early mobilization of innate immune cells during EVLP may provide a therapeutic window to impact immunogenicity, rejection, or primary graft dysfunction prior to transplantation.
Our data also suggests that EVLP may modulate donor lung monocytes. We found that frequencies of total perfusate monocytes decreased throughout duration of EVLP. These findings contrast with Stone et al. who demonstrated rapid increase in perfusate monocytes at EVLP onset with abundant non‐classical monocytes attached to the leukocyte filter at end of EVLP, suggesting EVLP may remove passenger non‐classical monocytes. 17 These disparate results may be due to differences in study design. Our perfusion design did not use leukocyte filters since we wanted to investigate the intrinsic immune‐modulating effect of normothermic ex vivo perfusion without mechanical removal of leukocytes. In addition, there may be differences due to donor lung quality since our study utilized lungs from donors declined for transplantation. Despite the decrease in total perfusate monocytes in our study, the percentage of total tissue monocytes remained unchanged (tissue monocytes were not measured by Stone et al. 17 ). This suggests that perfusate monocytes did not necessarily reflect tissue monocytes, and more focus should perhaps be placed on the effect of tissue monocytes on graft function, which remain within the graft at time of transplantation, versus perfusate monocytes, which are discarded. Marginated monocytes adhere to intravascular endothelium of donor lung due to inflammation within moribund donors, with upregulated expression of leukocyte adhesion molecules. 16 Retained donor pulmonary intravascular nonclassical monocytes initiate recipient neutrophil recruitment to donor graft following transplantation, playing a central role in development of acute lung injury. 33 , 34 Furthermore, pre‐implantation classical donor monocyte numbers have been correlated with post‐implantation lung dysfunction at 48 and 72 h. 35 Thus, EVLP may provide a platform for therapies targeting retained tissue monocytes and tissue sampling in an attempt to mitigate lung ischemia reperfusion injury.
Our study did not demonstrate significant change of lymphocyte frequency in both the perfusate and tissue compartments, and there was no change in tissue T cell subsets (CD4 T cell, CD8 T cell, and regulatory T cell) following 6 h of EVLP. However, activation and inactivation of various lymphocyte‐associated molecular signaling pathways occurred during EVLP, most notably involving increased in IL‐6 and IL‐8. While we were unable to detect changes in the cellular composition of lymphoid cells throughout EVLP, assessing changes in lymphocyte functionality may be an important avenue for future work.
In our study, we did not exchange or add any replacement perfusate throughout EVLP, which mimics current practice with clinical portable perfusion devices. A prior study by Sadaria et al. established cytokine expression profile in human lungs undergoing normothermic EVLP; however, 100 ml of STEEN solution was exchanged every 2 h throughout perfusion. 36 Given that our perfusion circuit did not have a clearance mechanism, the increase in cytokine concentrations may represent cytokine accumulation. Similar to study by Sadaria et al., we identified incremental increases in pro‐inflammatory cytokines including G‐CSF as well as lymphocyte activating cytokines including IL‐6 and IL‐8 throughout perfusion. 36
There are limitations to our study. We chose to demonstrate our data with cell frequency rather than absolute amounts. This allows comparison between time points and is compatible with flow for detailed cell phenotype data. Cell frequency also allows better reproducibility of results across experiments. 37 All lungs in our study did not meet standard lung transplant donor criteria prior to perfusion and are likely to reflect “high risk” donor lungs that may be rehabilitated by EVLP in the future. 38 Despite varying levels of pre‐perfusion leukocyte composition (e.g., more tissue eosinophils in the lung affected by asthma and more tissue neutrophils in the lung affected by lymphadenopathy), we were able to demonstrate consistent trends in changes to perfusate monocytes, NK cells and neutrophils and tissue neutrophils among five lungs using serial sampling. To generalize our findings to the donor population, future work will characterize perfusate and immune compartments in clinical EVLP. Future studies will also correlate immune cell composition of the airway compartment by analyzing concurrent bronchoalveolar lavage samples.
In conclusion, our study provides a blueprint for lung immune cell profile modulation throughout 6 h of EVLP. This is important because the ability to alter the donor leukocyte profile within lung allografts may be an avenue to improve clinical outcomes following transplantation. Future work will focus on assessing the functionality of donor passenger leukocytes, the potential of novel therapeutics to enhance cell migration and the clinical implications of the altered immune cell profile of donor lung grafts maintained on EVLP.
CONFLICT OF INTEREST STATEMENT
The authors have no conflict of interest.
AUTHOR CONTRIBUTIONS
Andy Chao Hsuan Lee, MD: Study design, data acquisition, data analysis, writing of manuscript. Arianna Edobor, BS: data acquisition, writing of manuscript. Thirushan Wigakumar: data acquisition, writing of manuscript. Maria Lysandrou: data acquisition, writing of manuscript. Laura K. Johnston, PhD: data anlysis, writing of manuscript. Phillip McMullen, MD: data acquisition, data analysis, writing of manuscript. Vikranth Mirle, BS: data acquisition, writing of manuscript. Ashley Diaz, BS: data acquisition, writing of manuscript. Ryan Piech, MS/MBA: data acquisition. Rebecca Rose, AS: data acquisition. Martin Jendrisak, MD: data acquisition. Diego di Sabato, MD: Acquisition of funding, study design, supervision, manuscript revision Kumaran Shanmugarajah, MD/PhD: Acquisition of funding, study design, supervision, manuscript revision. John Fung, MD/PhD: Acquisition of funding, study design, supervision, manuscript revision. Jessica Donington, MD: Acquisition of funding, study design, supervision, manuscript revision. Maria Lucia Madariaga, MD: Acquisition of funding, study design, supervision, manuscript revision.
Supporting information
Supporting information.
ACKNOWLEDGEMENTS
We thank the Gift of Hope Organ and Tissue Donor Network as well as Human Tissue Resource Center, Human Immunologic Monitoring Core Facility, and Cytometry and Antibody Technology Core Facility at the University of Chicago for their assistance in completion of this study.
Lee ACH, Edobor A, Wigakumar T, et al. Donor leukocyte trafficking during human ex vivo lung perfusion. Clin Transplant. 2022;36:e14670. 10.1111/ctr.14670
DATA AVAILABILITY STATEMENT
The data that support the findings of this study are available from the corresponding author, MLM, upon reasonable request.
REFERENCES
- 1. van Suylen V, Luijk B, Hoek RAS, et al. a multicenter study on long‐term outcomes after lung transplantation comparing donation after circulatory death and donation after brain death. Am J Transplant. 2017;17(10):2679–2686. [DOI] [PubMed] [Google Scholar]
- 2. Chambers DC, Yusen RD, Cherikh WS, et al. The registry of the international society for heart and lung transplantation: thirty‐fourth adult lung and heart‐lung transplantation report‐2017; focus theme: allograft ischemic time. J Heart Lung Transplant. 2017;36(10):1047–1059. [DOI] [PubMed] [Google Scholar]
- 3. Maxwell BG, Levitt JE, Goldstein BA, et al. Impact of the lung allocation score on survival beyond 1 year. Am J Transplant. 2014;14(10):2288–2294. [DOI] [PMC free article] [PubMed] [Google Scholar]
- 4. Cypel M, Liu M, Rubacha M, et al. Functional repair of human donor lungs by IL‐10 gene therapy. Sci Transl Med. 2009;1(4):4ra9. [DOI] [PubMed] [Google Scholar]
- 5. Nakajima D, Chen F, Yamada T, et al. Reconditioning of lungs donated after circulatory death with normothermic ex vivo lung perfusion. J Heart Lung Transplant. 2012;31(2):187–193. [DOI] [PubMed] [Google Scholar]
- 6. Kakishita T, Oto T, Hori S, et al. Suppression of inflammatory cytokines during ex vivo lung perfusion with an adsorbent membrane. Ann Thorac Surg. 2010;89(6):1773–1779. [DOI] [PubMed] [Google Scholar]
- 7. McAuley DF, Curley GF, Hamid UI, et al. Clinical grade allogeneic human mesenchymal stem cells restore alveolar fluid clearance in human lungs rejected for transplantation. Am J Physiol Lung Cell Mol Physiol. 2014;306(9):L809–L815. [DOI] [PMC free article] [PubMed] [Google Scholar]
- 8. Nathan SD. The future of lung transplantation. Chest. 2015;147:309–316. [DOI] [PubMed] [Google Scholar]
- 9. Yeung JC, Wagnetz D, Cypel M, et al. Ex vivo adenoviral vector gene delivery results in decreased vector‐associated inflammation pre‐ and post‐lung transplantation in the pig. Mol Ther. 2012;20(6):1204–1211. [DOI] [PMC free article] [PubMed] [Google Scholar]
- 10. Motoyama H, Chen F, Hijiya K, et al. Plasmin administration during ex vivo lung perfusion ameliorates lung ischemia‐reperfusion injury. J Heart Lung Transplant. 2014;33(10):1093–1099. [DOI] [PubMed] [Google Scholar]
- 11. Galasso M, Feld JJ, Watanabe Y, et al. Inactivating hepatitis C virus in donor lungs using light therapies during normothermic ex vivo lung perfusion. Nat Commun. 2019;10(1):481. [DOI] [PMC free article] [PubMed] [Google Scholar]
- 12. Martens A, Boada M, Vanaudenaerde BM, et al. Steroids can reduce warm ischemic reperfusion injury in a porcine donation after circulatory death model with ex vivo lung perfusion evaluation. Transpl Int. 2016;29(11):1237–1246. [DOI] [PubMed] [Google Scholar]
- 13. Nakajima D, Cypel M, Bonato R, et al. Ex vivo perfusion treatment of infection in human donor lungs. Am J Transplant. 2016;16(4):1229–1237. [DOI] [PubMed] [Google Scholar]
- 14. Rao AS, Thomson AW, Shapiro R, Starzl TE. Chimerism after whole organ transplantation: its relationship to graft rejection and tolerance induction. Curr Opin Nephrol Hypertens. 1994;3(6):589–595. [DOI] [PubMed] [Google Scholar]
- 15. Paantjens AW, van de Graaf EA, Heerkens HD, et al. Chimerism of dendritic cell subsets in peripheral blood after lung transplantation. J Heart Lung Transplant. 2011;30(6):691–697. [DOI] [PubMed] [Google Scholar]
- 16. Richter N, Raddatz G, Steinhoff G, Schäfers HJ, Schlitt HJ. Transmission of donor lymphocytes in clinical lung transplantation. Transpl Int. 1994;7(6):414–419. [PubMed] [Google Scholar]
- 17. Stone JP, Sevenoaks H, Sjöberg T, Steen S, Yonan N, Fildes JE. Mechanical removal of dendritic cell‐generating non‐classical monocytes via ex vivo lung perfusion. J Heart Lung Transplant. 2014;33(8):864–869. [DOI] [PubMed] [Google Scholar]
- 18. Davis RP, Yerxa J, Gao Q, et al. Donor leukocyte trafficking and damage‐associated molecular pattern expression during ex vivo lung perfusion. Transplant Direct. 2020;6(3):e532. [DOI] [PMC free article] [PubMed] [Google Scholar]
- 19. Machuca TN, Cypel M. Ex vivo lung perfusion. J Thorac Dis. 2014;6(8):1054–1062 [DOI] [PMC free article] [PubMed] [Google Scholar]
- 20. Ross JT, Nesseler N, Lee JW, Ware LB, Matthay MA. The ex vivo human lung: research value for translational science. JCI Insight. 2019;4(11):e128833. [DOI] [PMC free article] [PubMed] [Google Scholar]
- 21. Bromberg JS. IL‐10 immunosuppression in transplantation. Curr Opin Immunol. 1995;7(5):639–643. [DOI] [PubMed] [Google Scholar]
- 22. Wang L, Zhu J, Shan S, et al. Repression of interferon‐gamma expression in T cells by Prospero‐related homeobox protein. Cell Res. 2008;18(9):911–920. [DOI] [PubMed] [Google Scholar]
- 23. Sanchez PG, Davis RD, D'Ovidio F, et al. The NOVEL lung trial one‐year outcomes. J Heart Lung Transplant 2014;33:S71–S72. [Google Scholar]
- 24. Warnecke G, Van Raemdonck D, Smith MA, et al. Normothermic ex‐vivo preservation with the portable Organ Care System Lung device for bilateral lung transplantation (INSPIRE): a randomised, open‐label, non‐inferiority, phase 3 study. Lancet Respir Med. 2018;6(5):357–367. [DOI] [PubMed] [Google Scholar]
- 25. Loor G, Warnecke G, Villavicencio MA, et al. Portable normothermic ex‐vivo lung perfusion, ventilation, and functional assessment with the Organ Care System on donor lung use for transplantation from extended‐criteria donors (EXPAND): a single‐arm, pivotal trial. Lancet Respir Med. 2019;7(11):975–984. [DOI] [PubMed] [Google Scholar]
- 26. Fisher A, Andreasson A, Chrysos A, et al. An observational study of Donor Ex Vivo Lung Perfusion in UK lung transplantation: DEVELOP‐UK. Health Technol Assess. 2016;20(85):1–276. [DOI] [PMC free article] [PubMed] [Google Scholar]
- 27. Monticelli LA, Diamond JM, Saenz SA, et al. Lung innate lymphoid cell composition is altered in primary graft dysfunction. Am J Respir Crit Care Med. 2020;201(1):63–72. [DOI] [PMC free article] [PubMed] [Google Scholar]
- 28. Sayah DM, Mallavia B, Liu F, et al. Neutrophil extracellular traps are pathogenic in primary graft dysfunction after lung transplantation. Am J Respir Crit Care Med. 2015;191(4):455–463. [DOI] [PMC free article] [PubMed] [Google Scholar]
- 29. Shah RJ, Diamond JM, Lederer DJ, et al. Plasma monocyte chemotactic protein‐1 levels at 24 h are a biomarker of primary graft dysfunction after lung transplantation. Transl Res. 2012;160(6):435–442. [DOI] [PMC free article] [PubMed] [Google Scholar]
- 30. Millar JE, Fanning JP, McDonald CI, McAuley DF, Fraser JF. The inflammatory response to extracorporeal membrane oxygenation (ECMO): a review of the pathophysiology. Crit Care. 2016;20(1):387. [DOI] [PMC free article] [PubMed] [Google Scholar]
- 31. Ferrari RS, Andrade CF. Oxidative stress and lung ischemia‐reperfusion injury. Oxid Med Cell Longev. 2015;2015:590987. [DOI] [PMC free article] [PubMed] [Google Scholar]
- 32. Repine JE, Cheronis JC, Rodell TC, Linas SL, Ptt A. Pulmonary oxygen toxicity and ischemia‐reperfusion injury. A mechanism in common involving xanthine oxidase and neutrophils. Am Rev Respir Dis. 1987;136(2):483–485. [DOI] [PubMed] [Google Scholar]
- 33. Zheng Z, Chiu S, Akbarpour M, et al. Donor pulmonary intravascular nonclassical monocytes recruit recipient neutrophils and mediate primary lung allograft dysfunction. Sci Transl Med. 2017;9(394):eaal4508. [DOI] [PMC free article] [PubMed] [Google Scholar]
- 34. Kurihara C, Lecuona E, Wu Q, et al. Crosstalk between nonclassical monocytes and alveolar macrophages mediates transplant ischemia‐reperfusion injury through classical monocyte recruitment. JCI Insight. 2021;6(6):e147282. [DOI] [PMC free article] [PubMed] [Google Scholar]
- 35. Tatham KC, O'Dea KP, Romano R, et al. Intravascular donor monocytes play a central role in lung transplant ischaemia‐reperfusion injury. Thorax. 2018;73(4):350–360. [DOI] [PMC free article] [PubMed] [Google Scholar]
- 36. Sadaria MR, Smith PD, Fullerton DA, et al. Cytokine expression profile in human lungs undergoing normothermic ex‐vivo lung perfusion. Ann Thorac Surg. 2011;92(2):478–484. [DOI] [PubMed] [Google Scholar]
- 37. Tighe RM, Redente EF, Yu YR, et al. Improving the quality and reproducibility of flow cytometry in the lung. an official american thoracic society workshop report. Am J Respir Cell Mol Biol. 2019;61(2):150–161. [DOI] [PMC free article] [PubMed] [Google Scholar]
- 38. Tian D, Wang Y, Shiiya H, et al. Outcomes of marginal donors for lung transplantation after ex vivo lung perfusion: a systematic review and meta‐analysis. J Thorac Cardiovasc Surg. 2020;159(2):720–730.e6. [DOI] [PubMed] [Google Scholar]
Associated Data
This section collects any data citations, data availability statements, or supplementary materials included in this article.
Supplementary Materials
Supporting information.
Data Availability Statement
The data that support the findings of this study are available from the corresponding author, MLM, upon reasonable request.