

Abstract
Background
Obesity is a heritable complex phenotype that can increase the risk of age‐related outcomes. Biological age can be estimated from DNA methylation (DNAm) using various “epigenetic clocks.” Previous work suggests individuals with elevated weight also display accelerated aging, but results vary by epigenetic clock and population. Here, we utilize the new epigenetic clock GrimAge, which closely correlates with mortality.
Objectives
We aimed to assess the cross‐sectional association of body mass index (BMI) with age acceleration in twins to limit confounding by genetics and shared environment.
Methods and results
Participants were from the Finnish Twin Cohort (FTC; n = 1424), including monozygotic (MZ) and dizygotic (DZ) twin pairs, and DNAm was measured using the Illumina 450K array. Multivariate linear mixed effects models including MZ and DZ twins showed an accelerated epigenetic age of 1.02 months (p‐value = 6.1 × 10⁻¹²) per one‐unit BMI increase. Additionally, heavier twins in a BMI‐discordant MZ twin pair (ΔBMI >3 kg/m2) had an epigenetic age 5.2 months older than their lighter cotwin (p‐value = 0.0074). We also found a positive association between log (homeostatic model assessment of insulin resistance) and age acceleration, confirmed by a meta‐analysis of the FTC and two other Finnish cohorts (overall effect = 0.45 years, p‐value = 4.1 × 10⁻²⁵) from adjusted models.
Conclusion
We identified significant associations of BMI and insulin resistance with age acceleration based on GrimAge, which were not due to genetic effects on BMI and aging. Overall, these results support a role of BMI in aging, potentially in part due to the effects of insulin resistance.
Keywords: aging, BMI, epigenetic clock, GrimAge, HOMA‐IR, obesity

Introduction
Obesity is a global public health concern, which continues to increase in prevalence worldwide [1]. It contributes to numerous adverse health outcomes, including cardiovascular disease [2], diabetes [3], and cancers [4, 5], all of which are considered diseases of aging. It is possible to estimate an individual's age from DNA methylation (DNAm) at selected genomic sites using algorithms known as “epigenetic clocks.” These include the original Horvath clock [6], HannumAge [7], and PhenoAge [8], as well as the newer GrimAge [9], which is more predictive of mortality than previous epigenetic clocks and thus may be a more appropriate measure of biological age. The difference between the predicted epigenetic age and chronological age is referred to as “age acceleration,” a phenomenon that occurs in the context of many diseases such as cancers [6, 10, 11]. Additionally, associations of age acceleration with high body mass index (BMI) and obesity have been reported in some [12, 13, 14, 15]—but not all [16, 17]—studies when epigenetic aging is measured in blood. Two recent studies have identified associations between age acceleration based on GrimAge with BMI as well as associated clinical measures, such as triglycerides [18, 19]. Therefore, excess body mass may play a role in the heightened risk of conditions experienced in obesity, including cancers and cardiovascular disease.
However, genotype is another important influence on both body composition and the epigenome [20,21], which introduces the possibility of genetic confounding in the assessment of the association between BMI and epigenetic aging. A monozygotic (MZ) cotwin control study design controls for genotype as well as sex and a variety of environmental exposures and experiences shared by MZ twin siblings. Here, we assessed the cross‐sectional association of BMI with epigenetic age acceleration determined using the GrimAge clock in twins participating in the Finnish Twin Cohort (FTC), and two independent Finnish cohorts. We chose to focus on the GrimAge clock due to its stronger relevance to mortality [22, 23], as well as the recent studies showing its association with BMI [19, 24, 25]. To assess genetic confounding, we compared within‐pair analyses including dizygotic (DZ) twin pairs and those limited to MZ twin pairs.
Materials and methods
Participants and study design
Study participants were MZ and DZ twin pairs participating in the FTC, comprised of three longitudinal cohorts. The Older Twin Cohort consists of same‐sex twin pairs born before 1958 [26], while FinnTwin12 and FinnTwin16 are longitudinal studies of five consecutive birth cohorts of Finnish twins born during 1975–1979 and 1983–1987 [27, 28], respectively; the two latter studies include opposite‐sex twin pairs. Participants completed multiple surveys on behavioral and lifestyle traits as well as anthropometric measurements. Participants were selected for the current analysis if they had available data for blood DNAm, sex, zygosity, and concurrent height, weight, and age values, resulting in 1447 participants. MZ, same‐sex DZ, and opposite‐sex DZ twin pairs were included. A subset of MZ twin pairs participated in the TwinFat subcohort [29, 30] (n = 90 pairs), in which more detailed information on body composition and markers of cardiometabolic health including fat percentage, subcutaneous fat, intra‐abdominal fat, liver fat percentage, and fasting total, low density lipoprotein (LDL), and high density lipoprotein (HDL) cholesterol, triglycerides, C‐reactive protein (CRP), leptin, adiponectin, glucose, and insulin as well as the homeostatic model assessment of insulin resistance (HOMA‐IR) was available. All participants gave informed consent for their participation, and the study procedures were approved by the ethics committees of Helsinki University Central Hospital (113/E3/2001, 249/E5/2001, 346/E0/05, 270/13/03/01/2008, and 154/13/03/00/2011).
Collection of biospecimens and DNAm measurement
Twins provided blood samples as part of targeted studies [26–28]. As described previously, DNA was extracted from whole blood using the QIAamp DNA Mini kit (QIAGEN Nordic, Sollentuna, Sweden), and bisulfite conversion was performed with the EZ‐96 DNA Methylation‐Gold Kit (Zymo Research, Irvine, CA, USA) as per manufacturer instructions. We used the Illumina Infinium HumanMethylation450 BeadChip to measure DNAmethylation at more than 480,000 CpG sites throughout the genome [31]. Samples from twin pairs were converted on the same plate in order to reduce batch effects due to technical variation.
Quality control and preprocessing of DNAm data
Sample processing was completed in R version 3.6.0. Samples with poor quality were identified using the R package MethylAid with default thresholds [32]; those with a median methylated and unmethylated log2 intensity smaller than 10.5, an average log2 intensity of green and red channels’ expected signals of nonpolymorphic controls smaller than 11.75, an average log2 intensity of converted bisulfite type I controls in green and red channels smaller than 12.75, an average log2 intensity of high and low hybridization controls (green channel) smaller than 13.25, or with less than 95% of probes with a detection p‐value <0.05 were excluded. Next, we normalized the DNAmethylation data using minfi [33]. Removing bad quality samples resulted in a sample size of 1424. We performed functional normalization including the first two principal components of the control probes with noob background correction in order to reduce technical variation in the data [34]. We removed probes with a detection p‐value >0.01, an intensity value of exactly 0, or a bead count greater than 3 in more than 5% of samples. Beta‐mixture quantile normalization was used to adjust beta values for differences due to probe type [35] using the R package wateRmelon [36]. We additionally removed probes on sex chromosomes, and those identified as unreliable such as due to cross reactivity [37].
Epigenetic age calculation
In this study, we used the newly developed epigenetic clock GrimAge developed by the Horvath group [9], which is a DNAmethylation‐based biomarker of mortality. The GrimAge value is calculated in a two‐step process, first estimating seven plasma proteins including adrenomedullin, beta‐2 microglobulin, cystatin, growth differentiation factor 15, leptin, plasminogen activation inhibitor 1, and tissue inhibitor metalloproteinase 1, as well as pack‐years, from DNAmethylation data, then using these estimates in combination with age and sex in a model developed from penalized Cox proportional hazards regression. The resulting GrimAge estimate is scaled to be in units of years, with a higher GrimAge value corresponding to higher hazard of death.
First, we subset the data to only include probes used in estimating GrimAge. Any required probes with missing beta values were replaced with “gold database” beta values, which are the average beta values from the largest white blood cell DNAmethylation dataset used in the development of the first epigenetic clock by the Horvath group (data available from GEO with accession number GSE41037). Next, we added participant age and sex to the dataset, which are used in the estimation process. A Python script provided by the Horvath group was used to estimate GrimAge, smoking pack‐years, and the seven plasma proteins predicted in the first stage of estimation. Finally, age acceleration was calculated for each participant by regressing GrimAge on chronological age and taking the raw residual. Participants with a negative value of age acceleration have a lower epigenetic age than expected based on their chronological age, whereas those with positive age acceleration values have a higher epigenetic age.
Statistical analysis
We used two approaches to assess the relationship between BMI and age acceleration—(1) treating each twin as an observation and (2) treating twin pairs as observation. For both approaches, we used linear mixed effects models implemented in R version 3.2.2 and the R package Ime4 [38] (version 1.1‐11).
In the first case, we accounted for the dependency within twin pairs by including a random intercept for family ID, and additionally included random intercepts for twin cohort and zygosity. The dependent variable was age acceleration, while the independent variable was either BMI as a continuous measure, BMI as a categorical measure, or one of 14 clinical obesity‐related measures as continuous measures (fat percentage, subcutaneous fat, intra‐abdominal fat, liver fat percentage, and fasting total, LDL, HDL cholesterol, triglycerides, CRP, leptin, adiponectin, glucose, and insulin as well as HOMA‐IR). Clinical variables with non‐normal distributions were transformed using the natural logarithm. Three adjusted versions of the models were performed: (1) adjusting for age, sex, and predicted smoking pack‐years; (2) additionally adjusting for predicted proportions of CD8 T cells, CD4 T cells, natural killer cells, and neutrophils [39]; and (3) in the case of the clinical models, additionally adjusting for BMI. For the within‐pair analyses, intrapair differences in epigenetic age, BMI, and covariates (predicted smoking pack‐years and cell type proportions) were calculated. Linear mixed effects models were performed with the dependent and independent variables being difference in epigenetic age and difference in BMI within a twin pair, respectively, adjusted for age, sex, and differences in predicted smoking pack‐years and in fully adjusted models the same cell type proportions as in previous models, with random intercepts for zygosity and twin cohort. All p‐values resulting from linear mixed effects models were calculated using the likelihood ratio test comparing the full model with the nested model, except for the models with BMI as a categorical variable, in which the p‐values were calculated using the Wald test for each individual BMI category. We considered p‐values <0.05 to be statistically significant.
Additional analyses were performed in R version 3.6.0. In order to validate our results, we next analyzed two independent cohorts, the DIetary, Lifestyle, and Genetic Determinants of Obesity and Metabolic Syndrome (DILGOM, n = 306) study [40] and the Young Finns Study [41] (YFS, n = 1591). DNAmethylation was measured in blood using the Illumina 450K array in DILGOM, while both the 450K and EPIC array were used in the YFS. The quality control procedure described above was used for DILGOM and YFS data. The DILGOM data was preprocessed using the same steps as in FTC data. GrimAge and age acceleration were calculated as described above. We used linear regression to assess the association between BMI or clinical measures and age acceleration, adjusting for age, sex, and predicted smoking pack‐years. We additionally adjusted for predicted proportions of blood cell types, as well as for BMI in the secondary association analyses between the clinical measures and age acceleration, as in the FTC analyses.
We performed a meta‐analysis for BMI and the clinical variables overlapping between studies using the individual‐level results from the FTC, YFS, and DILGOM to obtain the best estimates for the effects of each variable on age acceleration. The R function metagen in the package meta [42] was used to inverse variance fixed and random effects meta‐analyses. The empirical Bayes method was used for estimating the between‐study variance. If no heterogeneity between studies was observed, a fixed‐effect meta‐analysis was performed, while a random‐effect meta‐analysis was performed in the presence of significant heterogeneity between studies. Forest plots were generated using the forest function in the R package metafor.
Heritability analyses for GrimAge acceleration as well as BMI were conducted using the MZ and DZ twin pairs in the FTC using the twinlm function in R package mets [43]. Models were adjusted for age and sex, and included an interaction term for age*sex. Variance components were estimated for additive genetic effects, common environmental effects (i.e., shared experiences and exposures of the twin siblings), and unique environmental effects (unshared experiences and exposures) under the standard assumptions of the classic twin model [44]. Heritability was estimated as the proportion of overall variance accounted for by additive genetic effects. Intraclass correlation coefficients for MZ and DZ twins were estimated with the R package irr as a one‐way model.
Results
Participant characteristics
Participant characteristics for all participants are presented in Table 1. There were a total of 1424 twin individuals from the FTC included in this study, with 790 MZ twins, 445 same‐sex DZ twins, and 189 opposite‐sex DZ twins; additionally, there were nontwin participants from the YFS (n = 1591) and DILGOM (n = 306). In the FTC, age ranged from 21 to 73 years old, with an average age of 34.5 years, while the age ranged from 34 to 49 years in the YFS and 25 to 74 years in DILGOM. A majority of participants were female in all three studies (57.7%, 55.6%, and 52.9%, respectively). The average BMI was lowest in the FTC at 24.7 kg/m2 compared to 26.6 in both the YFS and DILGOM.
Table 1.
The characteristics of study participants from the FTC, the YFS, and the DILGOM (n = 3321). Continuous outcomes are presented in the format of mean ± SD [range] and categorical outcomes are presented in the format of counts (percentage, %). Missing data are indicated as footnotes
| N (%) or mean ± SD [range] | |||
|---|---|---|---|
| Variable | FTC (n = 1424) | YFS (n = 1591) | DILGOM (n = 306) |
| Age | 34.5 ± 17.6 [21–73] | 41.9 ± 5.0 [34 ‐ 49] | 52.1 ± 13.6 [25–74] |
| GrimAge a | 35 ± 14.2 [15.9–75.8] | 40.9 ± 5.8 [27.0–63.2] | 49.6 ± 11.2 [25.9–73.9] |
| Age acceleration a | 0 ± 3.1 [−9 to 17.5] | 0 ± 4.1 [−9.5 to 20.2] | 0 ± 4.2 [−13.4 to 14.1] |
| Sex | |||
| Female | 822 (57.7) | 884 (55.6) | 162 (52.9) |
| Male | 602 (42.3) | 707 (44.4) | 144 (47.1) |
| Zygosity | |||
| Monozygotic | 790 (55.5) | – | – |
| Same–sex dizygotic | 445 (31.2) | – | – |
| Opposite–sex dizygotic | 189 (13.3) | – | – |
| Cohort | |||
| FT12 | 759 (53.3) | – | – |
| FT16 | 268 (18.8) | – | – |
| Old Cohort | 397 (27.9) | – | – |
| BMI | 24.7 ± 4.7 [16.3−51.2] | 26.6 ± 5.0 [16.2−58.5] b | 26.6 ± 4.8 [16.4–48.9] c |
| Underweight | 44 (3.1) | 14 (0.9) | 1 (0.3) |
| Normal weight | 820 (57.6) | 654 (41.1) | 123 (40.2) |
| Overweight | 400 (28.1) | 577 (36.3) | 119 (38.9) |
| Obese | 160 (11.2) | 336 (21.1) | 62 (20.3) |
| Smoking behavior | |||
| Never | 681 (47.8) | 800 (50.3) | 170 (55.6) |
| Former | 294 (20.6) | 372 (23.4) | 64 (20.9) |
| Current | 444 (31.2) | 338 (21.2) | 72 (23.5) |
| Missing | 5 (0.351) | 81 (5.1) | 0 (0) |
| Smoking pack‐years a | −3.7 ± 11.3 [−25.9 to 54.8] | −2.8 ± 12.2 [−26.3 to 46.8] | 4.3 ± 12.3 [−21.5 to 45.3] |
Abbreviations: BMI, body mass index; DILGOM, DIetary, Lifestyle, and Genetic Determinants of Obesity and Metabolic syndrome; FTC, Finnish Twin Cohort; SD, standard deviation; YFS, Young Finns Study.
aInferred from DNA methylation data.
bTen subjects with missing data.
cOne subject with missing data.
Individual analysis
First, we assessed the relation of BMI as a continuous measure with age acceleration with twins as individuals. Each one‐unit increase in BMI corresponded to an increase in age acceleration of 1.02 months (0.08 years, likelihood ratio p‐value = 6.1 × 10⁻¹², Fig. 1a). After adjusting for cell type proportions, the effect of BMI on age acceleration was slightly attenuated, with each one‐unit increase in BMI corresponding to 0.91 months (likelihood ratio p‐value = 9.0 × 10⁻¹¹). BMI was positively associated with age acceleration in both validation populations, with a one‐unit increase in BMI associated with an increase in age acceleration of 1.08 months (0.09 years) in the YFS (p‐value = 2.6 × 10⁻²⁷) and 0.67 months (0.06 years) in DILGOM (p‐value = 0.0050). Performing a meta‐analysis of these estimates revealed no evidence of heterogeneity between studies (p‐value = 0.23), and an overall estimate for the effect of BMI on age acceleration of 0.96 months (0.08 years) per each one‐unit BMI increase (meta‐analysis p‐value = 7.07 × 10–39, Fig. 1b).
Fig. 1.
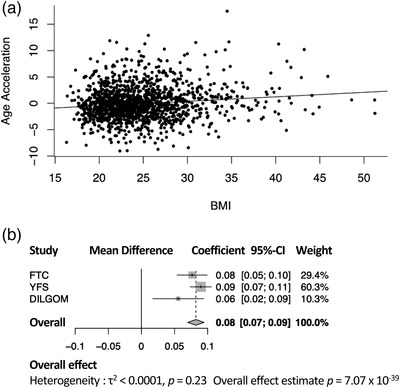
Body mass index (BMI) associates with age acceleration. (a) Scatterplot with best fit line showing the association of age acceleration with BMI in the FTC. (b) Forest plot showing the estimates for the association of BMI with age acceleration in each study, and the overall effect from a fixed effect meta‐analysis. Between‐study variance was determined by empirical Bayes method. The reported estimates are in units of years. DILGOM, DIetary, Lifestyle and Genetic Determinants of Obesity and Metabolic syndrome; FTC, Finnish Twin Cohort; YFS, Young Finns Study.
We observed a linear association of BMI categories with age acceleration; in the FTC, compared to individuals classified as normal weight (18.5 ≤ BMI < 25), the age acceleration of underweight participants (BMI < 18.5) was 6 months lower (β = −0.50 years, p‐value = 0.049), that of overweight participants (25 ≤ BMI < 30) was 4 months higher (0.34 years, p = 0.003), and that of obese participants (BMI ≥30) was 11 months higher (0.91 years, p = 3.15 × 10⁻⁸, Table S1, Fig. S1a) in analyses adjusting for age, sex, predicted smoking pack‐years, blood cell type proportions, and relatedness. Similar associations were also found in the YFS participants, with overweight individuals displaying age acceleration of 5.2 months compared to normal weight individuals (0.43 years, p = 4.5 × 10⁻⁶) and obese individuals showing an age acceleration of 1.07 years (p‐value = 5.55 × 10⁻²², Table S1, Fig. S1a). Obese individuals in the DILGOM cohort also displayed higher age acceleration compared with the normal weight individuals (8.5 months [0.71 years], p = 0.006, Table S1, Fig. S1a). While the age acceleration of underweight individuals did not differ significantly from that of normal weight individuals within the YFS subjects (β = −5.3 months [−0.44 years], p‐value = 0.31), the effect size was comparable to that observed in the FTC. Additionally, performing a meta‐analysis revealed significantly lower age acceleration of 5.9 months in underweight individuals (overall effect −0.49 years, meta‐analysis p‐value = 0.026), and higher age acceleration of 4.32 months in overweight individuals (0.36 years, p = 1.61 × 10⁻⁷) and 11.8 months in obese individuals (0.98 years, p = 1.24 × 10⁻³⁰) compared to normal weight individuals (Table S1, Fig. S1b).
Differences in epigenetic aging within twin pairs
Next, we calculated the differences in BMI and epigenetic age between each twin in a pair, subtracting the lighter twin from the heavier twin. Each one‐unit increase in BMI in the heavier twin was associated with an increase in epigenetic age of 1.6 months compared to their lighter cotwin (likelihood ratio p‐value = 4.7 × 10⁻¹², Fig. 2a). There was no heterogeneity by zygosity, with the estimate for the random effect at 0. We repeated the same analysis including only MZ twin pairs in order to fully control for the effect of genetics, which showed that each one‐unit difference in BMI within the twin pairs was associated with an increase in epigenetic age of 1.1 months (likelihood ratio p‐value = 1.0 × 10⁻⁴, Fig. 2b).
Fig. 2.
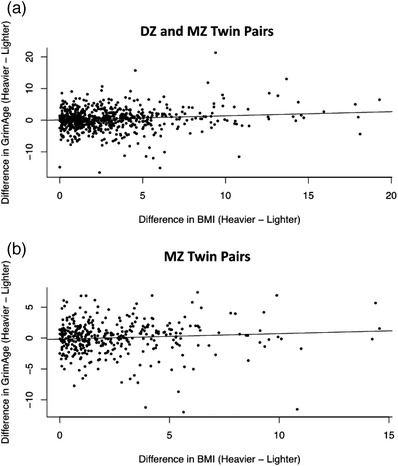
Difference in body mass index (BMI) is related with the difference in GrimAge within twin pairs. (a) Scatterplot showing the association of the difference in BMI within twin pairs in relation with the difference in GrimAge, including both DZ and MZ twin pairs. One twin pair was excluded due to an extreme difference in BMI of greater than 30. (b) Scatterplot showing the association of the difference in BMI within twin pairs in relation with the difference in GrimAge, including only MZ twin pairs. The reported estimates are in units of years. DZ, dizygotic; MZ, monozygotic.
BMI discordance within MZ twin pairs
The average BMI of the lighter twins in BMI‐discordant pairs was 24.9 kg/m2 versus 30.3 kg/m2 for the heavier twins, and their average age was 41.9 years. The heavier twins were less likely to smoke, with 24.8% of heavier twins current smokers, versus 31.6% of lighter twins. Heavier cotwins had higher age acceleration by 5.2 months compared to their leaner cotwin (0.43 years, likelihood ratio p‐value = 0.0066, Fig. S2, Table S2). The average difference in BMI between a discordant pair was around five units, resulting in an effect size per BMI unit of 1.04 months (0.09 years).
Clinical measures and age acceleration
A subset of 90 MZ twins belonging to BMI‐discordant twin pairs were evaluated clinically for obesity‐related measures (Table 2). After adjusting with the estimated blood cell type proportions, only the body fat distribution measures remained associated with age acceleration in the FTC. Each dm3 increase in subcutaneous fat was positively associated with an acceleration in age of 2.02 months (coefficient = 0.17 years, p‐value = 0.031), each log (intra‐abdominal fat dm3) was associated with an increased epigenetic age of 5.63 months (0.47 years, p = 0.028), and a unit increase in log (liver fat percentage) corresponded to increased age acceleration of 3.29 months (0.27 years, p = 0.047). Further adjusting with BMI attenuated all these associations of body fat measures in the FTC. In the meta‐analyses, clinical variables available in all three cohorts (HOMA‐IR index and fasting insulin, glucose, HDL cholesterol, and triglycerides) were significantly associated with age acceleration both before and after adjusting for BMI (Tables 2, 3, 4, Fig. 3). There was no evidence of heterogeneity between studies for any other clinical variable but for glucose (Fig. 3). Additionally, CRP (only available in FTC and YFS) was positively associated with age acceleration in YFS participants, both before and after adjusting for BMI (Table 4), but was only significantly associated with age acceleration in FTC participants in the model not adjusting for cell types or BMI (Table 2). This association was significant in the meta‐analysis for the models both before and after adjusting for BMI (coefficient = 0.37 years, meta‐analysis p‐value = 1.8 × 10⁻²⁸, and 0.25 years, 6.21 × 10⁻¹¹, respectively, Fig. S3).
Table 2.
Obesity‐related clinical measures associate with age acceleration in FTC (n = 90). The median and range of each clinical measure is indicated for twins from body mass index (BMI)‐discordant monozygotic twin pairs in the FTC. Results for the effect of each measure on GrimAge acceleration from each of three mixed‐effects linear models are presented; Model 1 adjusted for age, sex, and predicted smoking pack‐years, Model 2 further adjusted for predicted proportions of CD8 T cells, CD4 T cells, natural killer cells, and neutrophils, and Model 3 additionally adjusted for BMI
| Variable | Median (range) a | Coefficient b | p‐value b | Coefficient c | p‐value c | Coefficient d | p‐value d |
|---|---|---|---|---|---|---|---|
| Body fat (per 10%) | 33.60 (7.10–56.30) | 0.51 | 0.012 | 0.34 | 0.069 | 0.10 | 0.78 |
| Subcutaneous fat (dm3) | 4.03 (0.5–11.73) | 0.23 | 0.006 | 0.17 | 0.0312 | 0.02 | 0.921 |
| Intra‐abdominal fat (dm3) e | 0.76 (0.1–2.95) | 0.61 | 0.009 | 0.47 | 0.028 | 0.22 | 0.547 |
| Liver fat (%) e | 1.04 (0.2–25.2) | 0.47 | 0.001 | 0.27 | 0.047 | 0.14 | 0.384 |
| hs‐CRP e | 5.33 (0.14–247.81) | 0.36 | 0.039 | 0.19 | 0.263 | 0.15 | 0.403 |
| HOMA‐IR index e | 1.11 (0.27–6.27) | 0.58 | 0.027 | 0.43 | 0.063 | 0.26 | 0.324 |
| fP‐insulin (mU/L) e | 5.05 (1.2–23.5) | 0.68 | 0.014 | 0.48 | 0.052 | 0.31 | 0.267 |
| fP‐glucose (mmol/L) e | 5.08 (4.00–6.58) | −1.11 | 0.55 | 0.40 | 0.814 | −0.71 | 0.676 |
| fP‐Leptin (ng/ml) e | 14.82 (0.74–77.64) | 0.59 | 0.036 | 0.22 | 0.417 | 0.03 | 0.937 |
| fP‐Adiponectin (μg/ml) | 2.67 (1.24–5.56) | −0.11 | 0.69 | 0.04 | 0.87 | 0.10 | 0.675 |
| fS‐HDL cholesterol (mmol/L) | 1.34 (0.52–3.04) | −0.86 | 0.075 | −0.80 | 0.066 | −0.49 | 0.325 |
| fS‐LDL cholesterol (mmol/L) | 2.5 (1.02–5.1) | 0.11 | 0.62 | 0.16 | 0.421 | −3.58 | 0.999 |
| fs‐Total cholesterol (mmol/L) | 4.3 (3–7) | −0.01 | 0.97 | 0.006 | 0.974 | −0.09 | 0.610 |
| fS‐Triglycerides (mmol/L) e | 0.96 (0.37–2.65) | 0.50 | 0.21 | 0.15 | 0.665 | −0.11 | 0.764 |
Abbreviations: fP, fasting plasma; fS, fasting serum; FTC, The Finnish Twin Cohort; HDL, high density lipoprotein; HOMA‐IR, homeostatic model assessment of insulin resistance; hs‐CRP, high‐sensitivity C‐reactive protein; LDL, low density lipoprotein.
aUntransformed values.
bModel 1.
cModel 2.
dModel 3.
eNatural log transformation was performed due to skewed distribution of variable.
Table 3.
Obesity‐related clinical measures in relation to age acceleration in YFS (n = 1581). The median and range of each measure is indicated for participants in the YFS. Results for the effect of each measure on GrimAge acceleration from each of three linear models are presented: Model 1 adjusted for age, sex, and predicted smoking pack‐years, Model 2 further adjusted for predicted proportions of CD8 T cells, CD4 T cells, natural killer cells, and neutrophils, and Model 3 additionally adjusted for body mass index (BMI)
| Variable | Median (range) a | Coefficient b | p‐value b | Coefficient c | p‐value c | Coefficient d | p‐value d |
|---|---|---|---|---|---|---|---|
| BMI | 25.8 (16.2–58.5) | 0.09 | 6.63 × 10‐27 | 0.09 | 2.60 × 10‐27 | − | − |
| HbA1C e | 36 (22–102) | 1.26 | 1.8 × 10‐3 | 1.56 | 3.73 × 10‐5 | 0.41 | 0.29 |
| fP‐insulin (mU/L) [Link] , [Link] | 7.41 (0.06–95.7) | 0.52 | 1.98 × 10‐21 | 0.49 | 1.58 × 10‐21 | 0.26 | 1.68 × 10‐5 |
| fP‐glucose (mmol/L) [Link] , [Link] | 5.25 (3.14–12.65) | 2.88 | 1.69 × 10‐12 | 2.77 | 3.70 × 10‐13 | 1.66 | 1.99 × 10‐5 |
| fS‐HDL cholesterol (mmol/L) | 1.29 (0.52–2.64) | −0.81 | 1.62 × 10‐8 | −0.75 | 2.57 × 10‐8 | −0.31 | 0.024 |
| fS‐LDL cholesterol (mmol/L) | 3.19 (1.06–7.05) | −0.005 | 0.93 | −0.0004 | 0.99 | −0.046 | 0.37 |
| fs‐Total cholesterol (mmol/L) | 5.1 (2.8–10.2) | 0.04 | 0.44 | 0.067 | 0.14 | 0.02 | 0.68 |
| fS‐Triglycerides (mmol/L) e | 1.05 (0.34–6.05) | 0.66 | 1.25 × 10‐13 | 0.74 | 5.39 × 10‐19 | 0.46 | 2.05 × 10‐7 |
| hs‐CRP e | 0.79 (0.05–29.08) | 0.43 | 9.94 × 10‐32 | 0.38 | 1.75 × 10‐27 | 0.25 | 1.08 × 10‐10 |
| HOMA‐IR index e | 1.73 (0.02–21.0) | 0.49 | 4.82 × 10‐22 | 0.46 | 1.94 × 10‐22 | 0.25 | 4.74 × 10‐6 |
Abbreviations: fP, fasting plasma; fS, fasting serum; HDL, high density lipoprotein; HOMA‐IR, homeostatic model assessment of insulin resistance; hs‐CRP, high‐sensitivity C‐reactive protein; LDL, low density lipoprotein; YFS, Young Finns Study.
aUntransformed values.
bModels adjusted for age, sex, and predicted smoking pack‐years.
cModels adjusted for age, sex, predicted smoking pack‐years, and predicted proportions of CD8T cells, CD4T cells, natural killer cells, and neutrophils.
dModels adjusted for age, sex, predicted smoking pack‐years, predicted proportions of CD8T cells, CD4T cells, natural killer cells, neutrophils, and BMI.
eNatural log transformation was performed due to skewed distribution of variable.
fOne sample excluded for extreme log‐transformed insulin value (mU/L) of over 8.
gTwo samples excluded for extreme log‐transformed glucose (mmol/L) value of over 2.75.
Table 4.
Obesity‐related clinical measures in relation to age acceleration in DILGOM (n = 305). The median and range of each measure is indicated for participants in DILGOM. Results for the effect of each measure on GrimAge acceleration from each of three linear models are presented: Model 1 adjusted for age, sex, and predicted smoking pack‐years, Model 2 further adjusted for predicted proportions of CD8 T cells, CD4 T cells, natural killer cells, and neutrophils, and Model 3 additionally adjusted for body mass index (BMI)
| Variable | Median (range) a | Coefficient b | p‐value b | Coefficient c | p‐value c | Coefficient d | p‐value d |
|---|---|---|---|---|---|---|---|
| BMI | 25.8 (16.4–48.9) | 0.05 | 0.019 | 0.06 | 0.005 | − | − |
| fP‐glucose (mmol/L) e | 5.8 (4.4–15.0) | −1.15 | 0.136 | −0.57 | 0.436 | −0.96 | 0.188 |
| fP‐insulin (mU/L) e | 5.3 (1.5–94.5) | 0.44 | 0.012 | 0.46 | 0.004 | 0.30 | 0.119 |
| HOMA‐IR index e | 1.33 (0.34–23.53) | 0.30 | 0.051 | 0.35 | 0.017 | 0.18 | 0.287 |
| fS‐HDL cholesterol (mmol/L) | 1.42 (0.51–2.82) | −0.27 | 0.323 | −0.27 | 0.301 | −0.10 | 0.718 |
| fS‐Triglycerides (mmol/L) e | 1.02 (0.37–5.14) | 0.19 | 0.392 | 0.39 | 0.068 | 0.22 | 0.330 |
Abbreviations: DILGOM, DIetary, Lifestyle, and Genetic Determinants of Obesity and Metabolic Syndrome; fP, fasting plasma; fS, fasting serum; HDL, high density lipoprotein; HOMA‐IR, homeostatic model assessment of insulin resistance.
aUntransformed values.
bModel 1.
cModel 2.
dModel 3.
eNatural log transformation was performed due to skewed distribution of variable.
Fig. 3.
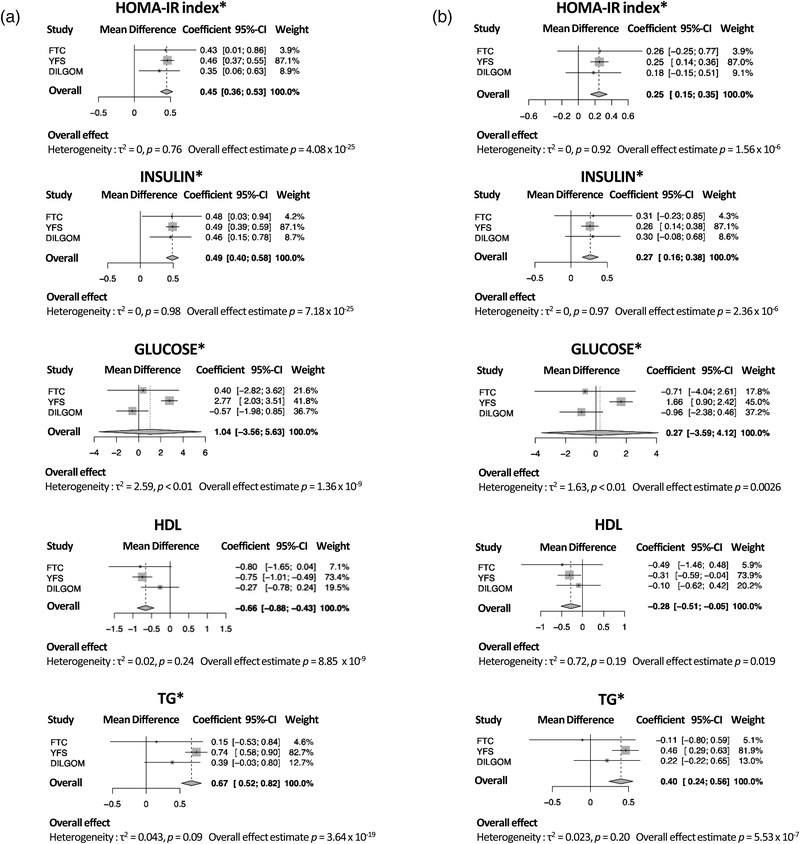
Obesity‐related clinical measures associate with age acceleration. Meta‐analysis forest plots showing associations between age acceleration and homeostatic model assessment of insulin resistance (HOMA‐IR) index, and fasting insulin, glucose, high density lipoprotein (HDL) cholesterol, and triglycerides (a) without body mass index (BMI) adjustment and (b) with BMI adjustment in meta‐analyses including all three cohorts. Meta‐analyses were performed by fixed effects models for HOMA‐IR index, insulin, HDL, and triglycerides, with no heterogeneity, while meta‐analysis for glucose was performed by random effects model due to significant heterogeneity. Between‐study variance was determined by empirical Bayes method. The reported estimates are in units of years. The “*” symbol indicates the variable was transformed using the natural logarithm. DILGOM, DIetary, Lifestyle and Genetic Determinants of Obesity and Metabolic syndrome; FTC, Finnish Twin Cohort; TG, triglyceride; YFS, Young Finns Study.
Heritability analyses
Finally, we estimated the heritability of GrimAge acceleration and BMI using the MZ and DZ twin pairs in the FTC. The equal environments assumption was not violated for either BMI or GrimAge acceleration. Heritability for GrimAge acceleration was 0.58 (95% confidence interval [CI] = 51%–65%) and 0.68 (95% CI = 63%–73%) for BMI (Table S3). Common environmental factors did not explain the variance for either GrimAge acceleration or BMI.
Discussion
In this study, we investigated the association of BMI with epigenetic aging using a new epigenetic clock, GrimAge, using Finnish MZ and DZ twin pairs. We found a positive association between BMI and age acceleration as inferred from DNAmethylation in blood. Importantly, the observation of epigenetic age acceleration between heavy and light twins within BMI‐discordant MZ twin pairs shows that this association is not due to confounding by shared genetic and environmental effects on DNAmethylation at aging‐associated CpGs. Additionally, we found a linear relationship between BMI and age acceleration, with underweight individuals displaying the lowest amount of age acceleration, and an incremental increase in the amount of age acceleration through each subsequent BMI category. Given that most studies of BMI suggest that underweight individuals are at higher risk of disease [45–47], it is noteworthy that we find no evidence of that here. Finally, we found that the most strongly associated obesity‐related clinical features were those of body fat distribution—including ectopic fat accumulation—and glucose metabolism and insulin resistance, as shown by the positive relation between age acceleration and subcutaneous and intra‐abdominal fat volume, liver fat percentage, the HOMA‐IR index, and fasting insulin.
The association of BMI with accelerated epigenetic aging was also observed in two independent Finnish cohorts of unrelated individuals, DILGOM and the YFS. However, the effect estimates for the relation of BMI with age acceleration were slightly different in the FTC compared to DILGOM and YFS. The analysis including all twins showed an increase in age acceleration of 0.9 months per unit BMI increase among all individual participants, while within BMI‐discordant MZ twin pairs whose cotwins differed in BMI on average by five BMI units showed an increase of 5.2 months in age acceleration, or around 1 month per unit BMI difference. However, DILGOM participants displayed an age acceleration increase of around 0.7 months and YFS participants around 1 month per unit BMI increase. Nonetheless, our meta‐analysis provides no evidence of heterogeneity between studies for the effect estimate of BMI on age acceleration. Interestingly, we observed associations of HOMA‐IR index and fasting insulin with age acceleration in all three cohorts of which the magnitude was comparable in all three studies, with the meta‐analyses not indicating any heterogeneity. The lack of evidence of heterogeneity in the associations of BMI and measures of glucose metabolism and insulin resistance with age acceleration indicate that the observed associations are robust to differences in the ascertainment of the samples and can be considered to be a true population effect.
Based on the results we obtained, insulin resistance may be responsible in part for the effect of obesity on epigenetic aging, since adjusting for BMI results in a reduction in the effect estimates of HOMA‐IR, insulin, and glucose on age acceleration. Obesity and aging both play a role in insulin resistance and type 2 diabetes [48–50]. Obesity is known to promote inflammation [51], which in turn is involved in the onset of lipid‐induced insulin resistance [50]. Interestingly, metformin, a drug used to lower blood glucose levels, is being tested as an intervention to protect against aging and age‐related diseases [52]. Additionally, we also observed increased age acceleration with rising CRP, an inflammatory marker; however, this was primarily observed in YFS participants. It is possible that the association between CRP and age acceleration was less apparent in the FTC due to the much smaller sample size, some amount of genetic confounding, or a combination of these factors.
These findings are consistent with other studies using GrimAge to determine age acceleration [18,19]; however, Horvath's epigenetic clock seems to be able to detect the effect of BMI better in other tissues such as liver [17], visceral adipose tissue [16], and saliva [53] than blood. This could indicate that the GrimAge epigenetic clock is better suited for usage for assessment of age acceleration related to cardiometabolic phenotypes, which is possible given the unique process used to develop the GrimAge clock of estimating blood proteins. This includes leptin, for example, which is known to be higher in obesity [54]. In line with this, leptin associated positively with age acceleration in the FTC. Overall, our results support the well‐established association of BMI with aging as well as a strong role of insulin resistance.
Further, nutrient‐sensing pathways may play a role in the relation of obesity and aging. For example, genes belonging to nutrient‐sensing pathways including insulin/insulin‐like growth factor (IGF) pathway, mechanistic target of rapamycin, adenosine monophosphate‐activated protein kinase (AMPK), and sirtuin deacetylases appear to regulate lifespan in mice [55]. In fact, mutations in these genes including IGF1 and IGFR associate with increased longevity in humans [56], and a low energy state activates AMPK as well as sirtuins [57]. This information points to a link between nutrient‐sensing pathways, weight gain, and aging, since weight gain is caused in part by excess energy intake.
Our study has several strengths that contribute to its significance. First, the usage of MZ twin pairs discordant for obesity allows us to be certain that the associations we identified are not entirely due to confounding by genetic predisposition to both obesity and accelerated aging. Additionally, we identified associations with obesity‐related clinical measures that are in line with the results obtained for BMI, with a detrimental effect of insulin resistance and a beneficial effect of HDL on aging. Further, we performed meta‐analyses for the associations of BMI and obesity‐related clinical measures with age acceleration, and demonstrated consistent associations for BMI, HOMA‐IR, and fasting insulin with increased age acceleration in all three studies. However, our study is limited by the small number of MZ twin pairs discordant for BMI, which is due to the rarity of this occurring. Additionally, our study populations consisted of exclusively Finnish participants, which may somewhat limit the generalizability of our findings to other populations; however, this is unlikely given that the same associations have previously been observed in other populations.
Conclusion
In conclusion, we identified significant associations of BMI, HOMA‐IR, a measure of insulin resistance, and fasting insulin with epigenetic age acceleration calculated using the GrimAge epigenetic clock. These associations were not due to the effects of genetics on BMI and aging, and measures of insulin resistance were also associated independently from BMI with age acceleration. Overall, these results suggest that BMI plays a role in aging, along with and perhaps in part due to insulin resistance. More research needs to be done to determine whether weight loss can reverse BMI‐associated epigenetic aging.
Funding
This research was supported by the FP7‐HEALTH‐F4‐2007, grant agreement number 201413 for European Network for Genetic and Genomic Epidemiology; EU Horizon 2020 (grant 755320 for TAXINOMISIS and grant 848146 for To Aition); Tampere University Hospital Supporting Foundation; Finnish Society of Clinical Chemistry; Yrjö Jahnssonin Säätiö; Paavo Nurmen Säätiö; Helsinki University Hospital; Emil Aaltosen Säätiö; Tampereen Tuberkuloosisäätiö; Sigrid Juselius Foundation; Diabetestutkimussäätiö; Novo Nordisk Fonden NNF10OC1013354, NNF17OC0027232; Sydäntutkimussäätiö; Diabetes Research Foundation of Finnish Diabetes Association; Signe ja Ane Gyllenbergin Säätiö; Juho Vainion Säätiö; Suomen Lääketieteen Säätiö; Social Insurance Institution of Finland; European Research Council (grant 742927 for MULTIEPIGEN project); Suomen Kulttuurirahasto; Academy of Finland (grant numbers 100499, 117787, 118555, 121584, 124282, 126925, 129378, 129680, 134309, 141054, 205585, 213506, 255935, 263278, 264146, 265240, 266286, 272376, 286284, 297908, 308248, 312073, 314383, 322098, and 41071); Competitive State Research Financing of the Expert Responsibility area of Kuopio; Tampere and Turku University Hospitals X51001; National Institute of Alcohol Abuse and Alcoholism (grants AA‐00145, AA‐09203, and AA‐12502); Helsingin ja Uudenmaan Sairaanhoitopiiri; Helsingin Yliopisto.
Conflict of interest
The authors do not have any conflict of interest to disclose.
Author contributions
M. O. and S. K. conceptualized the aims of the study, S. L. and S. K. performed statistical analyses and created figures for the FTC data, S. L. performed statistical analyses and created figures in the validation populations, S. L. and S. K. wrote the paper, and all authors aided in the interpretation of results, offered critical feedback, and reviewed and edited the paper.
Supporting information
Figure S1: Age acceleration increases with increasing BMI category in FTC, YFS, and DILGOM. (A) Boxplots showing differences in age acceleration by BMI category in all the three cohorts. (B) Forest plot showing the estimates for the association of BMI categories with age acceleration in each study, and the overall effect from a fixed effect meta‐analysis. Normal weight category was used as the reference group. Between study variance was determined by empirical Bayes method. The reported estimates are in units of years. FTC, Finnish Twin Cohort; YFS, Young Finns Study, DILGOM, DIetary, Lifestyle and Genetic determinants of Obesity and Metabolic syndrome.
Figure S2: Heavier twins in a BMI‐discordant pair more often have higher age acceleration compared to their leaner co‐twin. Waterfall plot showing the difference in age acceleration in years within MZ twin pairs discordant for obesity, subtracting the value for the leaner twin from that of the heavier twin.
Figure S3: CRP associates with age acceleration in the meta‐analysis of FTC and YFS (a) without BMI adjustment and (b) with BMI adjustment. Meta‐analysis were performed by fixed effects models, and the between study variance was determined by empirical Bayes method. The reported estimates are in units of years. FTC, Finnish Twin Cohort; YFS, Young Finns Study, CRP, C‐reactive protein.
Table S1: BMI category associates with age acceleration. The association of BMI category with age acceleration, with the normal weight BMI group as the reference category, was tested in the FTC using a linear mixed effects model and in the YFS and DILGOM using a linear model. Models were adjusted for relevant covariates. Additionally, meta‐analyses for the estimates for each BMI category were performed. The meta‐analysis for the underweight category was performed on the FTC and YFS, while for the rest of the categories all three cohorts were used.
Table S2: Comparison of BMI vs. age acceleration estimates by zygosity in the FTC (n = 1424). Two models were built to test (1) the association of BMI with age acceleration in all twins as individuals and (2) the association of being the heavier twin in a BMI discordant pair with age acceleration. MZ, monozygotic; DZ dizygotic.
Table S3: GrimAge acceleration and BMI are heritable. The amount of variance in GrimAge acceleration and BMI explained by additive genetic factors, common environmental factors, and unique environmental factors was calculated using classical twin modeling methods. Heritability was considered to be the amount of variance explained by additive genetic factors.
Lundgren S, Kuitunen S, Pietiläinen KH, Hurme M, Kähönen M, Männistö S, et al. BMI is positively associated with accelerated epigenetic aging in twin pairs discordant for body mass index. J Intern Med. 2022;292:627–640.
Sara Lundgren and Sara Kuitunen contributed equally to this study.
Contributor Information
Sara Lundgren, Email: sara.lundgren@helsinki.fi.
Miina Ollikainen, Email: miina.ollikainen@helsinki.fi.
References
- 1. Peralta M, Ramos M, Lipert A, Martins J, Marques A. Prevalence and trends of overweight and obesity in older adults from 10 European countries from 2005 to 2013. Scand J Public Health. 2018;46:522–9. [DOI] [PubMed] [Google Scholar]
- 2. The Emerging Risk Factors Collaboration . Separate and combined associations of body‐mass index and abdominal adiposity with cardiovascular disease: collaborative analysis of 58 prospective studies. Lancet. 2011;377:1085–95. [DOI] [PMC free article] [PubMed] [Google Scholar]
- 3. Narayan KMV, Boyle JP, Thompson TJ, Gregg EW, Williamson DF. Effect of BMI on lifetime risk for diabetes in the US. Diabetes Care. 2007;30:1562–6. [DOI] [PubMed] [Google Scholar]
- 4. Wolk A, Gridley G, Svensson M, Nyrén O, Mclaughlin JK, Fraumeni JF, et al. A prospective study of obesity and cancer risk (Sweden). Cancer Causes Control. 2001;12:13–21. [DOI] [PubMed] [Google Scholar]
- 5. Bardou M, Barkun AN, Martel M. Obesity and colorectal cancer. Gut. 2013;62:933–47. [DOI] [PubMed] [Google Scholar]
- 6. Horvath S. DNA methylation age of human tissues and cell types. Genome Biol. 2013;14:R115. [DOI] [PMC free article] [PubMed] [Google Scholar]
- 7. Hannum G, Guinney J, Zhao L, Zhang Li, Hughes G, Sadda S, et al. Genome‐wide methylation profiles reveal quantitative views of human aging rates. Mol Cell. 2013;49:359–67. [DOI] [PMC free article] [PubMed] [Google Scholar]
- 8. Levine ME, Lu AT, Quach A, Chen BH, Assimes TL, Bandinelli S, et al. An epigenetic biomarker of aging for lifespan and healthspan. Aging (Albany NY). 2018;10:573–91. [DOI] [PMC free article] [PubMed] [Google Scholar]
- 9. Lu AT, Quach A, Wilson JG, Reiner AP, Aviv A, Raj K, et al. DNA methylation GrimAge strongly predicts lifespan and healthspan. Aging (Albany NY). 2019;11:303–27. [DOI] [PMC free article] [PubMed] [Google Scholar]
- 10. Yang Z, Wong A, Kuh D, Paul DS, Rakyan VK, Leslie RD, et al. Correlation of an epigenetic mitotic clock with cancer risk. Genome Biol. 2016;17:205. [DOI] [PMC free article] [PubMed] [Google Scholar]
- 11. Perna L, Zhang Y, Mons U, Holleczek B, Saum K‐U, Brenner H. Epigenetic age acceleration predicts cancer, cardiovascular, and all‐cause mortality in a German case cohort. Clin Epigenetics. 2016;8:64. [DOI] [PMC free article] [PubMed] [Google Scholar]
- 12. Huang R‐C, Lillycrop KA, Beilin LJ, Godfrey KM, Anderson D, Mori TA, et al. Epigenetic age acceleration in adolescence associates with BMI, inflammation, and risk score for middle age cardiovascular disease. J Clin Endocrinol Metab. 2019;104:3012–24. [DOI] [PMC free article] [PubMed] [Google Scholar]
- 13. Nevalainen T, Kananen L, Marttila S, Jylhävä J, Mononen N, Kähönen M, et al. Obesity accelerates epigenetic aging in middle‐aged but not in elderly individuals. Clin Epigenetics. 2017;9:20. [DOI] [PMC free article] [PubMed] [Google Scholar]
- 14. Quach A, Levine ME, Tanaka T, Lu AT, Chen BH, Ferrucci L, et al. Epigenetic clock analysis of diet, exercise, education, and lifestyle factors. Aging (Albany NY). 2017;9:419. [DOI] [PMC free article] [PubMed] [Google Scholar]
- 15. Ryan J, Wrigglesworth J, Loong J, Fransquet PD, Woods RL. A systematic review and meta‐analysis of environmental, lifestyle, and health factors associated with DNA methylation age. J Gerontol A Biol Sci Med Sci. 2020;75:481–94. [DOI] [PMC free article] [PubMed] [Google Scholar]
- 16. De Toro‐Martín J, Guénard F, Tchernof A, Hould F‐S, Lebel S, Julien F, et al. Body mass index is associated with epigenetic age acceleration in the visceral adipose tissue of subjects with severe obesity. Clin Epigenetics. 2019;11:1–11. [DOI] [PMC free article] [PubMed] [Google Scholar]
- 17. Horvath S, Erhart W, Brosch M, Ammerpohl O, Von Schönfels W, Ahrens M, et al. Obesity accelerates epigenetic aging of human liver. Proc Natl Acad Sci U S A. 2014;111:15538–43. [DOI] [PMC free article] [PubMed] [Google Scholar]
- 18. Arpón A, Milagro FI, Santos JL, García‐Granero M, Riezu‐Boj J‐I, Martínez JA. Interaction among sex, ageing and epigenetic processes concerning visceral fat, insulin resistance and dyslipidaemia. Front Endocrinol (Lausanne). 2019;10:496. [DOI] [PMC free article] [PubMed] [Google Scholar]
- 19. Zhao W, Ammous F, Ratliff S, Liu J, Yu M, Mosley TH, et al. Education and lifestyle factors are associated with DNA methylation clocks in older African Americans. Int J Environ Res Public Health. 2019;16:3141. [DOI] [PMC free article] [PubMed] [Google Scholar]
- 20. Tekola‐Ayele F, Lee A, Workalemahu T, Sánchez‐Pozos K. Shared genetic underpinnings of childhood obesity and adult cardiometabolic diseases. Hum Genomics. 2019;13:17. [DOI] [PMC free article] [PubMed] [Google Scholar]
- 21. Smith AK, Kilaru V, Kocak M, Almli LM, Mercer KB, Ressler KJ, et al. Methylation quantitative trait loci (meQTLs) are consistently detected across ancestry, developmental stage, and tissue type. BMC Genomics. 2014;15:145. [DOI] [PMC free article] [PubMed] [Google Scholar]
- 22. Hillary RF, Stevenson AJ, Mccartney DL, Campbell A, Walker RM, Howard DM, et al. Epigenetic measures of ageing predict the prevalence and incidence of leading causes of death and disease burden. Clin Epigenetics. 2020;12:115. [DOI] [PMC free article] [PubMed] [Google Scholar]
- 23. McCrory C, Fiorito G, Hernandez B, Polidoro S, O'Halloran AM, Hever A, et al. Association of 4 epigenetic clocks with measures of functional health, cognition, and all‐cause mortality in The Irish Longitudinal Study on Ageing (TILDA). 2020. 10.1101/2020.04.27.063164 [DOI]
- 24. Lin W‐Y, Wang Y‐C, Teng I‐H, Liu C, Lou X‐Y. Associations of five obesity metrics with epigenetic age acceleration: evidence from 2,474 Taiwan Biobank participants. Obesity. 2021;29:1731–8. [DOI] [PubMed] [Google Scholar]
- 25. Kresovich JK, Garval EL, Martinez Lopez AM, Xu Z, Niehoff NM, White AJ, et al. Associations of body composition and physical activity level with multiple measures of epigenetic age acceleration. Am J Epidemiol. 2021;190:984–93. [DOI] [PMC free article] [PubMed] [Google Scholar]
- 26. Kaprio J, Bollepalli S, Buchwald J, Iso‐Markku P, Korhonen T, Kovanen V, et al. The Older Finnish Twin Cohort—45 years of follow‐up. Twin Res Hum Genet. 2019;22:240–54. [DOI] [PubMed] [Google Scholar]
- 27. Rose RJ, Salvatore JE, Aaltonen S, Barr PB, Bogl LH, Byers HA, et al. FinnTwin12 cohort: an updated review. Twin Res Hum Genet. 2019;22:302–11. [DOI] [PMC free article] [PubMed] [Google Scholar]
- 28. Kaidesoja M, Aaltonen S, Bogl LH, Heikkilä K, Kaartinen S, Kujala UM, et al. FinnTwin16: a longitudinal study from age 16 of a population‐based Finnish Twin Cohort. Twin Res Hum Genet. 2019;22:530–9. [DOI] [PubMed] [Google Scholar]
- 29. Naukkarinen J, Heinonen S, Hakkarainen A, Lundbom J, Vuolteenaho K, Saarinen L, et al. Characterising metabolically healthy obesity in weight‐discordant monozygotic twins. Diabetologia. 2014;57:167–76. [DOI] [PubMed] [Google Scholar]
- 30. Heinonen S, Buzkova J, Muniandy M, Kaksonen R, Ollikainen M, Ismail K, et al. Impaired mitochondrial biogenesis in adipose tissue in acquired obesity. Diabetes. 2015;64:3135–45. [DOI] [PubMed] [Google Scholar]
- 31. Bibikova M, Barnes B, Tsan C, Ho V, Klotzle B, Le JM, et al. High density DNA methylation array with single CpG site resolution. Genomics. 2011;98:288–95. [DOI] [PubMed] [Google Scholar]
- 32. Van Iterson M, Tobi EW, Slieker RC, Den Hollander W, Luijk R, Slagboom PE, et al. MethylAid: visual and interactive quality control of large Illumina 450k datasets. Bioinformatics. 2014;30:3435–7. [DOI] [PubMed] [Google Scholar]
- 33. Aryee MJ, Jaffe AE, Corrada‐Bravo H, Ladd‐Acosta C, Feinberg AP, Hansen KD, et al. Minfi: a flexible and comprehensive Bioconductor package for the analysis of Infinium DNA methylation microarrays. Bioinformatics. 2014;30:1363–9. [DOI] [PMC free article] [PubMed] [Google Scholar]
- 34. Fortin J‐P, Labbe A, Lemire M, Zanke BW, Hudson TJ, Fertig EJ, et al. Functional normalization of 450k methylation array data improves replication in large cancer studies. Genome Biol. 2014;15:503. [DOI] [PMC free article] [PubMed] [Google Scholar]
- 35. Teschendorff AE, Marabita F, Lechner M, Bartlett T, Tegner J, Gomez‐Cabrero D, et al. A beta‐mixture quantile normalization method for correcting probe design bias in Illumina Infinium 450 k DNA methylation data. Bioinformatics. 2013;29:189–96. [DOI] [PMC free article] [PubMed] [Google Scholar]
- 36. Wong CCY, Pidsley R, Schalkwyk LC. The wateRmelon Package. 2013.
- 37. Zhou W, Laird PW, Shen H. Comprehensive characterization, annotation and innovative use of Infinium DNA methylation BeadChip probes. Nucleic Acids Res. 2017;45:e22. [DOI] [PMC free article] [PubMed] [Google Scholar]
- 38. Bates D, Maechler M, Bolker B, Walker S, Haubo Bojesen Christensen R. lme4: Linear mixed‐effects models using Eigen and S4. R package version 1.1–7. 2014. 2015.
- 39. Salas LA, Koestler DC, Butler RA, Hansen HM, Wiencke JK, Kelsey KT, et al. An optimized library for reference‐based deconvolution of whole‐blood biospecimens assayed using the Illumina HumanMethylationEPIC BeadArray. Genome Biol. 2018;19:64. [DOI] [PMC free article] [PubMed] [Google Scholar]
- 40. Konttinen H, Männistö S, Sarlio‐Lähteenkorva S, Silventoinen K, Haukkala A. Emotional eating, depressive symptoms and self‐reported food consumption. A population‐based study. Appetite. 2010;54:473–9. [DOI] [PubMed] [Google Scholar]
- 41. Raitakari OT, Juonala M, Ronnemaa T, Keltikangas‐Jarvinen L, Rasanen L, Pietikainen M, et al. Cohort profile: the cardiovascular risk in Young Finns Study. Int J Epidemiol. 2008;37:1220–6. [DOI] [PubMed] [Google Scholar]
- 42. Balduzzi S, Rücker G, Schwarzer G. Statistics in practice: how to perform a meta‐analysis with R: a practical tutorial. Evid Based Ment Heal. 2019;22:153–60. [DOI] [PMC free article] [PubMed] [Google Scholar]
- 43. Holst KK, Scheike TH, Hjelmborg JB. The liability threshold model for censored twin data. Comput Stat Data Anal. 2016;93:324–35. [Google Scholar]
- 44. Van Dongen J, Slagboom PE, Draisma HHM, Martin NG, Boomsma DI. The continuing value of twin studies in the omics era. Nat Rev Genet. 2012;13:640–53. [DOI] [PubMed] [Google Scholar]
- 45. Aune D, Sen A, Prasad M, Norat T, Janszky I, Tonstad S, et al. BMI and all cause mortality: systematic review and non‐linear dose‐response meta‐analysis of 230 cohort studies with 3.74 million deaths among 30.3 million participants. BMJ. 2016;353:i2156. [DOI] [PMC free article] [PubMed] [Google Scholar]
- 46. Sun Y‐Q, Burgess S, Staley JR, Wood AM, Bell S, Kaptoge SK, et al. Body mass index and all cause mortality in HUNT and UK Biobank studies: linear and non‐linear mendelian randomisation analyses. BMJ. 2019;364:l1042. [DOI] [PMC free article] [PubMed] [Google Scholar]
- 47. Jayedi A, Soltani S, Zargar MS, Khan TA, Shab‐Bidar S. Central fatness and risk of all cause mortality: systematic review and dose‐response meta‐analysis of 72 prospective cohort studies. BMJ. 2020;370:m3324. [DOI] [PMC free article] [PubMed] [Google Scholar]
- 48. Ehrhardt N, Cui J, Dagdeviren S, Saengnipanthkul S, Goodridge HS, Kim JK, et al. Adiposity‐independent effects of aging on insulin sensitivity and clearance in mice and humans. Obesity. 2019;27:434–43. [DOI] [PMC free article] [PubMed] [Google Scholar]
- 49. Salvestrini V, Sell C, Lorenzini A. Obesity may accelerate the aging process. Front Endocrinol (Lausanne). 2019;10:266. [DOI] [PMC free article] [PubMed] [Google Scholar]
- 50. Vorotnikov AV, Stafeev IS, Menshikov MY, Shestakova MV, Parfyonova YV. Latent Inflammation and defect in adipocyte renewal as a mechanism of obesity‐associated insulin resistance. Biochem. 2019;84:1329–45. [DOI] [PubMed] [Google Scholar]
- 51. Karczewski J, Śledzińska E, Baturo A, Jończyk I, Maleszko A, Samborski P, et al. Obesity and inflammation. Eur Cytokine Netw. 2018;29:83–94. [DOI] [PubMed] [Google Scholar]
- 52. Barzilai N, Crandall JP, Kritchevsky SB, Espeland MA. Metformin as a tool to target aging. Cell Metab. 2016;23:1060–5. [DOI] [PMC free article] [PubMed] [Google Scholar]
- 53. Li C, Wang Z, Hardy T, Huang Y, Hui Q, Crusto CA, et al. Association of obesity with DNA methylation age acceleration in African American mothers from the InterGEN study. Int J Mol Sci. 2019;20:4273. [DOI] [PMC free article] [PubMed] [Google Scholar]
- 54. Izquierdo AG, Crujeiras AB, Casanueva FF, Carreira MC. Leptin, obesity, and leptin resistance: where are we 25 years later? Nutrients. 2019;11:2704. [DOI] [PMC free article] [PubMed] [Google Scholar]
- 55. Singh PP, Demmitt BA, Nath RD, Brunet A. The genetics of aging: a vertebrate perspective. Cell. 2019;177:200–20. [DOI] [PMC free article] [PubMed] [Google Scholar]
- 56. Suh Y, Atzmon G, Cho M‐O, Hwang D, Liu B, Leahy DJ, et al. Functionally significant insulin‐like growth factor I receptor mutations in centenarians. Proc Natl Acad Sci. 2008;105:3438–42. [DOI] [PMC free article] [PubMed] [Google Scholar]
- 57. López‐Lluch G, Navas P. Calorie restriction as an intervention in ageing. J Physiol. 2016;594:2043–60. [DOI] [PMC free article] [PubMed] [Google Scholar]
Associated Data
This section collects any data citations, data availability statements, or supplementary materials included in this article.
Supplementary Materials
Figure S1: Age acceleration increases with increasing BMI category in FTC, YFS, and DILGOM. (A) Boxplots showing differences in age acceleration by BMI category in all the three cohorts. (B) Forest plot showing the estimates for the association of BMI categories with age acceleration in each study, and the overall effect from a fixed effect meta‐analysis. Normal weight category was used as the reference group. Between study variance was determined by empirical Bayes method. The reported estimates are in units of years. FTC, Finnish Twin Cohort; YFS, Young Finns Study, DILGOM, DIetary, Lifestyle and Genetic determinants of Obesity and Metabolic syndrome.
Figure S2: Heavier twins in a BMI‐discordant pair more often have higher age acceleration compared to their leaner co‐twin. Waterfall plot showing the difference in age acceleration in years within MZ twin pairs discordant for obesity, subtracting the value for the leaner twin from that of the heavier twin.
Figure S3: CRP associates with age acceleration in the meta‐analysis of FTC and YFS (a) without BMI adjustment and (b) with BMI adjustment. Meta‐analysis were performed by fixed effects models, and the between study variance was determined by empirical Bayes method. The reported estimates are in units of years. FTC, Finnish Twin Cohort; YFS, Young Finns Study, CRP, C‐reactive protein.
Table S1: BMI category associates with age acceleration. The association of BMI category with age acceleration, with the normal weight BMI group as the reference category, was tested in the FTC using a linear mixed effects model and in the YFS and DILGOM using a linear model. Models were adjusted for relevant covariates. Additionally, meta‐analyses for the estimates for each BMI category were performed. The meta‐analysis for the underweight category was performed on the FTC and YFS, while for the rest of the categories all three cohorts were used.
Table S2: Comparison of BMI vs. age acceleration estimates by zygosity in the FTC (n = 1424). Two models were built to test (1) the association of BMI with age acceleration in all twins as individuals and (2) the association of being the heavier twin in a BMI discordant pair with age acceleration. MZ, monozygotic; DZ dizygotic.
Table S3: GrimAge acceleration and BMI are heritable. The amount of variance in GrimAge acceleration and BMI explained by additive genetic factors, common environmental factors, and unique environmental factors was calculated using classical twin modeling methods. Heritability was considered to be the amount of variance explained by additive genetic factors.