

Abstract
Background
Clinical pathology and body weight information for the cynomolgus monkey in the literature is primarily derived from a small number of animals with limited age ranges, varying geographic origins, and mixed genders.
Objectives
This study aimed to summarize the age‐ and sex‐related changes in clinical pathology analytes and body weights in cynomolgus monkeys of Mauritian origin.
Methods
Pre‐study age and body weight data were reviewed in 1819 animals, and pre‐study hematologic, coagulation, and serum biochemical analytes were reviewed in 1664 animals.
Results
Body weights were statistically higher (P < 0.01) in males than females in all age groups (2–10 years). These measurements became prominent after 4 years of age and peaked at 7 to 8 years of age in both sexes. Sex‐related differences were noted in reticulocyte (RETIC) counts, creatinine, cholesterol, and triglyceride concentrations, and alkaline phosphatase (ALP) and gamma‐glutamyl transferase (GGT) activities. Age‐related differences were noted in RETIC and lymphocyte counts, creatinine, triglyceride, phosphorus, and globulin concentrations, and ALP and GGT activities. The youngest (2 to <3 year) age group had the fewest number of clinical pathologic analyte differences including ALP and GGT activity differences which occurred in all age groups from 2 to 10 years; they also had age‐related lower globulin concentrations. There were no age‐ or sex‐related differences in coagulation measurands.
Conclusions
Sexual dimorphism in body weight was apparent for all ages from 2 to 10 years of age. The only difference in clinical pathology analytes unique to the 2 to <3 years of age group were age‐related lower globulin levels.
Keywords: body weight, coagulation, cynomolgus monkey, hematology, Mauritius, serum biochemistry
1. INTRODUCTION
Non‐human primates (NHP) are the closest phylogenetic relatives of humans with similar physiologic traits; they especially resemble the anatomy and genetics of macaques and apes. 1 , 2 Of the 22 macaque species, 21 species are distributed in Asia, including cynomolgus and rhesus monkeys. 3 , 4 The cynomolgus monkey is recognized as having 10 subspecies based on their pelage colors and tail lengths. The cynomolgus monkey (Macaca fascicularis, M. cynomolgus, and M. irus) is also known as the long‐tailed macaque or crab‐eating macaque.
The cynomolgus monkey is distributed primarily in Southeast Asia. 2 , 3 Cynomolgus monkeys that inhabit the north of the Isthmus of Kra might have genetic introgression from the rhesus monkey in Cambodia, Laos, Myanmar, Thailand, and Vietnam, whereas those that inhabit the south of the Isthmus would have no genetic influences from the rhesus monkey. 5 , 6 The cynomolgus monkey in Mauritius was introduced from Indonesia by shipping trades around the 16th century. 7 The original founder population was estimated at approximately 10 to 15 monkeys. 8 Thus, the genetic diversity of Mauritius monkeys is low. 5 The cynomolgus monkey in China was introduced from Vietnam, Cambodia, Laos, and Myanmar in the late 1980s. 4 Mauritius cynomolgus monkeys were shown to have differences in some hematologic and biochemical analytes and lower grades and incidences of background pathologic changes than Asian cynomolgus monkeys. 9 , 10 Cynomolgus monkeys of Mauritian origin become sexually mature 1–2 years earlier than those of Asian origin. 9 Despite geographic differences, there are no differences in physiologic and pharmacologic parameter values that impact the use of Asian or Mauritian cynomolgus monkeys for nonclinical safety assessments. 10
The cynomolgus monkey has become the most used NHP for biomedical research and nonclinical safety assessments since the Indian government banned the export of rhesus monkeys in 1978. 11 Background information, including the body weight and clinical pathology reference intervals (RIs), has been reported in the literature and appears to vary with the geographic origins of animals and by different laboratory environments. 12 , 13 , 14 , 15 , 16 , 17 These RIs were derived from a small number of animals, limited age ranges, and/or mixed genders. 12 , 15 , 17 , 18 , 19 , 20 In the current study, we provide RIs for 2 to <3 and 3 to <4 years of age and summarize age‐ and sex‐related changes in clinical pathology analytes (4 different age groups) and body weights (9 different age groups) in cynomolgus monkeys of Mauritian origin used in nonclinical safety assessment in Pfizer Drug Safety Research & Development laboratories over a period of 5 years (2016–2020).
2. MATERIALS AND METHODS
2.1. Animals and husbandry
During this 5‐year period, we had a dataset of 1823 monkeys. All animals were of Mauritian origin with a specific‐pathogen‐free status to exclude cercopithecine herpesvirus 1, simian beta‐retrovirus 1–5, simian T‐lymphotropic virus, simian immunodeficiency virus, and Mycobacterium tuberculosis. The animals were housed in the Association for Assessment and Accreditation of Laboratory Animal Care accredited facilities in Mauritius and the United States. To ensure suitable health status, physical examinations were conducted, body weights measured, and blood samples collected for hematologic and serum biochemistry analyte screens prior to the pre‐study group allocation. All procedures performed on animals were in accordance with regulations and established guidelines and were reviewed and approved by an Institutional Animal Care and Use Committee. Clinically acceptable animals were allocated to study groups using a computer‐assisted randomization procedure based on pre‐study body weights.
2.2. Body weight
Of the 1823 cynomolgus monkeys in this dataset, 1819 animals (960 males and 859 females) had pre‐study age and body weight data. Animal body weights were taken during the acclimation periods right before the animals were assigned to study groups. If more than one body weight was measured, the last pre‐study body weight immediately before the study started was used.
2.3. Blood collection and analysis
Of the 1823 cynomolgus monkeys in this dataset, 1664 animals (860 males and 804 females) had both age and clinical pathology analyte data recorded. The clinical pathology data included hematologic, coagulation, and serum biochemical analytes. Table 1 lists analytes with the abbreviations, units, platforms, and/or methods. Also included in this table is an equivalency factor (%) of the expected biological variability, based on historical knowledge of the more common analytes (considered major and bolded in the table) for comparison purposes. All blood samples included were collected pre‐study from animals that had been fasted overnight (approximately 12–18 hours) and before dosing started. If blood was collected more than once, the clinical pathology analyte values included were from the last blood collection before the study started. These blood samples were acquired by venipuncture of the femoral vein without anesthesia. Blood for hematology was collected into a tube with K2EDTA anticoagulant, and a blood smear was made. The whole‐blood sample was kept at room temperature (15–25°C) if it was analyzed within 8 hours of collection. If the samples were not analyzed at this time, they were refrigerated (2–8°C) for analysis on an ADVIA 2120i/120 analyzer (Siemens). Blood for coagulation was collected into a tube with 3.2% sodium citrate and centrifuged at approximately 2700 relative centrifugal force for 10 minutes. The plasma was kept at room temperature if it was to be analyzed within 4 hours of receipt or frozen at −80°C for processing on the STA‐R Evolution coagulation analyzer (Diagnostica Stago). Blood for serum biochemical analysis was collected into a serum separator tube without anticoagulant and left standing at room temperature for 15 minutes prior to centrifugation at approximately 2700 relative centrifugal force for 10 minutes. Serum was refrigerated (2 to −8°C) for analysis on the day of collection or frozen at −80°C for processing on the ADVIA 1800 (Siemens) for most analytes, except for insulin (ADVIA Centaur XP; Siemens), TSH (Immunite 1000, Siemens), and T3 and T4 (UPLC‐MS/MS, Agilent 1290 UPLC coupled to an AB Sciex 6500 triple quadrupole mass spectrometer).
TABLE 1.
Hematologic, coagulation, and serum biochemical analytes, analytic methods, and equivalency values for the common (major) analytes used in the cynomolgus monkey
| Hematologic analytes | Abbreviation | Units | Platform | Equivalency value (%) |
|---|---|---|---|---|
| Red blood cells | RBC | ×106/μL | ADVIA 2120/120 | 10 |
| Hemoglobin | HGB | g/dL | ADVIA 2120/120 | 10 |
| Hematocrit | HCT | % | ADVIA 2120/120 | 10 |
| Mean corpuscular volume | MCV | fL | ADVIA 2120/120 | |
| Mean corpuscular hemoglobin | MCH | pg | ADVIA 2120/120 | |
| Mean corpuscular hemoglobin concentration | MCHC | g/dL | ADVIA 2120/120 | |
| Red cell distribution width | RDW | % | ADVIA 2120/120 | |
| Platelets | PLT | ×103/μL | ADVIA 2120/120 | 25 |
| Mean platelet volume | MPV | fL | ADVIA 2120/120 | |
| White blood cells | WBC | ×103/μL | ADVIA 2120/120 | 25 |
| Neutrophil, absolute | NEUT | ×103/μL | ADVIA 2120/120 or Microscopy | 25 |
| Lymphocyte, absolute | LYM | ×103/μL | ADVIA 2120/120 or Microscopy | 25 |
| Monocyte, absolute | MONO | ×103/μL | ADVIA 2120/120 or Microscopy | 50 |
| Basophil, absolute | BASO | ×103/μL | ADVIA 2120/120 or Microscopy | 50 |
| Eosinophil, absolute | EO | ×103/μL | ADVIA 2120/120 or Microscopy | 50 |
| Large unstained cell, absolute | LUC | ×103/μL | ADVIA 2120/120 | 50 |
| Neutrophil percent | NEUT_P | % | ADVIA 2120/120 or Microscopy | |
| Lymphocyte, percent | LYM_P | % | ADVIA 2120/120 or Microscopy | |
| Monocyte, percent | MONO_P | % | ADVIA 2120/120 or Microscopy | |
| Basophil, percent | BASO_P | % | ADVIA 2120/120 or Microscopy | |
| Eosinophil, percent | EO_P | % | ADVIA 2120/120 or Microscopy | |
| Large unstained cell, percent | LUC_P | % | ADVIA 2120/120 | |
| Reticulocytes, absolute | RETIC | ×103/μL | Calculation | 25 |
| Coagulation analytes | Abbreviation | Units | Platform | |
|---|---|---|---|---|
| Prothrombin time | PT | Seconds | Diagnostica Stago | 15 |
| Activated partial thromboplastin time | APTT | Seconds | Diagnostica Stago | 15 |
| Fibrinogen | FIB | mg/dL | Diagnostica Stago | 20 |
| Serum biochemistry analytes | Abbreviation | Units | Methodology | |
|---|---|---|---|---|
| Creatinine | CREA | mg/dL | Kinetic Alkaline Picrate | 20 |
| Urea nitrogen | BUN | mg/dL | Urease | 20 |
| Aspartate aminotransferase | AST | U/L | Modified IFCC | 30 |
| Alanine aminotransferase | ALT | U/L | Modified IFCC | 30 |
| Gamma glutamyltransferase | GGT | U/L | Modified IFCC | 20 |
| Alkaline phosphatase | ALP | U/L | Modified IFCC | 30 |
| Total bilirubin | TBIL | mg/dL | Vanadate Oxidation | 25 |
| Bile acids | BILE_AC | μmol/L | Thio NAD | |
| Total protein | TP | g/dl | Biuret | 15 |
| Albumin | ALB | g/dL | BCG Dye Binding | 15 |
| Globulin | GLOB | g/dL | Calculated | 15 |
| Albumin/globulin ratio | AG | Calculated | ||
| Glucose | GLUC | mg/dL | Hexokinase | 20 |
| Cholesterol | CHOL | mg/dL | Enzymatic | 20 |
| Triglycerides | TRIG | mg/dL | Modified Trinder | 25 |
| Phosphorus | PHOS | mg/dL | Phosphomolybdate | 20 |
| Calcium | CA | mg/dL | Arsenazo III | 10 |
| Chloride | CL | mmol/L | Ion‐Selective Electrode | 5 |
| Sodium | NA | mmol/L | Ion‐Selective Electrode | 5 |
| Potassium | K | mmol/L | Ion‐Selective Electrode | 10 |
| Amylase | AMYL | U/L | Ethylidene Blocked –pNPG7 | |
| Lipase | LIP | U/L | Colorimetric Rate | |
| Insulin | INS | uIU/mL | Sandwich Immunoassay | |
| Magnesium | MG | mg/dL | Xylidyl Blue | |
| Thyroid stimulating hormone | TSH | μIU/mL | Competitive Immunoassay | |
| Total T3 | T3 | ug/dL | UPLC‐MS/MS | |
| Total T4 | T4 | ug/dL | UPLC‐MS/MS | |
| C‐Reactive protein, high sensitivity | CRPHS | mg/L | Sandwich Immunoassay |
Note: Bold analytes are considered major analytes that were given equivalency factors as shown.
2.4. Study groups
For body weight comparisons, animals were grouped semi‐yearly from 2 to <3 years of age and yearly from 3 to 10 years of age. Age groups and the number of animals per age group are presented in Figure 1. For hematologic, coagulation, and serum biochemical analyses, animals were grouped into the following 4 age categories: 2 to <3 years (111 males; 55 females), 3 to <4 years (435 males; 392 females), 4 to <5 years (165 males; 182 females), and 5 to 10 years (149 males; 175 females) of age for each sex. Body weight and clinical pathology comparisons were made by age group and between male and female animals.
FIGURE 1.

Animal numbers per age group. Of the 1819 animals (956 males and 863 females), the ages ranged from 2.2 to 9.6 years for males and 2.2 to 10 years for females. The mean age was 4.0 years for males and 4.3 years for females
2.5. Statistical analysis
The differences in body weights among age groups and between sex were analyzed using the two‐sided t test. Endpoints were assigned to each animal as the value corresponding to the measurement taken closest to the study start. Each value was then log‐transformed to normalize the data.
The differences in mean clinical pathology analyte values among age groups and between sex groups were analyzed using equivalence testing (ie, two one‐sided t tests, or TOST). For equivalence testing, a subjective equivalency factor or threshold was assigned to common or major (as defined in the blood collection and analysis section) analytes, based on the expected biological equivalence or variation range of individual analytes in Mauritian cynomolgus monkeys (Table 1). The thresholds were specified in percentages predetermined for a set of relevant analyte values and used to specify upper and lower equivalence bounds. Differences that did not fall inside the equivalence bounds suggested biologically meaningful differences. For each analyte, an equivalence test was run on every pair of the different age groups using the R package TOSTER. 21 Each test generated an accompanying graph that contained a 90% confidence interval. In addition, a Kolmogorov–Smirnov test was run to test the difference in the distribution, and an empirical cumulative distribution function graph was created. Values that were not equivalent had a P‐value of 0.05 and appeared to be outside of normal biological variation were included and discussed in the results.
The other hematologic analytes (mean cell volume [MCV], mean corpuscular hemoglobin [MCH], mean corpuscular hemoglobin concentration [MCHC], red blood cell distribution width [RDW], mean platelet volume [MPV], and white blood cell percentages) and serum biochemistry analytes (bile acid, amylase, lipase, insulin, TSH, T3, T4, high sensitivity C‐reactive protein, and magnesium) were considered minor analytes. There were fewer numbers of historical controls or background data for some of these analytes in our facility and some of these analytes are not as relevant in nonclinical toxicity studies, so we were unable to create equivalency values. Thus, we did not include these analytes in the statistical analysis regarding age‐ or sex‐related differences.
The RI calculations were conducted separately for each sex. Outliers were first identified for each analyte in each age group and removed. 22 For parameters with sample sizes of n > 120 after the outlier removal, the nonparametric method was used for the RI by calculating the 2.5th and 97.5th percentiles as the lower and upper reference limits, respectively. For 20 ≤ n ≤ 120, when a parameter was normally distributed (ie, when the normality test P‐value was >0.3 on either the raw or logarithmic scale), the parametric method was used; when normality did not hold (ie, when the normality test P‐value was ≤0.3), a robust method was used. 23 RIs were calculated for all (major and minor) parameters as long as all sample sizes were n > 40. When the final sample size was less than 20, only descriptive statistics were reported. For a few parameters, only one animal was available per sex, and thus no statistics were included. The RI calculations were conducted using the R package RIs. The 95% coverage criterion was used for all the methods, and 90% confidence intervals were calculated for the lower and upper RIs. All the RI calculations were conducted by age group, which were divided into 2 to <3 years and 3 to <4 years of age.
3. RESULTS
3.1. Age‐ and sex‐related changes in body weights
Body weights per age group are presented in Figure 2. A total of 1819 animals ranged in age from 2.2 to 9.6 years for males (n = 960 or 52.8%) and 2.2 to 12.4 years for females (n = 859 or 47.2%). The mean age was 4.0 years for males and 4.3 years for females. Body weights were statistically higher (P < 0.01) in males than in females in all age groups from 2 to 10 years (Figure 2), suggesting that sexual dimorphism in body weights begins as early as 2 years of age. The sexual dimorphism in body weights became prominent after 4 years of age. Body weights reached peak values at 7 to 8 years of age in both males (7.9 kg) and females (5.5 kg), with a 2.4 kg difference in the peak mean body weights.
FIGURE 2.

Animal body weights (kg) per age group. The group mean body weights were statistically higher (P < 0.01) in males than females for all age groups from 2 to 10 years. Body weights peaked at 7 to 8 years of age in both males (7.9 kg) and females (5.5 kg)
3.2. Sex‐related changes in hematologic, coagulation, and serum biochemistry analytes
Sex‐related mean hematologic differences were limited to higher reticulocyte (RETIC) counts in females than males in some age groups. As shown in Figure 3, the RETIC index trended higher in females than males, and females had statistically higher RETIC indices than males from 3 to 10 years of age. There were no sex‐related changes in the mean coagulation analytes.
FIGURE 3.

The sex‐ and age‐related differences in reticulocyte (RETIC) counts. The group mean RETIC counts were statistically higher (#) in females than males in the 3 to 10 years of age groups. In females, the group mean RETIC counts were statistically higher (*) in animals 5 to 10 years of age than in those 2 to <4 years of age. In males, the group mean RETIC counts were statistically higher (*) in animals 4 to 10 years of age than in those 2 to <4 years of age
Sex‐related mean serum biochemistry differences included higher ALP and GGT activities in males than females in all age groups, as well as higher creatinine concentrations in males than females and higher triglyceride and cholesterol concentrations in females than males in some age groups. As shown in Figures 5, 6, 7, males had statistically higher ALP activity, GGT activity, and creatinine levels (from 2 to 10 years, 2 to 10 years, and 5 to 10 years of age, respectively) than females of the same age groups. Females had statistically higher triglyceride levels than males from 4 to 10 years of age, as shown in Figure 8. As shown in Figure 9, the cholesterol concentration trended higher in females than males, and females had statistically higher cholesterol levels than males from 5 to 10 years of age.
FIGURE 5.

The sex‐ and age‐related differences in alkaline phosphatase (ALP) activity. The group mean ALP activity was statistically higher (#) in males than females for all age groups 2 to 10 years. In males and females, the group mean ALP activity was statistically lower (*) in animals 3 to 10 years of age than in those 2 to <3 years of age
FIGURE 6.

The sex‐ and age‐related differences in gamma‐glutamyl transferase (GGT) activity. The group mean GGT activity was statistically higher (#) in males than females for all age groups 2 to 10 years. In males, the group mean GGT activity was statistically lower (*) in animals 4 to 10 years of age than in those 2 to <4 years of age. In females, the group mean GGT activity was statistically lower (*) in animals 3 to 10 years than in those 2 to <3 years of age.
FIGURE 7.

The sex‐ and age‐related differences in serum creatinine concentration. The group mean creatinine concentration was statistically higher (#) in males than females in the 5 to 10 years of age group. In males, the group mean creatinine concentration was statistically higher (*) in animals 4 to 10 years of age than in those 2 to <4 years of age
FIGURE 8.

The sex‐ and age‐related differences in serum triglyceride concentration. The group mean triglyceride concentration was statistically higher (#) in females than males in the 4 to 10 years of age groups. In females, the group mean triglyceride concentration was statistically higher (*) in animals 5 to 10 years of age than in those 2 to <3 years of age
FIGURE 9.

The sex‐related differences in serum cholesterol concentration. The group mean cholesterol concentration was statistically higher (#) in females than males in the 5 to 10 years of age group
Sex‐related changes occurred in mean hematologic and serum biochemistry analyte values. Higher ALP and GGT activities were seen in males compared with females from 2 to 10 years of age, higher RETIC values were seen in females compared with males from 3 to 10 years of age, higher triglyceride concentrations were seen in females than males from 4 to 10 years of age, and higher creatinine concentrations were seen in males than females and higher cholesterol concentrations were seen in females compared with males from 5 to 10 years of age.
3.3. Age‐related changes in hematologic, coagulation, and serum biochemistry analytes
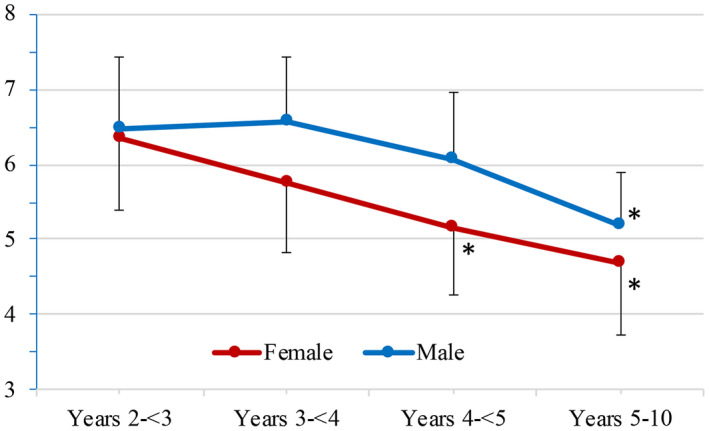
Age‐related mean hematologic differences were observed in some age groups and included higher RETIC counts and lower lymphocyte counts in both sexes. As shown in Figure 3, RETIC values generally increased with age and were statistically higher in males 4 to 10 years of age and females 5 to 10 years of age (vs males and females 2 to <4 years of age). As shown in Figure 4, lymphocyte counts were comparable from 2 to 5 years of age but were statistically lower in males and females 5 to 10 years of age (vs males 4 to <5 years of age and females 2 to <3 years of age, respectively). There were no age‐related changes in mean coagulation analytes
FIGURE 4.

The age‐related differences in lymphocyte counts. The group mean lymphocyte counts were statistically lower (*) in male and female animals 5 to 10 years of age than in those 4 to <5 and 2 to <3 years of age, respectively
Age‐related differences in mean serum biochemistry analytes were observed in some age groups. These included lower ALP and GGT activities, and phosphorus and globulin concentrations in both sexes, as well as higher creatinine concentrations in males and triglyceride concentrations in females. As shown in Figures 5 and 6, ALP and GGT activities generally decreased with age; there were statistically significant decreases in ALP activity in males and females 3 to 10 years of age (vs males and females 2 to <3 years of age) and statistically significant decreases in GGT activity in males 4 to 10 years of age and females 3 to 10 years of age (vs males 2 to <4 years of age and females 2 to <3 years of age, respectively). As shown in Figure 7, statistically significant age‐related increases in creatinine concentrations were seen in males 4 to 10 years of age (vs males 2 to <4 years of age). Statistically significant increases in triglyceride concentrations were seen in females 5 to 10 years of age (vs females 2 to <3 years of age), as shown in Figure 8. There were statistically significant decreases in phosphorus concentrations in males 5 to 10 years of age and females 4 to 10 years of age (vs males and females 2 to <4 years of age), as shown in Figure 10. As shown in Figure 11, statistically significant lower globulin concentrations were found in males and females 2 to <3 years of age (vs. males and females 3 to 10 years of age).
FIGURE 10.
The age‐related differences in serum phosphorus concentration. In males, the group mean serum phosphorus concentration was statistically lower (*) in animals 5 to 10 years of age than in those 2 to <4 years of age. In females, the group mean serum phosphorus concentration was statistically lower (*) in animals 4 to 10 years of age than in those 2 to <4 years of age
FIGURE 11.

The age‐related differences in serum globulin concentration. The group mean globulin concentration was statistically lower (*) in males and females 2 to <3 years of age than in those 3 to 10 years of age
Age‐related changes were seen in mean hematologic and serum biochemical analytes. Globulin concentrations were lower in both sexes 2 to <3 years of age compared to older animals. ALP activity was lower in both sexes 3 to 10 years of age compared with younger animals. GGT activity was lower in males 4 to 10 years of age and females 3 to 10 years of age compared with younger males and females. Creatinine concentrations were higher in males 4 to 10 years of age compared with younger males. Phosphorus concentrations were lower in males 5 to 10 years of age and females 4 to 10 years of age compared with younger males and females. RETIC values were higher in males 4 to 10 years of age and females 5 to 10 years of age compared with younger males and females. Triglyceride values were higher in females 5 to 10 years of age compared with younger females. Finally, lymphocyte numbers were lower in both sexes at 5 to 10 years of age compared with younger animals.
3.4. Hematologic, coagulation, and serum biochemical reference intervals.
RIs for clinical pathology analytes for the 2 to <3 years of age and 3 to <4 years of age groups were provided since these are the most typical age groups used in nonclinical safety studies (Tables 2, 3, 4, 5, 6, 7).
TABLE 2.
Reference intervals of hematologic analytes for 2‐ to <3‐year‐old cynomolgus monkeys
| Descriptive statistics | Reference interval (RI) and confidence interval (CI) | |||||||||||
|---|---|---|---|---|---|---|---|---|---|---|---|---|
| Analyte | Sex | Initial N | Final N | Mean | SD | Median | Min | Max | LRL of RI (2.5%) | URL of RI (2.5%) | CI 90% of LRL | CI 90% of URL |
| RBC | M | 111 | 110 | 6.82 | 0.43 | 6.85 | 5.76 | 7.9 | 5.97 | 7.66 | (5.86, 6.09) | (7.55, 7.78) |
| RBC | F | 54 | 52 | 6.58 | 0.47 | 6.63 | 5.52 | 7.53 | 5.65 | 7.5 | (5.47, 5.84) | (7.31, 7.68) |
| HGB | M | 111 | 109 | 13.44 | 0.62 | 13.4 | 11.9 | 14.9 | 12.23 | 14.66 | (12.06, 12.39) | (14.49, 14.83) |
| HGB | F | 54 | 53 | 13.00 | 0.86 | 13 | 11.4 | 14.7 | 11.31 | 14.68 | (10.98, 11.65) | (14.35, 15.01) |
| HCT | M | 111 | 109 | 46.29 | 1.96 | 46.4 | 41.6 | 50.1 | 42.42 | 50.25 | (41.91, 42.96) | (49.78, 50.77) |
| HCT | F | 54 | 52 | 45.37 | 2.92 | 45.05 | 39.5 | 51.6 | 39.65 | 51.09 | (38.51, 40.78) | (49.95, 52.23) |
| MCV | M | 111 | 108 | 67.85 | 2.97 | 67.9 | 60.7 | 74.3 | 62.03 | 73.68 | (61.22, 62.83) | (72.87, 74.48) |
| MCV | F | 54 | 49 | 68.18 | 2.24 | 68.3 | 63.7 | 72.9 | 63.79 | 72.57 | (62.90, 64.69) | (71.67, 73.47) |
| MCH | M | 111 | 107 | 19.73 | 0.93 | 19.8 | 17.5 | 22 | 17.91 | 21.55 | (17.66, 18.16) | (21.30, 21.80) |
| MCH | F | 54 | 52 | 19.49 | 0.81 | 19.5 | 18 | 21.4 | 17.92 | 21.07 | (17.60, 18.23) | (20.76, 21.39) |
| MCHC | M | 111 | 106 | 29.01 | 0.86 | 28.9 | 27.3 | 31.2 | 27.24 | 30.7 | (27.00, 27.45) | (30.45, 30.96) |
| MCHC | F | 54 | 52 | 28.56 | 0.82 | 28.65 | 26.8 | 30.3 | 26.95 | 30.18 | (26.62, 27.27) | (29.86, 30.50) |
| RDW | M | 111 | 110 | 14.28 | 0.97 | 14.1 | 12 | 16.5 | 12.27 | 16.22 | (12.01, 12.50) | (15.96, 16.54) |
| RDW | F | 54 | 54 | 14.18 | 0.98 | 14.25 | 12.5 | 16.4 | 12.25 | 16.11 | (11.88, 12.63) | (15.73, 16.48) |
| PLT | M | 111 | 104 | 368.54 | 52.72 | 364 | 235 | 501 | 265.21 | 471.87 | (250.68, 279.74) | (457.33, 486.40) |
| PLT | F | 54 | 50 | 393.84 | 62.11 | 391.5 | 274 | 548 | 272.1 | 515.58 | (247.41, 296.79) | (490.89, 540.27) |
| MPV | M | 111 | 109 | 8.73 | 1.09 | 8.5 | 7 | 11.4 | 6.39 | 10.83 | (6.09, 6.64) | (10.48, 11.20) |
| MPV | F | 54 | 51 | 8.69 | 0.92 | 8.6 | 7 | 10.7 | 6.71 | 10.46 | (6.35, 6.99) | (10.02, 10.85) |
| WBC | M | 111 | 105 | 11.48 | 2.86 | 11.5 | 6.4 | 19.2 | 5.66 | 17.06 | (4.91, 6.39) | (16.29, 17.91) |
| WBC | F | 54 | 49 | 11.05 | 2.29 | 10.8 | 6.1 | 15.9 | 6.56 | 15.53 | (5.64, 7.48) | (14.61, 16.45) |
| NEUT | M | 111 | 106 | 4.79 | 2.49 | 4.32 | 1.19 | 11.29 | BFA | 9.47 | BFA | (8.66, 10.31) |
| NEUT | F | 54 | 49 | 4.43 | 1.51 | 4.19 | 2.36 | 8.11 | 1.11 | 7.34 | (0.55, 1.79) | (6.61, 8.13) |
| LYM | M | 111 | 107 | 5.87 | 1.68 | 5.82 | 2.21 | 10.14 | 2.57 | 9.17 | (2.11, 3.03) | (8.71, 9.63) |
| LYM | F | 54 | 52 | 5.74 | 1.59 | 5.59 | 2.81 | 9.28 | 2.63 | 8.85 | (2.01, 3.25) | (8.23, 9.47) |
| MONO | M | 111 | 106 | 0.37 | 0.12 | 0.35 | 0.15 | 0.67 | 0.12 | 0.59 | (0.09, 0.15) | (0.55, 0.63) |
| MONO | F | 54 | 52 | 0.40 | 0.14 | 0.39 | 0.16 | 0.74 | 0.09 | 0.68 | (0.04, 0.14) | (0.62, 0.75) |
| BASO | M | 111 | 106 | 0.03 | 0.01 | 0.03 | 0.01 | 0.06 | 0 | 0.06 | (0.00, 0.01) | (0.06, 0.06) |
| BASO | F | 54 | 50 | 0.03 | 0.01 | 0.03 | 0.01 | 0.06 | 0.01 | 0.06 | (0.00, 0.01) | (0.05, 0.06) |
| EO | M | 111 | 104 | 0.18 | 0.14 | 0.15 | 0.01 | 0.56 | BFA | 0.44 | BFA | (0.39, 0.50) |
| EO | F | 54 | 50 | 0.17 | 0.13 | 0.13 | 0.02 | 0.46 | BFA | 0.42 | BFA | (0.35, 0.50) |
| LUC | M | 111 | 105 | 0.10 | 0.05 | 0.1 | 0.02 | 0.21 | 0.01 | 0.19 | BFA | (0.18, 0.20) |
| LUC | F | 54 | 51 | 0.10 | 0.03 | 0.09 | 0.04 | 0.18 | 0.02 | 0.16 | (0.01, 0.03) | (0.15, 0.18) |
| NEUT_P | M | 111 | 111 | 41.12 | 15.77 | 40.85 | 13.97 | 77.83 | 8.96 | 71.81 | (5.26, 12.34) | (67.47, 76.12) |
| NEUT_P | F | 54 | 52 | 41.40 | 11.81 | 40.92 | 18.09 | 68.84 | 18.26 | 64.54 | (13.66, 22.86) | (59.94, 69.14) |
| LYM_P | M | 111 | 111 | 52.22 | 14.36 | 53.03 | 20.33 | 78.59 | 24.03 | 81.34 | (20.11, 27.75) | (78.02, 84.77) |
| LYM_P | F | 54 | 52 | 51.79 | 10.64 | 52.12 | 25.79 | 71.23 | 30.38 | 73.62 | (26.58, 35.20) | (69.26, 77.24) |
| MONO_P | M | 111 | 109 | 3.27 | 0.92 | 3.10 | 1.45 | 5.47 | 1.35 | 5.07 | (1.11, 1.55) | (4.81, 5.39) |
| MONO_P | F | 54 | 52 | 3.39 | 1.01 | 3.40 | 1.59 | 5.36 | 1.34 | 5.43 | (0.99, 1.68) | (5.07, 5.78) |
| BASO_P | M | 111 | 109 | 0.27 | 0.08 | 0.28 | 0.08 | 0.47 | 0.11 | 0.44 | (0.09, 0.14) | (0.42, 0.47) |
| BASO_P | F | 54 | 51 | 0.28 | 0.08 | 0.28 | 0.11 | 0.48 | 0.12 | 0.44 | (0.09, 0.15) | (0.41, 0.47) |
| EO_P | M | 111 | 104 | 1.62 | 1.31 | 1.21 | 0.07 | 5.41 | BFA | 4.07 | BFA | (3.55, 4.65) |
| EO_P | F | 54 | 52 | 1.61 | 1.21 | 1.24 | 0.14 | 4.37 | BFA | 3.8 | BFA | (3.02, 4.45) |
| LUC_P | M | 111 | 105 | 0.89 | 0.37 | 0.89 | 0.20 | 1.71 | 0.15 | 1.62 | (0.06, 0.24) | (1.52, 1.72) |
| LUC_P | F | 54 | 52 | 0.87 | 0.25 | 0.85 | 0.30 | 1.30 | 0.37 | 1.36 | (0.27, 0.47) | (1.26, 1.46) |
| RETIC | M | 111 | 105 | 31.07 | 12.64 | 29 | 12 | 67 | 4.49 | 55.57 | (1.27, 7.79) | (51.53, 60.05) |
| RETIC | F | 54 | 48 | 33.42 | 12.43 | 32 | 15 | 65 | 6.53 | 57.46 | (1.96, 12.52) | (51.40, 63.45) |
Note: See Table 1 for abbreviations of individual analytes.
Abbreviations: BFA, beyond the feasibility of analysis; CI, confidence interval; F, female; LRI, lower reference limit; M, male; N, animal number/sample size; RI, reference interval; SD, standard deviation; URI, upper reference limit.
TABLE 3.
Reference intervals of hematologic analytes for 3‐ to <4‐year‐old cynomolgus monkeys
| Descriptive statistics | Reference interval (RI) and confidence interval (CI) | |||||||||||
|---|---|---|---|---|---|---|---|---|---|---|---|---|
| Analyte | Sex | Initial N | Final N | Mean | SD | Median | Min | Max | LRL of RI (2.5%) | URL of RI (2.5%) | CI 90% of LRL | CI 90% of URL |
| RBC | M | 435 | 429 | 6.77 | 0.41 | 6.75 | 5.65 | 7.83 | 6.05 | 7.6 | (5.98, 6.10) | (7.54, 7.75) |
| RBC | F | 392 | 388 | 6.47 | 0.49 | 6.47 | 5.13 | 7.83 | 5.5 | 7.45 | (5.35, 5.64) | (7.31, 7.55) |
| HGB | M | 435 | 434 | 13.63 | 0.74 | 13.6 | 11.6 | 15.7 | 12.29 | 15.1 | (12.10, 12.40) | (15.00, 15.20) |
| HGB | F | 392 | 388 | 12.88 | 0.78 | 12.9 | 10.7 | 15.1 | 11.2 | 14.33 | (11.10, 11.40) | (14.10, 14.40) |
| HCT | M | 435 | 434 | 46.4 | 2.7 | 46.3 | 39.7 | 53.3 | 41.2 | 51.7 | (41.0, 41.9) | (51.1, 52.5) |
| HCT | F | 392 | 388 | 44.8 | 2.9 | 44.8 | 36.5 | 52.9 | 39.3 | 50.5 | (38.1, 39.8) | (49.9, 51.2) |
| MCV | M | 435 | 432 | 68.6 | 3.5 | 68.5 | 58.5 | 78.8 | 61.7 | 75.7 | (61.0, 62.4) | (74.8, 76.7) |
| MCV | F | 392 | 390 | 69.1 | 3.8 | 69.1 | 58.8 | 79.4 | 61.1 | 77.5 | (59.4, 62.5) | (76.3, 78.1) |
| MCH | M | 435 | 432 | 20.2 | 1.1 | 20.1 | 17.1 | 23 | 18 | 22.3 | (17.9, 18.2) | (22.0, 22.6) |
| MCH | F | 392 | 387 | 19.9 | 1.1 | 19.9 | 17.1 | 22.8 | 17.8 | 21.9 | (17.5, 18.1) | (21.8, 22.4) |
| MCHC | M | 435 | 433 | 29.4 | 1.2 | 29.4 | 26.2 | 32.7 | 27.1 | 31.7 | (26.8, 27.4) | (31.5, 32.0) |
| MCHC | F | 392 | 388 | 28.8 | 1.1 | 28.8 | 25.9 | 31.9 | 26.6 | 30.9 | (26.3, 26.8) | (30.8, 31.4) |
| RDW | M | 435 | 432 | 14.29 | 0.95 | 14.25 | 12 | 17 | 12.58 | 16.2 | (12.30, 12.70) | (16.00, 16.40) |
| RDW | F | 392 | 388 | 14.11 | 0.99 | 14.1 | 11.2 | 16.7 | 12.27 | 16.1 | (12.20, 12.50) | (15.90, 16.30) |
| PLT | M | 434 | 431 | 383 | 71 | 379 | 200 | 579 | 246 | 523 | (237, 258) | (508, 534) |
| PLT | F | 389 | 385 | 409 | 79 | 400 | 232 | 630 | 256 | 574 | (245, 269) | (559, 601) |
| MPV | M | 434 | 427 | 8.7 | 1.1 | 8.5 | 6 | 11.9 | 6.9 | 11.1 | (6.7, 7.0) | (11.0, 11.5) |
| MPV | F | 389 | 382 | 8.8 | 1.2 | 8.8 | 5.9 | 12.1 | 6.8 | 11.6 | (6.4, 7.2) | (11.1, 11.9) |
| WBC | M | 427 | 420 | 12.3 | 3.2 | 12.1 | 5.5 | 21.8 | 7.1 | 20.1 | (6.7, 7.4) | (18.5, 21.1) |
| WBC | F | 392 | 387 | 12.3 | 3.4 | 11.8 | 3.8 | 22 | 6.8 | 19.9 | (6.0, 7.3) | (18.6, 20.7) |
| NEUT | M | 435 | 419 | 5.1 | 2.5 | 4.5 | 0.9 | 12.6 | 1.6 | 10.8 | (1.3, 1.8) | (10.2, 12.0) |
| NEUT | F | 392 | 385 | 5.8 | 3 | 5.1 | 1.1 | 14.4 | 1.7 | 12.8 | (1.3, 2.0) | (12.2, 13.5) |
| LYM | M | 435 | 430 | 6.1 | 1.8 | 5.8 | 1.9 | 11.4 | 2.9 | 10.2 | (2.6, 3.1) | (9.6, 10.7) |
| LYM | F | 392 | 391 | 5.6 | 1.6 | 5.3 | 2.2 | 10 | 3 | 9.3 | (2.4, 3.2) | (9.0, 9.5) |
| MONO | M | 435 | 419 | 0.4 | 0.14 | 0.38 | 0.12 | 0.82 | 0.18 | 0.74 | (0.17, 0.20) | (0.68, 0.78) |
| MONO | F | 392 | 381 | 0.42 | 0.15 | 0.41 | 0.1 | 0.88 | 0.18 | 0.77 | (0.16, 0.20) | (0.72, 0.79) |
| BASO | M | 435 | 424 | 0.035 | 0.016 | 0.03 | 0 | 0.08 | 0.01 | 0.07 | (0.01, 0.01) | (0.07, 0.08) |
| BASO | F | 392 | 379 | 0.035 | 0.014 | 0.03 | 0.01 | 0.07 | 0.01 | 0.07 | (0.01, 0.01) | (0.06, 0.07) |
| EO | M | 435 | 409 | 0.22 | 0.18 | 0.17 | 0.01 | 0.81 | 0.02 | 0.67 | (0.02, 0.03) | (0.62, 0.78) |
| EO | F | 392 | 369 | 0.3 | 0.2 | 0.2 | 0 | 0.9 | 0 | 0.8 | (0.0, 0.0) | (0.8, 0.9) |
| LUC | M | 435 | 424 | 0.105 | 0.043 | 0.1 | 0.02 | 0.23 | 0.04 | 0.21 | (0.03, 0.04) | (0.20, 0.22) |
| LUC | F | 392 | 384 | 0.108 | 0.045 | 0.1 | 0.02 | 0.23 | 0.04 | 0.21 | (0.04, 0.05) | (0.19, 0.22) |
| NEUT_P | M | 435 | 419 | 55 | 27 | 48 | 9 | 135 | 17 | 116 | (14, 19) | (110, 129) |
| NEUT_P | F | 392 | 385 | 62 | 32 | 55 | 12 | 155 | 19 | 138 | (14, 21) | (131, 145) |
| LYM_P | M | 435 | 430 | 65 | 20 | 63 | 20 | 123 | 31 | 109 | (28, 33) | (103, 115) |
| LYM_P | F | 392 | 391 | 60 | 17 | 57 | 23 | 107 | 32 | 100 | (26, 34) | (97, 102) |
| MONO_P | M | 435 | 419 | 4.4 | 1.5 | 4.1 | 1.3 | 8.8 | 1.9 | 8 | (1.8, 2.1) | (7.3, 8.4) |
| MONO_P | F | 392 | 381 | 4.5 | 1.6 | 4.4 | 1.1 | 9.5 | 1.9 | 8.3 | (1.7, 2.1) | (7.7, 8.5) |
| BASO_P | M | 435 | 424 | 0.38 | 0.17 | 0.32 | 0 | 0.86 | 0.11 | 0.75 | (0.11, 0.11) | (0.75, 0.86) |
| BASO_P | F | 392 | 379 | 0.37 | 0.15 | 0.32 | 0.11 | 0.75 | 0.11 | 0.75 | (0.11, 0.11) | (0.65, 0.75) |
| EO_P | M | 435 | 409 | 2.4 | 1.9 | 1.8 | 0.1 | 8.7 | 0.2 | 7.2 | (0.2, 0.3) | (6.7, 8.4) |
| EO_P | F | 392 | 369 | 2.9 | 2.2 | 2.3 | 0.2 | 9.8 | 0.5 | 8.7 | (0.3, 0.5) | (8.2, 9.3) |
| LUC_P | M | 435 | 424 | 1.13 | 0.46 | 1.08 | 0.22 | 2.47 | 0.43 | 2.26 | (0.32, 0.43) | (2.15, 2.37) |
| LUC_P | F | 392 | 384 | 1.16 | 0.49 | 1.08 | 0.22 | 2.47 | 0.43 | 2.26 | (0.43, 0.54) | (2.04, 2.37) |
| RETIC | M | 435 | 423 | 35 | 14 | 33 | 7 | 75 | 13 | 66 | (13, 13) | (64, 73) |
| RETIC | F | 392 | 380 | 44 | 18 | 42 | 12 | 98 | 14 | 86 | (13, 18) | (79, 89) |
Note: See Table 1 for abbreviations of individual analytes.
Abbreviations: CI, confidence interval; F, female; LRI, lower reference limit; M, male; N, animal number/sample size; RI, reference interval; SD, standard deviation; URI, upper reference limit.
TABLE 4.
Reference intervals of coagulation analytes for 2‐ to <3‐year‐old cynomolgus monkeys
| Descriptive Statistics | Reference interval (RI) and confidence interval (CI) | |||||||||||
|---|---|---|---|---|---|---|---|---|---|---|---|---|
| Analyte | Sex | Initial N | Final N | Mean | SD | Median | Minimal | Maximal | LRL of RI (2.5%) | URL of RI (2.5%) | CI 90% of LRL | CI 90% of URL |
| PT | M | 110 | 109 | 12.71 | 0.57 | 12.7 | 11.4 | 14 | 11.6 | 13.83 | (11.44, 11.75) | (13.68, 13.99) |
| PT | F | 53 | 52 | 12.39 | 0.51 | 12.4 | 11.4 | 13.5 | 11.39 | 13.39 | (11.19, 11.59) | (13.19, 13.59) |
| APTT | M | 110 | 108 | 22.29 | 1.23 | 22.2 | 19.3 | 24.9 | 19.76 | 24.67 | (19.45, 20.07) | (24.32, 25.06) |
| APTT | F | 53 | 52 | 21.73 | 1.05 | 21.75 | 19.4 | 23.8 | 19.67 | 23.78 | (19.26, 20.08) | (23.37, 24.19) |
| FIB | M | 110 | 104 | 189.14 | 23.64 | 186 | 130 | 245 | 142.81 | 235.48 | (136.29, 149.32) | (228.97, 242.00) |
| FIB | F | 53 | 51 | 176.08 | 17.95 | 174 | 140 | 214 | 140.9 | 211.25 | (133.84, 147.97) | (204.19, 218.32) |
Note: See Table 1 for abbreviations of individual analytes.
Abbreviations: CI, confidence interval; F, female; LRI, lower reference limit; M, male; N, animal number/sample size; RI, reference interval; SD, standard deviation; URI, upper reference limit.
TABLE 5.
Reference intervals of coagulation analytes for 3‐ to <4‐year‐old cynomolgus monkeys
| Descriptive Statistics | Reference interval (RI) and confidence interval (CI) | |||||||||||
|---|---|---|---|---|---|---|---|---|---|---|---|---|
| Analyte | Sex | Initial N | Final N | Mean | SD | Median | Minimal | Maximal | LRL of RI (2.5%) | URL of RI (2.5%) | CI 90% of LRL | CI 90% of URL |
| PT | M | 389 | 385 | 12.93 | 0.59 | 13 | 11.3 | 14.6 | 11.77 | 14.2 | (11.6, 11.9) | (13.9, 14.4) |
| PT | F | 377 | 369 | 12.71 | 0.54 | 12.7 | 11.3 | 14.2 | 11.7 | 13.9 | (11.60, 11.8) | (13.70, 14.0) |
| APTT | M | 390 | 383 | 22.4 | 1.4 | 22.2 | 19 | 26.2 | 20.2 | 25.5 | (19.7, 20.4) | (25.2, 26.0) |
| APTT | F | 377 | 366 | 22.2 | 1.3 | 22.2 | 19.2 | 25.8 | 19.9 | 25.1 | (19.7, 20.1) | (24.6, 25.3) |
| FIB | M | 390 | 383 | 195 | 26 | 193 | 129 | 265 | 151 | 247 | (136, 154) | (241, 256) |
| FIB | F | 377 | 367 | 182 | 26 | 181 | 115 | 249 | 129 | 236 | (125, 130) | (232, 241) |
Note: See Table 1 for abbreviations of individual analytes.
Abbreviations: CI, confidence interval; F, female; LRI, lower reference limit; M, male; N, animal number/sample size; RI, reference interval; SD, standard deviation; URI, upper reference limit.
TABLE 6.
Reference intervals of serum biochemistry and other serum analytes for 2‐ to <3‐year‐old cynomolgus monkeys
| Descriptive Statistics | Reference interval (RI) and confidence interval (CI) | |||||||||||
|---|---|---|---|---|---|---|---|---|---|---|---|---|
| Analyte | Sex | Initial N | Final N | Mean | SD | Median | Min | Max | LRL of RI (2.5%) | URL of RI (2.5%) | CI 90% of LRL | CI 90% of URL |
| CREA | M | 100 | 100 | 0.68 | 0.10 | 0.7 | 0.5 | 0.9 | 0.48 | 0.88 | (0.45, 0.51) | (0.86, 0.91) |
| CREA | F | 53 | 51 | 0.66 | 0.09 | 0.7 | 0.5 | 0.8 | 0.47 | 0.86 | (0.43, 0.50) | (0.83, 0.88) |
| BUN | M | 100 | 94 | 18.17 | 2.63 | 18 | 12 | 25 | 12.87 | 23.41 | (12.18, 13.76) | (22.64, 24.14) |
| BUN | F | 53 | 51 | 17.24 | 2.31 | 17 | 12 | 22 | 12.7 | 21.77 | (11.79, 13.61) | (20.86, 22.68) |
| AST | M | 100 | 98 | 44.49 | 8.54 | 44 | 26 | 64 | 27.76 | 61.22 | (25.33, 30.18) | (58.80, 63.64) |
| AST | F | 53 | 49 | 40.27 | 4.85 | 40 | 31 | 52 | 30.77 | 49.76 | (28.82, 32.71) | (47.82, 51.71) |
| ALT | M | 100 | 97 | 48.24 | 13.02 | 47 | 24 | 78 | 20.09 | 72.27 | (16.44, 22.78) | (67.50, 76.18) |
| ALT | F | 53 | 50 | 46.70 | 12.68 | 45 | 29 | 73 | 19.57 | 71.62 | (15.37, 24.51) | (66.24, 77.98) |
| GGT | M | 110 | 109 | 193.67 | 39.70 | 193 | 97 | 284 | 115.86 | 271.48 | (105.17, 126.55) | (260.79, 282.17) |
| GGT | F | 53 | 53 | 127.64 | 26.16 | 130 | 82 | 174 | 74.15 | 180.86 | (64.57, 82.73) | (172.13, 191.02) |
| ALP | M | 100 | 98 | 892.66 | 226.77 | 851.5 | 493 | 1436 | 415.93 | 1336.34 | (358.09, 474.91) | (1265.03, 1417.81) |
| ALP | F | 53 | 53 | 677.09 | 152.88 | 662 | 352 | 987 | 377.46 | 976.72 | (318.43, 436.49) | (917.69, 1035.75) |
| TBIL | M | 100 | 96 | 0.20 | 0.07 | 0.2 | 0.1 | 0.3 | 0.07 | 0.33 | (0.06, 0.09) | (0.31, 0.35) |
| TBIL | F | 53 | 50 | 0.23 | 0.09 | 0.2 | 0.1 | 0.4 | 0.05 | 0.41 | (0.01, 0.09) | (0.37, 0.44) |
| BILE_AC | M | 13 | 12 | 1.77 | 0.81 | 1.7 | 0.7 | 3.1 | NA | NA | (NA, NA) | (NA, NA) |
| BILE_AC | F | 5 | 4 | 2.70 | 2.40 | 1.9 | 0.8 | 6.2 | NA | NA | (NA, NA) | (NA, NA) |
| TP | M | 100 | 99 | 7.57 | 0.42 | 7.5 | 6.7 | 8.4 | 6.72 | 8.4 | (6.60, 6.81) | (8.29, 8.53) |
| TP | F | 53 | 53 | 7.42 | 0.48 | 7.4 | 6.6 | 8.5 | 6.42 | 8.36 | (6.25, 6.59) | (8.16, 8.57) |
| ALB | M | 100 | 98 | 4.66 | 0.21 | 4.7 | 4.2 | 5.1 | 4.24 | 5.11 | (4.17, 4.31) | (5.06, 5.18) |
| ALB | F | 53 | 52 | 4.55 | 0.19 | 4.5 | 4.2 | 4.9 | 4.14 | 4.95 | (4.05, 4.20) | (4.88, 5.04) |
| GLOB | M | 100 | 100 | 2.91 | 0.44 | 3 | 2 | 3.9 | 2.03 | 3.81 | (1.89, 2.14) | (3.72, 3.94) |
| GLOB | F | 53 | 52 | 2.84 | 0.40 | 2.85 | 2.2 | 3.7 | 2.01 | 3.65 | (1.87, 2.17) | (3.50, 3.82) |
| AG | M | 100 | 98 | 1.62 | 0.28 | 1.6 | 1.2 | 2.3 | 1.05 | 2.16 | (0.99, 1.15) | (2.07, 2.26) |
| AG | F | 53 | 51 | 1.61 | 0.23 | 1.6 | 1.1 | 2.1 | 1.16 | 2.05 | (1.07, 1.25) | (1.96, 2.14) |
| GLUC | M | 100 | 93 | 68.67 | 8.17 | 69 | 51 | 91 | 52.66 | 84.67 | (50.28, 55.04) | (82.29, 87.05) |
| GLUC | F | 53 | 51 | 77.59 | 12.09 | 78 | 54 | 102 | 53.89 | 101.28 | (49.13, 58.65) | (96.53, 106.04) |
| CHOL | M | 100 | 99 | 102.67 | 19.80 | 99 | 57 | 151 | 61.39 | 141.77 | (56.02, 66.25) | (135.70, 149.02) |
| CHOL | F | 53 | 50 | 113.02 | 13.01 | 112.5 | 84 | 141 | 87.52 | 138.52 | (82.35, 92.69) | (133.35, 143.69) |
| TRIG | M | 100 | 93 | 45.04 | 9.47 | 44 | 26 | 69 | 25.24 | 63.32 | (22.57, 27.59) | (60.36, 66.53) |
| TRIG | F | 53 | 51 | 47.82 | 11.32 | 48 | 26 | 71 | 25.64 | 70 | (21.19, 30.10) | (65.55, 74.46) |
| PHOS | M | 100 | 97 | 6.46 | 0.86 | 6.5 | 4.4 | 8.6 | 4.77 | 8.15 | (4.52, 5.02) | (7.90, 8.39) |
| PHOS | F | 53 | 51 | 6.23 | 0.82 | 6.1 | 4.5 | 7.8 | 4.58 | 7.94 | (4.23, 4.89) | (7.65, 8.26) |
| CA | M | 100 | 96 | 10.16 | 0.29 | 10.2 | 9.5 | 10.8 | 9.58 | 10.75 | (9.47, 9.67) | (10.68, 10.83) |
| CA | F | 53 | 53 | 10.04 | 0.37 | 10 | 9.3 | 10.7 | 9.29 | 10.79 | (9.17, 9.42) | (10.66, 10.93) |
| CL | M | 110 | 106 | 107.53 | 1.64 | 107 | 104 | 111 | 104.03 | 110.9 | (103.52, 104.36) | (110.52, 111.47) |
| CL | F | 53 | 52 | 108.40 | 1.75 | 108 | 105 | 112 | 104.78 | 112.07 | (104.03, 105.37) | (111.46, 112.86) |
| NA | M | 110 | 108 | 148.14 | 2.06 | 148 | 143 | 153 | 143.98 | 152.2 | (143.46, 144.63) | (151.58, 152.73) |
| NA | F | 53 | 52 | 146.81 | 1.77 | 146 | 143 | 150 | 142.64 | 150.55 | (141.69, 143.08) | (149.94, 151.55) |
| K | M | 110 | 103 | 4.23 | 0.32 | 4.2 | 3.5 | 5 | 3.57 | 4.86 | (3.48, 3.66) | (4.76, 4.95) |
| K | F | 53 | 48 | 4.26 | 0.29 | 4.25 | 3.7 | 4.9 | 3.63 | 4.82 | (3.50, 3.71) | (4.68, 4.93) |
| AMYL | M | 14 | 13 | 325.15 | 99.00 | 301 | 206 | 520 | NA | NA | (NA, NA) | (NA, NA) |
| AMYL | F | 1 | 1 | NA | NA | NA | NA | NA | NA | NA | (NA, NA) | (NA, NA) |
| LIPASE | M | 14 | 14 | 17.21 | 4.10 | 15 | 13 | 24 | NA | NA | (NA, NA) | (NA, NA) |
| LIPASE | F | 1 | 1 | NA | NA | NA | NA | NA | NA | NA | (NA, NA) | (NA, NA) |
| CRPHS | M | 15 | 14 | 1.20 | 0.52 | 1.15 | 0.3 | 1.9 | NA | NA | (NA, NA) | (NA, NA) |
| CRPHS | F | 10 | 9 | 1.07 | 0.77 | 0.8 | 0.2 | 2.6 | NA | NA | (NA, NA) | (NA, NA) |
Note: See Table 1 for abbreviations of individual analytes.
Abbreviations: CI, confidence interval; F, female; LRI, lower reference limit; M, male; N, animal number/sample size; NA, not applicable; RI, reference interval; SD, standard deviation; URI, upper reference limit.
TABLE 7.
Reference intervals of serum biochemistry and other serum analytes for 3‐ to <4‐year‐old cynomolgus monkeys
| Descriptive statistics | Reference interval (RI) and confidence interval (CI) | |||||||||||
|---|---|---|---|---|---|---|---|---|---|---|---|---|
| Analyte | Sex | Initial N | Final N | Mean | SD | Median | Min | Max | LRL of RI (2.5%) | URL of RI (2.5%) | CI 90% of LRL | CI 90% of URL |
| CREA | M | 322 | 319 | 0.79 | 0.13 | 0.8 | 0.5 | 1.1 | 0.6 | 1 | (0.50, 0.60) | (1.00, 1.10) |
| CREA | F | 303 | 300 | 0.75 | 0.11 | 0.8 | 0.5 | 1 | 0.6 | 1 | (0.50, 0.60) | (0.90, 1.00) |
| BUN | M | 322 | 317 | 18.4 | 2.5 | 18 | 12 | 25 | 14 | 23.1 | (13.0, 14.0) | (23.0, 25.0) |
| BUN | F | 303 | 291 | 18.3 | 2.5 | 18 | 11 | 25 | 14 | 23.7 | (13.0, 15.0) | (23.0, 24.0) |
| AST | M | 322 | 321 | 39.7 | 8 | 39 | 20 | 61 | 26 | 57 | (25.0, 28.0) | (55.0, 59.0) |
| AST | F | 303 | 295 | 35.6 | 6.7 | 35 | 20 | 54 | 23.4 | 49.6 | (21.0, 25.0) | (48.0, 54.0) |
| ALT | M | 322 | 310 | 42 | 12 | 40 | 19 | 79 | 21 | 68 | (19, 22) | (64, 75) |
| ALT | F | 303 | 283 | 46 | 16 | 42 | 19 | 98 | 22 | 86 | (19, 25) | (80, 97) |
| GGT | M | 403 | 396 | 178 | 38 | 174 | 94 | 286 | 106 | 263 | (100, 117) | (253, 273) |
| GGT | F | 379 | 373 | 93 | 17 | 91 | 53 | 143 | 64 | 130 | (61, 67) | (128, 134) |
| ALP | M | 322 | 319 | 824 | 215 | 797 | 396 | 1393 | 467 | 1310 | (420, 490) | (1267, 1375) |
| ALP | F | 303 | 298 | 426 | 113 | 410 | 191 | 735 | 237 | 670 | (214, 256) | (630, 711) |
| TBIL | M | 322 | 308 | 0.19 | 0.063 | 0.2 | 0.1 | 0.3 | 0.1 | 0.3 | (0.100, 0.100) | (0.300, 0.300) |
| TBIL | F | 301 | 278 | 0.181 | 0.063 | 0.2 | 0.1 | 0.3 | 0.1 | 0.3 | (0.100, 0.100) | (0.300, 0.300) |
| BILE_AC | M | 93 | 84 | 2.5 | 1.5 | 2.4 | 0.4 | 6.5 | BFA | 5.4 | BFA | (4.9, 5.9) |
| BILE_AC | F | 87 | 79 | 2.8 | 1.5 | 2.5 | 0.4 | 6.9 | BFA | 5.7 | BFA | (5.2, 6.3) |
| TP | M | 322 | 319 | 7.8 | 0.46 | 7.8 | 6.6 | 8.9 | 6.8 | 8.6 | (6.70, 7.00) | (8.60, 8.70) |
| TP | F | 303 | 301 | 7.85 | 0.42 | 7.9 | 6.7 | 8.9 | 6.9 | 8.6 | (6.70, 7.00) | (8.50, 8.80) |
| ALB | M | 322 | 314 | 4.65 | 0.21 | 4.65 | 4.1 | 5.2 | 4.2 | 5.1 | (4.20, 4.30) | (5.00, 5.20) |
| ALB | F | 303 | 302 | 4.47 | 0.22 | 4.5 | 4 | 5 | 4 | 4.9 | (4.00, 4.10) | (4.90, 5.00) |
| GLOB | M | 322 | 322 | 3.12 | 0.41 | 3.2 | 2.1 | 4 | 2.3 | 3.9 | (2.10, 2.30) | (3.80, 3.90) |
| GLOB | F | 303 | 303 | 3.37 | 0.41 | 3.4 | 2.3 | 4.5 | 2.4 | 4.1 | (2.40, 2.60) | (4.00, 4.30) |
| AG | M | 309 | 303 | 1.5 | 0.21 | 1.5 | 1.1 | 2 | 1.2 | 2 | (1.20, 1.20) | (2.00, 2.00) |
| AG | F | 297 | 293 | 1.34 | 0.19 | 1.3 | 1 | 1.8 | 1.04 | 1.8 | (1.00, 1.10) | (1.70, 1.80) |
| GLUC | M | 322 | 315 | 76 | 14 | 73 | 40 | 114 | 53 | 109 | (51, 56) | (106, 112) |
| GLUC | F | 303 | 298 | 82 | 19 | 80 | 43 | 130 | 52 | 122 | (48, 55) | (118, 128) |
| CHOL | M | 322 | 316 | 98 | 16 | 97 | 55 | 141 | 65 | 130 | (61, 71) | (127, 132) |
| CHOL | F | 303 | 302 | 107 | 17 | 108 | 71 | 154 | 74 | 142 | (72, 79) | (137, 146) |
| TRIG | M | 322 | 315 | 46 | 11 | 45 | 23 | 74 | 28 | 71 | (25, 30) | (68, 72) |
| TRIG | F | 303 | 296 | 52 | 14 | 50 | 21 | 91 | 29 | 82 | (24, 31) | (78, 88) |
| PHOS | M | 322 | 318 | 6.49 | 0.82 | 6.4 | 4.4 | 8.7 | 4.9 | 8.1 | (4.80, 5.00) | (8.00, 8.20) |
| PHOS | F | 303 | 299 | 5.65 | 0.85 | 5.6 | 3.6 | 7.8 | 3.9 | 7.4 | (3.70, 4.00) | (7.10, 7.70) |
| CA | M | 322 | 319 | 10.21 | 0.38 | 10.2 | 9.3 | 11.2 | 9.5 | 11 | (9.40, 9.60) | (10.90, 11.10) |
| CA | F | 303 | 301 | 10.08 | 0.38 | 10.1 | 9.2 | 11.1 | 9.4 | 10.95 | (9.20, 9.50) | (10.80, 11.00) |
| CL | M | 403 | 394 | 107.4 | 1.9 | 107 | 103 | 112 | 104 | 111 | (103.0, 104.0) | (111.0, 112.0) |
| CL | F | 379 | 374 | 108.7 | 2.1 | 109 | 103 | 114 | 105 | 113 | (105.0, 106.0) | (113.0, 113.0) |
| NA | M | 403 | 398 | 148.2 | 2.1 | 148 | 143 | 154 | 145 | 153 | (144.0, 145.0) | (153.0, 154.0) |
| NA | F | 379 | 373 | 147.4 | 2 | 147 | 143 | 153 | 144 | 152 | (143.0, 144.0) | (151.0, 152.0) |
| K | M | 403 | 391 | 4.28 | 0.33 | 4.3 | 3.4 | 5.2 | 3.7 | 5 | (3.60, 3.80) | (4.90, 5.10) |
| K | F | 379 | 377 | 4.4 | 0.4 | 4.3 | 3.2 | 5.5 | 3.6 | 5.2 | (3.6, 3.7) | (5.2, 5.3) |
| AMYL | M | 83 | 79 | 355 | 100 | 330 | 204 | 608 | 122 | 535 | (89, 152) | (492, 577) |
| AMYL | F | 84 | 82 | 349 | 97 | 338 | 206 | 589 | 141 | 535 | (113, 168) | (498, 568) |
| LIP | M | 83 | 80 | 16 | 2.9 | 15.5 | 11 | 22 | 9.9 | 21.8 | (9.2, 11.0) | (20.9, 23.1) |
| LIP | F | 84 | 76 | 15.7 | 2.3 | 15.5 | 10 | 21 | 10.9 | 20.1 | (10.2, 11.7) | (19.3, 21.1) |
| INS | M | 11 | 8 | 14.5 | 2 | 14.9 | 10.8 | 17.1 | NA | NA | (NA, NA) | (NA, NA) |
| INS | F | 17 | 14 | 12.3 | 3.1 | 11.1 | 9 | 16.8 | NA | NA | (NA, NA) | (NA, NA) |
| MG | M | 45 | 44 | 2 | 0.13 | 2 | 1.8 | 2.2 | 1.73 | 2.27 | (1.68, 1.78) | (2.21, 2.32) |
| MG | F | 46 | 43 | 1.99 | 0.11 | 2 | 1.8 | 2.2 | 1.76 | 2.21 | (1.72, 1.81) | (2.17, 2.25) |
| TSH | M | 82 | 80 | 0.6 | 0.3 | 0.6 | 0.1 | 1.2 | 0 | 1.2 | BFA | (1.1, 1.3) |
| TSH | F | 79 | 76 | 0.78 | 0.43 | 0.67 | 0.1 | 1.77 | BFA | 1.59 | BFA | (1.42, 1.80) |
| T3 | M | 82 | 78 | 221 | 33 | 222 | 144 | 304 | 156 | 285 | (146, 167) | (274, 295) |
| T3 | F | 79 | 72 | 213 | 33 | 216 | 122 | 297 | 148 | 278 | (138, 159) | (267, 289) |
| T4 | M | 82 | 81 | 4 | 1.1 | 3.7 | 2.1 | 6.6 | 1.6 | 6.2 | (1.1, 1.8) | (5.8, 6.6) |
| T4 | F | 79 | 77 | 4.2 | 1.1 | 4 | 2.2 | 6.9 | 1.8 | 6.4 | (1.5, 2.2) | (6.0, 6.8) |
| CRPHS | M | 81 | 79 | 1.3 | 0.66 | 1.3 | 0.2 | 2.8 | BFA | 2.61 | BFA | (2.42, 2.82) |
| CRPHS | F | 46 | 42 | 1.24 | 0.62 | 1.2 | 0.2 | 2.6 | 0.03 | 2.46 | BFA | (2.19, 2.72) |
Note: See Table 1 for abbreviations of individual analytes.
Abbreviations: BFA, beyond the feasibility of analysis; CI, confidence interval; F, female; LRI, lower reference limit; M, male; N, animal number/sample size; RI, reference interval; SD, standard deviation; URI, upper reference limit.
4. DISCUSSION
Cynomolgus monkeys are often the most pharmacologically and metabolically relevant animal species for nonclinical safety assessment, especially for biologics. 24 , 25 , 26 Target organ development and age correlations between the monkey and the intended patient population are critical factors for study design. The juvenile toxicity study is typically conducted in postweaning monkeys starting at 10 to 12 months of age, whereas safety assessments of biologics require using monkeys of sexual maturity. For general toxicity studies, the starting ages of monkeys vary from 2 to 5 years. In the current study, therefore, we reviewed the age‐ or sex‐related differences in body weights and hematologic, coagulation, and serum biochemical analyte values and saw sexual dimorphism in body weights at all ages from 2 to 10 years. Sex‐related changes in mean hematologic and serum biochemical analytes also occurred. Age‐related changes in mean hematologic and serum biochemical analytes were also seen. The only difference in clinical pathology analytes unique to the 2 to <3 years of age group were age‐related lower globulin concentrations compared with older animals. No age‐ or sex‐related differences were seen with the coagulation analytes. Hematologic, coagulation, and serum biochemical RIs and body weights have been previously reported for cynomolgus monkeys with a small number of animals, limited age ranges, mixed genders, and/or different geographic origins. 16 , 17 In the current study, we report similar indices in a large cohort of cynomolgus monkeys of Mauritian origin, which will provide useful RIs worldwide, especially for laboratories using similar testing methods, animal age ranges, and animal origins.
The age‐ and sex‐related changes in serum biochemical analyte values are related to physiology or organ system development. 18 , 19 Age‐related decreases in ALP activity and phosphorus concentrations reflect decreased bone formation in older animals, and higher ALP and GGT activities in male than female monkeys have also been previously reported in the literature. 18 , 27 Sex differences in ALP activity have been reported in a similar species, the Japanese macaque, which has higher ALP activities in males likely associated with growth in males; during which time females have stopped growing. It could also be associated with the expression of secondary sex characteristics induced by sex hormones. 28 Similarly, higher GGT activity has been reported in human males than females, which is also thought to be due to sex hormones. 29 Age‐related increases in creatinine concentrations and higher creatinine levels in male than female monkeys are likely due to increased muscle mass with age and in males, respectively. 27 There was a trend for higher serum lipids in older female monkeys compared with younger female monkeys and similarly‐aged male monkeys, which was due to higher triglyceride concentrations. Cholesterol was also higher in older female monkeys compared to similarly‐aged male monkeys. It was recently published that, as in humans, female cynomolgus monkeys tend to have higher serum lipids than males. 30 Sex‐specific differences in lipid and glucose metabolism are known to occur in both humans and nonhuman primates and may be due at least in part to the unique requirements of females for gestation and/or lactation. 31 The slightly lower globulin concentrations in male and female monkeys 2 to <3 years of age compared with older monkeys is consistent with other reports showing increasing globulin concentrations with age, which could be due, at least in part, to increasing environmental antigen exposure and adaptive immunity. 27
The age‐ and sex‐related changes in hematologic analytes seem to be mostly related to physiology and/or environmental exposure. 10 , 16 , 17 Lower lymphocyte counts in older monkeys of both sexes are consistent with the literature. 32 RETIC counts increased with age in both sexes and were higher in older female monkeys compared to similarly aged male monkeys. While we did not find anything in the literature regarding age‐ or sex‐related differences in RETIC values, sex‐related differences in RETIC values have been seen in our internal historical RIs where females had a higher upper RI than males. In this study, despite the increased RETIC values, no significant differences in RBC mass measurands (RBC, hemoglobin [HGB], and hematocrit [HCT]) were observed. Increased RETIC values without concurrent decreases in the RBC mass measurands can indicate that the bone marrow is responding to a need for increased RBC production. Because RETICs only circulate for a few days and RBCs circulate for significantly longer (~100 days in cynomolgus monkey), a significant lag in decreased RBC, HGB, and HCT values could occur compared with increased RETIC counts. 33 In this study, higher RETIC counts in older females may be related to menstruation‐related blood loss which was also suspected to be the cause of lower RBC measurands in older females compared to similarly‐aged males in a large cohort of Asian cynomolgus monkeys. 27
The hematologic, coagulation, and serum biochemical intervals for cynomolgus monkeys are variable in the literature. 27 , 32 , 34 The geographic origin might have impacted the hematologic and clinical biochemical analytes. 9 , 19 , 35 It has been reported that Mauritian monkeys have higher RBC counts but lower RETIC and WBC counts, and MCV and MCH values than Asian monkeys. 9 Mauritian monkeys have higher serum calcium and lower serum phosphorus than Asian monkeys. 9 Cynomolgus monkeys indigenous to the Philippines have lower creatine phosphokinase and alanine aminotransferase values than the Mauritian or Vietnamese monkeys, 9 and Vietnamese monkeys had lower ALP and aspartate aminotransferase than Philippine and Mauritian monkeys. 9 Among Mauritian monkeys, many hematologic and biochemical analytes measurements differ between purpose‐bred and captured animals. 19
In cynomolgus monkeys, sexual dimorphism in body sizes or weights has been reported to become significant after 3 to 4 years of age. 37 In a large cohort of Asian cynomolgus monkeys (588 males and 1930 females), there was no sex‐related difference in body weights before 4 years of age. 17 In males, body weights increased dramatically after 4 to 5 years, peaked at 14 to 15 years (~8.40 kg), and declined after 17 years of age. In females, body weights increased gradually after birth, peaked at 12 to 13 (~5.0 kg) years, and declined after 15 years of age. 17 In the current study, body weights were significantly higher in males than females of all age groups from 2 to 10 years of age, suggesting the sexual dimorphism in body sizes as early as at least 2 years of age in Mauritian cynomolgus monkeys. It has been reported that the cynomolgus monkey of Mauritian origin is generally larger in body weight/size and becomes sexually mature 1 to 2 years earlier than Asia cynomolgus monkeys. 9 , 38 In the current study, body weights of Mauritian monkeys peaked at 7 to 8 years of age in both males (7.9 kg) and females (5.5 kg). Apparently, body weight reaches its peak in Mauritian monkeys (7 to 8 years of age) earlier than in Asian monkeys (12 to 15 years of age). Once the plateau is reached, body weights are comparable between Mauritian and Asian cynomolgus monkeys. Age and body weight have been proposed as a predictor of puberty and clinical pathology analyte values in cynomolgus monkeys. 38 , 39 , 40 , 41 , 42 Correlations between body weight and clinical pathology analytes have been observed in female cynomolgus monkeys. 42 Body weight has been shown to correlate positively with HGB, HCT, MCV, glucose, triglycerides, leptin, and insulin levels. 42 In our study, triglyceride levels were higher in older females as compared to younger females and in females as compared to similarly‐aged males. Body weights alone are not a reliable predictor of clinical pathology analyte values in cynomolgus monkeys.
Clinical pathology RIs play important roles in clinical laboratory diagnoses and nonclinical safety assessments, especially in large animal studies where animal numbers are often limited and for those labs where appropriate internal references have not been established. Guidelines on determining, establishing, and verifying controls or RIs have been established for both clinical and veterinary laboratories. 14 , 36 , 43 However, many other factors can influence the results and interpretation of both internal and published clinical pathology RIs, such as variations associated with individual animals, laboratory settings, study‐related procedures, and environmental conditions. 23 , 27 , 35 , 44 , 45 Animal factors might include animal species, origin, numbers, sex, age, health status, inter‐, and intra‐animal variability, and animal husbandry and care practices. The laboratory or facility variations can include species‐ or parameter‐specific assay methods, instruments and reagents, sample frequency and preparations, and technologic variation. The study‐related procedures include study design variables, such as handling frequency and intensity, dosing methods and devices, sample collection frequency, volume, invasiveness, fasting states, anesthesia restraints, instrumentation, such as telemetry or catheterization, and environmental stress. Thus, it is prudent to adopt a weight of evidence approaches to use and interpret RI ranges or values, especially when using external reference datasets.
There were some limitations in the current study. The animals were restricted to cynomolgus monkey of Mauritian origin only so caution should be taken when using the RIs for cynomolgus monkey of other origins. Most animals included in this data set were 3 to 5 years of age and while at these ages both sexes were generally equally represented there were lesser numbers of females than males in the 2 to <3 years of age group. So RIs provided for the 3 to <4 years of age group were more robust than the RIs for the 2 to <3 years of age group and the RI for males 2 to <3 years of age were more robust than the RI for similarly‐aged females. This dataset was generated using Pfizer animal use and care conditions, analytic instruments, and analytical methods so there may be variations from other animal care facilities and laboratory settings.
In summary, we saw sexual dimorphism for body weights from 2 to 10 years of age in cynomolgus monkeys of Mauritian origin. Sex‐related differences were noted in RETIC counts, creatinine, cholesterol, and triglyceride concentrations, and ALP and GGT activities. Age‐related differences were noted in RETIC and lymphocyte counts, creatinine, triglyceride, phosphorus and globulin concentrations, and ALP and GGT activities. The youngest (2 to <3 year) age group had the fewest number of clinical pathologic analyte differences including ALP and GGT activity differences which occurred in all age groups from 2 to 10 years and age‐related lower globulin concentrations.
DISCLOSURE
The authors have indicated that they have no affiliations or financial involvement with any organization or entity with a financial interest in, or in financial competition with, the subject matter or materials discussed in this article.
ACKNOWLEDGMENTS
The authors would like to thank Dr. William Reagan, Steven Bailey, Donald Fish, Deborah Burt, and Kimberly Navetta as well as other Pfizer colleagues for statistical review, manuscript preparation, or other technical assistance.
Li X, Li D, Biddle KE, et al. Age‐ and sex‐related changes in body weights and clinical pathology analytes in cynomolgus monkeys (Macaca Fascicularis) of Mauritius origin. Vet Clin Pathol. 2022;51:356‐375. doi: 10.1111/vcp.13094
REFERENCES
- 1. Magden ER, Mansfield KG, Simmons JH, Abee CR. Nonhuman primates. Laboratory Animal Medicine. 3rd ed. Elsevier Inc; 2015:771‐930. doi: 10.1016/B978-0-12-409527-4.00017-1 [DOI] [Google Scholar]
- 2. Roos C, Zinner D. Diversity and evolutionary history of macaques with special focus on Macaca mulatta and Macaca fascicularis . In: Bluemel J, Korte S, Schenck E, Weinbauer GF, eds. The Nonhuman Primate in Nonclinical Drug Development and Safety Assessment. Academic Press; 2015:3‐16. [Google Scholar]
- 3. Liedigk R, Kolleck J, Böker KO, et al. Mitogenomic phylogeny of the common long‐tailed macaque (Macaca fascicularis fascicularis). BMC Genomics. 2015;16(1):222. doi: 10.1186/s12864-015-1437-0 [DOI] [PMC free article] [PubMed] [Google Scholar]
- 4. Fan Z, Song Y. Chinese primate status and primate captive breeding for biomedical research in China. The Future of Nonhuman Primate Resources. (China) National Academies Press; 2003:36‐48. [Google Scholar]
- 5. Kanthaswamy S, Ng J, Satkoski Trask J, et al. The genetic composition of populations of cynomolgus macaques (Macaca fascicularis) used in biomedical research. J Med Primatol. 2013;42(3):120‐131. doi: 10.1111/jmp.12043 [DOI] [PMC free article] [PubMed] [Google Scholar]
- 6. Yan G, Zhang G, Fang X, et al. Genome sequencing and comparison of two nonhuman primate animal models, the cynomolgus and Chinese rhesus macaques. Nat Biotechnol. 2011;29(11):1019‐1023. doi: 10.1038/nbt.1992 [DOI] [PubMed] [Google Scholar]
- 7. Sussman R, Tattersall I. Distribution, abundance, and putative ecological strategy of Macaca fascicularis on the Island of Mauritius, Southwestern Indian Ocean. Folia Primatologica (Basel). 1986;46(1):28‐43. doi: 10.1159/000156234 [DOI] [Google Scholar]
- 8. Bonhomme M, Blancher A, Cuartero S, Chikhi L, Crouau‐Roy B. Origin and number of founders in an introduced insular primate: estimation from nuclear genetic data. Research Support, Non‐U.S. Gov't. Mol Ecol. 2008;17(4):1009‐1019. doi: 10.1111/j.1365-294X.2007.03645.x [DOI] [PubMed] [Google Scholar]
- 9. Drevon‐Gaillot E, Perron‐Lepage MF, Clement C, Burnett R. A review of background findings in cynomolgus monkeys (Macaca fascicularis) from three different geographical origins. Exp Toxicol Pathol. 2006;58(2–3):77‐88. [DOI] [PubMed] [Google Scholar]
- 10. Kozlosky JC, Mysore J, Clark SP, et al. Comparison of physiologic and pharmacologic parameters in Asian and Mauritius cynomolgus macaques. Regul Toxicol Pharmacol. 2015;73(1):27‐42. doi: 10.1016/j.yrtph.2015.06.008 [DOI] [PubMed] [Google Scholar]
- 11. Rensberger B. Export Ban on Monkeys Poses Threat to Research. New York Times, Page 1, January 23, 1978.
- 12. Alvarado MC, Malkova L, Bachevalier J. Development of relational memory processes in monkeys. Dev Cogn Neurosci. 2016;22:27‐35. doi: 10.1016/j.dcn.2016.10.007 [DOI] [PMC free article] [PubMed] [Google Scholar]
- 13. Xie L, Zhou Q, Liu S, et al. Normal thoracic radiographic appearance of the cynomolgus monkey (Macaca fascicularis). PLoS ONE. 2014;9(1):e84599. doi: 10.1371/journal.pone.0084599 [DOI] [PMC free article] [PubMed] [Google Scholar]
- 14. Park H‐K, Cho J‐W, Lee B‐S, et al. Reference values of clinical pathology parameters in cynomolgus monkeys (Macaca fascicularis) used in preclinical studies. Lab Anim Res. 2016;32(2):79‐86. doi: 10.5625/lar.2016.32.2.79 [DOI] [PMC free article] [PubMed] [Google Scholar]
- 15. Andrade MC, Ribeiro CT, Silva VF, et al. Biologic data of Macaca mulatta, Macaca fascicularis, and Saimiri sciureus used for research at the Fiocruz primate center. Mem Inst Oswaldo Cruz. 2004;99(6):581‐589. [PubMed] [Google Scholar]
- 16. Nakayama S, Koie H, Kanayama K, et al. Establishment of reference values for complete blood count and blood gases in cynomolgus monkeys (Macaca fascicularis). J Vet Med Sci. 2017;79(5):881‐888. doi: 10.1292/jvms.16-0638 [DOI] [PMC free article] [PubMed] [Google Scholar]
- 17. Choi K, Chang J, Lee MJ, et al. Reference values of hematology, biochemistry, and blood type in cynomolgus monkeys from cambodia origin. Lab Anim Res. 2016;32(1):46‐55. doi: 10.5625/lar.2016.32.1.46 [DOI] [PMC free article] [PubMed] [Google Scholar]
- 18. Koo B‐S, Lee D‐H, Kang P, et al. Reference values of hematological and biochemical parameters in young‐adult cynomolgus monkey (Macaca fascicularis) and rhesus monkey (Macaca mulatta) anesthetized with ketamine hydrochloride. Lab Anim Res. 2019;35(1):7. doi: 10.1186/s42826-019-0006-0 [DOI] [PMC free article] [PubMed] [Google Scholar]
- 19. Bonfanti U, Lamparelli D, Colombo P, Bernardi C. Hematology and serum chemistry parameters in juvenile cynomolgus monkeys (Macaca fascicularis) of Mauritius origin: comparison between purpose‐bred and captured animals. J Med Primatol. 2009;38(4):228‐235. doi: 10.1111/j.1600-0684.2009.00345.x [DOI] [PubMed] [Google Scholar]
- 20. Cauvin AJ, Peters C, Brennan F. Advantages and Limitations of Commonly Used Nonhuman Primate Species in Research and Development of Biopharmaceuticals. The Nonhuman Primate in Nonclinical Drug Development and Safety Assessment; Academic Press; 2015:379‐395. doi: 10.1016/B978-0-12-417144-2.00019-6 [DOI] [Google Scholar]
- 21. Lakens D. Equivalence tests: a practical primer for t tests, correlations, and meta‐analyses. Soc Psychol Personal Sci. 2017;8(4):355‐362. doi: 10.1177/1948550617697177 [DOI] [PMC free article] [PubMed] [Google Scholar]
- 22. van der Loo MPJ. Distribution based outlier detection for univariate data. Discussion paper 10 003, Statistics Netherlands, The Hague/Heerlen 2010.
- 23. Horowitz GL, Altaie S, Boyd J et al. Defining, establishing, and verifying reference intervals in the clinical laboratory; approved guidelines. 3rd ed. Clinical and Laboratory Standards Institute (CLSI) document C28‐A3, Vol. 28, No. 3, 2008.
- 24. ICH . S11 Nonclinical safety testing in support of development of paediatric pharmaceuticals, 2020.
- 25. CDE . Technical guidance on repeat‐dose toxicity studies of pharmaceuticals (药物重复给药毒性试验技术指导原则), 2014.
- 26. ICH . S6(R1) guideline: preclinical safety evaluation of biotechnology‐derived Pharmaceuticals. Step 41 997, Addendum 2011.
- 27. Xie L, Xu F, Liu S, et al. Age‐ and sex‐based hematological and biochemical parameters for Macaca fascicularis. PLoS ONE. 2013;8(6):e64892. doi: 10.1371/journal.pone.0064892 [DOI] [PMC free article] [PubMed] [Google Scholar]
- 28. Takenaka A, Gotoh S, Watanabe T, Takenaka O. Developmental changes of plasma alkaline phosphatase calcium and inorganic phosphorus in relation to the growth of bones in the japanese macaque macaca fuscata. Primates. 1988;29(3):395‐404. [Google Scholar]
- 29. Kunutsor SK. Gamma‐glutamyltransferase‐friend or foe within? Liver Int. 2016;36(12):1723‐1734. doi: 10.1111/liv.13221 [DOI] [PubMed] [Google Scholar]
- 30. Yue F, Zhang G, Tang R, Zhang Z, Teng L, Zhang Z. Age‐ and sex‐related changes in fasting plasma glucose and lipoprotein in cynomolgus monkeys. Lipids Health Diseases. 2016;15:111‐120. doi: 10.1186/s12944-016-0280-x [DOI] [PMC free article] [PubMed] [Google Scholar]
- 31. Varlamov O, Bethea CL, Roberts CT. Sex‐specific differences in lipid and glucose metabolism: mini review. Front Endocrinol. 2015;5(241):1‐7. doi: 10.3389/fendo.2014.00241 [DOI] [PMC free article] [PubMed] [Google Scholar]
- 32. Sugimoto Y, Hanari K, Narita H, Honjo S. Normal hematologic values in the cynomolgus monkeys aged from 1 to 18 years. Jikken Dobutsu. 1986a;35(4):443‐447. [DOI] [PubMed] [Google Scholar]
- 33. Bolliger AP, Everds NE, Zimmerman KL, Moore DMS, Stephen A, Barnhart KF. Hematology of laboratory animals. Schalm's Veterinary Hematology. 6th ed. Hoboken, NJ: Wiley‐Blackwell; 2010;869‐887. [Google Scholar]
- 34. Bourges‐Abella N, Geffre A, Moureaux E, Vincenti M, Braun JP, Trumel C. Hematologic reference intervals in Cynomolgus (Macaca fascicularis) monkeys. J Med Primatol. 2014;43(1):1‐10. doi: 10.1111/jmp.12077 [DOI] [PubMed] [Google Scholar]
- 35. Xie L, Zhou Q, Liu S, et al. Effect of living conditions on biochemical and hematological parameters of the cynomolgus monkey. Research Support, Non‐U.S. Gov't. Am J Primatol. 2014;76(11):1011‐1024. doi: 10.1002/ajp.22285 [DOI] [PubMed] [Google Scholar]
- 36. Friedrichs KR, Harr KE, Freeman KP, et al. ASVCP reference interval guidelines: determination of de novo reference intervals in veterinary species and other related topics. Vet Clin Pathol. 2012;41(4):441‐453. doi: 10.1111/vcp.12006 [DOI] [PubMed] [Google Scholar]
- 37. Fukuda S, Cho F, Honjo S. Bone growth and development of secondary ossification centers of extremities in the cynomolgus monkey (Macaca fascicularis). Jikken Dobutsu. 1978;27(4):387‐397. [DOI] [PubMed] [Google Scholar]
- 38. Luetjens CM, Weinbauer GF. Functional assessment of sexual maturity in male macaques (Macaca fascicularis). Regul Toxicol Pharmacol. 2012;63(3):391‐400. doi: 10.1016/j.yrtph.2012.05.003 [DOI] [PubMed] [Google Scholar]
- 39. Kobayashi M, Koyama T, Yasutomi Y, Sankai T. Relationship between menarche and fertility in long‐tailed macaques (Macaca fascicularis). J Reprod Dev. 2018;64(4):337‐342. doi: 10.1262/jrd.2017-164 [DOI] [PMC free article] [PubMed] [Google Scholar]
- 40. Mirsky ML, Portugal S, Pisharath H, Osowski JL, Kearney L. Utility of orchidometric parameters for assessing sexual maturation in male cynomolgus macaques (Macaca fascicularis). Comp Med. 2016;66(6):480‐488. [PMC free article] [PubMed] [Google Scholar]
- 41. Smedley JV, Bailey SA, Perry RW, Rourke CMO. Methods for predicting sexual maturity in male cynomolgus macaques on the basis of age, body weight, and histologic evaluation of the testes. Contemp Top Lab Anim Sci. 2002;41(5):18‐20. [PubMed] [Google Scholar]
- 42. Chen Y, Ono F, Yoshida T, Yoshikawa Y. Relationship between body weight and hematological and serum biochemical parameters in female cynomolgus monkeys (Macaca fascicularis). Exp Anim. 2002;51(2):125‐131. doi: 10.1538/expanim.51.125 [DOI] [PubMed] [Google Scholar]
- 43. Horowitz GL, Altaie S, Boyd JC, et al. Defining, establishing, and verifying reference intervals in the clinical laboratory; approved guideline. Clinical and Laboratory Standards Institute (CLSI), CLSI document EP28‐A3c; 2010.
- 44. Yang H, Richman L, Hall R. Implications and limitations of reference values and historical data for the interpretation of nonhuman primate toxicology studies. In: Bluemel J, Korte S, Schenck E, Weinbauer GF, eds. The Nonhuman Primate in Nonclinical Drug Development and Safety Assessment. Academic Press; 2015:173‐183. [Google Scholar]
- 45. Perretta G, Violante A, Scarpulla M, Beciani M, Monaco V. Normal serum biochemical and hematological parameters in Macaca fascicularis . J Med Primatol. 1991;20(7):345‐351. [PubMed] [Google Scholar]