

Abstract
Objective
To investigate whether intervening miscarriages and induced abortions impact the associations between interpregnancy interval after a live birth and adverse pregnancy outcomes.
Design
Population‐based cohort study.
Setting
Norway.
Participants
A total of 165 617 births to 143 916 women between 2008 and 2016.
Main outcome measures
We estimated adjusted relative risks for adverse pregnancy outcomes using log‐binomial regression, first ignoring miscarriages and induced abortions in the interpregnancy interval estimation (conventional interpregnancy interval estimates) and subsequently accounting for intervening miscarriages or induced abortions (correct interpregnancy interval estimates). We then calculated the ratio of the two relative risks (ratio of ratios, RoR) as a measure of the difference.
Results
The proportion of short interpregnancy interval (<6 months) was 4.0% in the conventional interpregnancy interval estimate and slightly increased to 4.6% in the correct interpregnancy interval estimate. For interpregnancy interval <6 months, compared with 18–23 months, the RoR was 0.97 for preterm birth (PTB) (95% confidence interval [CI] 0.83–1.13), 0.97 for spontaneous PTB ( 95% CI 0.80–1.19), 1.00 for small‐for‐gestational age ( 95% CI 0.86–1.14), 1.00 for large‐for‐gestational age (95% CI 0.90–1.10) and 0.99 for pre‐eclampsia (95% CI 0.71–1.37). Similarly, conventional and correct interpregnancy intervals yielded associations of similar magnitude between long interpregnancy interval (≥60 months) and the pregnancy outcomes evaluated.
Conclusion
Not considering intervening pregnancy loss due to miscarriages or induced abortions, results in negligible difference in the associations between short and long interpregnancy intervals and adverse pregnancy outcomes.
Tweetable abstract
Not considering pregnancy loss in interpregnancy interval estimation resulted no meaningful differences in observed risks of adverse pregnancy outcomes.
Keywords: induced abortions, interpregnancy interval, large‐for‐gestational age, miscarriages, pre‐eclampsia, preterm birth, small‐for‐gestational age
Tweetable abstract
Not considering pregnancy loss in interpregnancy interval estimation resulted no meaningful differences in observed risks of adverse pregnancy outcomes.
1. INTRODUCTION
Both short and long interpregnancy intervals (IPIs) are associated with increased risk of adverse pregnancy and neonatal outcomes. 1 , 2 , 3 , 4 , 5 , 6 , 7 , 8 , 9 , 10 , 11 , 12 , 13 , 14 The World Health Organization (WHO) therefore recommends that women wait a minimum of 24 months following a live birth and 6 months following a miscarriage or induced abortion before attempting to become pregnant again. 15 These recommendations were based on observational studies conducted before 2005, indicating greater risks of adverse pregnancy outcomes. 3 , 9 However, the applicability of these recommendations in high‐income countries has recently been challenged. 10 , 16 The WHO has acknowledged caveats of their recommendations due to the limited evidence, which is mainly from low‐ and middle‐income countries. 15 For example, the recommendations for interval after miscarriage or induced abortion was based on a single study conducted in Latin America where access to abortion services was significantly different from that in other countries. 3
In Norway, approximately 13% of recognised pregnancies end in a miscarriage and 18% end in an induced abortion, 17 which is consistent with reports from other European countries. 18 , 19 Most previous studies that have investigated the association between IPI after a live birth and adverse pregnancy outcomes calculated IPI as the time between a birth and the subsequent pregnancy lasting at least 20 weeks of gestation, 10 , 20 , 21 , 22 without being able to consider intervening pregnancies ending in a miscarriage or induced abortion due to lack of this information in population registries. 10 , 16 , 20 , 22 , 23 Ignoring intervening pregnancies ending in miscarriages and induced abortions at earlier gestations results in an overestimation of the IPI. However, there is a dearth of studies on the influence of intervening pregnancy events on the estimated risks of adverse pregnancy outcomes according to IPI after a live birth except for one study from the USA. 24
In Norway, data on miscarriages and induced abortions are available through national health registries. The objective of this study was to explore whether intervening miscarriages and induced abortions impact the associations between IPI after a live birth and adverse pregnancy outcomes.
2. METHODS
2.1. Study design and data sources
We conducted a retrospective cohort study using three mandatory national Norwegian registries: the Medical Birth Registry of Norway (birth registry), 25 the Norwegian Patient Registry and the general practitioner database, 26 and identified registered pregnancies with an estimated date of conception between 1 January 2008 and 31 December 2016. The birth registry includes mandatory notifications on pregnancies in Norway ending after 12 gestational weeks and therefore provides information on live births, stillbirths, late miscarriages and late induced abortions. The patient and general practitioner registries provided information on induced abortions and miscarriages irrespective of gestational week, also including those that occurred prior to 12 gestational weeks. In our study, a fetal death at 20 gestational weeks or later or with a birthweight of ≥400 g was considered a stillbirth, whereas fetal deaths prior to 20 gestational weeks with a birthweight <400 g were defined as miscarriages.
2.2. Study population
From the medical birth registry, we identified 531 898 live births. We excluded 366 259 of these live births that were not followed by a subsequent birth. In this study, the index birth was defined as the birth before the IPI. After excluding observations with missing information for maternal age (n = 12) or birth outcomes (n = 11), we included 165 617 births (n = 165 089 live births, n = 528 stillbirths) following live births for the final analysis (Figure 1).
FIGURE 1.
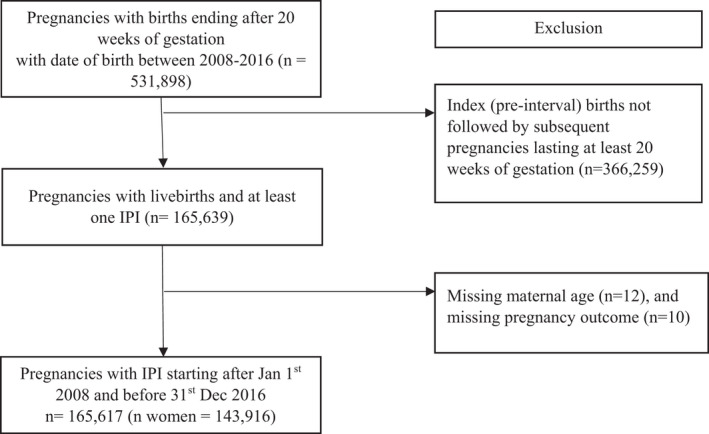
Flow chart for study cohort selection.
2.3. Exposure ascertainment
Interpregnancy interval (IPI) after a live birth was the focus of the study. We created two different IPI estimates. Consistent with previous literature, a conventional IPI was estimated as the time between the date of a live birth and date of the conception (date of birth minus gestational age) of the subsequent live or stillbirth. This IPI estimate reflects the commonly used approach in those studies based on cohorts that lack information on miscarriages or induced abortions. 27 We considered ‘correct IPI’ as IPI estimated from a cohort of births with no intervening miscarriages and induced abortions, which is consistent with the WHO definition for interpregnancy interval 27 (Figure S1). We categorised IPI into six categories: <6, 6–11, 12–17, 18–23, 24–59, and ≥60 months. An IPI of 18–23 months was considered as a reference category partly informed previous studies and recommendations from the American College of Obstetricians and Gynecologists which indicated an IPI <18 months as an interval with increased risk of adverse perinatal and maternal outcomes. 13 , 16 , 20 , 28
2.4. Intervening events
In this study, we considered miscarriages and induced abortions occurring between two births to be intervening events. The information for miscarriages and induced abortions was obtained from both the patient and general practitioner databases. In the patient registry, hospital discharges are coded according to International Classification of Diseases (ICD) version 10. For miscarriages, the following ICD‐10 codes were considered: hydatidiform mole (O01); blighted ovum and nonhydatidiform mole (O02.0); missed abortion (O02.1); other specified abnormal products of conception (O02.8); abnormal product of conception, unspecified (O02.9); spontaneous abortion (O03); threatened abortion (O20.0). Induced abortions were identified by the following ICD‐10 codes: medical abortion (O04), other abortion (O05) and unspecified abortion (O06).
The general practitioner database is coded according to the International Classification of Primary Care (ICPC‐2). The following ICPC‐2 codes were used to capture miscarriages before 12 completed gestational weeks: bleeding in pregnancy (W03) and spontaneous abortion (W82).
A detailed description of the miscarriage and induced abortion ascertainment and data linkage procedures is givend in Appendix S1.
2.5. Outcomes
We evaluated the risk of five adverse pregnancy outcomes: preterm birth (PTB), spontaneous PTB, small‐for‐gestational age (SGA), large‐for‐gestational age (LGA) and pre‐eclampsia. We chose these outcomes as they have been associated with either or both short and long IPIs following a live birth. 6 , 22 , 29 , 30 The measurement of gestational age was largely based on ultrasound estimates and based on last menstrual period when ultrasound estimates were not available. PTB was defined as birth <37 completed weeks of gestation. Spontaneous PTB was defined as PTB with spontaneous onset of labour. SGA and LGA were defined as a birthweight in the lowest or highest 10th percentiles among all births during the study period, respectively, based on the gestational week and sex‐specific distributions of birthweight among all pregnancies ending after 20 completed gestational weeks registered in the birth registry between 1980 and 2017. Pre‐eclampsia was defined as any registration of pre‐eclampsia, eclampsia or HELLP syndrome (haemolysis, elevated liver enzymes and low platelet count).
2.6. Statistical analysis
For each outcome, we estimated the associations using the conventional IPI estimates (IPI ignoring miscarriages or induced abortions) and the correct IPI estimates (IPI estimated based on two live births with no intervening miscarriages or induced abortions). We used log‐binomial regression to estimate unadjusted and adjusted relative risk (aRR) and 95% confidence intervals (95% CI) for the association between IPI and the adverse pregnancy outcomes. Multivariable models adjusted for potential confounders identified based on literature and availability in the databases. These included maternal age at delivery of the index (pre‐interval) birth in years (categorical: <20, 20–24, 25–29, 30–34, 35–39 and ≥40 years), parity (categorical: one, two, three or more), and year of birth (continuous). We used robust cluster variance estimation to account for women who contributed more than one birth in the analysis. The difference in the associations using the two different IPI estimates was estimated by calculating the ratio of ratios (RoR): the aRR with conventional IPI divided by aRR with correct IPI. The 95% CI for the RoR was estimated using the Monte Carlo method. 31 An RoR of 1 indicates identical risk estimates, with no difference in the estimates associations after accounting intervening miscarriages or induced abortions. We conducted sensitivity analyses where we included further adjustment for pre‐pregnancy body mass index (BMI) (categorical: BMI ≥25 kg/m2 versus BMI <25 kg/m2) and smoking during pregnancy (categorical: yes/no) for those births where this information was available. Note that providing self‐reported information on these two lifestyle characteristics in the birth registry is voluntary.
We conducted supplementary analysis estimating the risks of adverse pregnancy outcomes considering ‘modified IPI’, which re‐estimated the IPI by taking the time between a miscarriage or induced abortion and the estimated date of conception of the subsequent pregnancy ending in a birth for those women who had such intervening pregnancy loss. We then estimated RoR comparing the risk estimates using modified IPI and the risk estimates using conventional IPI. Whenever more than one miscarriage or induced abortion occurred between two births, we considered the one closet to the next pregnancy that lasted at least to 20 weeks of gestation. All analyses were conducted using STATA version 16 (StataCorp, College Station, TX, USA).
3. RESULTS
3.1. Maternal characteristics at the time of the index birth
Our cohort included 165 617 births to 143 916 women following live births, with births between 2008 and 2016. The mean age at delivery was 31 years (interquartile range [IQR] 28–34) and two‐thirds (66.1%) were parity zero (no previous birth) at the time of birth of the index pregnancy (maternal characteristics are given in Table 1).
Table 1.
Distribution of characteristics of women at the time of index birth with an estimated date of conception between 2008 and 2016
| Variable | Conventional IPI a (n = 165 617) | Correct IPI b (n = 143 861) |
|---|---|---|
| n (%) | n (%) | |
| Maternal age (years) | ||
| 14–19 | 4236 (2.56) | 3167 (2.20) |
| 20–24 | 33 443 (20.19) | 28 378 (19.73) |
| 25–29 | 65 633 (39.63) | 58 027 (40.34) |
| 30–34 | 48 343 (29.19) | 42 556 (29.58) |
| 35–39 | 12 976 (7.83) | 10 903 (7.58) |
| ≥40 | 986 (0.60) | 830 (0.58) |
| Median (IQR) | 31 (28–34) | 31 (28–34) |
| Parity | ||
| 0 | 110 792 (66.9) | 96 864 (67.33) |
| 1 | 39 628 (23.93) | 34 059 (23.67) |
| 2+ | 15 197 (9.18) | 12 938 (8.99) |
| Maternal pre‐pregnancy body mass index (kg/m2) c | ||
| <25 | 53 864 (32.52) | 47 212 (32.82) |
| ≥25 | 24 493 (14.79) | 21 423 (14.89) |
| Missing | 87 260 (52.69) | 75 226 (52.29) |
| Smoking during pregnancy d | ||
| No | 127 126 (76.76) | 111 402 (77.44) |
| Yes | 13 384 (8.08) | 10 791 (7.50) |
| Missing | 25 107 (15.16) | 21 668 (15.06) |
| Birth year | ||
| 2008 | 29 882 (18.04) | 25 090 (17.44) |
| 2009 | 29 340 (17.72) | 24 800 (17.24) |
| 2010 | 27 960 (16.88) | 23 933 (16.64) |
| 2011 | 25 381 (15.33) | 22 090 (15.36) |
| 2012 | 22 838 (13.78) | 20 130 (13.99) |
| 2013 | 17 841 (10.77) | 16 139 (11.22) |
| 2014 | 10 201 (6.16) | 9570 (6.65) |
| 2015 | 2167 (1.31) | 2102 (1.46) |
| 2016 | 7 (0.00) | 7 (0.00) |
Abbreviation: IQR, interquartile range.
Conventional IPI: IPI estimated between the date of a live birth and date of subsequent conception resulted in live or stillbirth.
Correct IPI: IPI estimated from a live birth to date of subsequent conception that resulted in live or stillbirth for two births with no intervening miscarriages and/or induced abortions.
Registration started in 2006.
Registration started in 1999.
3.2. Intervening miscarriages and induced abortions between two births
There were 21 756 (13.1%) pregnancies with intervening miscarriages (n = 16 147) or induced abortions (n = 5609) between live births and subsequent pregnancies ending at least 20 weeks of gestation. The proportion of births with short IPI (<6 months) was 4.0% (n = 6658) under the conventional IPI estimate and 4.6% (n = 6612) in the correct IPI estimate restricted to births from women with no intervening miscarriages and induced abortions. However, the proportion of long IPI (≥60 months) was 3.9% (n = 6411) under the conventional IPI estimate, which decreased to 3% (n = 4244) in the correct IPI estimate (Table 1, Figure 2). About 19% (n = 4034) of IPIs included had at least two miscarriages or induced abortions (Table S1).
FIGURE 2.
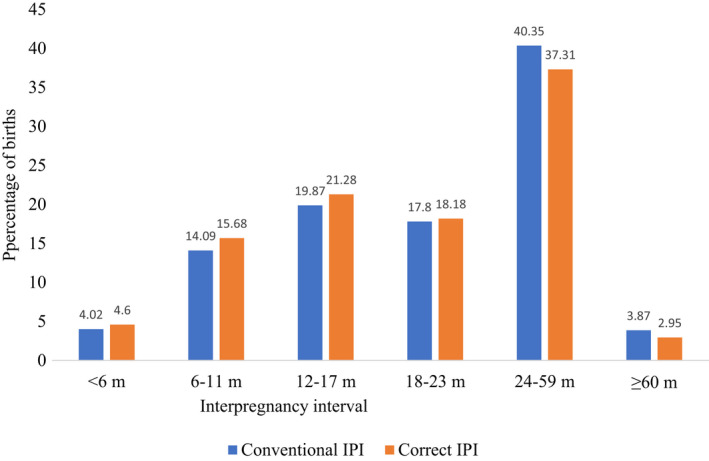
Distributions for conventional and correct interpregnancy intervals for the index pregnancy outcomes with an estimated date of conception between 2008 and 2016.
For short IPI (<6 months), the RoR was 0.97 for PTB (95% CI 0.83–1.13), 0.97 for spontaneous PTB (95% CI 0.80–1.19), 1.00 for SGA (95% CI 0.90–1.14), 1.00 for LGA (95% CI 0.90– 1.10) and 0.99 for pre‐eclampsia (95% CI 0.71–1.37) using the conventional IPI—only marginally different from RoR using the correct IPI estimates (Table 2).
Table 2.
Unadjusted and adjusted relative risk for the associations between conventional and corrected interpregnancy interval and adverse pregnancy outcomes
| Outcome | Conventional IPI a (n = 166 617) | Correct IPI b (n = 143 861) | RoR (95% CI) f | ||||
|---|---|---|---|---|---|---|---|
| No. of cases (%) | cRR (95% CI) | aRR (95% CI) e | No. of cases (%) | cRR (95% CI) | aRR(95% CI) e | ||
| PTB (n = 166 617) | n = 143 861 | ||||||
| <6 months | 445 (6.68) | 1.70 (1.53–1.89) | 1.58 (1.42–1.76) | 436 (6.59) | 1.75 (1.57–1.96) | 1.63 (1.46–1.82) | 0.97 (0.83–1.13) |
| 6–11 months | 1095 (4.69) | 1.19 (1.10–1.29) | 1.14 (1.05–1.24) | 1033 (4.58) | 1.22 (1.12–1.33) | 1.16 (1.07–1.27) | 0.97 (0.86–1.10) |
| 12–17 months | 1285 (3.90) | 0.99 (0.92–1.07) | 0.98 (0.90–1.06) | 1166 (3.81) | 1.01 (0.93–1.10) | 1.00 (0.92–1.08) | 0.98 (0.87–1.10) |
| 18–23 months | 1161 (3.94) | Ref | Ref | 984 (3.76) | Ref | Ref | Ref |
| 24–59 months | 3054 (4.57) | 1.16 (1.09–1.24) | 1.15 (1.07–1.23) | 2312 (4.31) | 1.15 (1.06–1.23) | 1.14 (1.06–1.23) | 1.01 (0.91–1.13) |
| ≥60 months | 398 (6.21) | 1.58 (1.41–1.76) | 1.50 (1.33–1.68) | 262 (6.17) | 1.64 (1.44–1.87) | 1.59 (1.38–1.82) | 0.94 (0.79–1.13) |
| Spontaneous PTB (n = 162 471) c | n = 141 282 c | ||||||
| <6 months | 283 (4.36) | 1.92 (1.67–2.20) | 1.80 (1.57–2.07) | 277 (4.29) | 1.98 (1.72–2.28) | 1.85 (1.61–2.14) | 0.97 (0.80–1.19) |
| 6–11 months | 673 (2.94) | 1.29 (1.16–1.46) | 1.24 (1.12–1.39) | 638 (2.88) | 1.33 (1.19–1.48) | 1.28 (1.14–1.43) | 0.97 (0.83–1.15) |
| 12–17 months | 770 (2.38) | 1.05 (0.94–1.16) | 1.04 (0.94–1.15) | 700 (2.32) | 1.07 (0.96–1.20) | 1.06 (0.95–1.18) | 0.98 (0.85–1.14) |
| 18–23 months | 658 (2.27) | Ref | Ref | 558 (2.17) | Ref | Ref | Ref |
| 24–59 months | 1690 (2.58) | 1.14 (1.04–1.24) | 1.12 (1.02–1.22) | 1298 (2.47) | 1.14 (1.03–1.25) | 1.13 (1.02–1.25) | 0.99 (0.87–1.14) |
| ≥60 months | 218 (3.50) | 1.54 (1.33–1.79) | 1.44 (1.23–1.68) | 143 (3.47) | 1.50 (1.33–1.92) | 1.53 (1.27–1.85) | 0.94 (0.74–1.20) |
| SGA (n = 165 586) d | n = 143 837 d | ||||||
| <6 months | 484 (7.27) | 1.24 (1.12–1.36) | 1.23 (1.11–1.35) | 480 (7.26) | 1.25 (1.13–1.38) | 1.23 (1.12–1.36) | 1.00 (0.86–1.14) |
| 6–11 months | 1481 (6.35) | 1.08 (1.01–1.15) | 1.07 (1.00–1.15) | 1431 (6.34) | 1.09 (1.02–1.17) | 1.08 (1.01–1.16) | 0.99 (0.90–1.09) |
| 12–17 months | 2032 (6.18) | 1.05 (0.99–1.12) | 1.05 (0.99–1.12) | 1868 (6.10) | 1.05 (0.98–1.12) | 1.04 (0.98–1.11) | 1.01 (0.92–1.10) |
| 18–23 months | 1733 (5.88) | Ref | Ref | 1524 (5.83) | Ref | Ref | Ref |
| 24–59 months | 4333 (6.49) | 1.10 (1.05–1.16) | 1.10 (1.05–1.17) | 3421 (6.37) | 1.09 (1.03–1.16) | 1.10 (1.04–1.17) | 1.00 (0.92–1.08) |
| ≥60 months | 508 (7.92) | 1.35 (1.23–1.48) | 1.34 (1.21–1.47) | 322 (7.59) | 1.30 (1.16–1.46) | 1.31 (1.18–1.47) | 1.02 (0.88–1.18) |
| LGA (n = 166 689) d | n = 143 837 d | ||||||
| <6 months | 818 (12.29) | 0.95 (0.88–1.02) | 0.93 (0.87–1.00) | 812 (12.29) | 0.94 (0.88–1.01) | 0.93 (0.86–0.99) | 1.00 (0.90–1.10) |
| 6–11 months | 2959 (12.71) | 0.98 (0.93–1.02) | 0.97 (0.92–1.01) | 2868 (12.71) | 0.98 (0.93–1.02) | 0.96 (0.92–1.01) | 1.01 (0.95–1.08) |
| 12–17 months | 4316 (12.57) | 0.97 (0.93–1.01) | 0.97 (0.93–1.01) | 3885 (12.69) | 0.98 (0.93–1.01) | 0.97 (0.93–1.01) | 1.00 (0.94–1.06) |
| 18–23 months | 3824 (12.97) | Ref | Ref | 3403 (13.01) | Ref | Ref | Ref |
| 24–59 months | 9062 (13.56) | 1.05 (1.01–1.08) | 1.03 (1.00–1.07) | 7337 (13.67) | 1.05 (1.01–1.09) | 1.04 (1.00–1.08) | 0.99 (0.94–1.04) |
| ≥60 months | 893 (13.93) | 1.07 (1.00–1.15) | 1.04 (0.97–1.12) | 603 (14.21) | 1.09 (1.01–1.18) | 1.05 (0.97–1.14) | 0.99 (0.89–1.10) |
| Pre‐eclampsia (n = 166 617) | n = 143 861 | ||||||
| <6 months | 84 (1.26) | 0.77 (0.62–0.98) | 0.80 (0.64–1.01) | 84 (1.27) | 0.79 (0.62–0.99) | 0.81 (0.64–1.03) | 0.99 (0.71–1.37) |
| 6–11 months | 318 (1.36) | 0.84 (0.73–0.96) | 0.84 (0.73–0.97) | 305 (1.35) | 0.84 (0.72–0.97) | 0.84 (0.73–0.98) | 1.00 (0.81–1.23) |
| 12–17 months | 493 (1.50) | 0.92 (0.81–1.04) | 0.92 (0.81–1.03) | 450 (1.47) | 0.91 (0.80–1.04) | 0.91 (0.80–1.04) | 1.01 (0.85–1.21) |
| 18–23 months | 480 (1.63) | Ref | Ref | 422 (1.61) | Ref | Ref | Ref |
| 24–59 months | 1246 (1.86) | 1.15 (1.03–1.27) | 1.15 (1.03–1.28) | 974 (1.81) | 1.12 (1.00–1.26) | 1.13 (1.01–1.27) | 1.01 (0.85–1.17) |
| ≥60 months | 150 (2.34) | 1.44 (1.20–1.72) | 1.43 (1.19–1.72) | 99 (2.33) | 1.45 (1.16–1.80) | 1.44 (1.15–1.79) | 0.99 (0.74–1.33) |
Abbreviation: aRR, adjusted relative risk; CI, confidence interval; cRR, crude relative risk; IPI, interpregnancy interval; LGA, large‐for‐gestational age; PTB, preterm birth; RoR, ratio of ratio; SGA, small‐for‐gestational age.
Conventional IPI: IPI estimated between the date of a live birth and date of subsequent conception resulted in live or stillbirth.
Correct IPI: IPI estimated from a live birth to date of subsequent conception that resulted in live or stillbirth for two births with no intervening miscarriages and/or induced abortions.
Births with non‐spontaneous preterm outcomes were excluded when defining spontaneous PTB.
Births with no information for birthweight and sex were excluded when defining SGA/LGA.
Adjustment for maternal age, parity and birth year at the time of index birth.
Ratio between aRR using conventional IPI estimate and aRR using correct IPI estimate.
For longer IPI categories (>60 months), not considering miscarriages and induced abortions in the estimation of IPI also resulted in negligible difference in the associations with PTB (RoR = 0.94, 95% CI 0.79–1.13), spontaneous PTB (RoR = 0.94, 95% = CI: 0.74, 1.20), and SGA (RoR = 1.02, 95% = CI: 0.88, 1.18), LGA (RoR = 0.99, 95% CI 0.89, 1.10) and pre‐eclampsia (RoR = 0.99, 95% CI 0.74, 1.33) s (Table 2). Adjustment for pre‐pregnancy BMI and smoking during pregnancy for those births with available information (n = 72 022) did not alter the RoRs estimates (Table S2).
Our supplementary analyses using the modified IPI that re‐estimated IPI for births with intervening miscarriages or induced abortions showed slight changes in the relative risks of PTB (RoR = 1.08; 95% CI 0.94–1.24), spontaneous PTB (RoR = 1.15; 95% CI 0.96–1.37) and SGA (ROR = 1.07; 95% CI 0.95–1.22), LGA (RoR = 0.98; 95% CI 0.90–1.06) and pre‐eclampsia (RoR = 0.78, 95% CI 0.59–1.01) for births after short IPI (<6 months) in the conventional IPI estimates. For longer IPI categories (≥60 months), ignoring miscarriages or induced abortions in the estimation of IPI (i.e. conventional IPI) did not change the results in the risks of pregnancy outcomes in the conventional IPI estimates (Table S3).
4. DISCUSSION
4.1. Main findings
This study used unique linked data from three national registries in Norway to examine the effect of intervening pregnancy loss due to miscarriages and induced abortions occurring between two births on the association between short or long IPI after a live birth and adverse pregnancy outcomes. Conventional (i.e. not considering intervening miscarriages or induced abortions) and corrected (accounting for these intervening pregnancy events) estimation of IPI resulted in negligible difference to the observed effects of both short and long IPIs on the adverse pregnancy outcomes.
4.2. Comparison with other studies
Only one previous study has been conducted on this topic; 24 that study was conducted in the USA and compared the risk of only PTB across different IPI estimates. 24 Although the authors of the US study estimated IPI from two live births with no intervening miscarriages or induced abortions, the authors did not compare their results with IPI estimated after ignoring these events to replicate the approach typically adopted in IPI studies that are unable to obtain information on miscarriages or induced abortions. Therefore, the result from the US study is not directly comparable to our study, as we compared risk estimates by computing the conventional and correct IPIs. The US study compared the risks of PTB and five IPIs estimated by considering the time between two pregnancies ending as miscarriages, induced abortions, stillbirths and live births in either one or both of these pregnancies. Moreover, the US study was based on a relatively smaller sample size (n = 6421 live or stillbirths compared with n = 165 617 live or stillbirths in our study) which provided a smaller number of PTB across the IPI categories.
4.3. Research implications
Our results indicate that not considering intervening miscarriages or induced abortions during IPI estimation after a live birth resulted in negligible difference in the risks of adverse pregnancy outcomes. Previous findings have showed a lower risk of adverse pregnancy outcomes following miscarriages. 32 , 33 , 34 Given that most miscarriages and induced abortions occur early in pregnancy (<12 weeks of gestation), 35 , 36 the magnitude of nutritional depletion attributed to these outcomes may be relatively small. However, a study in Latin America showed that short IPI after pregnancies with miscarriages and induced abortions might be associated with adverse pregnancy outcomes, despite that study being criticised for not distinguishing between induced and spontaneous abortions in the analysis. 37 In our study, although at least one miscarriage or induced abortion intervened in 13% of IPIs, the change in the estimated proportion of short (<6 months) IPI before and after accounting for intervening pregnancy events was relatively small (4.0% in the conventional IPI versus 4.6% in the correct IPI). Given the small difference in the number of observations in the short IPI categories, our finding of negligible differences in the risk estimates between the conventional and correct IPI estimates and risks of adverse pregnancy outcomes is not surprising. Our result may imply that any differences in the risk of adverse pregnancy outcomes after short IPI following a live birth when taking into account intervening miscarriages or induced abortions may depend on the magnitude of these events in the population of interest. A previous study reported that the association between IPI and adverse birth outcomes may differ after stillbirth, 38 compared with after live births. However, it remains to be established whether such differences reflect different underlying biological mechanisms or underlying differences between the cohort of women who experience pregnancy loss and those who progress to have a live birth. 16 Therefore, future studies need to investigate the level of intervening events that could impact the risk estimates of adverse pregnancy outcomes associated with short or long IPI. Our sensitivity analysis re‐estimating IPI considering intervening miscarriages or induced abortions as starting points for IPI estimation, showed slight reductions in the risk of PTB, spontaneous PTB and SGA compared with the conventional estimate. Although there were some differences in the proportion of observations in the long IPI categories between conventional and correct IPI estimates, we observed minimal differences in the risk estimates, suggesting that pregnancy loss plays a minimal role in influencing the association between long IPI and adverse pregnancy outcomes.
4.4. Strengths and limitations
The strengths of our study lie in the inclusion of all births, and early miscarriages and induced abortions from national health registries in Norway. All consultations and care in the public health system are free to pregnant women, and these consultations are mandatorily reported to the national health registries. We believe our data captures most recognised pregnancies in Norway, including those ending in the first trimester. Still, the very early and unrecognised pregnancies are not included and some residual bias exists with regard to the risks of adverse pregnancy outcomes, as very short pregnancies are missed. It is important to consider some potential confounders, such as socio‐economic status, pregnancy intention and partner changes, when measuring risks for adverse pregnancy outcomes. 39 , 40 , 41 These are likely to differ between women with longer pregnancies and women with miscarriages or induced abortions, but were unfortunately not available in our dataset, which is based on health registries. However, our sensitivity analysis adjusting for pre‐pregnancy BMI and smoking during pregnancy indicated no significant differences. Although in the IPIs there could potentially be other pregnancy losses such as ectopic pregnancies, we limited intervening events to miscarriages and induced abortions. It is also noteworthy that defining pregnancy outcomes based on administrative codes in the registries might have inherent limitations that resulted in missing intervening miscarriages or induced abortions due to our inability to confirm the outcome by clinical examinations. In our study, we included women with at least two pregnancies occurring in less than a decade, which provided a relatively smaller proportion of births with long IPI; a smaller proportion of women with long IPI might thus be represented.
5. CONCLUSIONS
Our results indicate that not considering intervening pregnancy loss resulted in no meaningful differences in the observed risk of adverse pregnancy outcomes associated with short and long IPIs following live births. Our findings are reassuring for researchers estimating IPI without accounting for intervening miscarriages or induced abortions when there is no available information on these events.
AUTHOR CONTRIBUTIONs
GAT, SEH, GP, MCM conceived the study and designed the analysis. GAT and MCM prepared the data. GAT conducted the analysis and drafted the manuscript. All co‐authors contributed to revision of the manuscript and approved the final version.
CONFLICT OF INTERESTS
None declared. Completed disclosure of interest forms are available to view online as supporting information.
ETHICAL APPROVAL
This study was approved by the Regional Committee for Medical and Health Research Ethics of South/East Norway.
Supporting information
Data S1
Data S2
Data S3
Data S4
Appendix S1
Acknowledgement
Open access publishing facilitated by Curtin University, as part of the Wiley ‐ Curtin University agreement via the Council of Australian University Librarians.
Tessema GA, Håberg SE, Pereira G, Magnus MC. The role of intervening pregnancy loss in the association between interpregnancy interval and adverse pregnancy outcomes. BJOG. 2022;129:1853–1861. 10.1111/1471-0528.17223
Funding information
This work was supported by funding from the Research Council of Norway through its Centres of Excellence funding scheme (#262700 to GAT, SEH, GP and MCM, and # 320656 to SEH and MCM). GAT is funded by the Australian National Health and Medical Research Council Investigator grant (#1195716) and by the Charter Hall Collaborative Grant from the Raine Medical Foundation (#RCA02‐20). GP is funded by the Australian National Health and Medical Research Council Project and Investigator Grants #1099655 and #1173991. MCM is funded by the European Research Council (ERC) under the European Union’s Horizon 2020 research and innovation programme (#947684)
DATA AVAILABILITY STATEMENT
Data can be access by application (https://helsedata.no/). Ethical approval is required.
REFERENCES
- 1. Lonhart JA, Mayo JA, Padula AM, Wise PH, Stevenson DK, Shaw GM. Short interpregnancy interval as a risk factor for preterm birth in non‐Hispanic black and white women in California. J Perinatol. 2019;39(9):1175–81. 10.1038/s41372-019-0402-1 [DOI] [PMC free article] [PubMed] [Google Scholar]
- 2. Smith GCS, Pell JP, Dobbie R. Interpregnancy interval and risk of preterm birth and neonatal death: retrospective cohort study. BMJ. 2003;327(7410):313–0. 10.1136/bmj.327.7410.313 [DOI] [PMC free article] [PubMed] [Google Scholar]
- 3. Conde‐Agudelo A, Belizán JM, Norton MH, Rosas‐Bermúdez A. Effect of the interpregnancy interval on perinatal outcomes in Latin America. Obstet Gynecol. 2005;106(2):359–66. [DOI] [PubMed] [Google Scholar]
- 4. Jansa V, Blickstein I, Lucovnik M, et al. The impact of inter‐pregnancy interval on subsequent risk of preterm birth. J Matern Fetal Neonatal Med. 2018;31(5):621–4. 10.1080/14767058.2017.1293027 [DOI] [PubMed] [Google Scholar]
- 5. Ekin A, Gezer C, Taner CE, Ozeren M, Mat E, Solmaz U. Impact of interpregnancy interval on the subsequent risk of adverse perinatal outcomes. J Obstet Gynaecol Res. 2015;41(11):1744–51. 10.1111/jog.12783 [DOI] [PubMed] [Google Scholar]
- 6. Shachar BZ, Lyell DJ. Interpregnancy interval and obstetrical complications. Obstet Gynecol Surv. 2012;67(9):584–96. 10.1097/OGX.0b013e31826b2c3e [DOI] [PubMed] [Google Scholar]
- 7. Kozuki N, Walker N. Exploring the association between short/long preceding birth intervals and child mortality: using reference birth interval children of the same mother as comparison. BMC Public Health. 2013;13(Suppl 3):S6. 10.1186/1471-2458-13-s3-s6 [DOI] [PMC free article] [PubMed] [Google Scholar]
- 8. Molitoris J, Barclay K, Kolk M. When and where birth spacing matters for child survival: an international comparison using the DHS. Demography. 2019;56(4):1349–70. 10.1007/s13524-019-00798-y [DOI] [PMC free article] [PubMed] [Google Scholar]
- 9. Conde‐Agudelo A, Belizán JM. Maternal morbidity and mortality associated with interpregnancy interval: cross sectional study. BMJ. 2000;321(7271):1255–9. 10.1136/bmj.321.7271.1255 [DOI] [PMC free article] [PubMed] [Google Scholar]
- 10. Hanley GE, Hutcheon JA, Kinniburgh BA, Lee L. Interpregnancy interval and adverse pregnancy outcomes. Obstet Gynecol. 2017;129(3):408–15. [DOI] [PubMed] [Google Scholar]
- 11. Getahun D, Oyelese Y, Salihu HM, Ananth CV. Previous cesarean delivery and risks of placenta previa and placental abruption. Obstet Gynecol. 2006;107(4):771–8. [DOI] [PubMed] [Google Scholar]
- 12. Hutcheon JA, Nelson HD, Stidd R, Moskosky S, Ahrens KA. Short interpregnancy intervals and adverse maternal outcomes in high‐resource settings: an updated systematic review. Paediatr Perinat Epidemiol. 2019;33(1):O48–o59. 10.1111/ppe.12518 [DOI] [PMC free article] [PubMed] [Google Scholar]
- 13. Zhu B‐P, Rolfs RT, Nangle BE, Horan JM. Effect of the interval between pregnancies on perinatal outcomes. N Engl J Med. 1999;340(8):589–94. [DOI] [PubMed] [Google Scholar]
- 14. Naeh A, Hallak M, Gabbay‐Benziv R. Parity and interval from previous delivery‐influence on perinatal outcome in advanced maternal age Parturients. J Clin Med. 2021;10(3):460. 10.3390/jcm10030460 [DOI] [PMC free article] [PubMed] [Google Scholar]
- 15. World Health Organization . Report of a WHO technical consultation on birth spacing. Geneva, Switzerland: 13‐15 June 2005: World Health Organization; 2007. [Google Scholar]
- 16. Tessema GA, Marinovich ML, Håberg SE, Gissler M, Mayo JA, Nassar N, et al. Interpregnancy intervals and adverse birth outcomes in high‐income countries: an international cohort study. PLoS One. 2021;16(7):e0255000. 10.1371/journal.pone.0255000 [DOI] [PMC free article] [PubMed] [Google Scholar]
- 17. Magnus MC, Wilcox AJ, Morken N‐H, Weinberg CR, Håberg SE. Role of maternal age and pregnancy history in risk of miscarriage: prospective register based study. BMJ. 2019;364:l869. 10.1136/bmj.l869 [DOI] [PMC free article] [PubMed] [Google Scholar]
- 18. Adolfsson A, Larsson P‐G. Cumulative incidence of previous spontaneous abortion in Sweden in 1983–2003: a register study. Acta Obstet Gynecol Scand. 2006;85(6):741–7. 10.1080/00016340600627022 [DOI] [PubMed] [Google Scholar]
- 19. Andersen A‐MN, Wohlfahrt J, Christens P, et al. Maternal age and fetal loss: population based register linkage study. BMJ. 2000;320(7251):1708–12. [DOI] [PMC free article] [PubMed] [Google Scholar]
- 20. Ball SJ, Pereira G, Jacoby P, de Klerk N, Stanley FJ. Re‐evaluation of link between interpregnancy interval and adverse birth outcomes: retrospective cohort study matching two intervals per mother. BMJ. 2014;349:g4333. 10.1136/bmj.g4333 [DOI] [PMC free article] [PubMed] [Google Scholar]
- 21. Haight SC, Hogue CJ, Raskind‐Hood CL, Ahrens KA. Short interpregnancy intervals and adverse pregnancy outcomes by maternal age in the United States. Ann Epidemiol. 2019;31:38–44. 10.1016/j.annepidem.2018.12.002 [DOI] [PubMed] [Google Scholar]
- 22. Coo H, Brownell MD, Ruth C, Flavin M, Au W, Day AG. Interpregnancy interval and adverse perinatal outcomes: a record‐linkage study using the Manitoba population research data repository. J Obstet Gynaecol Can. 2017;39(6):420–33. 10.1016/j.jogc.2017.01.010 [DOI] [PubMed] [Google Scholar]
- 23. Shachar BZ, Mayo JA, Lyell DJ, Baer RJ, Jeliffe‐Pawlowski LL, Stevenson DK, et al. Interpregnancy interval after live birth or pregnancy termination and estimated risk of preterm birth: a retrospective cohort study. BJOG. 2016;123(12):2009–17. 10.1111/1471-0528.14165 [DOI] [PubMed] [Google Scholar]
- 24. Conzuelo‐Rodriguez G, Naimi AI. The impact of computing Interpregnancy intervals without accounting for intervening pregnancy events. Paediatr Perinat Epidemiol. 2018;32(2):141–8. 10.1111/ppe.12458 [DOI] [PubMed] [Google Scholar]
- 25. Irgens L. The medical birth registry of Norway; a source for epidemiological and clinical research. Scand J Rheumatol. 1998;27(sup107):105–8. [DOI] [PubMed] [Google Scholar]
- 26. Bakken IJ, Ariansen AM, Knudsen GP, et al. The Norwegian patient registry and the Norwegian registry for primary health care: research potential of two nationwide health‐care registries. Scand J Public Health. 2020;48(1):49–55. [DOI] [PubMed] [Google Scholar]
- 27. Ahrens KA, Hutcheon JA, Ananth CV, Basso O, Briss PA, Ferré CD, et al. Report of the Office of Population Affairs' expert work group meeting on short birth spacing and adverse pregnancy outcomes: methodological quality of existing studies and future directions for research. Paediatr Perinat Epidemiol. 2019;33(1):O5–O14. 10.1111/ppe.12504 [DOI] [PMC free article] [PubMed] [Google Scholar]
- 28. ACOG Committee Opinion No . 736: Optimizing Postpartum Care. Obstet Gynecol. 2018;131(5):e140–e50. 10.1097/aog.0000000000002633 [DOI] [PubMed] [Google Scholar]
- 29. Zhang L, Shen S, He J, Chan F, Lu J, Li W, et al. Effect of Interpregnancy interval on adverse perinatal outcomes in southern China: a retrospective cohort study, 2000–2015. Paediatr Perinat Epidemiol. 2018;32(2):131–40. 10.1111/ppe.12432 [DOI] [PubMed] [Google Scholar]
- 30. Rodrigues T, Barros H. Short interpregnancy interval and risk of spontaneous preterm delivery. Eur J Obstet Gynecol Reprod Biol. 2008;136(2):184–8. 10.1016/j.ejogrb.2007.03.014 [DOI] [PubMed] [Google Scholar]
- 31. Buckland ST. Monte Carlo Confidence Intervals. Biometrics. 1984;40(3):811–7. 10.2307/2530926 [DOI] [Google Scholar]
- 32. Sundermann AC, Hartmann KE, Jones SH, Torstenson ES, Velez Edwards DR. Interpregnancy interval after pregnancy loss and risk of repeat miscarriage. Obstet Gynecol. 2017;130(6):1312–8. [DOI] [PMC free article] [PubMed] [Google Scholar]
- 33. Kangatharan C, Labram S, Bhattacharya S. Interpregnancy interval following miscarriage and adverse pregnancy outcomes: systematic review and meta‐analysis. Hum Reprod Update. 2017;23(2):221–31. 10.1093/humupd/dmw043 [DOI] [PubMed] [Google Scholar]
- 34. Love ER, Bhattacharya S, Smith NC, Bhattacharya S. Effect of interpregnancy interval on outcomes of pregnancy after miscarriage: retrospective analysis of hospital episode statistics in Scotland. BMJ. 2010;341:c3967. 10.1136/bmj.c3967 [DOI] [PMC free article] [PubMed] [Google Scholar]
- 35. Wilcox AJ, Weinberg CR, O'Connor JF, Baird DD, Schlatterer JP, Canfield RE, et al. Incidence of early loss of pregnancy. N Engl J Med. 1988;319(4):189–94. 10.1056/nejm198807283190401 [DOI] [PubMed] [Google Scholar]
- 36. Eskild A, Vatten LJ, Nesheim B‐I, Vangen S. The estimated risk of miscarriage should be corrected for induced abortion rates. Acta Obstet Gynecol Scand. 2009;88(5):569–74. [DOI] [PubMed] [Google Scholar]
- 37. Conde‐Agudelo A, Belizan J, Breman R, Brockman SC, Rosas‐Bermudez A. Effect of the interpregnancy interval after an abortion on maternal and perinatal health in Latin America. Int J Gynecol Obstet. 2005;89:S34–40. [DOI] [PubMed] [Google Scholar]
- 38. Regan AK, Gissler M, Magnus MC, Håberg SE, Ball S, Malacova E, et al. Association between interpregnancy interval and adverse birth outcomes in women with a previous stillbirth: an international cohort study. Lancet. 2019;393(10180):1527–35. 10.1016/s0140-6736(18)32266-9 [DOI] [PubMed] [Google Scholar]
- 39. Silva LM, Coolman M, Steegers EA, et al. Low socioeconomic status is a risk factor for preeclampsia: the generation R study. J Hypertens. 2008;26(6):1200–8. 10.1097/HJH.0b013e3282fcc36e [DOI] [PubMed] [Google Scholar]
- 40. Munim S, Maheen H. Association of gestational weight gain and pre‐pregnancy body mass index with adverse pregnancy outcome. JCPSP. 2012;22(11):694–8. [PubMed] [Google Scholar]
- 41. Mohllajee AP, Curtis KM, Morrow B, Marchbanks PA. Pregnancy intention and its relationship to birth and maternal outcomes. Obstet Gynecol. 2007;109(3):678–86. [DOI] [PubMed] [Google Scholar]
Associated Data
This section collects any data citations, data availability statements, or supplementary materials included in this article.
Supplementary Materials
Data S1
Data S2
Data S3
Data S4
Appendix S1
Data Availability Statement
Data can be access by application (https://helsedata.no/). Ethical approval is required.