

Abstract
Crying is an ubiquitous communicative signal in infancy. This meta‐analysis synthesizes data on parent‐reported infant cry durations from 17 countries and 57 studies until infant age 12 months (N = 7580, 54% female from k = 44; majority White samples, where reported, k = 18), from studies before the end Sept. 2020. Most studies were conducted in the United States, the United Kingdom, and Canada (k = 32), and at the traditional cry “peak” (age 5–6 weeks), where the pooled estimate for cry and fuss duration was 126 mins (SD = 61), with high heterogeneity. Formal modeling of the meta‐analytic data suggests that the duration of crying remains substantial in the first year of life, after an initial decline.
Abbreviations
- CPQ
Crying Pattern Questionnaire
- DIC
deviance information criterion
- RCT
randomized controlled trial
- SMD
standardized mean difference
INTRODUCTION
In 1962, Brazelton reported a seminal analysis of infants’ cry durations over the first 12 weeks of life, recorded by 80 mothers attending a private pediatric practice in Massachusetts, USA (Brazelton, 1962). In what has now come to be known as the “infant cry curve,” mothers reported gradual increases in their infants’ cry duration until 6 weeks, where crying and fussing had a “peak” average duration of 2.75 h per day. The infant cry curve has since become widely recognized by parents and clinicians as describing a predictable pattern, peaking at 6 weeks, then declining steadily until 12 weeks. Numerous studies in Western countries have replicated the early pattern of a peak and decline (Hunziker & Barr, 1986; Rebelsky & Black, 1972), and the cry curve has been described as the “most robust feature of infant crying” (Barr et al., 1987). Depictions of the infant “cry curve” feature centrally in psychoeducational materials for parents on infant crying (Barr, n.d.) and in clinician‐facing training materials (e.g., Royal Children's Hospital, 2019).
While the infant cry curve provides an intuitive depiction, it was originally derived from data until 12 weeks postpartum, and points to a steep decline in cry duration and minimal cry durations in later months. The accuracy of the cry curve depiction is important, because parents’ and indeed clinicians’ understanding of normative cry patterns will shape perceptions of normal or excessive crying. When crying is perceived as excessive in duration or intensity, or difficult to console, it is associated with negative consequences for parent and infant alike (Barr, 1990a). “Excessive” crying is associated with early termination of breastfeeding (Howard et al., 2006), parental distress, and symptoms of depression (Kurth et al., 2011; Murray & Cooper, 2001).
While Brazelton’s (1962) analysis is arguably best‐known for its description of “average” infant cry patterns, he also reported non‐trivial variability in crying between infants. The variability in infant cry patterns, and the reasons for such variability, have been the focus of considerable research. Evidence for the environmental determinants of infant crying behavior has emerged from observational studies of parenting behaviors, from trials intervening to change parenting behaviors, and from cross‐country descriptions. For example, higher maternal responsiveness to crying has been associated with greater subsequent cry duration (van IJzendoorn & Hubbard, 2000). Intervening to increase the amount of maternal carrying of the infant has also been associated with alterations to the “cry curve” (Hunziker & Barr, 1986). Anthropological studies of non‐Western and less industrialized societies also suggest radically different approaches to infant crying and reported infant cry durations. The Zhun/twa mothers from southern Africa, for example, have been described as “making every effort to anticipate hunger,” and pre‐emptively feeding, rather than engaging in cry‐signaled feeding typical in Western countries (Konner, 1972).
Given the numerous environmental factors that might affect infant cry duration, a 2017 review aimed to synthesize the available data from parent‐completed diary‐based studies carried out until infant age 12 weeks. Including data from nine countries until 2015, this analysis suggested that “the duration of infant fussing or crying drops significantly after 8–9 weeks of age” (Wolke et al., 2017), and the authors noted “no statistical evidence for a universal crying peak at 6 weeks.” The authors further reported that feeding type was related to cry durations, where, for example, samples that included breastfed infants had significantly higher fuss/cry durations at 3–4 weeks of age than the overall average. Finally, an association was also noted between the country of the infants’ families, with the most consistent finding being that Danish infants cried less across multiple time points than infants in other countries. These cross‐country differences, particularly related to Denmark, were widely cited in the media (e.g., O’Connell, 2017; Ramaswamy, 2017).
While the most dramatic changes in infant cry patterns occur in the first 3–4 months, crying and fussing remain a substantial component of infants’ communicative repertoire throughout the first year of life. Beyond the 12‐week period examined by Wolke et al. (2017), persistent crying can remain a challenge for parents, and after 6 months of age, may be associated with risk for additional infant regulatory difficulties (von Kries et al., 2006). In this preregistered review, we, therefore, synthesized data until 12 months, using both diary‐based and validated parent‐reported questionnaires to provide a comprehensive, updated mapping of available data.
In an exploratory analysis of the data added to the preregistered review, we developed a formal mathematical model of the continuous change in crying over the first 12 months of life, based on the classic “cry curve.” We use the data from our 12‐month meta‐analytic synthesis to compare our model's performance to that of three alternative statistical models, one based on a linear decay of cry duration, one on an exponential decay, and one assuming a period of high constant crying followed by a period of exponential decay. In addition to providing a formalization of the continuous change in cry duration over time, we can explicitly infer the age at which peak cry duration occurs. Our modeling approach also allows us to make inferences about other characteristics of the crying curve, such as the magnitude of the peak (e.g., maximum time spent crying per day), and the minimum cry duration, along with estimates of uncertainty.
METHOD
The study was conducted following the PRISMA recommendations for reporting systematic reviews and meta‐analyses (Liberati et al., 2009) and preregistered with PROSPERO (Booth et al., 2012), registration number (CRD42020210934). We searched the databases Scopus, PsycINFO, and PubMed using the keywords (and MeSH terms): (i) “infant" AND ("crying” OR "fussing") AND (diary OR questionnaire OR duration). Search dates were from “unrestricted” until Sept 2020. We excluded review articles (narrative and systematic reviews, meta‐analyses, editorials, and non‐peer‐reviewed sources; see Supporting Information for the specification for each database used). We restricted inclusion to English language articles only.
We included all study designs that reported on infant cry duration data until the infant age of 12 months. This included randomized controlled trial, cross‐sectional studies (e.g., birth cohort studies), longitudinal designs (e.g., prospective cohort studies). We excluded studies that included only experimental interventions, and no non‐experimental control group (i.e., treatment as usual, or wait list). Studies were included if they reported on a specific time point (e.g., 6 weeks) with a maximum range of 2 weeks around that time point. Where authors did not report on the age range but did report the mean and SD of age, we accepted a maximum SD of 3.5 days, such that 95% of infant ages within each study fell within a 2‐week range. We included studies that measured both infants with colic and infants categorized as non‐colic or healthy and synthesized data with the non‐colic groups. Where available, we report on data included in the control arm of an intervention only. If studies reported that there were no differences between the control arm and the experimental arm, and these data were not reported separately, we included the combined datasets (see Fujiwara et al., 2012), where combined results from the intervention and control arms only were reported (additionally reported in Barr, Barr, et al., 2009; Barr et al., 2009a; Radesky et al., 2013).
Missing data
Where data were not reported in the text, we used WebPlotDigitizer to extract mean and SD values (Rohatgi, 2017). We contacted 14 authors to obtain missing data or clarify the data presented in the manuscript, and received data from four of these authors (Anzman‐Frasca et al., 2013; Bilgin & Wolke, 2020a, 2020b; Jordan et al., 2020; Wynter et al., 2014) and the requested clarification from one author (Aloisio et al., 2018). One study was excluded because the age range of the infants was wider than the specified inclusion criteria (Wynter et al., 2014). For the six studies with missing SD data, we used the Bracken (1992) imputation method, taking the coefficient of variation from all complete cases, which is the SD divided by its mean. Study data for Blum et al. (2002) were extracted from Wolke et al. (2017). Duplicates were removed using EndNoteX8 (2019) and Rayyan software functionality (Ouzzani et al., 2016). Rayyan software was used for “title and abstract” and “full‐text” screening, with two independent reviewers (CP, SLM). Data extraction was performed independently by CP and SLM using customized spreadsheets.
We extracted data for eight criteria, following the quality‐assessment procedure described by Wolke et al. (1) subject selection (whole vs. defined population), (2) recruitment rate (≥50% vs. <50%), (3) participation rate (≥75% vs. <75%), (4) sample size (≥ 101 vs. <101), (5) whether 4‐sample characteristics were reported: socioeconomic status, parity, infant sex, parent age (3 of 4 reported vs. <3 reported), (6) feeding (reported vs. not), (7) resolution time for diary (5 vs. 15 min), (8) number of days requested for diary (≥4 vs. <4 days). Each sample received a score of 0 or 1 for each of the criteria. A score of 0 was given where the information for the criterion was not reported. Individual scores were summed to give a total quality score (0 to 8). For feeding type, we created a 5‐group categorization based on authors’ reports of the feeding type: (1 = majority >70% breastfeeding; 2 = majority bottle‐feeding; 3 = Breastfeeding only; 4 = Bottle only; 5 = Mixed, NA = no data).
Publication bias
Publication bias was assessed using two methods suggested for observational studies: the Begg and Mazumdar rank correlation test (Begg & Mazumdar, 1994) and the Duval and Tweedie “trim and fill” method (Duval & Tweedie, 2000). These methods rely on the assumption that small studies with non‐significant results are less likely to be published than studies with significant results, which may lead to overestimation of the true mean effect size. Therefore, they test for the absence of small non‐significant studies in the data, and estimates can be adjusted based on the results. We used funnel plots to visualize the distribution of effect sizes (Peters et al., 2008).
Statistical analysis
The R packages (version 4.0.5) metagear, meta, metafor, car, tidyverse, patchwork, and tmap were used for data synthesis, visualizations, and analyses (Balduzzi et al., 2019; Lajeunesse, 2016; R Core Team, 2021; Tennekes, 2018; Viechtbauer, 2010; Wickham, 2019). To synthesize cry duration data, we calculated a mean (weighted by sample size) and the pooled weighted SD for 2‐week intervals until infant age 12 weeks (6 intervals) and from 13 weeks, for 4‐week intervals. This categorization until 12 weeks replicated the time intervals reported by Wolke et al. (2017). Given that fewer studies reported on data from infant age 13 weeks onwards relative to before 13 weeks, we created 4‐week categorizations to maximize number of studies available to pool. To test differences in cry durations across these age intervals, we replicated the analysis reported by Wolke et al. (2017), but using fixed‐effects regression to test the overall effect of age intervals. We synthesize three cry outcome variables in presenting our overall results: “crying and fussing,” “crying only” and “total distress”—including crying, fussing, and inconsolable crying. All additional analyses use “crying and fussing” as the outcome variable, given its status as the most frequently reported outcome.
Effect sizes are also reported as the standardized mean difference with 95% CIs for each study. The mean difference compares the individual study's mean with the overall weighted mean across studies, for each age interval. Hedge's g, a variation of Cohen's d that corrects for biases due to small sample sizes (Hedges & Olkin, 1985), was selected as the appropriate effect size, given the sample size of a number of the included studies (23% of samples across studies included less than 35 infants). Effect sizes were analyzed using random effects models, in which the error term is composed of variation originating from both within‐study variability and between‐study differences. All materials related to the analyses are available on the Open Science Framework, with the following link: https://osf.io/dzhvm/.
Following the prior synthesis of parent‐reported cry data (Wolke et al., 2017), and studies demonstrating cross‐country differences in parenting practices that might be associated with infant crying (e.g., St. James‐Roberts et al., 2006), we expected to confirm the presence of cross‐country differences in cry duration. We furthermore expected to confirm an overall, but nonlinear, decline in cry duration with infant age, based on prior descriptions of infant cry developmental patterns (Barr, 1990b). We did not have a specific hypothesis regarding the direction of effects for two of the additional moderators tested, infant feeding type or study quality, because of the limited evidence base available for these.
Heterogeneity
Heterogeneity was explored using Q and I2 statistics (Sterne et al., 2008). Due to the low statistical power of heterogeneity tests, we used a p‐value of ≤.10 to determine significant heterogeneity (Poole & Greenland, 1999). The I2 statistic is an estimate of the amount of variance in a pooled effects size accounted for by heterogeneity in the sample of studies, and is not sensitive to the number of studies (Higgins et al., 2003). An I2 value of 0% indicates no observed heterogeneity, while values of 25%, 50%, and 75% are considered low, moderate, and high, respectively. Categorical moderator tests were applied to test for between groups heterogeneity (Q b). A significant value for Q b indicates that the effect sizes are significantly different across distinct categories of the moderator variable. Meta‐regression analyses were performed to test quality of assessment as a continuous moderator, and for feeding type (five categories).
Modeling of the cry curve
In an extension of the preregistered review, we modeled continuous change in cry duration during the first year of life, as presented in the classic “cry curve,” with a peak and then decline cry duration pattern. Based on the results of the analysis presented in Wolke et al. (2017), we also developed a change‐point detection model. The change‐point model represents the data in two distinct periods, starting with a period of constant high cry duration followed by an exponential decay. We then compared this classic cry curve models and our change‐point model to alternatives, using data from the meta‐analysis. This modeling approach provides a more informative way to synthesize available data than presenting cross‐sectional data points alone. Although the age of peak infant crying time is conceptualized in continuous time (or on a scale of days), most studies report either cross‐sectional data (see Table 1), or longitudinal data collected at discrete intervals (e.g., at 5–6 weeks and 11–12 weeks), a binning which entails information loss. To compound this problem, different longitudinal studies use different data collection intervals (e.g., 8–9 weeks, 9–10 weeks), such that cross‐study comparison requires binning of measurements into still larger intervals. A formalization of the continuous change in cry duration over developmental age can be more flexibly fitted to data within and across studies.
TABLE 1.
Characteristics of the included studies
| Study | Year | Country | Measure | Res. | Diary days (e.g., 3 days) | When was the data collected? | Recruit. | Part. | Char | Population | Feeding type: majority (>70) | SS | % Female | Ethnicity |
|---|---|---|---|---|---|---|---|---|---|---|---|---|---|---|
| Atella et al. (2003) | 2003 | USA | 24‐h diary | 5 | 3 | NR | NR | 77.37 | 3 | Defined | Majority breastfeeding | 106 | 48 | Mothers: 88% European American, 9% African American, 3% Asian/Asian‐American |
| Barr et al. (1989) | 1989 | Canada | 24‐h diary | 5 | 7 | 1981–1982 | 84 | 69; 22 | 3 | Whole | Separate groups | 374 | 46 | |
| St. James‐Roberts et al. (2001) | 2001 | UK | 24‐h diary | 5 | 3 | NR | 35 | 94 | 2 | Whole | Mixed | 191 | — | Mothers: White: 92% |
| St. James‐Roberts et al. (1994) a | 1994 | India | CPQ | NA | NA | NR | NR | NR | 2 | Whole | All breastfeeding, then majority | 100 | 49 | |
| St. James‐Roberts et al. (2006) | 2006 | Denmark, UK | 24‐h diary | 5 | 4 | NR | DK: 44; UK: 26 | UK: 63.8; 46.5; 43.1; DK: 80.4 73.5; 72.4 | 4 | Whole | Mixed for London, Denmark: All breastfeeding, then majority | 70 | LON: 52; DEN: 43 | Denmark: 92% mothers, 89% fathers: White European/Danish national origins; London community group: White 75% mothers, 71% fathers |
| Aloisio et al. (2018) | 2018 | Italy | 24‐h diary | NR | 10 | 2013–2016 | 58.96 | 98.10 | 2 | Whole | Majority breastfeeding | 155 | 48 | |
| Alvarez (2004) | 2004 | Denmark | 24‐h diary | 5 | 3 | 1997–1999 | 54.50 | 78.67 | 4 | Whole | Majority breastfeeding | 118 | 57 | |
| DeLeon and Karraker (2007) | 2007 | USA | 24‐h diary | 15 | 7 | NR | NR | NR | 3 | Whole | Mixed | 41 | 37 | Non‐Hispanic White (95%) |
| Anzman‐Frasca et al. (2013) | 2013 | USA | 24‐h diary | 15 | 4 | NR | NR | 66.88 | 4 | Defined | Majority breastfeeding, Mixed at 16 weeks | 49 | 59 | 86.4% White |
| Baildam et al. (1995) | 1995 | UK | 24‐h diary | 5 | 1 | 1978–1980 | 99.5 | 78.5 | 0 | Whole | Majority bottle‐fed | 157 | 48 | |
| Bilgin and Wolke (2020a) | 2020 | UK | CPQ | NA | NA | NR | NR | NR | 4 | Whole | Majority bottle‐feeding | 105 | 44 | |
| Blum et al. (2002) | 2002 | USA | 24‐h diary | 5 | 4 | NR | NR | 53; 52; 51; | 3 | Whole | NR | 60 | 50 | Parents: White: 85% |
| Bolten et al. (2012) | 2012 | Switzerland | 24‐h diary | 15 | 3 | NR | NR | 73.62 | 4 | Whole | NR | 120 | 45 | |
| Bonichini et al. (2008) | 2008 | Italy | 24‐h diary | 5 | 3 | NR | NR | 77.78 | 4 | Whole | NR | 70 | 53 | |
| Clifford et al. (2002a) | 2002a | Canada | 24‐h diary | 5 | 7 | 1999 | 84 | 69.85 | 2 | Whole | Mixed | 431 | — | |
| Clifford et al. (2002b) | 2002b | Canada | 24‐h diary | 5 | 7 | 1999 | 84 | 58.68 | 2 | Whole | NR | 320 | — | |
| Darlington and Wright (2006) | 2006 | UK | 24‐h diary | 15 | 2 | NR | NR | 58.19; | 2 | Whole | Mixed | 75 | 57 | |
| de Weerth and Buitelaar (2007) | 2007 | NL | 24‐h diary | NR | 4 | NR | NR | 87.93 | 4 | First born | Mixed | 102 | 50 | Mothers: 100% White |
| Fujiwara et al. (2012) | 2011 | USA, Canada | 24‐h diary | 5 | 4 | 2004–2006 | 54.11 | 67.82 | 3 | Whole | NR | 1857 | ‐ | |
| Geeraerts et al. (2020) | 2020 | USA | 24‐h diary | 5 | 3 | 2009–2018 | NR | 80 | 3 | Whole | NR | 132 | 46 | 93.29%: White 2.01%: as Black/African American, 1.34%: Hispanic or Latino; 1.34% Asian; 2%: Native Hawaiian/Pacific Islander; American Indian/Alaskan Native, ethnicity not provided |
| Harrison (2004) | 2004 | UK | 24‐h diary | 5 | 3 | 2003 | NR | 77.78 | 1 | Whole | NR | 56 | 54 | |
| Hechler et al. (2018) | 2018 | NL | 24‐h diary | 5 | 3 | NR | NR | 67.53 | 4 | Defined | Majority breastfeeding | 68 | 49 | |
| Hiscock et al. (2014) | 2014 | Australia | 24‐h diary | 10 | 3 | 2010–2011 | 55.00 | 65.9; 54.7; | 4 | Whole | Majority breastfeeding | 259 | 49 | |
| Hunziker and Barr (1986) | 1986 | Canada | 24‐h diary | 5 | 7 | 1983 | 50.00 | 86.21 | 4 | Defined: breastfed, first born | Breastfeeding only; then 40–45 introduced formula | 50 | 58 | 44 White, 3 Black; 3 Chinese/Oriental |
| Jordan et al. (2020) | 2020 | Canada | 24‐h diary | NR | 7 | 2015–2017 | NR | NR | 3 | Whole | NR | 10 | 30 | White: 90%; White/Hispanic: 10% |
| Keller et al. (1996) | 1996 | Germany | 24‐h diary | 5 | 3 | 1990–1991 | NR | NR | 4 | Defined: firstborn | NR | 13 | 38 | Mothers: 100% White |
| Keller et al. (1998) | 1998 | Germany | 24‐h diary | 5 | 3 | NR | 70; NR | 82; 58; | 2 | Defined: firstborn | NR | 62 | — | |
| Killerby (1992) | 1992 | UK | 24‐h diary | 5 | 1 | 1989–1990 | NR | NR | 2 | Defined: selected for crying and not crying | Mixed | 14 | 57 | |
| Kivijärvi et al. (2004) | 2004 | Finland | 24‐h diary | 5 | 1 | NR | NR | NR | 3 | Defined: socioeconomic minimum education | NR | 56 | 66 | |
| Korja et al. (2008) | 2008 | Finland | 24‐h diary | NR | 3 | 2001–2002 | 55.00 | 94.74 | 4 | Defined | NR | 36 | 47 | |
| Kramer et al. (2001) | 2001 | Canada | 24‐h diary | NR | 3 | 1998–1999 | NR | 92.91 | 3 | Defined: breastfeeding | Breastfeeding initially | 183 | — | |
| Lam et al. (2010) | 2010 | Canada | 24‐h diary | 5 | 7 | NR | 67.88 | 64.52 | 4 | Whole | NR | 33 | 42 | Mother's ethnicity: 25% Asian, 12% Filipino, 12% Other %; White—52% |
| Lee (1994) | 1994 | South Korea | 24‐h diary | 5 | 1 | NR | NR | NR | 0 | Whole | NR | 32 | — | |
| Lee (2000) | 2000 | South Korea | 24‐h diary | 5 | 1 | 1996–1997 | NR | NR | 0 | Whole | NR | 143 | — | |
| Litmanovitz et al. (2014) | 2014 | Israel | 24‐h diary | NR | 3 | 2009–2011 | NR | 72; 60 | 4 | Defined: feeding type | Separate groups | 35 | 42 | |
| Lohaus et al. (2001) | 2001 | Germany | 24‐h diary | 5 | 3 | NR | NR | 100 | 4 | Defined: firstborn | NR | 20 | 45 | |
| Lucas and St. James‐Roberts (1998) | 1998 | UK | 24‐h diary | 5 | 3 | NR | NR | 94; 78; 95.5 | 4 | Defined | Separate groups | 92 | 48 | White: 63% |
| Lucassen et al. (2003) | 2003 | NL | 24‐h diary | 10 | 7 | 1994–1997 | NR | NR | 0 | Defined: feeding type | Majority bottle feeding | 90 | — | |
| McGlaughlin and Grayson (1999) | 1999 | UK | CPQ | NA | NA | NR | NR | 57.14 | 0 | Defined: Crying | NR | 40 | — | |
| McRury and Zolotor (2010) | 2010 | USA | 24‐h diary | 5 | 3 | 2005–2006 | 3.62 | 68.6; 31; 31; 33; 27; | 3 | Whole | NR | 35 | — | |
| Meijer and van den Wittenboer (2007) | 2007 | NL | CPQ | NA | NA | NR | NR | NR | 4 | Defined: firstborn | Mixed | 86 | 49 | |
| Miller et al. (1993) | 1993 | Canada | 24‐h diary | NR | 7 | NR | NR | 77.88 | 4 | Define: firstborn | Most breastfeeding | 88 | 50 | Mothers: White 72% |
| Miller‐Loncar et al. (2004) | 2004 | USA | 24‐h diary | 15 | 3 | 1998–2000 | 57 | NR | 3 | Whole | Mixed | 43 | 38 | 92% White; 8% hispanic |
| Mohebati et al. (2014) | 2014 | Mexico | CPQ | NA | NA | 2000–2002 | NR | 67 | 4 | Defined | Majority breastfeeding for early points | 204 | 53 | |
| Öztürk Dönmez and Bayik Temel (2019) | 2019 | Turkey | 24‐h diary | 15 | 7 | 2012–2014 | NR | 77.78 | 4 | Defined: first born | Majority breastfeeding | 21 | 52 | |
| Popp et al. (2019) | 2019 | Germany | 24‐h diary | NR | 3 | NR | 81.67 | 61.90 | 4 | Define: firstborn | NR | 13 | 56 | |
| Shinohara and Kodama (2012) | 2012 | Japan | 24‐h diary | 5 | 3 | NR | 50 | 100 | 3 | Whole | Mixed | 31 | 52 | |
| St. James‐Roberts and Conroy (2005) | 2005 | UK | 24‐h diary | 5 | 3 | NR | NR | 94.6; 90 | 3 | Whole | Mixed at discharge, then NR | 88 | — | Mothers: 88% White |
| St. James‐Roberts and Menon‐Johansson (1999) | 1999 | UK | 24‐h diary | 5 | 3 | NR | NR | 56; 80; 80; | 0 | Whole | NR (recorded) | 14 | — | |
| St. James‐Roberts and Plewis (1996) | 1996 | UK | 24‐h diary | 5 | 1–3 | NR | 92.17 | 61; 46.5; 34; 36.5 | 2 | Whole | NR (recorded) | 122 | 46 | |
| St. James‐Roberts et al. (1993) | 1993 | UK | 24‐h diary | 5 | 1 | NR | NR | NR | 2 | Whole | Mixed | 32 | 50 | |
| St. James‐Roberts et al. (2003) | 2003 | UK | 24‐h diary | NR | 3 | NR | NR | 68.38 | 4 | Whole | Majority breastfeeding | 93 | 51 | Mothers/fathers: White: 88% |
| Stifter et al. (2003) | 2003 | USA | 24‐h diary | 5 | 4 | NR | NR | 88.8 | 4 | Whole | NR | 128 | 42 | White: 98% |
| Wake et al. (2006) | 2006 | Australia | 24‐h diary | 5 | 1 | 1998–2000 | 68.00 | 92, 89, 88 | 4 | First born | NR | 446 | 49 | |
| Walker and Menahem (1994) | 1994 | Australia | 24‐h diary | NR | 1 | 1987–1989 | NR | 53.85 | 3 | Whole | Majority breastfeeding | 21 | 48 | |
| Milgrom et al. (1995) | 1995 | Australia | 24‐h diary | 5 | 7 | NR | NR | 91, 66 | 4 | Defined: depression | Majority breastfeeding, then NR | 63 | 51 | |
| Wurmser et al. (2006) | 2006 | Germany | 24‐h diary | 5 | 5 | NR | NR | 68; 67 | 4 | Whole | NR (recorded) | 64 | 52 |
Manali sample included; NL, the Netherlands; Res., resolution of diary (5 mins, 15mins), Recruit., recruitment %, Part., participation %; Char., characteristics of sample reported (from four items socioeconomic status, parity, infant sex, and maternal age); population selection (whole vs. defined population); SS, sample size: from first recorded time point: NA, not applicable; NR, not reported.
The traditional cry curve model: Double exponent
Importantly, our formalization explicitly includes a representation of the age at which peak cry duration occurs. The model also allows us to make inferences beyond age of peak cry duration. Other characteristics of the cry curve include the magnitude of the peak (i.e., maximum time spent crying per day), the rate of increase or decrease in crying over time, and the lower asymptote of the curve (i.e., the lower bound on crying throughout the modeled time period). Our modeling can also quantify our uncertainty in these estimates, given the data available.
To specify the model, we assume that cry duration data at each measurement follows the gamma distribution:
| (1) |
where µ Study is the mean cry time reported for an individual measurement, and α and β are the shape and rate parameters of the distribution. We choose the gamma distribution, because unlike the normal distribution, it is restricted to non‐negative numbers (see Figure S4). We re‐parameterize the gamma distribution in terms of its mode and standard deviation, such that:
| (2) |
where µ is the inferred cry time in the model, and σ represents uncertainty in the estimate µ. The uncertainty parameter σ is unknown and assumed to follow a gamma distribution.
| (3) |
We model change in crying time µ using a double exponent model. The double exponent model represents a mixture of rise and decay processes, with separate parameters governing the increase in cry duration to a peak, followed by steady decay (see Figure S5):
| (4) |
In the model, A 0 represents the lower asymptote, or minimum cry duration. The γ parameters represent the rate of decrease (γ decay) and increase (γ rise) in duration across the modeled period. The parameter A is a scaling parameter, which regulates the height of the curve, and gives an indication of magnitude (not age) of the peak cry duration. The parameters A and A 0 are non‐negative, and so are also assumed to follow the gamma distribution:
| (5) |
The parameters γ rise and γ decay are rates, and so are assumed to follow a uniform distribution:
| (6) |
with the decay rate (i.e., the rate at which crying decreases over developmental time) assumed to be lower than the rise rate (i.e., the rate at which it increases). From here it is possible to define peak crying time as the first derivative of the model, solved for .
Thus, we infer the age at which crying time peaks as:
| (7) |
The change‐point detection model
We tested an alternative, plausible model, a change‐point detection model* (adapted from Lee & Wagenmakers, 2013) to examine the evolution of mean cry/fuss duration in time as a two‐part process: starting at a constant rate, then after a specific time point, changing to an exponential decay. The strength of the change‐point detection model is that it can infer from the data, the point in time at which the system switches dynamics, therefore allowing us to compare the inferred time at which cry duration starts decreasing in this model with the cry peak of the double exponential model.
As for the double exponential model, mean cry/fuss time is assumed to follow a gamma distribution, and is re‐parameterized in terms of its mode µ and standard deviation σ (identical to Equation (1), (2), (3)). In addition, the uncertainty parameter σ is also assumed to be constant across both processes (higher cry duration, lower cry duration). To constrain the model, the change‐point parameter χ is assumed to follow a uniform distribution, bounded between 0 and t max, the maximum age available in the dataset (52 weeks).
| (8) |
If the age (in weeks) of infants in a study is below χ, the mode cry duration µ is equal to the constant µ initial. If it is above χ, it follows an exponential decay with rate τ, starting at µ initial and with lower asymptote A 0.
| (9) |
The parameters µ initial and A 0 are assumed to follow a gamma distribution, while τ is assumed to follow a uniform distribution.
| (10) |
These two models were applied to both simulated data, and to our meta‐analytic data. We also included two simpler models: a decay only model (i.e., ), and a linear model with a decrease in crying over developmental time.
Bayesian inference (implemented using Gibbs sampling in JAGS via the R2jags package; Plummer, 2003, 2019; Su & Yajima, 2021) was used to infer model parameters. Three chains of 10,000 samples were used, with the first 5000 samples discarded as burn in. Initial values were randomized. These settings were constant across models. For model comparison, we report the deviance information criterion (DIC), where lower DIC represents a better model fit (Spiegelhalter et al., 2002), and Akaike weights, representing the conditional probabilities of a finite set of models given the data (Wagenmakers & Farrell, 2004).
RESULTS
Figure 1 presents the PRISMA flow diagram for study inclusion (see OSF folder for individual study exclusions at Full‐Text screening: https://osf.io/dzhvm/). We included data from 57 studies (see Table 1 for full study characteristics). The median study sample size at the first time point assessed was 70 (IQR = 36–122) with a minimum of 10 (Jordan et al., 2020) and a maximum of 1857 participants (Fujiwara et al., 2012). The median study publication year was 2004, with the earliest study published in 1986, and the most recent in 2020.
FIGURE 1.
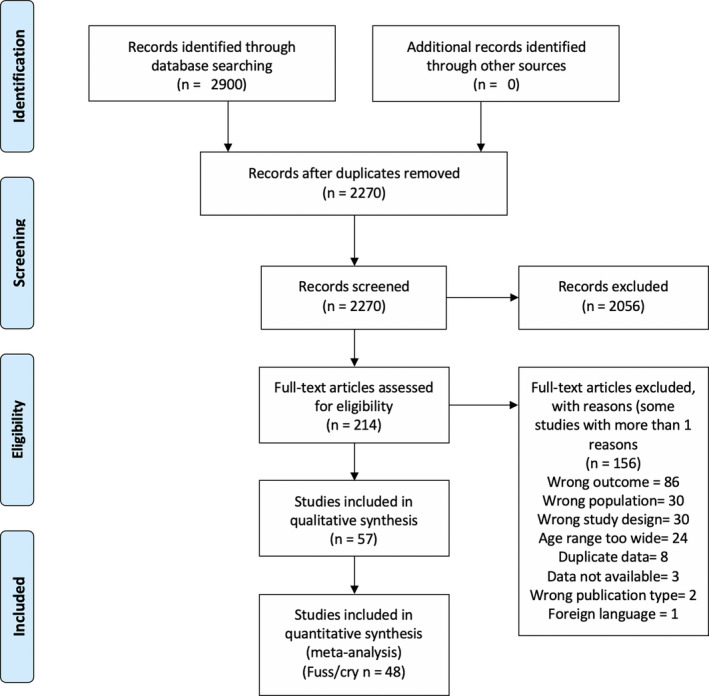
PRISMA flow diagram
Data were drawn from 17 countries (the United States, the United Kingdom, Canada, Australia, Denmark, Switzerland, Italy, the Netherlands, Germany, Finland, Japan, South Korea, Israel, Mexico, Turkey, India, Sweden, see Figure 2a). Most of the studies were from Canada (k = 9; Barr et al., 1989; Clifford et al., 2002a, 2002b; Fujiwara et al., 2012; Hunziker & Barr, 1986; Jordan et al., 2020; Kramer et al., 2001; Lam et al., 2010; Miller et al., 1993), the United States (k = 9; Anzman‐Frasca et al., 2013; Atella et al., 2003; Blum et al., 2002; DeLeon & Karraker, 2007; Fujiwara et al., 2012; Geeraerts et al., 2020; McRury & Zolotor, 2010; Miller‐Loncar et al., 2004; Stifter et al., 2003) and the United Kingdom (k = 14; Baildam et al., 1995; Bilgin & Wolke, 2020a; Darlington & Wright, 2006; Harrison, 2004; Killerby, 1992; Lucas & St. James‐Roberts, 1998; McGlaughlin & Grayson, 1999; St. James‐Roberts & Conroy, 2005; St. James‐Roberts & Menon‐Johansson, 1999; St. James‐Roberts et al., 1993, 1994, 2001, 2003, 2006).
FIGURE 2.

(a) Global map presenting the number of available studies from each country. (b) Numbers of studies providing data per age interval and per country. (c) The number of studies conducted at each age interval, by questionnaire and diary measures
Infant characteristics
The youngest participants were aged 1 week (Lohaus et al., 2001; McRury & Zolotor, 2010; Mohebati et al., 2014; St. James‐Roberts & Menon‐Johansson, 1999; St. James‐Roberts et al., 2001). The oldest participants were aged 52 weeks (Baildam et al., 1995; Keller et al., 1998; Kivijärvi et al., 2004; McGlaughlin & Grayson, 1999; Meijer & van den Wittenboer, 2007; Wake et al., 2006). Most studies reported on infant measures at the 5‐ to 6‐week interval (k = 35, see Figure 2b). The majority of studies (44/57) reported on the overall sex/gender composition of the sample. Overall, there was approximately an even proportion of male and female infants included (49% female, see Table 1). We performed further exploratory analysis of the gender composition of our data, and observed that the variation across samples was within the range of sampling error (see Figure 3). As would be expected, larger participant sample sizes were associated with samples closer to 50% male and female infants. However, we also found no evidence of bias toward more male or female participants for studies with small sample sizes (<200 participants). Independent age groups were closely balanced, except for the age interval 33–37 weeks (37% female), where just one study with 41 participants was included. Ethnicity of the infants included was sparsely reported overall (8 studies reporting infant ethnicity, 10 reporting maternal/parental ethnicity). Where ethnicity was reported, this was typically given as the majority ethnicity, which was “White” in all studies (see Table 1).
FIGURE 3.

Distribution of gender across study samples. The relation between sample size and male to female proportion (gender balance). A gender balance of “0” indicates a male‐only sample, while a gender balance of 100 indicates a female‐only sample. The orange area represents the theoretical sampling error for a given sample size, obtained through simulations (n = 10,000 for sample sizes of 1, 5, 10, 25, 100, 200, 400, 700, with a true proportion of 50%, indicated by the red line). The orange shaded region represents the 5% and 95% quantiles of gender balance for a given sample size and the brown dots represent the available data
Measures and study design
The majority of studies used the Barr Baby 24‐h diary (see Figure 2c; one study used the Infant Sleep Activity Record, a 24‐h diary; Öztürk Dönmez & Bayik Temel, 2019) or a modified version with a time resolution of 10 or 15 min (k = 8) instead of the standard 5 min (k = 34, 10 studies did not report the time resolution). The median number of diary days was 3 (range 1–10 days). Most studies also specified that mothers completed the diaries (k = 35), and none included data from fathers reporting on their infants’ crying specifically. Four studies used the Crying Pattern Questionnaire, the CPQ (Bilgin & Wolke, 2020a; Meijer & van den Wittenboer, 2007; Mohebati et al., 2014; St. James‐Roberts et al., 1994). McGlaughlin and Grayson (1999) used a modified version of the CPQ, assessing crying only, rather than “crying and fussing” as in the standard CPQ. Mohebati et al. (2014) also adapted the CPQ to the country‐specific appropriate time periods.
Most of the included studies combined crying and fussing into one category of “cry/fuss” (k = 26). A number of studies also measured and included “inconsolable crying” in their outcome, which we refer to as “total distress” (k = 4). Several studies reported on crying only (k = 5), specifying that they excluded fussing (Baildam et al., 1995; Harrison, 2004; Litmanovitz et al., 2014; McGlaughlin & Grayson, 1999; Walker & Menahem, 1994) or reporting crying only alongside fussing, and inconsolable crying (k = 22). When studies reported crying and fussing separately, these were summed and added to the category of “cry/fuss” (k = 23). If inconsolable crying was reported separately alongside with cry and fuss, then these were summed to be included in the “total distress” category (k = 11). The majority of studies were longitudinal studies (k = 35), with a smaller number comprising cross‐sectional studies (k = 10), intervention trials (k = 10) and two case‐control studies. A minority of studies reported on the timing of their data collection, and of these, most collected data in the early 2000s (see Table 1).
Synthesizing cry duration measures
We calculated weighted means per age interval for three cry duration measures (i) fuss and cry combined (cry/fuss) (ii) only crying, (iii) fussing and inconsolable crying (total distress). Means were weighted by number of participants to reduce the bias induced by studies with small sample sizes (see Figure 4). The linear regressions to assess the effect of age used raw means and followed the structure: formula = Mean minutes ~ Age interval.
FIGURE 4.

Weighted mean duration for three measures of infant cry duration: (a) cry/fuss; (b) cry only; (c) total distress. Each panel combines country‐level data across ages. Orange circles represent mean durations of individual samples within available studies. The circle size reflects the number of infants and is used to visualize that influence of a given sample in the calculation of the weighted means. The light orange bar represents the standard deviation of age intervals, pooled across available samples. The dark circles represent the weighted mean of each age interval, and the error bar represents its standard error
(i) For infant cry/fuss, the overall weighted mean was approximately 93 min (pooled SD = 54.53). The highest duration was at 5–6 weeks (126 min, SE = 11.39). The lowest value was for 18–22 weeks at 34 min (SE = 24.36). Figure 5a shows two different clusters of age intervals with broadly comparable durations (1–10 weeks; 11–38+ weeks). Cry/fuss was recorded as longer in duration at the age intervals until 9–10 weeks, with mean estimates ranging from 78 to 126 min. From 11 to 12 weeks to 38+ weeks, mean estimates were between 34 (18–22) and 66 (13–17) min, and there were fewer available studies with smaller sample sizes (Figure 4a). The large SE at 33–37 weeks can be explained by the presence of only one sample of infants. The regression analysis using unweighted mean durations confirmed this pattern of results, with the intercept (1–2 weeks) estimated at 99.32 min (SE = 10.50, t(101) = 9.46, p < .001). The durations at age intervals 11–12, 18–22, 23–27, and 38+ weeks were all significantly lower than the intercept (b values, −34.5 to 57.6; p values = .03–.01, see Supporting Information). In summary, the 5‐ to 6‐week interval had the longest duration of cry/fuss, after 11–12 weeks, there were broadly lower overall averaged cry/fuss durations, compared to the overall weighted and unweighted means.
FIGURE 5.

Weighted mean of parent‐reported cry/fuss duration across the infant age intervals and across all available countries (blank cells represent ages and countries with no available data). The standardized mean difference (SMD) is calculated by comparing the weighted mean of each cell to the overall weighted mean across age intervals and countries, providing an overview of the effect of both age and country on cry/fuss duration
The weighted mean duration of (ii) “crying only” across all age intervals was approximately 38 min (pooled SD = 32.32). The highest mean duration occurred at 5–6 weeks (approx. 42 min, SE = 8.49; see Figure 4b), with similar estimates at 1–2 weeks (41, SE = 11.34) and 7–8 weeks (40, SE = 15.74). The lowest mean duration was estimated at 38+ weeks (20, SE = 10.06) and 23–27 weeks (20, SE = 10.06). Only 1 study reported on infant crying only for 9–10 weeks (34, SE = 41) and 33–37 weeks (31, SE = 26), explaining the large standard error. For the regression analysis using unweighted means, the intercept (1–2 weeks) was estimated at 43 min (SE = 5.30, t(41) = 8.11, p < .001). Only the mean durations from age intervals 23–27 weeks (b = −21.21, SE = 9.18, t(41) = −2.33, p = .02) and 38+ weeks (b = −18.84, SE = 8.55, t(41) = −2.20, p = .03) were significantly lower than the intercept.
(iii) Of the three cry measures, total distress had the least available data (k = 28), explaining the high variability of the weighted mean durations (Figure 4c). Three age intervals had just one sample, at 7–8, 9–10, and 13–17 weeks, while 5–6 weeks comprised 43% of the samples available (k = 12). The highest mean duration occurred at 3–4 weeks with 155 min (SE = 53.14) and the lowest occurred at 11–12 with 90 min (SE = 35.59). The results of the regression set the intercept (1–2 weeks) at 121 min (SE = 8.32, t(20) = 14.52, p < .001) and only the age interval 11–12 appears to be significantly lower (b = −35.86, SE = 14.41, t(20) = −2.49, p = .02).
Cross‐country comparisons: Cry/fuss
We performed subgroup analyses using random effects models for the age intervals with more than 10 studies, as per recommendations (Higgins et al., 2003). For all age intervals assessed, we found significant subgroup effects (6 intervals: 1–2, 3–4, 5–6, 7–8, 11–12, 13–17; Q values: 78.91–452.36; p values all <.0001). We particularly note countries with 95% CIs for their standardised mean difference estimates that did not overlap with the overall estimate CIs for the given age interval. At 1–2 weeks, three non‐Western countries (India, South Korea, and Mexico) had mean cry/fussing durations of 13, 33, and 41 min, whereas the Western countries ranged from 76 min for Denmark to 148 min for Italy (see Figure 5). Indeed, across all available age intervals, country data from India, South Korea, and Mexico was lower than the averages, with the most pronounced differences for the intervals before 12 weeks. However, Mexico and India were represented by one study each, and two studies were used to calculate the average cry/fuss time of South Korea. Estimates of cry/fuss from Germany and Turkey appeared to be higher than the pooled estimates from other studies, but Turkey was represented by a single study also (Öztürk Dönmez & Bayik Temel, 2019). From the Western countries included, Danish infants had lower recorded cry and fuss durations based on the two available studies (Alvarez, 2004; St. James‐Roberts et al., 2006).
Focusing on 5–6 weeks, the age interval with most available data, the United Kingdom, the United States, and Canada, clustered at around 120 min of estimated infant crying (25 samples were included from these 3 countries), while the Netherlands, Switzerland, and Germany (4 samples) had slightly higher estimated averages (146–151 min). Similar to the 1‐ to 2‐week interval findings, Korea, Denmark, Mexico, and India all had lower estimates (non‐overlapping CIs) than the age interval pooled estimate, but the Netherlands had a higher estimate (see Supporting Information for full model results). As seen in Figure 5, cross‐country comparison data are sparse at 9–10 weeks, and only a small number of countries contribute data, particularly for older infants (33 weeks onwards).
Heterogeneity of estimates
At each age interval, there was significant heterogeneity in cry/fuss duration estimates, with I2 values ranging between 82.5% for the 38+ weeks age interval, to 97.5 for the 1–2 weeks age interval. The statistical heterogeneity present is at least partially related to between‐country differences, as illustrated in Figure 5, where three countries (Mexico, India, and South Korea) represented by four studies represented more extreme outliers, with considerably lower cry/fuss durations reported at all assessed age intervals. We used the dmetar R function to detect outliers, whereby the study's confidence interval did not overlap with the confidence interval of the pooled effect at each age interval. This means the study's effect size estimate is unlikely to be part of the "population" of effect sizes pooled in the present meta‐analyses (i.e., the individual study differs significantly from the overall effect, Harrer et al., 2019). With this approach, we noted outliers at all age intervals, with the exception of weeks 9–10, 18–22, and 38+ (see Supporting Information for all of the identified outliers). Only for weeks 3–4 (Canada, Korea, Mexico; Kramer et al., 2001; Lee, 2000; Mohebati et al., 2014) and 7–8 (Turkey, Korea, Mexico; Lee, 2000; Mohebati et al., 2014; Öztürk Dönmez & Bayik Temel, 2019), did outlier removal reduce heterogeneity to the “moderate” rather than high range, from 95% and 95.5% to 69.5%, and 62.1%, respectively.
Moderator analyses
We performed moderator analyses for two variables, study quality rating and feeding type, using univariate meta‐regression analyses. We found no evidence of an association between study quality rating and infant cry/fuss duration averages across any of the age intervals with sufficient data available (see Supporting Information, all p values >.31; minimum k of 10; age intervals 1–2, 3–4, 5–6, 7–8, 11–12, 13–17). For feeding type, we selected studies with cry/fuss duration data and information on feeding type, providing 60 samples from 30 different studies. Using the 5‐group feeding categorization (majority breastfeeding; majority bottle‐feeding; breastfeeding only, bottle‐feeding only, mixed sample), exactly half of the samples fell in the “Mixed” category, while only three samples comprised “bottle fed” only infants. The availability of information on feeding type decreased with infant age, as well as the diversity of types reported (see top panel of Figure S3b). Therefore, any association identified between cry/fuss duration and feeding type is likely to be a spurious association, reflecting the relation between age and cry/fuss duration identified in the previous section (see bottom panel of Figure S3b).
As for the subgroup analyses of country, we took age intervals with a minimum of 10 studies, which left 2 age intervals with sufficient data to compare feeding types (1–2 weeks with k = 11; 5–6 weeks with k = 19). Given the imbalanced numbers between categories, we are cautious in interpreting these results, as effects, or their absence, may be a result of insufficient data (see 1–2 and 5–6 weeks; bottom panel Figure S3b). We did not find any significant difference between Feeding types at age 5–6 weeks. At age 1–2 weeks, “bottle only” was flagged as significantly higher than the overall mean cry/fuss duration at that age. However, we note that with a single data point, we lacked the variance necessary to estimate a significant difference (see 1–2 week, bottom panel of Figure S3b). We conducted post hoc analyses to investigate the association between crying time and sex/gender. Given the limited data on each individual age group, we conducted univariate linear regressions on all data available, before and after adjusting for age group and sample size. No significant effect of gender was found examining the raw mean (b = −1.80, SE = 1.14, t(35) = −1.58, p = .12, R 2 = .07), or the weighted means (b = 0.09, SE = 0.74, t(35) = 0.13, p = .90, R 2 = .00).
Publication bias
We did not find evidence for publication bias when inspecting the asymmetry of the distributions of ESs, examining cry and fuss estimates using funnel plots (see Figure S2). The Begg and Mazumbar rank correlation test (Kendall's τ) was employed to examine whether the observed outcomes and the corresponding sampling variances were correlated. The test did not reach statistical significance, Kendall's τ between −1 and 1 and p values between .26 and 1.00, indicating no significant evidence of funnel plot asymmetry for any of the age intervals tested. Results from the Duval and Tweedie “trim and fill” method are presented in Table S4, where only a single study was added to the left side of the funnel plot at age interval 1–2 weeks.
Modeling of the cry curve
The simulation study and sensitivity analysis suggest reasonable parameter recovery for all parameters within the double exponential model, excluding the scaling parameter A (see Figures S6 and S7). Thus, caution should be exercised when using this parameter in inference, especially for lower values (see Figure S8). While the magnitude of crying time is dependent on A, the age of peak cry duration is independent of it (Equation 4 and 7), so it is, therefore, possible to reliably identify when infants cry the most. For the change‐point detection model, parameter recovery for µ intial and A 0 was reasonable. For χ, the change‐point parameter, recovery was good for values below 20, but systematically underestimated for values above 20 when the simulated data presented a similar bias towards the age of infants (see Figures S9 and S11). This problem was resolved when the simulated data were more balanced across ages (see Figure S10). This suggest that, if the change‐point is expected after 20 weeks of age, more data on older infants would be needed in order to reliably estimate it. However, a transition later than 12 weeks is very unlikely, thus in this context, we expect to reliably infer χ. Parameter recovery for the rate of decay τ was poor, suggesting that the model's results do not provide a reliable estimate of how fast cry duration transitions from µ initial to A 0 after the change‐point (see Figure S9).
We fitted the models to the cry/fuss data, which was reported across the majority of studies and is widely understood as synonymous with “crying duration” (e.g., Wolke et al., 2017). Model comparison suggests that both the double exponent model (DIC = 1145.9, weight = 0.29) and the change‐point detection model (1144.3; weight = 0.65) were better fits to the data than both the simple decay (DIC = 1150.1, weight = 0.03) and linear decrease models (DIC = 1151, weight = 0.02). These DIC values suggest that the double exponent model and change‐point detection model are clearly different from the two “control” models, but are only minimally different from one another. Evidence ratios using model weights indicate that the double exponential model is 9.7 times more likely to be a better representation of the data than an exponential decay model, and 29 times more likely than a linear decrease. The change‐point model is 20.09 times more likely to be a better representation of the data than an exponential decay model, and 28.5 times more likely than a linear decrease.
We used these two differing models, the traditional cry curve, and the change‐point model to make inferences about the data from the meta‐analysis. For the “cry curve” (see Equation 7), the peak of crying occurred at 3.97 weeks (95% credible intervals: 2.64–5.50 weeks, see full posterior distribution in Figure 6c). Similarly, we can infer the minimum cry duration in A 0, the lower asymptote of the model, at 40.4 min a day (95% Credible Intervals: 19 to 58 min a day, see full distribution in Figure 6d). For the change‐point model, the time point where there was a change from a constant mean to an exponential decay occurred at 7.97 weeks (95% Credible intervals: 5.14–11.06 weeks, see full posterior distribution in Figure 6e). The mean estimated cry duration during the “high and constant” cry period was 85.98 min per day (95% credible intervals: 76.1 to 95.85 min) while the minimum cry duration is estimated at 45.93 min a day (95% credible Intervals: 26.11 to 59 min a day, see full distribution in Figure 6g).
FIGURE 6.

(a, b) Inferred curve representing the change in cry duration across ages, modeled as a double exponential (a) and a change‐point detection (b), fitted using the posterior means of the inferred model parameters (solid curve), with uncertainty presented using 95% Credible intervals (shaded region around the curve), and data points (circles). (c) Posterior distribution of the cry peak, inferred from the double exponential model fitted to the meta‐analytic data. (d) Posterior distribution of A 0, the asymptote of the double exponential model. It represents the inferred theoretical minimum value towards which cry duration decays. (e) Posterior distribution of the time of the change‐point between high and constant cry period and the exponential decay in the change point detection model. (f) Posterior distribution of A 0, the asymptote of the change‐point detection model
DISCUSSION
Our synthesis of data from 57 studies, from a total of 17 countries, provides a comprehensive view of the heterogeneity of parent‐reported infant cry behavior, both between and within studies and countries. Perhaps as a consequence of the Brazelton (1962) analysis, which provided a compelling case for a “cry curve” peaking at 6 weeks, the overwhelming majority of studies have focused on the 5‐ to 6‐week period in infancy. Furthermore, three countries have contributed most of the available data: the United Kingdom, Canada, and the United States, primarily driven by two prolific researchers, St. James Roberts and Barr, the latter of which developed the Barr Baby Diary, which dominates infant cry measurement in the field. Entire continents are absent from the current global perspective on infant crying, and where low‐and‐middle‐income countries are represented, it is typically by a single data point.
With the caveats of the synthesized data in mind, there are several findings we would like to highlight. We note substantial heterogeneity in cry and fuss duration reports across countries. Country‐level differences in reports are clearly a contributor to the between‐study heterogeneity estimated here. Inspecting the study‐level data, most infant samples were characterized by large standard deviations in reported cry duration. This between‐study and within‐study variation underscores an important aspect of infant crying: durations of reported infant crying are highly variable. The normal variability from infant to infant is emphasized in psychoeducation materials for parents (e.g., Barr et al., [n.d.]) and our synthesis supports such an emphasis. For infant feeding type, in contrast to Wolke et al. (2017), we found no consistent evidence for a significant difference in cry/fuss duration related to each study's sample composition (majority breastfeeding; majority bottle‐feeding; breastfeeding only, bottle‐feeding only, mixed sample).
Theoretical and clinical implications
We note several theoretical and clinical implications of our cry duration synthesis and our subsequent cry curve modeling. We present two models of infant crying over time, which are not robustly distinguishable from one another in terms of their fit to the data, but both are better than exponential decay models or linear decline models. Our “cry curve”, with cry duration modeled as a rise and decay process, maps to the original notion of a peak in crying, followed by a decline. While our estimates of the magnitude of the peak are tentative, we provide evidence to suggest it is slightly earlier (4 weeks) than the originally specified 5–6 weeks (Brazelton, 1962). Our change‐point model suggests a “high and constant” level of crying until approximately 8 weeks (mean of 86 means per day), followed by a drop. The two models infer similar minimum cry durations (means: 40–45 min), after the first 8 weeks of life. While our models support different inferences about initial changes in cry duration, they provide clear, testable questions for future work. In addition, our modeling provides a framework for systematically investigating individual and cultural differences in future work (e.g., infants raised with different parenting styles, identifying atypical patterns of crying). We view our model as a tool to allow formal comparisons between infants, or across countries (https://osf.io/dzhvm), which may be used to design or analyze new studies.
Second, for clinicians discussing infant cry durations with parents, we note that the initial “rise” and subsequent “decay” in cry duration are not as dramatic as depicted in many parent‐facing diagrams on infant crying. This is consistent with the analysis presented in Wolke et al., and may support clinicians in managing parental expectations, along with our description of the high variability in typical cry patterns, both within and across countries. Our change‐point model, as for the cry curve model, indicates that daily cry duration remains considerable beyond its initial period of stable and high cry duration (or “peak” for the cry curve model). We also highlight the country‐related variability in infant crying, which might impact both parental and clinician definitions of “excessive” infant crying. Excessive infant crying has been defined in a variety of ways (for review, see Reijneveld & Stronks, 2001), but a duration‐based definition as in the Wessel criteria (Wessel et al., 1954) may capture infants in the upper quartiles in some countries, but not others (see Figure 5). Furthermore, clinical considerations of infant crying as outside the normal range should take into account infant age, as also emphasized by Wolke et al. (2017), but noting that the available data after 12 weeks, indicate that crying remains substantial in daily duration.
Why are there substantial differences across countries?
As for the Wolke et al. (2017) analysis, there was substantial variability across countries, where one European country, Denmark, seemed to represent an “outlier” relative to the average reported durations in the United Kingdom, the United States, and Canada, which generally had comparable reported cry durations at the different age intervals. We would like to caution about the confidence we should place in this estimate as robust evidence for Danish infants crying less than other European or North American infants. Our Danish estimates are based on just two unique studies with non‐overlapping infant ages and relatively small samples, published 15 years ago. While commentators on the Wolke et al. (2017) finding have suggested that Denmark, with its long parental leave, and provision of subsided childcare (Craig & Mullan, 2010), may reduce the stress of early parenting, and therefore lower infant distress (Ramaswamy, 2017), this is characteristic of the Nordic countries generally. Another common parenting practice in Denmark and in Nordic countries involves placing infants to sleep outside (e.g., Tourula et al., 2008), which may also impact parents’ cry reports. Validation studies of Nordic parents’ reports have not yet been conducted, as is the case for most of the 17 countries included here.
Our synthesis included only a small number of studies from non‐Western countries, India, Mexico, and South Korea, with pronounced low levels of reported infant cry durations, relative to clusters of particular anglophone countries (e.g., the United Kingdom, the United States, and Canada). Parental practices around responding to infant crying vary across countries and Western and non‐Western countries have been reported to differ in measurable ways. In India, mothers have been reported to be less inclined to leave their infants to cry, and more likely to take them into their own bed (St. James‐Roberts et al., 1994). In Chile, mothers are reported to engage in frequent infant carrying, and researchers have suggested this reduces instances of crying (Rinne et al., 1990). Even within single European and Western countries, there is a wide range of parental practices and beliefs about infant crying, and controversies about the use of strategies such as “cry it out” (Bilgin & Wolke, 2020b). We also note that infant ethnicity was reported in a small number of the included studies (k = 8), and in all cases, the sample compositions were majority White infants, or White parents, limiting the generalizability of the current synthesis.
Parent reports do not reflect actual infant cry durations
The original validation study for Barr's Baby diary reported correlations between parent reports and audio‐recordings of 0.67 for crying only, 0.45 for crying and fussing, but no correlation for fussing only (0.01; Barr et al., 1988). Some authors have argued that the discrepancy between audio‐recording and diary reports of fussing may reflect the insensitivity of recordings to visible signs of infant distress, which would lead parents to more accurately record infant fussing behavior (St. James‐Roberts & Plewis, 1996). Barr suggested that the typical shorter duration of fussing relative to crying may contribute to the discrepancy between diaries and recordings. Regardless of the sources of differences between diaries and audio‐recordings, our synthesis is of parent‐reports, or perceived infant cry durations rather than actual durations.
While diaries and questionnaires provide feasible methods for assessing large samples, they do not fully correspond with audio‐recordings and are subject to between‐participant variations in recording accuracy, compliance, and memory biases, as for other measures of parent‐reported child behavior (e.g., coughing, Dales et al., 1997). Notwithstanding ethical and privacy concerns with long‐form recordings of the auditory environment (Cychosz et al., 2020), there are established proprietorial infant wearable devices (e.g., Language Environment ANalysis) and emerging open‐source hardware solutions (e.g., Baby Logger, Cao et al., 2018) that provide methods to audio‐record crying from larger infant samples than previously tested. Finally, we note our inclusion of both questionnaire and diary instruments, an extension of the Wolke et al. (2017) study which included diaries only. For the CPQ, the standardized instrument used in studies here, a previous validation reported that the amount of fussing and crying was estimated as 13% higher in the CPQ relative to a 24‐h diary (Wolke et al., 1994), indicating imperfect alignment between measures.
Limitations of the present synthesis
In the current body of studies, some authors report on “crying,” referring to both “crying and fussing” combined, whereas others deliberately exclude fussing from their reports, ambiguity that we resolved where possible by contacting authors for clarification. We recommend that, for a more complete understanding of cry behavior, it will be of value if authors report on each of the categories (fussing, crying, inconsolable crying) from the Barr Baby Diary separately, for example, in Supporting Information. In addition to the between‐infant variability in our analyses, the available evidence also suggests considerable within‐infant differences, both from day‐to‐day and from week‐to‐week (Barr, 1990a; Rebelsky & Black, 1972). We did not assess within‐infant variation, and our estimates, as in the Wolke et al., (2017) synthesis, treat the observations of cry duration at each time interval as independent.
While the mean and SD are the most common summary statistics provided, they may not be the most appropriate descriptive for cry duration data. Using mean and SD to represent the data, we are led to assume that crying data are normally distributed, an assumption that is unlikely to be strictly true. The high SD values relative to the mean in many studies suggest a non‐normal distribution (cry duration cannot be a negative value, see Figure S5). In extracting study data, we did not find any articles that provided raw infant diary data. Future meta‐analytical studies would benefit from the granularity provided by raw data availability, which would allow descriptions and modeling of the data, beyond the most commonly used statistical approaches (e.g., between‐group comparisons with ANOVAs). Researchers may consider raw data sharing using third party repositories with a persistent link (e.g., a DOI, repository examples include OSF, DYAD, Figshare), or indeed the sharing of synthetic datasets, where there are concerns about sensitive infant‐related data (for further discussions of data sharing practices, see Towse et al., 2020). As has been argued previously, future meta‐analyses will be most productive if they can be conducted synthesizing individual‐level data—if such data are accessible (Roisman & van Ijzendoorn, 2018).
CONCLUSION
The current understanding of infant cry patterns is largely derived from a body of studies focused on infant age 5–6 weeks, and from three anglophone Western counties. The heterogeneity of the pooled estimates calculated could be better understood via sharing of raw data from infant diaries. Raw data availability could allow us to build accurate statistical descriptions of crying and could stimulate the elaboration of new theoretical accounts. While standardized paper‐based diaries have been the dominant method for collecting parent‐reported cry duration data, automated audio recording and experience sampling methods offer new opportunities to collect fine‐grained, and complementary data streams. Raw datasets, from different data recording modalities, could allow us to formalize and test proposed mechanisms (e.g., environmental, or individual‐infant variables) and theories using computational models, as previously done in other fields of research (e.g., sleep, decision‐making). Models can be built to consider variables, such as the broad impact of parents’ preferred soothing strategies, or the developmental stage of the infant, that can reproduce the variation observed across age intervals and cultures. In addition, physiological variables, such as different hormones and their fluctuation (leptin, melatonin, cortisol), and sleep timing, could be integrated to account for individual variation, which may be useful in understanding atypical or problematic cry behavior.
CONFLICTS OF INTEREST
The authors declare no conflicts of interest.
Supporting information
Supplementary Material
ACKNOWLEDGMENTS
*We thank an anoynymous reviewer for suggesting the change‐point model assessed here. Christine Parsons received funding from the Carlsberg Foundation (CF19‐0715).
Vermillet, A.‐Q. , Tølbøll, K. , Litsis Mizan, S. , Skewes, J. , & Parsons, C. E. (2022). Crying in the first 12 months of life: A systematic review and meta‐analysis of cross‐country parent‐reported data and modeling of the “cry curve”. Child Development, 93, 1201–1222. 10.1111/cdev.13760
All materials related to the analyses are available on the Open Science Framework, with the following link: https://osf.io/dzhvm/.
REFERENCES
- Aloisio, I. , Prodam, F. , Giglione, E. , Bozzi Cionci, N. , Solito, A. , Bellone, S. , Baffoni, L. , Mogna, L. , Pane, M. , Bona, G. , & Di Gioia, D. (2018). Three‐month feeding integration with bifidobacterium strains prevents gastrointestinal symptoms in healthy newborns. Frontiers in Nutrition, 5. 10.3389/fnut.2018.00039 [DOI] [PMC free article] [PubMed] [Google Scholar]
- Alvarez, M. (2004). Caregiving and early infant crying in a danish community. Journal of Developmental and Behavioral Pediatrics, 25(2), 91–98. 10.1097/00004703-200404000-00003 [DOI] [PubMed] [Google Scholar]
- Anzman‐Frasca, S. , Liu, S. , Gates, K. M. , Paul, I. M. , Rovine, M. J. , & Birch, L. L. (2013). Infants’ transitions out of a fussing/crying state are modifiable and are related to weight status. Infancy, 18(5), 662–686. 10.1111/infa.12002 [DOI] [PMC free article] [PubMed] [Google Scholar]
- Atella, L. D. , DiPietro, J. A. , Smith, B. A. , & St. James‐Roberts, I. (2003). More than meets the eye: Parental and infant contributors to maternal and paternal reports of early infant difficultness. Parenting: Science and Practice, 3(4), 265–284. 10.1207/s15327922par0304_1 [DOI] [Google Scholar]
- Baildam, E. M. , Wilier, V. F. , Ward, B. S. , Bannister, R. P. , Bamford, F. N. , & Moore, W. M. O. (1995). Duration and pattern of crying in the first year of life. Developmental Medicine & Child Neurology, 37(4), 345–353. 10.1111/j.1469-8749.1995.tb12012.x [DOI] [PubMed] [Google Scholar]
- Balduzzi, S. , Rücker, G. , & Schwarzer, G. (2019). How to perform a meta‐analysis with R: A practical tutorial. Evidence Based Mental Health, 22(4), 153–160. 10.1136/ebmental-2019-300117 [DOI] [PMC free article] [PubMed] [Google Scholar]
- Barr, R. G. (n.d.). Why does my baby cry so much? https://purplecrying.info/sub‐pages/crying/why‐does‐my‐baby‐cry‐so‐much.php [Google Scholar]
- Barr, R. G. (1990a). The early crying paradox. Human Nature, 1(4), 355–389. 10.1007/BF02734051 [DOI] [PubMed] [Google Scholar]
- Barr, R. G. (1990b). The normal crying curve: What do we really know? Developmental Medicine & Child Neurology, 32(4), 356–362. 10.1111/j.1469-8749.1990.tb16949.x [DOI] [PubMed] [Google Scholar]
- Barr, R. G. , Barr, B. I. S. M. , Fujiwara, T. , Conway, J. , Catherine, N. , & Brant, R. (2009). Do educational materials change knowledge and behaviour about crying and shaken baby syndrome? A randomized controlled trial. Canadian Medical Association Journal, 180(7), 727–733. 10.1503/cmaj.081419 [DOI] [PMC free article] [PubMed] [Google Scholar]
- Barr, R. , Konner, M. , Bakeman, R. , & Adamson, L. (1987). Crying in ikung infants: A test of the cultural specificity hypothesis. Pediatric Research, 21(4), 178. 10.1203/00006450-198704010-00074 [DOI] [PubMed] [Google Scholar]
- Barr, R. G. , Kramer, M. S. , Boisjoly, C. , McVey‐White, L. , & Pless, I. B. (1988). Parental diary of infant cry and fuss behaviour. Archives of Disease in Childhood, 63(4), 380–387. 10.1136/adc.63.4.380 [DOI] [PMC free article] [PubMed] [Google Scholar]
- Barr, R. G. , Kramer, M. S. , Pless, I. B. , Boisjoly, C. , & Leduc, D. (1989). Feeding and temperament as determinants of early infant crying/fussing behavior. Pediatrics, 84(3), 514–521. 10.1542/peds.84.3.514 [DOI] [PubMed] [Google Scholar]
- Barr, R. G. , Rivara, F. P. , Barr, M. , Cummings, P. , Taylor, J. , Lengua, L. J. , & Meredith‐Benitz, E. (2009a). Effectiveness of educational materials designed to change knowledge and behaviors regarding crying and Shaken‐baby syndrome in mothers of newborns: A randomized, controlled trial. Pediatrics, 123(3), 972–980. 10.1542/peds.2008-0908 [DOI] [PubMed] [Google Scholar]
- Begg, C. B. , & Mazumdar, M. (1994). Operating characteristics of a rank correlation test for publication bias. Biometrics, 50(4), 1088–1101. 10.2307/2533446 [DOI] [PubMed] [Google Scholar]
- Bilgin, A. , & Wolke, D. (2020a). Infant crying problems and symptoms of sleeping problems predict attachment disorganization at 18 months. Attachment and Human Development, 22(4), 367–391. 10.1080/14616734.2019.1618882 [DOI] [PubMed] [Google Scholar]
- Bilgin, A. , & Wolke, D. (2020b). Parental use of ‘cry it out’ in infants: No adverse effects on attachment and behavioural development at 18 months. Journal of Child Psychology and Psychiatry. 10.1111/jcpp.13223 [DOI] [PubMed] [Google Scholar]
- Blum, N. J. , Taubman, B. , Tretina, L. , & Heyward, R. Y. (2002). Maternal ratings of infant intensity and distractibility: Relationship with crying duration in the second month of life. Archives of Pediatrics and Adolescent Medicine, 156(3), 286–290. 10.1001/archpedi.156.3.286 [DOI] [PubMed] [Google Scholar]
- Bolten, M. I. , Fink, N. S. , & Stadler, C. (2012). Maternal self‐efficacy reduces the impact of prenatal stress on infant's crying behavior. Journal of Pediatrics, 161(1), 104–109. 10.1016/j.jpeds.2011.12.044 [DOI] [PubMed] [Google Scholar]
- Bonichini, S. , Axia, G. , James‐Roberts, I. , & DeCian, S. (2008). Infant crying and maternal holding in the first 2 months of age: An Italian diary study. Infant and Child Development, 17, 581–592. 10.1002/icd.565 [DOI] [Google Scholar]
- Booth, A. , Clarke, M. , Dooley, G. , Ghersi, D. , Moher, D. , Petticrew, M. , & Stewart, L. (2012). The nuts and bolts of PROSPERO: An international prospective register of systematic reviews. Systematic Reviews, 1(1), Article 2. 10.1186/2046-4053-1-2 [DOI] [PMC free article] [PubMed] [Google Scholar]
- Bracken, M. B. (1992). Statistical methods for analysis of effects of treatment in overviews of randomized trials. In Speidel B. (Ed.), Effective care of the newborn infant (pp. 13–18). Oxford University Press. [Google Scholar]
- Brazelton, T. B. (1962). Crying in infancy. Pediatrics, 29(4), 579–588. 10.1542/peds.29.4.579 [DOI] [PubMed] [Google Scholar]
- Cao, X.‐N. , Dakhlia, C. , Del Carmen, P. , Jaouani, M.‐A. , Ould‐Arbi, M. , & Dupoux, E. (2018). Baby Cloud, a technological platform for parents and researchers. LREC 2018—11th edition of the Language Resources and Evaluation Conference, Miyazaki, Japan. [Google Scholar]
- Clarivate . (2019). Endnote (Version EndNote X9) [64 bit]. Clarivate. [Google Scholar]
- Clifford, T. J. , Campbell, M. K. , Speechley, K. N. , & Gorodzinsky, F. (2002a). Infant colic: Empirical evidence of the absence of an association with source of early infant nutrition. Archives of Pediatrics and Adolescent Medicine, 156(11), 1123–1128. 10.1001/archpedi.156.11.1123 [DOI] [PubMed] [Google Scholar]
- Clifford, T. J. , Campbell, M. K. , Speechley, K. N. , & Gorodzinsky, F. (2002b). Sequelae of infant colic: Evidence of transient infant distress and absence of lasting effects on maternal mental health. Archives of Pediatrics and Adolescent Medicine, 156(12), 1183–1188. 10.1001/archpedi.156.12.1183 [DOI] [PubMed] [Google Scholar]
- Craig, L. , & Mullan, K. (2010). Parenthood, gender and work‐family time in the United States, Australia, Italy, France, and Denmark. Journal of Marriage and Family, 72(5), 1344–1361. 10.1111/j.1741-3737.2010.00769.x [DOI] [Google Scholar]
- Cychosz, M. , Romeo, R. , Soderstrom, M. , Scaff, C. , Ganek, H. , Cristia, A. , Casillas, M. , de Barbaro, K. , Bang, J. Y. , & Weisleder, A. (2020). Longform recordings of everyday life: Ethics for best practices. Behavior Research Methods, 52(5), 1951–1969. 10.3758/s13428-020-01365-9 [DOI] [PMC free article] [PubMed] [Google Scholar]
- Dales, R. E. , White, J. , Bhumgara, C. , & McMullen, E. (1997). Parental reporting of childrens’ coughing is biased. European Journal of Epidemiology, 13(5), 541–545. 10.1023/A:1007311912777 [DOI] [PubMed] [Google Scholar]
- Darlington, A.‐S.‐E. , & Wright, C. M. (2006). The influence of temperament on weight gain in early infancy. Journal of Developmental and Behavioral Pediatrics, 27(4), 329–335. 10.1097/00004703-200608000-00008 [DOI] [PubMed] [Google Scholar]
- de Weerth, C. , & Buitelaar, J. K. (2007). Childbirth complications affect young infants’ behavior. European Child & Adolescent Psychiatry, 16(6), 379–388. 10.1007/s00787-007-0610-7 [DOI] [PubMed] [Google Scholar]
- DeLeon, C. W. , & Karraker, K. H. (2007). Intrinsic and extrinsic factors associated with night waking in 9‐month‐old infants. Infant Behavior & Development, 30(4), 596–605. 10.1016/j.infbeh.2007.03.009 [DOI] [PubMed] [Google Scholar]
- Duval, S. , & Tweedie, R. (2000). Trim and fill: A simple funnel‐plot‐based method of testing and adjusting for publication bias in meta‐analysis. Biometrics, 56(2), 455–463. 10.1111/j.0006-341x.2000.00455.x [DOI] [PubMed] [Google Scholar]
- Fujiwara, T. , Barr, R. G. , Brant, R. , & Barr, M. (2012). Infant distress at five weeks of age and caregiver frustration. The Journal of Pediatrics, 159(3), 425–430.e2. 10.1016/j.jpeds.2011.02.010 [DOI] [PubMed] [Google Scholar]
- Geeraerts, S. B. , Backer, P. M. , & Stifter, C. A. (2020). It takes two: Infants’ moderate negative reactivity and maternal sensitivity predict self‐regulation in the preschool years. Developmental Psychology, 56(5), 869–879. 10.1037/dev0000921 [DOI] [PMC free article] [PubMed] [Google Scholar]
- Harrer, M. , Cuijpers, P. , Furukawa, T. , & Ebert, D. (2019). Doing meta‐analysis in R: A hands‐on guide. PROTECT Lab Erlangen. [Google Scholar]
- Harrison, Y. (2004). The relationship between daytime exposure to light and night‐time sleep in 6–12‐week‐old infants. Journal of Sleep Research, 13(4), 345–352. 10.1111/j.1365-2869.2004.00435.x [DOI] [PubMed] [Google Scholar]
- Hechler, C. , Beijers, R. , Riksen‐Walraven, J. M. , & de Weerth, C. (2018). Are cortisol concentrations in human breast milk associated with infant crying? Developmental Psychobiology, 60(6), 639–650. 10.1002/dev.21761 [DOI] [PMC free article] [PubMed] [Google Scholar]
- Hedges, L. V. , & Olkin, I. (1985). Statistical methods for meta‐analysis. Academic Press. [Google Scholar]
- Higgins, J. P. , Thompson, S. G. , Deeks, J. J. , & Altman, D. G. (2003). Measuring inconsistency in meta‐analyses. British Medical Journal, 327(7414), 557–560. [DOI] [PMC free article] [PubMed] [Google Scholar]
- Hiscock, H. , Cook, F. , Bayer, J. , Le, H. N. D. , Mensah, F. , Cann, W. , Symon, B. , & James‐Roberts, I. S. (2014). Preventing early infant sleep and crying problems and postnatal depression: A randomized trial. Pediatrics, 133(2), e346–e354. 10.1542/peds.2013-1886 [DOI] [PubMed] [Google Scholar]
- Howard, C. R. , Lanphear, N. , Lanphear, B. P. , Eberly, S. , & Lawrence, R. A. (2006). Parental responses to infant crying and colic: The effect on breastfeeding duration. Breastfeeding Medicine, 1(3), 146–155. 10.1089/bfm.2006.1.146 [DOI] [PubMed] [Google Scholar]
- Hunziker, U. A. , & Barr, R. G. (1986). Increased carrying reduces infant crying: A randomized controlled trial. Pediatrics, 77(5), 641–648. 10.1542/peds.77.5.641 [DOI] [PubMed] [Google Scholar]
- Jordan, G. J. , Arbeau, K. , McFarl, D. , Irel, K. , & Richardson, A. (2020). Elimination communication contributes to a reduction in unexplained infant crying. Medical Hypotheses, 142, 109811. 10.1016/j.mehy.2020.109811 [DOI] [PubMed] [Google Scholar]
- Keller, H. , Chasiotis, A. , Risau‐Peters, J. , Völker, S. , Zach, U. , & Restemeier, R. (1996). Psychobiological aspects of infant crying. Early Development & Parenting, 5(1), 1–13. 10.1002/(SICI)1099-0917(199603)5:1<1::AID-EDP103>3.0.CO;2-E [DOI] [Google Scholar]
- Keller, H. , Lohaus, A. , Völker, S. , Cappenberg, M. , & Chasiotis, A. (1998). Relationship between infant crying, birth complications, and maternal variables. Child: Care, Health and Development, 24(5), 377–394. [DOI] [PubMed] [Google Scholar]
- Killerby, E. (1992). A comparison of cry‐behaviours of clinic‐referred and non‐referred infants 4–12 weeks old. Early Child Development and Care, 81, 77–100. 10.1080/0300443920810107 [DOI] [Google Scholar]
- Kivijärvi, M. , Räihä, H. , Virtanen, S. , Lertola, K. , & Piha, J. (2004). Maternal sensitivity behavior and infant crying, fussing and contented behavior: The effects of mother's experienced social support. Scandinavian Journal of Psychology, 45(3), 239–246. 10.1111/j.1467-9450.2004.00400.x [DOI] [PubMed] [Google Scholar]
- Konner, M. J. (1972). Aspects of the developmental ethology of a foraging people. In Blurton Jones N. (Ed.), Ethological studies of child behaviour (pp. 285–304). Cambridge University Press. https://www.melvinkonner.com/wp‐content/uploads/2009/05/Aspects‐Devel‐Foraging‐People‐.pdf [Google Scholar]
- Korja, R. , Maunu, J. , Kirjavainen, J. , Savonlahti, E. , Haataja, L. , Lapinleimu, H. , Manninen, H. , Piha, J. , & Lehtonen, L. (2008). Mother‐infant interaction is influenced by the amount of holding in preterm infants. Early Human Development, 84(4), 257–267. 10.1016/j.earlhumdev.2007.06.006 [DOI] [PubMed] [Google Scholar]
- Kramer, M. S. , Barr, R. G. , Dagenais, S. , Yang, H. , Jones, P. , Ciofani, L. , & Jané, F. (2001). Pacifier use, early weaning, and cry/fuss behavior: A randomized controlled trial. Journal of the American Medical Association, 286(3), 322–326. 10.1001/jama.286.3.322 [DOI] [PubMed] [Google Scholar]
- Kurth, E. , Kennedy, H. P. , Spichiger, E. , Hösli, I. , & Stutz, E. Z. (2011). Crying babies, tired mothers: What do we know? A systematic review. Midwifery, 27(2), 187–194. 10.1016/j.midw.2009.05.012 [DOI] [PubMed] [Google Scholar]
- Lajeunesse, M. J. (2016). Facilitating systematic reviews, data extraction and meta‐analysis with the metagear package for r. Methods in Ecology and Evolution, 7(3), 323–330. 10.1111/2041-210X.12472 [DOI] [Google Scholar]
- Lam, J. , Barr, R. G. , Catherine, N. , Tsui, H. , Hahnhaussen, C. L. , Pauwels, J. , & Brant, R. (2010). Electronic and paper diary recording of infant and caregiver behaviors. Journal of Developmental and Behavioral Pediatrics, 31(9), 685–693. 10.1097/DBP.0b013e3181e416ae [DOI] [PubMed] [Google Scholar]
- Lee, K. (1994). The crying pattern of Korean infants and related factors. Developmental Medicine & Child Neurology, 36(7), 601–607. 10.1111/j.1469-8749.1994.tb11897.x [DOI] [PubMed] [Google Scholar]
- Lee, K. (2000). Crying patterns of Korean infants in institutions. Child: Care, Health and Development, 26(3), 217–228. 10.1046/j.1365-2214.2000.00134.x [DOI] [PubMed] [Google Scholar]
- Lee, M. D. , & Wagenmakers, E.‐J. (2013). Bayesian cognitive modeling: A practical course. Cambridge University Press. 10.1017/CBO9781139087759 [DOI] [Google Scholar]
- Liberati, A. , Altman, D. G. , Tetzlaff, J. , Mulrow, C. , Gøtzsche, P. C. , Ioannidis, J. P. , Clarke, M. , Devereaux, P. J. , Kleijnen, J. , & Moher, D. (2009). The PRISMA statement for reporting systematic reviews and meta‐analyses of studies that evaluate healthcare interventions: Explanation and elaboration. British Medical Journal, 339. 10.1136/bmj.b2700 [DOI] [PMC free article] [PubMed] [Google Scholar]
- Litmanovitz, I. , Bar‐Yoseph, F. , Lifshitz, Y. , Davidson, K. , Eliakim, A. , Regev, R. H. , & Nemet, D. (2014). Reduced crying in term infants fed high beta‐palmitate formula: A double‐blind randomized clinical trial. BMC Pediatrics, 14(1), 152. 10.1186/1471-2431-14-152 [DOI] [PMC free article] [PubMed] [Google Scholar]
- Lohaus A., Keller H., Voelker S. (2001). Relationships between eye contact, maternal sensitivity, and infant crying. International Journal of Behavioral Development, 25(6), 542–548. 10.1080/01650250042000528 [DOI] [Google Scholar]
- Lucas, A. , & St. James‐Roberts, I. (1998). Crying, fussing, and colic behaviour in breast‐ and bottle‐fed infants. Early Human Development, 53(1), 9–18. 10.1016/S0378-3782(98)00032-2 [DOI] [PubMed] [Google Scholar]
- Lucassen, P. L. B. J. , Assendelft, W. J. J. , Van Eijk, J. T. M. , Douwes, A. C. , & Gubbels, J. W. (2003). Differences between excessively crying infants and normal infants: A case‐control study. European Journal of General Practice, 9(1), 25–26. 10.3109/13814780309160390 [DOI] [PubMed] [Google Scholar]
- McGlaughlin, A. , & Grayson, A. (1999). A prospective study of crying during the first year of infancy. Journal of Reproductive and Infant Psychology, 17(1), 41–52. 10.1080/02646839908404583 [DOI] [Google Scholar]
- McRury, J. M. , & Zolotor, A. J. (2010). A randomized, controlled trial of a behavioral intervention to reduce crying among infants. Journal of the American Board of Family Medicine, 23(3), 315–322. 10.3122/jabfm.2010.03.090142 [DOI] [PubMed] [Google Scholar]
- Meijer, A. M. , & van den Wittenboer, G. L. H. (2007). Contribution of infants’ sleep and crying to marital relationship of first‐time parent couples in the 1st year after childbirth. Journal of Family Psychology, 21(1), 49–57. 10.1037/0893-3200.21.1.49 [DOI] [PubMed] [Google Scholar]
- Milgrom, J. , Westley, D. T. , & McCloud, P. I. (1995). Do infants of depressed mothers cry more than other infants? Journal of Paediatrics and Child Health, 31(3), 218–221. 10.1111/j.1440-1754.1995.tb00789.x [DOI] [PubMed] [Google Scholar]
- Miller, A. R. , Barr, R. G. , & Eaton, W. O. (1993). Crying and motor behavior of six‐week‐old infants and postpartum maternal mood. Pediatrics, 92(4), 551–558. [PubMed] [Google Scholar]
- Miller‐Loncar, C. , Bigsby, R. , High, P. , Wallach, M. , & Lester, B. (2004). Infant colic and feeding difficulties. Archives of Disease in Childhood, 89(10), 908–912. 10.1136/adc.2003.033233 [DOI] [PMC free article] [PubMed] [Google Scholar]
- Mohebati, L. M. , Caulfieldb, L. E. , & Martinez, H. (2014). How much does your baby cry? Expectations, patterns and perceptions of infant crying in Mexico. Boletin Medico del Hospital Infantil de Mexico, 71(4), 202–210. 10.1016/j.bmhimx.2014.08.002 [DOI] [PubMed] [Google Scholar]
- Murray, L. , & Cooper, P. (2001). The impact of irritable infant behavior on maternal mental state: A longitudinal study and a treatment trial. In Skillman N. J. (Ed.), New evidence on unexplained early infant crying: Its origins, nature and management (pp. 149–164). Johnson & Johnson Pediatric Institute. [Google Scholar]
- O’Connell, J. (2017). Want the baby to stop crying? Be Danish. Or don’t breastfeed. The Irish Times. https://www.irishtimes.com/life‐and‐style/health‐family/parenting/want‐the‐baby‐to‐stop‐crying‐be‐danish‐or‐don‐t‐breastfeed‐1.3036073
- Ouzzani, M. , Hammady, H. , Fedorowicz, Z. , & Elmagarmid, A. (2016). Rayyan‐a web and mobile app for systematic reviews [Article]. Systematic Reviews, 5(1), Article 210. 10.1186/s13643-016-0384-4 [DOI] [PMC free article] [PubMed] [Google Scholar]
- Öztürk Dönmez, R. , & Bayik Temel, A. (2019). Effect of soothing techniques on infants’ self‐regulation behaviors (sleeping, crying, feeding): A randomized controlled study. Japan Journal of Nursing Science, 16(4), 407–419. 10.1111/jjns.12250 [DOI] [PubMed] [Google Scholar]
- Peters, J. L. , Sutton, A. J. , Jones, D. R. , Abrams, K. R. , & Rushton, L. (2008). Contour‐enhanced meta‐analysis funnel plots help distinguish publication bias from other causes of asymmetry. Journal of Clinical Epidemiology, 61(10), 991–996. 10.1016/j.jclinepi.2007.11.010 [DOI] [PubMed] [Google Scholar]
- Plummer, M. (2003). JAGS: A program for analysis of Bayesian graphical models using Gibbs sampling. Proceedings of the 3rd International Workshop on Distributed Statistical Computing. https://www.r‐project.org/conferences/DSC‐2003/Proceedings/Plummer.pdf [Google Scholar]
- Plummer, M. (2019). rjags: Bayesian Graphical Models using MCMC. https://CRAN.R‐project.org/package=rjags [Google Scholar]
- Poole, C. , & Greenland, S. (1999). Random‐effects meta‐analyses are not always conservative. American Journal of Epidemiology, 150(5), 469–475. 10.1093/oxfordjournals.aje.a010035 [DOI] [PubMed] [Google Scholar]
- Popp, L. , Fuths, S. , & Schneider, S. (2019). The relevance of infant outcome measures: A pilot‐RCT comparing baby triple P positive parenting program with care as usual. Frontiers in Psychology, 10, 2425. 10.3389/fpsyg.2019.02425 [DOI] [PMC free article] [PubMed] [Google Scholar]
- R Core Team . (2021). R: A language and environment for statistical computing. R Foundation for Statistical Computing. https://www.R‐project.org/ [Google Scholar]
- Radesky, J. S. , Zuckerman, B. , Silverstein, M. , Rivara, F. P. , Barr, M. , Taylor, J. A. , Lengua, L. J. , & Barr, R. G. (2013). Inconsolable infant crying and maternal postpartum depressive symptoms. Pediatrics, 131(6), e1857–e1864. 10.1542/peds.2012-3316 [DOI] [PubMed] [Google Scholar]
- Ramaswamy, C. (2017). British babies cry the most, Danish babies the least. Why? The Guardian. https://www.theguardian.com/society/shortcuts/2017/apr/03/danish‐babies‐cry‐parenting‐denamrk
- Rebelsky, F. , & Black, R. (1972). Crying in infancy. The Journal of Genetic Psychology, 121(1), 49–57. 10.1080/00221325.1972.10533128 [DOI] [PubMed] [Google Scholar]
- Reijneveld, S. A. , & Stronks, K. (2001). The validity of self‐reported use of health care across socioeconomic strata: A comparison of survey and registration data. International Journal of Epidemiology, 30(6), 1407–1414. 10.1093/ije/30.6.1407 [DOI] [PubMed] [Google Scholar]
- Rinne, A. , Saenz, A. H. , & Michelsson, K. (1990). Amount and perception of baby crying in Finland and Colombia. Early Child Development and Care, 65(1), 139–144. 10.1080/0300443900650116 [DOI] [Google Scholar]
- Rohatgi, A. (2017). WebPlotDigitizer. https://automeris.io/WebPlotDigitizer [Google Scholar]
- Roisman, G. I. , & van Ijzendoorn, M. H. (2018). Meta‐analysis and individual participant data synthesis in child development: Introduction to the special section. Child Development, 89(6), 1939–1942. 10.1111/cdev.13127 [DOI] [PubMed] [Google Scholar]
- Royal Children's Hospital . (2019). Unsettled or crying babies. https://www.rch.org.au/clinicalguide/guideline_index/Crying_Baby_Infant_Distress/ [Google Scholar]
- Shinohara, H. , & Kodama, H. (2012). Relationship between duration of crying/fussy behavior and actigraphic sleep measures in early infancy. Early Human Development, 88(11), 847–852. [DOI] [PubMed] [Google Scholar]
- Spiegelhalter, D. J. , Best, N. G. , Carlin, B. P. , & Van Der Linde, A. (2002). Bayesian measures of model complexity and fit. Journal of the Royal Statistical Society: Series B (Statistical Methodology), 64(4), 583–639. 10.1111/1467-9868.00353 [DOI] [Google Scholar]
- St. James‐Roberts, I. , Alvarez, M. , Csipke, E. , Abramsky, T. , Goodwin, J. , & Sorgenfrei, E. (2006). Infant crying and sleeping in London, Copenhagen and when parents adopt a "proximal" form of care. Pediatrics, 117(6), e1146–e1155. 10.1542/peds.2005-2387 [DOI] [PubMed] [Google Scholar]
- St. James‐roberts, I. , Bowyer, J. , Varghese, S. , & Sawdon, J. (1994). Infant crying patterns in Manali and London. Child: Care, Health and Development, 20(5), 323–337. 10.1111/j.1365-2214.1994.tb00394.x [DOI] [PubMed] [Google Scholar]
- St. James‐Roberts, I. , & Conroy, S. (2005). Do pregnancy and childbirth adversities predict infant crying and colic? Findings and recommendations. Neuroscience and Biobehavioral Reviews, 29(2), 313–320. 10.1016/j.neubiorev.2005.01.001 [DOI] [PubMed] [Google Scholar]
- St. James‐Roberts, I. , Goodwin, J. , Peter, B. , Adams, D. , & Hunt, S. (2003). Individual differences in responsivity to a neurobehavioural examination predict crying patterns of 1‐week‐old infants at home. Developmental Medicine and Child Neurology, 45(6), 400–407. 10.1017/s0012162203000756 [DOI] [PubMed] [Google Scholar]
- St. James‐Roberts, I. , Hurry, J. , & Bowyer, J. (1993). Objective confirmation of crying durations in infants referred for excessive crying. Archives of Disease in Childhood, 68(1), 82–84. 10.1136/adc.68.1.82 [DOI] [PMC free article] [PubMed] [Google Scholar]
- St. James‐Roberts, I. , & Menon‐Johansson, P. (1999). Predicting infant crying from fetal movement data: An exploratory study. Early Human Development, 54(1), 55–62. 10.1016/S0378-3782(98)00084-X [DOI] [PubMed] [Google Scholar]
- St. James‐Roberts, I. S. , & Plewis, I. (1996). Individual differences, daily fluctuations, and developmental changes in amounts of infant waking, fussing, crying, feeding, and sleeping. Child Development, 67(5), 2527–2540. 10.2307/1131638 [DOI] [PubMed] [Google Scholar]
- St. James‐Roberts, I. , Sleep, J. , Morris, S. , Owen, C. , & Gillham, P. (2001). Use of a behavioural programme in the first 3 months to prevent infant crying and sleeping problems. Journal of Paediatrics and Child Health, 37(3), 289–297. 10.1046/j.1440-1754.2001.00699.x [DOI] [PubMed] [Google Scholar]
- Sterne, J. A. , Egger, M. , & Moher, D. (2008). Addressing reporting biases. In Cochrane handbook for systematic reviews of interventions: Cochrane book series (pp. 297–333). 10.1002/9780470712184.ch10 [DOI] [Google Scholar]
- Stifter, C. A. , Bono, M. , & Spinrad, T. (2003). Parent characteristics and conceptualizations associated with the emergence of infant colic. Journal of Reproductive and Infant Psychology, 21(4), 309–322. 10.1080/02646830310001622123 [DOI] [Google Scholar]
- Su, Y. S. , & Yajima, M. (2021). R2jags: Using R to Run ‘JAGS'. R package version 0.7‐1. https://CRAN.R‐project.org/package=R2jags [Google Scholar]
- Tennekes, M. (2018). tmap: Thematic Maps in R [thematic maps; spatial data; R]. Journal of Statistical Software, 84(6), 39. 10.18637/jss.v084.i06 [DOI] [Google Scholar]
- Tourula, M. , Isola, A. , & Hassi, J. (2008). Children sleeping outdoors in winter: Parents’ experiences of a culturally bound childcare practice. International Journal of Circumpolar Health, 67(2–3), 269–278. 10.3402/ijch.v67i2-3.18284 [DOI] [PubMed] [Google Scholar]
- Towse, J. N. , Ellis, D. A. , & Towse, A. S. (2020). Opening Pandora’s Box: Peeking inside Psychology’s data sharing practices, and seven recommendations for change. Behavior Research Methods. 10.3758/s13428-020-01486-1 [DOI] [PMC free article] [PubMed] [Google Scholar]
- van IJzendoorn, M. H. , & Hubbard, F. O. A. (2000). Are infant crying and maternal responsiveness during the first year related to infant‐mother attachment at 15 months? Attachment & Human Development, 2(3), 371–391. 10.1080/14616730010001596 [DOI] [PubMed] [Google Scholar]
- Viechtbauer, W. (2010). Conducting meta‐analyses in R with the metafor package. Journal of Statistical Software, 36(3), 48. 10.18637/jss.v036.i03 [DOI] [Google Scholar]
- von Kries, R. , Kalies, H. , & Papoušek, M. (2006). Excessive crying beyond 3 months may herald other features of multiple regulatory problems. Archives of Pediatrics & Adolescent Medicine, 160(5), 508–511. 10.1001/archpedi.160.5.508 [DOI] [PubMed] [Google Scholar]
- Wagenmakers, E.‐J. , & Farrell, S. (2004). AIC model selection using Akaike weights. Psychonomic Bulletin & Review, 11(1), 192–196. 10.3758/BF03206482 [DOI] [PubMed] [Google Scholar]
- Wake, M. , Morton‐Allen, E. , Poulakis, Z. , Hiscock, H. , Gallagher, S. , & Oberklaid, F. (2006). Prevalence, stability, and outcomes of cry‐fuss and sleep problems in the first 2 years of life: Prospective community‐based study. Pediatrics, 117(3), 836–842. 10.1542/peds.2005-0775 [DOI] [PubMed] [Google Scholar]
- Walker, A. M. , & Menahem, S. (1994). Normal early infant behaviour patterns. Journal of Paediatrics and Child Health, 30(3), 260–262. 10.1111/j.1440-1754.1994.tb00630.x [DOI] [PubMed] [Google Scholar]
- Wessel, M. A. , Cobb, J. C. , Jackson, E. B. , Harris, G. S. Jr , & Detwiler, A. C. (1954). Paroxysmal fussing in infancy, sometimes called colic. Pediatrics, 14(5), 421–435. 10.1542/peds.14.5.421 [DOI] [PubMed] [Google Scholar]
- Wickham, H. , Averick, M. , Bryan, J. , Chang, W. , McGowan, L. , François, R. , Grolemund, G. , Hayes, A. , Henry, L. , Hester, J. , Kuhn, M. , Pedersen, T. , Miller, E. , Bache, S. , Müller, K. , Ooms, J. , Robinson, D. , Seidel, D. , Spinu, V. , … Yutani, H. (2019). Welcome to the tidyverse. Journal of Open Source Software, 4(43). 10.21105/joss.01686 [DOI] [Google Scholar]
- Wolke, D. , Bilgin, A. , & Samara, M. (2017). Systematic review and meta‐analysis: Fussing and crying durations and prevalence of colic in infants. The Journal of Pediatrics, 185, 55–61.e54. 10.1016/j.jpeds.2017.02.020 [DOI] [PubMed] [Google Scholar]
- Wolke, D. , Meyer, R. , & Gray, P. (1994). Validity of the Crying Pattern Questionnaire in a sample of excessively crying babies. Journal of Reproductive and Infant Psychology, 12(2), 105–114. 10.1080/02646839408408873 [DOI] [Google Scholar]
- Wurmser, H. , Rieger, M. , Domogalla, C. , Kahnt, A. , Buchwald, J. , Kowatsch, M. , Kuehnert, N. , Buske‐Kirschbaum, A. , Papoušek, M. , Pirke, K.‐M. , & von Voss, H. (2006). Association between life stress during pregnancy and infant crying in the first six months postpartum: A prospective longitudinal study. Early Human Development, 82(5), 341–349. 10.1016/j.earlhumdev.2005.09.016 [DOI] [PubMed] [Google Scholar]
- Wynter, K. , Rowe, H. , & Fisher, J. (2014). Interactions between perceptions of relationship quality and postnatal depressive symptoms in Australian, primiparous women and their partners. Australian Journal of Primary Health, 20(2), 174–181. 10.1071/PY12066 [DOI] [PubMed] [Google Scholar]
Associated Data
This section collects any data citations, data availability statements, or supplementary materials included in this article.
Supplementary Materials
Supplementary Material