

Abstract
Cytochrome P450 monooxygenase enzymes are versatile catalysts, which have been adapted for multiple applications in chemical synthesis. Mutation of a highly conserved active site threonine to a glutamate can convert these enzymes into peroxygenases that utilise hydrogen peroxide (H2O2). Here, we use the T252E‐CYP199A4 variant to study peroxide‐driven oxidation activity by using H2O2 and urea‐hydrogen peroxide (UHP). We demonstrate that the T252E variant has a higher stability to H2O2 in the presence of substrate that can undergo carbon‐hydrogen abstraction. This peroxygenase variant could efficiently catalyse O‐demethylation and an enantioselective epoxidation reaction (94 % ee). Neither the monooxygenase nor peroxygenase pathways of the P450 demonstrated a significant kinetic isotope effect (KIE) for the oxidation of deuterated substrates. These new peroxygenase variants offer the possibility of simpler cytochrome P450 systems for selective oxidations. To demonstrate this, a light driven H2O2 generating system was used to support efficient product formation with this peroxygenase enzyme.
Keywords: biocatalysis, heme enzymes, monooxygenases, peroxygenases, protein engineering
A single amino acid mutation can convert cytochrome P450 monooxygenases into peroxygenase. These do not require the addition of nicotinamide cofactors or electron transfer proteins greatly simplifying their application. For example, urea‐hydrogen peroxide and light can be used to drive the selective oxidations catalysed by these enzymes.

Introduction
Cytochromes P450 (P450s) are a family of heme monooxygenase enzymes that carry out oxidative transformations including the hydroxylation of carbon‐hydrogen bonds and the epoxidation of alkenes. [1] These enzyme‐catalysed transformations offer advantages over synthetic methods in that highly selective carbon‐hydrogen bonds can be functionalised under mild conditions and in a single step. [2] The high‐valent iron‐oxo radical cation intermediate, Compound 1 (Cpd 1) is the reactive intermediate which abstracts a hydrogen from the substrate before undergoing an oxygen rebound step to form the carbon‐oxygen bond.[ 3 , 4 ] The multi‐step catalytic cycle of these monooxygenases involve substrate binding, electron transfer, binding of dioxygen, and electron and proton delivery to enable Cpd I formation (Scheme 1).
Scheme 1.

Catalytic cycle of P450 monooxygenases. The peroxide shunt pathway which enables the enzyme to bypass the electron transfer steps is highlighted.
The electrons used to drive oxygen activation are derived from a nicotinamide cofactor (NAD(P)H) and are delivered via electron transfer partners. [5] In most CYP enzymes, proton delivery and oxygen activation is controlled by specific residues within the I‐helix.[ 6 , 7 , 8 , 9 , 10 ] The requirement for electron transfer proteins and expensive cofactors hampers the use of many of these P450 enzymes as biocatalysts. [11] If the need for both could be removed it could result in the simpler application, and more widespread use of these enzymes.[ 12 , 13 , 14 , 15 , 16 , 17 , 18 ] An alternative method is to use hydrogen peroxide (H2O2) via the peroxide shunt mechanism (Scheme 1). [12]
A select number of P450 family members have evolved to naturally function as peroxygenases. The CYP152 family of enzymes, whose members include CYP152A1 (P450BSβ) can oxidise fatty acids using H2O2 by making use of the carboxylate group of the substrate to generate Cpd I with hydrogen peroxide.[ 19 , 20 , 21 , 22 ] Cytochrome P450 heme monooxygenase enzymes have been converted to peroxygenases by introducing a single mutation, changing the active site threonine of the I‐helix (part of the acid‐alcohol pair involved in dioxygen activation) to a glutamate.[ 6 , 7 , 8 , 9 , 10 , 23 , 24 , 25 ] Alternatively molecules, which place an acid/base functional group close to the heme, can also introduce peroxygenase activity, though this requires significant synthetic effort and design of these bespoke molecules for each enzyme/substrate combination. [26]
Here we use the threonine‐252 to glutamate variant (T252E) of the P450 enzyme CYP199A4, from Rhodopseudomonas palustris HaA2, [24] to explore how such engineered peroxygenases can be used for catalytic oxidations using hydrogen peroxide and urea‐hydrogen peroxide (UHP) with para‐substituted benzoic acids. The mechanism of enzyme action is investigated using fluorinated and deuterated substrates. The oxidation of para‐substituted benzoic acids is demonstrated using a light‐activated system that generates hydrogen peroxide using flavin.
Results and Discussion
The activity and stability of the T252E mutant of CYP199A4, which converts this enzyme into a H2O2 utilising peroxygenase, was tested using the oxidation of 4‐methoxybenzoic acid as substrate by H2O2. First, we tested the stability of both the T252E and wild type (WT) CYP199A4 enzymes to hydrogen peroxide in the presence and absence of 4‐methoxybenzoic acid. In the presence of ≥10 mM H2O2, the heme of the substrate‐free T252E mutant was rapidly bleached. Higher H2O2 concentrations resulted in faster heme bleaching (Figure 1, Figure S1). This occurred more rapidly with the mutant than with the WT CYP199A4 (Figure S2).
Figure 1.

Rate of heme bleaching of the T252E‐CYP199A4 enzyme (3 μM) exposed to 60 mM H2O2 with (a) 1 mM 4‐methoxybenzoic acid, (b) in the absence of substrate and (c) 1 mM 4‐trifluoromethoxybenzoic acid. After 1 minute spectra were recorded at 2 minute intervals.
The addition of 4‐methoxybenzoic acid significantly reduced the rate of heme destruction in the T252E peroxygenase mutant (Figure 1). The fluorinated substrate 4‐trifluoromethoxybenzoic acid, which is not oxidised by T252E‐CYP199A4 (or WT CYP199A4) due to the strong C−F bonds, [27] was demonstrated to hinder bleaching of the enzyme by H2O2 compared to the absence of a substrate (Figure 1). However, the rate of bleaching was slower in the presence of 4‐methoxybenzoic acid. 4‐Trifluoromethoxybenzoic acid did not induce a spin state change on addition to the T252E mutant (Figure S3). However, we were able to determine a crystal structure of T252E‐CYP199A4 with this substrate bound (Figures 2 and S4, Tables S1 and S2). This demonstrated that 4‐trifluoromethoxybenzoic acid was bound to the peroxygenase variant in a similar fashion to 4‐methoxybenzoic acid in the T252E variant. Importantly the glutamate residue maintains a strong interaction with the heme aqua ligand which is not displaced on substrate binding explaining the lack of a change in the UV‐vis spectrum on substrate addition.
Figure 2.
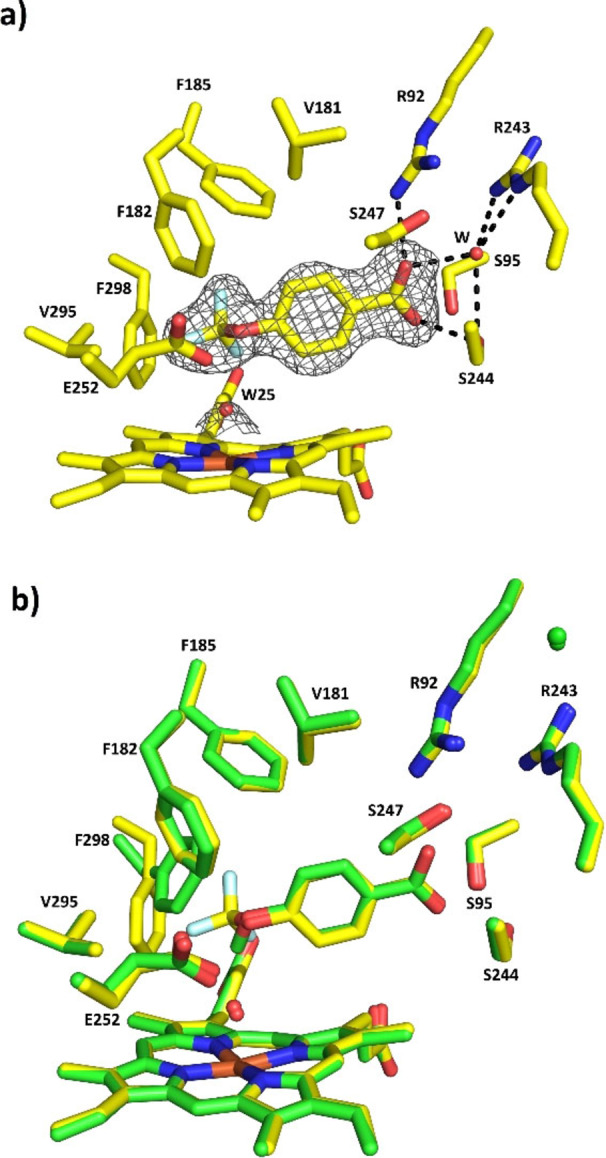
Crystal structure of 4‐trifluoromethoxybenzoic acid bound to T252E‐CYP199A5 solved at 1.95 Å. A composite omit map of the 4‐trifluoromethoxybenzoic acid substrate is shown as a grey mesh contoured at 1.0 (1.5 Å carve). b) The superimposed crystal structures of T252E‐CYP199A4 bound to 4‐trifluoromethoxybenzoic acid (yellow) and 4‐methoxybenzoic acid (green). When bound to the fluorinated substrate, the F298 residue moves away from the heme centre compared to 4‐methoxybenzoic acid to accommodate the trifluoro moiety.
We propose that quenching of reactive intermediates through substrate oxidation is partly responsible for preventing rapid heme destruction. We demonstrated that after bleaching through exposure to H2O2 the enzyme was inactivated, and no product formation was observed (Figure S5). Recently P450 peroxygenases have been demonstrated to display catalase activity.[ 28 , 29 ] This catalase activity has also been linked to protection against heme degradation and it was shown that in the presence of suitable substrates it acts as a scavenger pathway preventing heme degradation. Despite the similar binding modes of the fluorinated substrate and 4‐methoxybenzoic acid we yet cannot rule out that the interaction of peroxide with the heme is weaker in the presence of this ligand. [30]
Next, we optimised the peroxygenase activity of T252E‐CYP199A4 by varying the concentrations of enzyme, H2O2 or urea‐hydrogen peroxide (UHP), and the temperature. UHP is a crystalline solid that slowly yields free hydrogen peroxide when added to an aqueous solution.[ 31 , 32 ] 4‐Methoxybenzoic acid was oxidised with 1, 3 or 5 μM T252E‐CYP199A4 and 1 to 64 mM H2O2 or 16 to 64 mM UHP (Scheme 2). The differences in the levels of product formation when using UHP and H2O2 were moderate (Figure 3). Increasing the concentration of both to 32 mM and 64 mM yielded the highest levels of oxidised metabolite (Figure 3). The highest total turnover numbers were achieved with 3 μM enzyme, 1 mM substrate and at 30 °C rather than 16 °C (Figure S6).
Scheme 2.

Oxidation of para‐substituted benzoic acids carried out by T252E‐CYP199A4.
Figure 3.
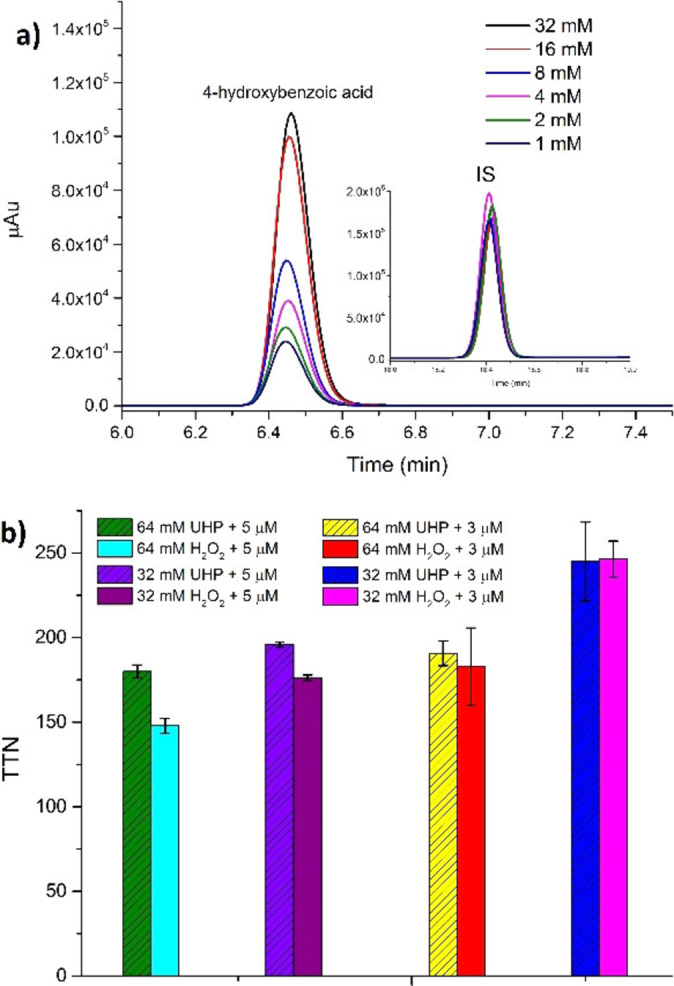
(a) HPLC analysis of 4‐methoxybenzoic acid O‐demethylation by T252E‐CYP199A4 (1 μM) using different concentrations of H2O2. Products are labelled as is the internal standard (IS). (b) A comparison of the total turnover numbers (TTN) obtained with T252E‐CYP199A4 (5 μM or 3 μM) in the presence of 1 mM 4‐methoxybenzoic acid and different concentrations of UHP and H2O2 (32 mM or 64 mM). Reactions were conducted at 30 °C and left for 24 h.
Previous experimental evidence and theory suggests the P450 CYP152 family peroxygenases use the Cpd I intermediate to catalyse hydroxylations and O‐demethylations.[ 33 , 34 ] To investigate if this was the case in the engineered T252E variant, we synthesised the deuterated substrate, 4‐(methoxy‐d3)benzoic‐d4 acid (see Experimental Section for details). This deuterated substrate could be used to measure if there was a kinetic isotope effect during the peroxygenase reactions of T252E‐CYP199A4.
The deuterated substrate bound to WT CYP199A4 and induced a complete change in the spin‐state of the heme from low‐spin to high‐spin as measured using UV‐vis spectroscopy (Figure S7). In contrast a minimal change in the spectrum was observed on addition of 4‐(methoxy‐d3) benzoic‐d4 acid to the T252E variant (Figure 4). This is consistent with what has been observed for 4‐methoxybenzoic acid and is related to the occupancy of the heme aqua ligand which is retained in the T252E variant as it interacts with the introduced glutamate residue. [24]
Figure 4.
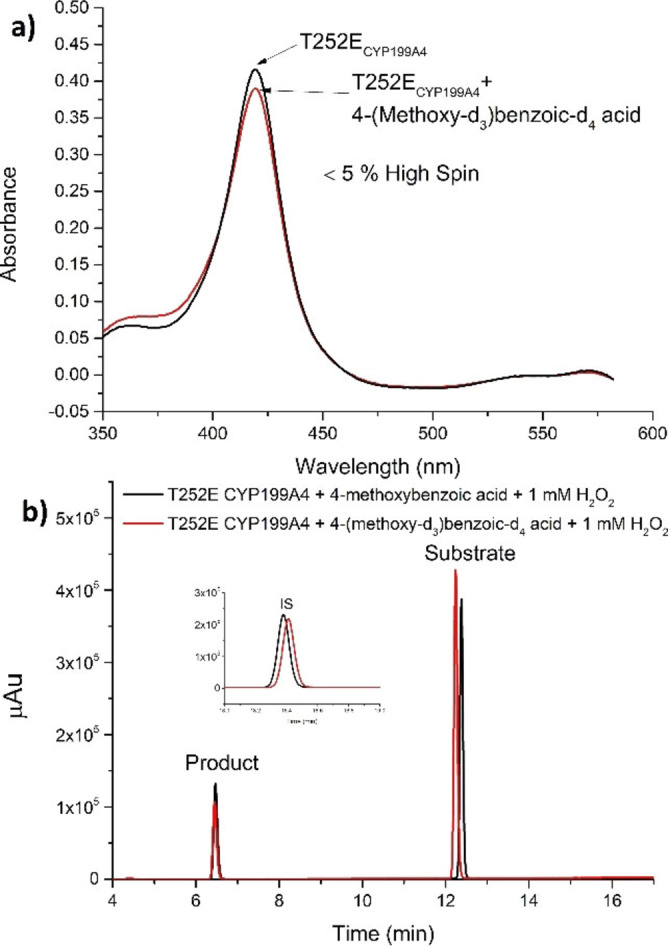
(a) Spin state shift analysis of 4‐(methoxy‐d3) benzoic‐d4 acid with T252E‐CYP199A4. (b) HPLC analysis of 4‐methoxybenzoic acid (black) and 4‐(methoxy‐d3) benzoic‐d4 acid (red) with T252E‐CP199A4 in the presence of 1 mM H2O2 after 24 h of incubation at 16 °C and 70 RPM. Substrate concentration used was 100 μM.
This was compared to the monooxygenase reactions of WT‐CYP199A4 in which electron transfer is the rate determining step in bacterial P450s. [35] Comparative oxidation reactions were performed with deuterated and non‐deuterated 4‐methoxybenzoic acid individually and as a mixture (Figure S7–S10). For both monooxygenase and peroxygenase systems there was not a significant difference in the levels of product arising from the deuterated or non‐deuterated substrates or in the turnover rate of the catalytic cycle (Figure 4, Table S3 and Figures S7–S10). There was also no change in the proportion of the deuterated versus non‐deuterated substrate over the time of the reactions (Figure S11, Table S4). The comparable results across both the monooxygenase and peroxygenase systems were indicative that C−H bond abstraction is not involved in the rate determining step of either the peroxygenase or monooxygenase reaction mechanisms. This would be consistent with both C−H bond activation steps in these O‐demethylation reactions proceeding via the radical rebound mechanism using Cpd I which is known to be fast.[ 36 , 37 ]
We next investigated if the peroxygenase activity of the T252E variant could catalyse the epoxidation of 4‐vinylbenzoic acid. WT CYP199A4 has been demonstrated to catalyse this reaction with high enantioselectivity for the (S)‐enantiomer (99 % ee). [38] The T252E peroxygenase enzyme was able to epoxidise 4‐vinylbenzoic acid using H2O2 more efficiently than the WT enzyme (Figure 5). The high enantioselectivity for the (S)‐enantiomer was also maintained in these peroxygenase reactions (94 % ee, by HPLC Scheme 2).
Figure 5.

(a) Time course of 4‐vinylbenzoic acid conversion into the corresponding epoxide by peroxygenase activity of WT and T252E CYP199A4 isoforms (b) Enantioselective HPLC analysis of the epoxide generated by the T252E mutant in a H2O2‐driven reaction (60 mM H2O2) over a 60‐minute period (black). In purple is a control reaction omitting the P450.
The T252E peroxygenase variant of CYP199A4 opens the possibility of using new methods to drive C−H bond activation by cytochrome P450 enzymes. We wanted to assess if the catalytic activity of the system could be supported by generating H2O2 over time using light, flavin mononucleotide (FMN), and the electron donor ethylenediaminetetraacetate (EDTA). [39]
To assess the efficiency of this method, control reactions were performed, using the natural CYP152 family peroxygenase enzyme P450Bsβ. This enzyme is reported to catalyse the α‐ and β‐hydroxylation of fatty acids. [40] GC‐MS analysis of the reaction of this enzyme with tetradecanoic acid demonstrated the formation of a complex mix of metabolites (Figures 6 and S12a–d). This included metabolites arising from α‐ and β‐hydroxylation but also from α‐oxidative decarboxylation to yield shorter‐alkyl‐chain fatty acids including tridecanoic, dodecanoic, undecanoic and decanoic acid (Scheme 3). [41] Extensive further oxidation of these shorter chain fatty acids also occurred (Figure 6). This control reaction highlighted that the light driven system could generate enough H2O2 to support these peroxygenase enzymes.
Figure 6.

GC‐MS Analysis of light driven oxidation of tetradecanoic acid (C14) by CYP152A1 (black, P450BSβ). In red is a control reaction with 10 mM H2O2 and no P450 added. Conditions used are 5 μM P450, 200 μM FMN, 1 mM EDTA and 100 μM substrate for the light‐driven reaction. Other metabolites were indicated by the length of the fatty acid chain (i. e., C10 for decanoic acid) and by α or β hydroxylation (i. e., α‐C14‐OH for α‐hydroxy tetradecanoic acid).
Scheme 3.
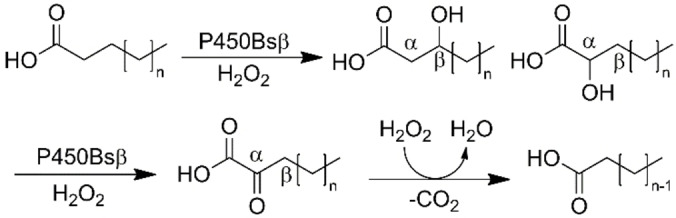
Reaction scheme for the hydroxylation of fatty acids by P450Bsβ and subsequent α‐keto decarboxylation.
We then applied this system to T252E‐CYP199A4 to assess if it could drive C−H bond activation. We were able to demonstrate the oxidative demethylation of 4‐methoxybenzoic acid using light (Figure 7).
Figure 7.

(a) Light driven turnovers of T252E‐CYP199A4 (1 μM) and substrate (200 μM) with a control reaction in the dark. (b) Time course experiments of light activated T252E‐CYP199A4 reaction with 4‐methoxybenzoic acid. Conditions used are CYP199A4‐T252E (3 μM), FMN (200 μM), EDTA (1 mM) and 4‐methoxyBA (200 μM). (c) Optimisation of light‐activated systems were then carried out with different enzyme concentrations (1 μM, 3 μM and 5 μM) with 200 μM FMN Reaction time was 20 hr at room temperature).
Optimisation of the system by varying the enzyme and substrate concentration resulted in complete conversion of 200 μM substrate with 2.5 % molar equivalents of enzyme as the biocatalyst (40 TTN). While these turnover numbers need to be improved for practical applications, we have been able to show complete conversion of substrate to product using a system that can generate H2O2 in situ. This should enable greater control of the conditions that enable productive enzyme activity versus catalyst degradation. We were also able to demonstrate that T252E‐CYP199A4 with FMN and light was able to epoxidise 4‐vinylbenzoic acid (Figure S14).
Conclusion
The T252E‐CYP199A4 peroxygenase variant could catalyse the oxidative demethylation of 4‐methoxybenzoic acid and the stereoselective epoxidation of 4‐vinylbenzoic acid by using H2O2 supplied directly, in the form of urea‐hydrogen peroxide or generated by using a light‐driven flavin/EDTA‐based system. The selectivity of the WT enzyme for these reactions was maintained when using the T252E peroxygenase variant. The lack of a kinetic isotope effect in our experiments demonstrates that C−H bond abstraction is not involved in a rate determining step of the mechanism for the peroxygenase pathway. This would agree with both peroxygenase and monooxygenase pathways by using Cpd I as the reactive intermediate. Further studies with bespoke substrate/enzyme combinations could enable the measurement of an intrinsic kinetic isotope effect that would facilitate a more complete analysis. This peroxygenase system is a step towards generating simpler biocatalysts for selective hydroxylation reactions and eliminating the requirement for nicotinamide cofactors and electron transfer partners. The equivalent mutation in other P450s would enable peroxygenase activity to be conferred for selective oxidations across a range of substrates by using these enzymes. Further optimisation of the systems, by rational protein engineering or directed evolution, could also be undertaken to improve the catalytic activity and the stability. Flow chemistry methods to deliver the H2O2 cofactor over an immobilised enzyme could also be used to improve the catalyst lifetime and therefore the yield. [42]
Experimental Section
Enzymology ‐ General: General reagents and organics were purchased from Sigma‐Aldrich. Isopropyl‐β‐D‐thiogalactopyranoside (IPTG) and buffer components were obtained from Astral Scientific (Australia). UV/Vis spectroscopy was performed on an Agilent Cary 60 spectrophotometer.
Analytical high performance liquid chromatography (HPLC) was performed on a Shimadzu LC‐20AD equipped with a Phenomenex Kinetex 5u XB−C18 100 A column (250 mm x 4.6 mm, 5 μM), SIL‐20 A autosampler, CTO‐20 A, SPD‐20 A UV detector and CBM‐20Alite communications module. A gradient of 20–95 % acetonitrile in water (both containing trifluoroacetic acid, TFA, 0.1 %) was run at a flow rate of 1 mL min−1 over 30 minutes and detector wavelength was set at 254 nm.
Chiral HPLC analysis was carried using the same system as above using a Lux Cellulose‐1 chiral column (1000 Å pore size, 100×4.6 mm, 3 μm; Phenomenex) using isocratic elution with 20 % Acetonitrile in H2O (0.1 % TFA) at a flow rate of 0.4 mL min−1.
GC‐MS analysis was performed using a Shimadzu GC‐2010 gas chromatograph equipped with an autoinjector and a GCMS‐QP2010S detector; the column used was again a DB‐5MS UI column. The interface and injection port temperatures were held at 280 and 250 °C. The column was held at 120 °C for 3 min, and the temperature was then increased to 240 °C at a rate of 7.5 °C min−1 and held at 240 °C for 6 min.
Production and purification of enzymes: HaPux, HaPuR, CYP199A4 and its variants were all produced, and purified as described previously. [24] A pET28 plasmid containing the gene for CYP152 A1 (P450BSβ) with 6 x Histag residues at the N‐terminus and a silica binding amino acid sequence (MPGRARAQRQSSRGR) [43] at the C‐terminus was purchased commercially from Twist Biosciences. This plasmid was transformed into E. coli BL21 (DE3) competent cells (New England Biolabs) and the bacteria were incubated overnight at 37 °C on an LB agar plate containing kanamycin (30 mg L−1). Colonies of the bacteria were used to inoculate 1 mL of LB with kanamycin (30 mg L−1) and left for 5 h at 37 °C and 200 RPM to generate a starter culture. The starter culture (50 μL) was used to inoculate 2 x 750 mL volumes of LB broth containing kanamycin (30 mg L−1) and the larger cultures were incubated for 8 h at 37 °C and 120 RPM. This was followed by incubation at 18 °C and 90 RPM, while 2 % w/v EtOH, 0.02 % w/v of benzyl alcohol and 2 mL of trace elements solution were added to the culture. The resulting culture was incubated for 30 mins at 18 °C and 90 RPM and ∼30 μM IPTG (isopropyl β‐D‐1‐thiogalactopyranoside) was added to induce protein expression. After incubating the culture for ∼24 h at 18 °C and 90 rpm, it was centrifuged (5000 g, 10 min, 4 °C) to collect the cell pellet, which was stored frozen at −20 °C.
The frozen cell pellet was thawed and resuspended in 100 mL of lysis buffer (100 mM KPi, pH 7.5, 300 mM KCl, 20 mM imidazole). The cells were lysed by sonication using an Autotune CV334 Ultrasonic Processor equipped with a standard probe (136 mm x 13 mm; Sonics and Materials, US) using 30×10 s pulses with 50 s intervals. Cell debris were removed by centrifugation (18000 g, 20 mins, 4 °C). The supernatant was then loaded on to a 5 mL His‐trap column (GE Healthcare) equilibrated with lysis buffer. The column was then washed with lysis buffer (25 mL). The bound protein was then eluted with elution buffer (100 mM KPi, pH 7.5, 300 mM KCl, 300 mM imidazole). Samples and buffers were applied to the column with flowrate of 3 ml min−1. Eluted protein was concentrated by ultrafiltration using a Vivacell 100 centrifugal concentrator with a 10 kDa molecular weight cut‐off membrane (Sartorius). The concentrated protein was eluted down a PD‐10 desalting column (GE Healthcare) to remove excess imidazole and concentrated again to a final volume of 2 mL and glycerol was added to a final concentration of 50 % v/v. The purified protein was stored at −20 °C. Crystals of the T252E variant with 4‐trifluoromethoxybenzoic acid were prepared and the structure determined using the same methods described previously for the 4‐methoxybenzoic acid‐bound form of this enzyme. [24]
Activity assays
In vitro NADH oxidation assays: Glycerol was removed from proteins using a 5 mL gel filtration column (PD‐10, GE Healthcare) and the concentration of each protein was quantified using UV‐Vis spectrophotometry. In a final volume of 1.5 mL, oxygenated Tris buffer (50 mM, pH 7.4), CYP199A4 (0.5 or 0.05 μM), ferredoxin (HaPux, 5 μM), ferredoxin‐reductase (HaPuR, 0.5 μM), bovine liver catalase (100 ng μL−1) were combined and equilibrated at 30 °C for 2 min. NADH was added to A340≈2.0 (≈320 μM). Substrate was then added to the desired final concentration (1 mM or 0.5 mM) and the absorbance at 340 nm was monitored. The rate of oxidation of NADH was determined from the gradient of the plot of A340 versus time, using the extinction coefficient of NADH, ϵ340=6.22 mM−1 cm−1.
Peroxygenase assays: The peroxygenase oxidation assays were run at 16 °C or 30 °C in a total volume of 600 μL consisting of Tris buffer (pH 7.4, 50 mM), 1–5 μM enzyme and 200–1000 μM substrate. The reaction was started by addition of H2O2 (1–64 mM) or UHP (16/32/64 mM) and incubated for 20 h at 70 rpm. UHP was added as a solid powder while H2O2 was added from a 500 mM stock solution.
Light‐driven peroxygenase activity of the T252E‐CYP199A4 enzyme was assayed in a reaction mixture containing enzyme (1–5 μM), substrate (200 μM), EDTA (1 mM), FMN (200 μM) in oxygen saturated Tris buffer, 50 mM, pH 7.4 with a total reaction volume of 1 mL. Samples were shaken at 70 rpm at room temperature and assays were initiated by illumination from an Arlec 5700 kW light source. Total assay time was 20 hr, after which the light was switched off. The reactions were terminated by the addition of 10 μL catalase (10 mg/mL stock) before being prepared for HPLC analysis. Dark reactions were carried out in the same conditions but within a N‐Biotek NB‐205 L tinted shaking incubator with a dark cloth covering the incubator.
Heme bleaching assay: A 600 μL aliquot of WT CYP199A4 or the T252E mutant (3 μM) in Tris buffer (50 mM, pH 7.4) was used to baseline the UV‐vis spectrophotometer. Substrate (1 mM) and H2O2 (1–60 mM) were added, and the UV‐Vis spectrum was recorded. Heme prosthetic group destruction was monitored by recording UV‐Vis spectra at 2 min intervals.
Product analysis: For HPLC analysis, after reactions were completed, 132 μL of the reaction mixture was mixed with 2 μL of an internal standard solution (10 mM 9‐hydroxyfluorene solution in EtOH) and 66 μL of CH3CN. Samples were acidified with 0.2 μL of trifluoroacetic acid. Products were identified by co‐elution with authentic product standards.[ 38 , 44 ] Products were calibrated against the internal standard. All reactions were performed in triplicate or duplicate.
For GC‐MS analysis, the reaction mixture (1000 μL or 600 μL) was mixed with 10 μL of an internal standard (10 mM 9‐hydroxyfluorene solution in EtOH) and extracted with EtOAc (2×400 μL). The extracts were dried with MgSO4 and solvent was removed under N2. The remaining residue was resuspended in anhydrous acetonitrile (150 μL) and derivatisation agent (15 μL, BSTFA+TMCS, 99 : 1). The mixtures were left for 2 h at 37 °C prior to analysis by GC‐MS.
Synthesis experiments: All reactions were performed under an atmosphere of nitrogen unless otherwise specified. Chemicals and reagents of the highest grade were purchased from Sigma‐Aldrich (Sydney, Australia) and were used without further purification. Solvents were purchased from Sigma‐Aldrich and Merck. NMR solvents were purchased from Cambridge Isotope Laboratories Inc. (MA, USA) and Sigma‐Aldrich and were used without further purification. D2O (99.8 %) was supplied by AECL, Canada. Analytical thin‐layer chromatography (TLC) was performed using Merck aluminium backed silica gel 60 F254 (0.2 mm) plates, which were visualised with shortwave (254 nm) ultraviolet light or with potassium permanganate, vanillin, Hanessian's or bromocresol green stains. Flash column chromatography was performed using Merck Kieselgel 60 (230‐400 mesh) silica gel, with the eluent mixture reported as the volume:volume ratio. Hydrothermal reactions were performed in D2O at high temperatures by mixing the appropriate benzoic acid derivative with NaOH and Pd/C (10 % w/w) in a Mini Benchtop 4560 Parr reactor (450 mL vessel capacity, 3000 psi maximum pressure, 350 °C maximum temperature) (Moline, USA). Nuclear magnetic resonance spectra were recorded at 300 K using either a Bruker AVANCE DRX400 (400 MHz) spectrometer. 1H chemical shifts are expressed as parts per million (ppm) with residual methanol (δ 3.31) and dimethyl sulfoxide (δ 2.50) as reference and are reported as chemical shift (δ); relative integral; multiplicity; coupling constants (J) reported in Hz. 13C chemical shifts are expressed as parts per million (ppm) with residual methanol (δ 49.0) and dimethyl sulfoxide (δ 39.52) as reference and reported as chemical shift (δ); multiplicity. 2H chemical shifts are reported as parts per million (ppm) and are reported as chemical shift (δ); multiplicity. Low‐resolution mass spectrometry (LRMS) was recorded using electrospray ionisation (ESI) recorded on a 4000 QTrap AB Sciex spectrometer. The overall percentage deuteration of the molecules were calculated by MS using the isotope distribution analysis of the different isotopologues. This was calculated taking into consideration the 13C natural abundance, whose contribution was subtracted from the peak area of each M+1 isotopologue to allow for accurate estimation of the percentage deuteration of each isotopologue.
Synthetic Procedures
4‐Hydroxybenzoic‐d4 acid: (Scheme 4; step a) A mixture of 4‐hydroxybenzoic acid (7 g, 50.7 mmol), sodium hydroxide (4.5 g, 111.5 mmol) and palladium on carbon (10 % w/w, 1.58 g, 1.52 mmol) in D2O (120 mL) was heated at 210 °C for 2 h in a 450 mL Parr reactor. After cooling to room temperature the mixture was passed through a pad of Celite and the filtrate concentrated under reduced pressure to a volume of about 100 mL. The aqueous solution was acidified (pH=2) with aqueous hydrochloric acid (6 M) and extracted with ethyl acetate (5×75 mL). The combined organic extracts were dried over magnesium sulfate and concentrated under reduced pressure to obtain a crude mixture of the desired benzoic acid derivative and phenol. The desired product was isolated by flash column chromatography using ethyl acetate, hexane (3 : 7 to 1:0) as an eluent to obtain 4‐hydroxybenzoic‐d4 acid (0.26 g, 3.6 %) as a white solid, R f=0.1 (2 : 3 EtOAc, hexane); 1H NMR (400 MHz, MeOD) δ 7.88 (residual), 6.82 (residual) ppm; 2H NMR (6e1.4 MHz, MeOD) δ 7.91 (2D, bs), 6.86 (2D, bs) ppm; 13C [44] NMR (101 MHz, MeOD) δ 170.1, 163.3, 122.5 ppm; 13C{1H, 2H} NMR (101 MHz, MeOD) δ 170.1, 163.3, 132.6, 122.5, 115.7 ppm; MS (ESI−) [M−H]−: 141.2 (major isotopologue), 89.6 %D.
Scheme 4.
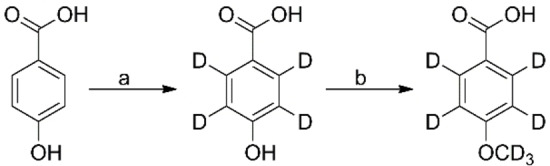
Synthesis of 4‐(methoxy‐d3)benzoic‐d4 acid. Reagents and conditions: (a) Pd/C, NaOH, D2O, 210 °C, 2 h, 4 %, 89.6 %D; (b) i) CD3I, K2CO3, reflux, 10 h, ii) LiOH (aq.), MeOD, THF, rt, 16 h, 62 %, 93.3 %D.
4‐(Methoxy‐d3)benzoic‐d4 acid: (Scheme 4; step b) To a suspension of 4‐hydroxybenzoic‐d4 acid (0.26 g, 1.83 mmol) and potassium carbonate (0.76 g, 5.49 mmol) in acetone (5 mL) was added methyl iodide‐d3 (0.34 mL, 5.49 mmol), dropwise. The mixture was warmed to reflux and stirred for 6 h. Mass spectrometry analysis of an aliquot of the reaction mixture revealed a mixture of methylated products. Additional methyl iodide‐d3 (0.34 mL, 5.49 mmol) was added and heating was continued for a further 4 h. Volatiles were removed under reduced pressure and the residue taken up in a mixture of CD3OD (5 mL) and tetrahydrofuran (2 mL). To this was added aqueous lithium hydroxide (2 M, in D2O, 2.7 mL) and the mixture stirred for 16 h at room temperature. The volatiles were removed under reduced pressure and the residual aqueous solution washed with dichloromethane (5 mL), acidified (pH=3) with aqueous hydrochloric acid (6 M) and extracted with ethyl acetate (4×50 mL). The combined organic extracts were dried over anhydrous magnesium sulfate and concentrated under reduced pressure. The resulting crude solid was purified by flash column chromatography using ethyl acetate, hexane (0 : 1 to 7 : 13) as an eluent to obtain 4‐(methoxy‐d3)benzoic‐d4 acid (0.18 g, 62 %) as a white solid, R f=0.4 (1 : 1 EtOAc, hexane); 1H NMR (400 MHz, DMSO‐d6) δ 7.89 (residual), 7.01 (residual) ppm; 2H NMR (61.4 MHz, DMSO‐d6) δ 7.92 (2D, bs), 7.04 (2D, bs), 3.77 (3D, s) ppm; 13C{1H}NMR (101 MHz, DMSO‐d6) δ 167.0, 162.8, 122.8 ppm; 13C{1H, 2H} NMR (101 MHz, DMSO‐d6) δ 167.0, 162.8, 131.0, 122.8, 113.5, 54.6 ppm; MS (ESI−) [M−H]−: 158.1 (major isotopologue), 70.9 % d7, 17.4 % d6, 2.4 % d5, 1.2 % d4, 1.5 % d3, 93.3 %D.
Conflict of interest
The authors declare no conflict of interest.
1.
Supporting information
As a service to our authors and readers, this journal provides supporting information supplied by the authors. Such materials are peer reviewed and may be re‐organized for online delivery, but are not copy‐edited or typeset. Technical support issues arising from supporting information (other than missing files) should be addressed to the authors.
Supporting Information
Acknowledgements
The authors acknowledge the award of Australian Government Research Training Program Scholarships to J.H.Z.L (PhD, University of Adelaide Constance Fraser Scholarship) and M.N.P. (M. Phil). J.H.Z.L thanks the CSIRO Synthetic Biology Future Science Platform for a PhD top‐up Scholarship. The work was funded in part through Australian Research Council grant DP200102411 (to S.G.B. and others). The research was supported by a National Deuteration Facility grant (Proposal 9152). The National Deuteration Facility in Australia is partly funded by The National Collaborative Research Infrastructure Strategy (NCRIS), an Australian Government initiative. This research was undertaken in part using the MX1 beamline at the Australian Synchrotron, part of ANSTO. We thank Dr Charlotte Williams (CSIRO) for helpful suggestions on the work and the manuscript. Open Access publishing facilitated by The University of Adelaide, as part of the Wiley ‐ The University of Adelaide agreement via the Council of Australian University Librarians.
J. H. Z. Lee, M. N. Podgorski, M. Moir, A. R. Gee, S. G. Bell, Chem. Eur. J. 2022, 28, e202201366.
Data Availability Statement
The data that support the findings of this study are available in the supplementary material of this article.
References
- 1. Ortiz de Montellano P. R., in Cytochrome P450: Structure, Mechanism, and Biochemistry 4th ed., Springer International Publishing, Switzerland, 2015. [Google Scholar]
- 2. Roiban G. D., Reetz M. T., Chem. Commun. 2015, 51, 2208–2224. [DOI] [PubMed] [Google Scholar]
- 3. Rittle J., Green M. T., Science 2010, 330, 933–937. [DOI] [PubMed] [Google Scholar]
- 4. Groves J. T., McClusky G. A., J. Am. Chem. Soc. 1976, 98, 859–861. [Google Scholar]
- 5. Hannemann F., Bichet A., Ewen K. M., Bernhardt R., Biochim. Biophys. Acta 2007, 1770, 330–344. [DOI] [PubMed] [Google Scholar]
- 6. Coleman T., Stok J. E., Podgorski M. N., Bruning J. B., De Voss J. J., Bell S. G., J. Biol. Inorg. Chem. 2020. [DOI] [PubMed] [Google Scholar]
- 7. Cryle M. J., De Voss J. J., ChemBioChem 2008, 9, 261–266. [DOI] [PubMed] [Google Scholar]
- 8. Hishiki T., Shimada H., Nagano S., Egawa T., Kanamori Y., Makino R., Park S. Y., Adachi S., Shiro Y., Ishimura Y., J. Biochem. 2000, 128, 965–974. [DOI] [PubMed] [Google Scholar]
- 9. Ishigooka M., Shimizu T., Hiroya K., Hatano M., Biochemistry 1992, 31, 1528–1531. [DOI] [PubMed] [Google Scholar]
- 10. Raag R., Martinis S. A., Sligar S. G., Poulos T. L., Biochemistry 1991, 30, 11420–11429. [DOI] [PubMed] [Google Scholar]
- 11. O′Reilly E., Kohler V., Flitsch S. L., Turner N. J., Chem. Commun. 2011, 47, 2490–2501. [DOI] [PubMed] [Google Scholar]
- 12. Cirino P. C., Arnold F. H., Angew. Chem. Int. Ed. Engl. 2003, 42, 3299–3301. [DOI] [PubMed] [Google Scholar]
- 13. Zachos I., Nowak C., Sieber V., Curr. Opin. Chem. Biol. 2019, 49, 59–66. [DOI] [PubMed] [Google Scholar]
- 14. Zilly F. E., Taglieber A., Schulz F., Hollmann F., Reetz M. T., Chem. Commun. 2009, 7152–7154. [DOI] [PubMed] [Google Scholar]
- 15. Jensen K., Jensen P. E., Møller B. L., ACS Chem. Biol. 2011, 6, 533–539. [DOI] [PubMed] [Google Scholar]
- 16. Krishnan S., Wasalathanthri D., Zhao L., Schenkman J. B., Rusling J. F., J. Am. Chem. Soc. 2011, 133, 1459–1465. [DOI] [PMC free article] [PubMed] [Google Scholar]
- 17. Udit A. K., Arnold F. H., Gray H. B., J. Inorg. Biochem. 2004, 98, 1547–1550. [DOI] [PubMed] [Google Scholar]
- 18. Tran N. H., Nguyen D., Dwaraknath S., Mahadevan S., Chavez G., Nguyen A., Dao T., Mullen S., Nguyen T. A., Cheruzel L. E., J. Am. Chem. Soc. 2013, 135, 14484–14487. [DOI] [PMC free article] [PubMed] [Google Scholar]
- 19. Matsunaga I., Ueda A., Sumimoto T., Ichihara K., Ayata M., Ogura H., Arch. Biochem. Biophys. 2001, 394, 45–53. [DOI] [PubMed] [Google Scholar]
- 20. Girhard M., Schuster S., Dietrich M., Durre P., Urlacher V. B., Biochem. Biophys. Res. Commun. 2007, 362, 114–119. [DOI] [PubMed] [Google Scholar]
- 21. Matsunaga I., Sumimoto T., Ueda A., Kusunose E., Ichihara K., Lipids 2000, 35, 365–371. [DOI] [PubMed] [Google Scholar]
- 22. Rude M. A., Baron T. S., Brubaker S., Alibhai M., Del Cardayre S. B., Schirmer A., Appl. Environ. Microbiol. 2011, 77, 1718–1727. [DOI] [PMC free article] [PubMed] [Google Scholar]
- 23. Slessor K. E., Farlow A. J., Cavaignac S. M., Stok J. E., De Voss J. J., Arch. Biochem. Biophys. 2011, 507, 154–162. [DOI] [PubMed] [Google Scholar]
- 24. Podgorski M. N., Harbort J. S., Lee J. H. Z., Nguyen G. T. H., Bruning J. B., Donald W. A., Bernhardt P. V., Harmer J. R., Bell S. G., ACS Catal. 2022, 12, 1614–1625. [Google Scholar]
- 25. Shoji O., Fujishiro T., Nishio K., Kano Y., Kimoto H., Chien S.-C., Onoda H., Muramatsu A., Tanaka S., Hori A., Sugimoto H., Shiro Y., Watanabe Y., Catal. Sci. Technol. 2016, 6, 5806–5811. [Google Scholar]
- 26. Ma N., Chen Z., Chen J., Chen J., Wang C., Zhou H., Yao L., Shoji O., Watanabe Y., Cong Z., Angew. Chem. Int. Ed. 2018, 57, 7628–7633; [DOI] [PubMed] [Google Scholar]; Angew. Chem. 2018, 130, 7754–7759. [Google Scholar]
- 27. Coleman T., Wong S. H., Podgorski M. N., Bruning J. B., De Voss J. J., Bell S. G., ACS Catal. 2018, 8, 5915–5927. [Google Scholar]
- 28. Onoda H., Tanaka S., Watanabe Y., Shoji O., Faraday Discuss. 2022, 234, 304–314. [DOI] [PubMed] [Google Scholar]
- 29. Hernández-Ruiz J., Arnao M. B., Hiner A. N. P., García-Cánovas F., Acosta M., Biochem. J. 2001, 354, 107–114. [DOI] [PMC free article] [PubMed] [Google Scholar]
- 30. Kawakami N., Shoji O., Watanabe Y., Angew. Chem. Int. Ed. 2011, 50, 5315–5318; [DOI] [PubMed] [Google Scholar]; Angew. Chem. 2011, 123, 5427–5430. [Google Scholar]
- 31. Ankudey E. G., Olivo H. F., Peeples T. L., Green Chem. 2006, 8, 923–926. [Google Scholar]
- 32. Ingenbosch K. N., Quint S., Dyllick-Brenzinger M., Wunschik D. S., Kiebist J., Suss P., Liebelt U., Zuhse R., Menyes U., Scheibner K., Mayer C., Opwis K., Gutmann J. S., Hoffmann-Jacobsen K., ChemBioChem 2021, 22, 398–407. [DOI] [PMC free article] [PubMed] [Google Scholar]
- 33. Ramanan R., Dubey K. D., Wang B., Mandal D., Shaik S., J. Am. Chem. Soc. 2016, 138, 6786–6797. [DOI] [PubMed] [Google Scholar]
- 34. Wang B., Li C., Dubey K. D., Shaik S., J. Am. Chem. Soc. 2015, 137, 7379–7390. [DOI] [PubMed] [Google Scholar]
- 35. Brewer C. B., Peterson J. A., J. Biol. Chem. 1988, 263, 791–798. [PubMed] [Google Scholar]
- 36. Sarkar M. R., Houston S. D., Savage G. P., Williams C. M., Krenske E. H., Bell S. G., De Voss J. J., J. Am. Chem. Soc. 2019, 141, 19688–19699. [DOI] [PubMed] [Google Scholar]
- 37. Watanabe Y., Oae S., Iyanagi T., Bull. Chem. Soc. Jpn. 1982, 55, 188–195. [Google Scholar]
- 38. Coleman T., Kirk A. M., Chao R. R., Podgorski M. N., Harbort J. S., Churchman L. R., Bruning J. B., Bernhardt P. V., Harmer J. R., Krenske E. H., De Voss J. J., Bell S. G., ACS Catal. 2021, 11, 1995–2010. [Google Scholar]
- 39. Girhard M., Kunigk E., Tihovsky S., Shumyantseva V. V., Urlacher V. B., Biotechnol. Appl. Biochem. 2013, 60, 111–118. [DOI] [PubMed] [Google Scholar]
- 40. Xu H., Ning L., Yang W., Fang B., Wang C., Wang Y., Xu J., Collin S., Laeuffer F., Fourage L., Li S., Biotechnol. Biofuels 2017, 10, 208. [DOI] [PMC free article] [PubMed] [Google Scholar]
- 41. Onoda H., Shoji O., Suzuki K., Sugimoto H., Shiro Y., Watanabe Y., Catal. Sci. Technol. 2018, 8, 434–442. [Google Scholar]
- 42. Hartley C. J., Williams C. C., Scoble J. A., Churches Q. I., North A., French N. G., Nebl T., Coia G., Warden A. C., Simpson G., Frazer A. R., Jensen C. N., Turner N. J., Scott C., Nat. Catal. 2019, 2, 1006–1015. [Google Scholar]
- 43. Abdelhamid M. A. A., Motomura K., Ikeda T., Ishida T., Hirota R., Kuroda A., Appl. Microbiol. Biotechnol. 2014, 98, 5677–5684. [DOI] [PubMed] [Google Scholar]
- 44. Podgorski M. N., Coleman T., Chao R. R., De Voss J. J., Bruning J. B., Bell S. G., J. Inorg. Biochem. 2020, 203, 110913. [DOI] [PubMed] [Google Scholar]
Associated Data
This section collects any data citations, data availability statements, or supplementary materials included in this article.
Supplementary Materials
As a service to our authors and readers, this journal provides supporting information supplied by the authors. Such materials are peer reviewed and may be re‐organized for online delivery, but are not copy‐edited or typeset. Technical support issues arising from supporting information (other than missing files) should be addressed to the authors.
Supporting Information
Data Availability Statement
The data that support the findings of this study are available in the supplementary material of this article.