

Abstract
Aim
To develop a method for direct measurement of the fluorescent d‐glucose analogue 2‐NBDG transport across the plasma membrane of single skeletal muscle fibres and derive the theoretical framework for determining the kinetic parameters for d‐glucose transport under basal conditions.
Methods
A novel method is described for measuring free 2‐NBDG transport across plasma membrane of single rat muscle fibres at rest. The 2‐NBDG uptake was >90% suppressed by 100 µM cytochalasin B in both fast‐twitch and slow‐twitch fibres, indicating that the 2‐NBDG transport is GLUT‐mediated. Fibres were identified as fast‐twitch or slow‐twitch based on the differential sensitivity of their contractile apparatus to Sr2+.
Results
The time course of 2‐NBDG uptake in the presence of 50 µM 2‐NBDG follows a one‐phase exponential plateau curve and is faster in fast‐twitch (rate constant 0.053 ± 0.0024 s‐1) than in slow‐twitch fibres (rate constant 0.031 ± 0.0021 s‐1). The rate constants were markedly reduced in the presence of 20 mM d‐glucose to 0.0082 ± 0.0004 s‐1 and 0.0056 ± 0.0002 s‐1 in fast‐twitch and slow‐twitch fibres respectively. 2‐NBDG transport was asymmetric, consistent with GLUT1 being the major functional GLUT isoform transporting 2‐NBDG in muscle fibres at rest. The parameters describing the transport kinetics for both 2‐NBDG and d‐glucose (dissociation constants, Michaelis–Menten constants, maximal rates of uptake and outflow) were calculated from the measurements made with 2‐NBDG.
Conclusion
Free 2‐NBDG and d‐glucose transport across the plasma membrane of single rat muscle fibres at rest is fast, conclusively showing that the rate‐limiting step in d‐glucose uptake in skeletal muscle is not necessarily the GLUT‐mediated transport of d‐glucose.
Keywords: 2‐NBDG transport in single muscle fibres, d ‐glucose transport kinetics, fast‐twitch muscle fibres, GLUT1, slow‐twitch muscle fibres
1. INTRODUCTION
Skeletal muscle is the major tissue in mammals for the disposal of blood d‐glucose and as such plays an essential role in the homeostatic regulation of plasma d‐glucose. It is not surprising then, that for more than forty years there has been considerable research into understanding how d‐glucose is transported between the plasma and the cytoplasm of a skeletal muscle cell, driven in large part because carbohydrate metabolism disorders such as diabetes are associated with failure of d‐glucose disposal by skeletal muscle and subsequent disruption of d‐glucose homeostasis.
Wasserman et al 1 proposed a model of d‐glucose uptake in skeletal muscle termed the “distributed control paradigm model of d‐glucose uptake” which describes a tightly coupled set of processes connecting d‐glucose transport and metabolism. In this model, the rate at which d‐glucose is delivered to the sarcolemma from the plasma, the rate of transport of d‐glucose across the plasma membrane and once inside the muscle, the irreversible phosphorylation of d‐glucose by hexokinase to d‐glucose 6‐phosphate, defines three distinct barriers to d‐glucose transport (see review by Wasserman et al 2 ). However, because transport of d‐glucose across these three major compartments is so tightly coupled, and specific access to more internal compartments, such as the interstitial spaces and cytoplasm, is limited, determination of the step(s) in these processes that may limit the rate of d‐glucose transport has been difficult to ascertain. For some time, the transport of d‐glucose across the sarcolemma was considered the principal rate‐limiting step in d‐glucose transport. 3 , 4 However, other studies have implicated hexokinase activity in limiting d‐glucose accumulation into muscle, particularly during insulin or exercise mediated d‐glucose uptake. 5 , 6 It is clear then, that the rate‐limiting steps of d‐glucose uptake remain controversial. This has arisen because there have been fundamental problems with all previous studies that limit the reliability of measuring the rate‐limiting factors of d‐glucose transport. Thus, no study has been able to directly measure the free d‐glucose transport across plasma membrane at single muscle fibre level. This means that the control of d‐glucose uptake is inferred from modelling the flux of d‐glucose from the plasma to the cytoplasm from the gradual accumulation of a marker or analogue of d‐glucose and comparing the differences. Where more detailed examination of the kinetic properties of d‐glucose transport via glucose transport proteins (GLUTs) have been examined, these have predominately been done in studies that have exclusively used isolated cultured non‐skeletal muscle cells. 7 , 8 , 9 Thus, there have been no studies to date that have directly measured the kinetic properties of d‐glucose uptake across the plasma membrane of single muscle fibres (of known fibre type) in real time which, could resolve a number of these inherent past problems.
In the current study we describe a method for measuring the rate of d‐glucose transport across plasma membrane of single muscle fibres using isolated segments with intact surface membrane of single fast‐ and slow‐twitch skeletal muscle fibres from the rat in conjunction with a fluorescent derivative of d‐glucose at C‐2 position, 2‐NBDG (2‐(N‐(7‐nitrobenz‐2‐oxa‐1,3‐diazol‐4‐yl) amino)‐2‐deoxyglucose). Like d‐glucose, 2‐NBDG is transported across plasma membrane of mammalian cells through the same GLUTs, 8 , 10 , 11 but 2‐NBDG, like most other d‐glucose analogues, is not a precise substitute for d‐glucose with respect to various glucose transporter molecules. For example, the bulky fluorophore and increased hydrophobicity of 2‐NBDG compared with d‐glucose 12 can result in different values for the kinetic parameters for GLUT‐mediated transport of 2‐NBDG and d‐glucose. 13 Nevertheless, as shown in this study, the properties of d‐glucose transport can be deduced by comparing the effects of 2‐NBDG transport in the absence and presence of d‐glucose. Here we show that 2‐NBDG transport in muscle fibres at rest is consistent with GLUT1 being the major functional GLUT isoform for transporting 2‐NBDG and derive the kinetic parameters for d‐glucose uptake through GLUT1 in basal (non‐insulin stimulated) fast‐ and slow‐twitch muscle fibres.
2. RESULTS
2.1. 2‐NBDG uptake by FT (type II) and ST (type I) muscle fibres
In this study, we developed a novel approach for measuring the transport of 2‐NBDG (the fluorescent derivative of d‐glucose) across the surface membrane of individual muscle fibres identified as fast‐twitch (FT, type II) or slow‐twitch (ST, type I) based on their marked difference in sensitivity to Sr2+. The method (described in detail in the “Materials and methods” section) measures the transport of 2‐NBDG across the middle portion of fibre segments with undamaged surface membrane in real time and in absolute terms. Results from these 2‐NBDG measurements were then used to characterise the kinetics of 2‐NBDG and d‐glucose transport across the plasma membrane of skeletal muscle fibres in the basal state (at rest).
The standard protocol for measuring 2‐NBDG uptake across single fibre segments with intact surface membrane dissected under paraffin oil (Figure S1A) is illustrated in Figure 1A. The 1‐2 mm long segment (Figure 1B and Figure S1B) has a tether attached to one end which allows gentle manipulation of the fibre segment under oil. The fibre segment is first transferred to a shallow well filled with paraffin oil constructed on a coverslip (Figure S1C). Small droplets (≈ 0.1 µL) of base physiological solution (BPS, see “Solutions” section) with or without 50 µM 2‐NBDG are freshly injected on the bottom of the well and the central 0.2‐0.3 mm portion of the fibre segment can be shifted under a dissecting microscope between paraffin oil and the solution droplets (Figure S1B,C) by gently manipulating the tether without permitting the cut ends of the fibre to touch the solution droplets. Transport of 2‐NBDG across a fixed length of the fibre segment (≈ 0.1 mm) in the middle of the 0.2‐0.3 mm portion exposed to BPS droplets is determined from the change in fluorescent intensity measured with a fluorescence microscope when the fibre segment is in paraffin oil as described in the “Materials and methods” section.
FIGURE 1.

Schematic protocol showing the procedure for measuring 2‐NBDG uptake in single fibre segments with intact surface membrane. A. From left to right, a flow chart of the procedure employed to measure 2‐NBDG uptake in single fibre segments. The middle part (0.2‐0.3 mm) of a single fibre segment (1‐2 mm long) is first exposed to a droplet of BPS (see Solutions) for 1 min (as an equilibration period) and then the fibre segment is shifted to the paraffin oil where the background signal is measured (see first signal trace). The same region of the preparation is then exposed to a fresh droplet of BPS containing 50 µM 2‐NBDG for 1 min followed by brief wash in a fresh droplet of BPS by simply passing the middle of the fibre through the BPS droplet and the fibre segment is moved back into the oil. A second fluorescence intensity measurement is then taken which represents the signal associated with any 2‐NBDG transported into the fibre (middle signal trace). Finally, the fibre is washed for 5 min in a droplet of BPS solution, returned to the oil and a fluorescence measurement is taken again (third signal trace), which shows the extent of any 2‐NBDG remaining in the fibre after that time. Fluorescence intensity measurements are in arbitrary units (au). Arrowheads (▼) indicate the beginning of the fluorescence signal measurement and the 2s time scale refers to the recording period of the signal. B. Typical region (≈ 0.1 mm) in a single fibre segment from which the fluorescence signal is recorded. This is a fraction of the middle portion of fibre that was exposed to the droplet of BPS seen in Figure 8 A. Note: The area of exposure of the fibre to the solutions was always the same as visually determined under the microscope. Photo was captured using a digital camera attached to a dissecting microscope
As illustrated in Figure 2, 90% or more of the 2‐NBDG uptake measured after 60 s exposure to 2‐NBDG across the surface of both FT (type II) and ST (type I) fibres is suppressed in the presence of 100 µM cytochalasin B. Considering the powerful inhibitory action of cytochalasin B on the GLUT‐mediated glucose transport 14 caused by its tight binding to the cytosolic sites of the GLUTs, this result indicates that more than 90% of the 2‐NBDG uptake measured with our method is GLUT–mediated. Assuming that all GLUT‐mediated transport was blocked in the presence of 100 µM cytochalasin B, then the value of the leak rate constant β for FT (βFT) and ST (βST) fibres can be calculated from the results shown in Figure 2 using Equation: [2‐NBDG] i (t) = [2‐NBDG]o (1 – exp (‐βt)), where [2‐NBDG] i (t) is the concentration of 2‐NBDG that entered the fibre at time t (60 s) after the fibre was placed in a droplet of solution with [2‐NBDG]o = 50 µM. As shown in Figure 2, the 2‐NBDG concentration in the fibre segments, [2‐NBDG] i , rose from zero to 3.20 ± 1.13 µM in FT and 4.55 ± 1.52 µM in ST fibres after 60 s exposure to BPS containing 50 µM 2‐NBDG. The corresponding values for βFT and βST are 0.00110 ± 0.00041 s‐1 and 0.00159 ± 0.00056 s‐1 respectively (see Table 1). Note that the mean value of βFT is not statistically different from that of βST (P > .48, double‐sided T‐test).
FIGURE 2.

Effect of blocking GLUTs with cytochalasin B on 2‐NBDG uptake in single fibre segments. Fast‐ (A) and slow‐twitch (B) single fibre segments had their middle portion incubated for 60 s in a BPS droplet containing 50 µM 2‐NBDG, followed by a brief wash in a BPS droplet without 2‐NBDG (Control). Separate fast‐and slow‐twitch single fibre segments had their middle portion pre‐incubated in a BPS solution containing 100 μM cytochalasin B for 10 min and then the same portion of the fibres was incubated for a further 60s in a BPS droplet with 50 μM 2‐NBDG and cytochalasin B followed by a brief wash in BPS alone (cytochalasin B). The fluorescence signals in each fibre were corrected for a standard 50 µm diameter fibre and extracellular dye carry‐over as indicated in the “Materials and methods” section (see Equation (7)) and expressed as fibre [2‐NBDG]. Cytochalasin B significantly blocked >90% of 2‐NBBDG uptake in both fibre types. Data is presented as mean ± SEM (n). Significance was determined with a standard one‐sided T‐test. P values (‡) were <0.001
TABLE 1.
Parameters measured in single FT and ST muscle fibres
| Parameter measured | FT fibres | ST fibres | FT vs ST fibres |
|---|---|---|---|
| Leak rate constant β (s‐1) in FT (βFT) and ST (βST) fibres | βFT = 0.00110 ± 0.00041 (n = 8) | βST = 0.00159 ± 0.00056 (n = 6) | P >.48 |
| Rate constants of 2‐NBDG uptake in the absence of d‐glucose (α0 , s‐1) in FT () and ST () fibres |
= 0.053 ± 0.0024 (n = 10) 95% CI: 0.0483 ‐ 0.0577 |
= 0.031 ± 0.0021 (n = 14) 95% CI: 0.0269‐0.0351 |
> P <.001, double‐sided T‐test |
| Rate constants of 2‐NBDG uptake (s‐1) through GLUT1 in the absence of d‐glucose in FT ( ‐ βFT) and ST ( ‐βST) fibresa |
‐βFT = 0.0519 ± 0.0024 a 95% CI: 0.0472 ‐ 0.0566 |
‐β ST = 0.0294 ± 0.0022 a 95% CI: 0.0250 ‐ 0.0337 |
( ‐ βFT)/( ‐ βST) c = 1.76 ± 0.15 b 95% CI: 1.47 −2.05 b |
|
Rate constants of 2‐NBDG uptake in the presence of 20 mM d‐glucose (αGlu, s‐1) in FT () and ST () fibres |
= 0.0082 ± 0.0004 s‐1 (n = 5) 95% CI: 0.00742 ‐ 0.00898 s‐1 |
= 0.0056 ± 0.0002 s‐1 (n = 7) 95% CI: 0.00521 ‐ 0.00599 s‐1 |
> P <.0005, double‐sided T‐test |
|
Rate constants of 2‐NBDG uptake (s‐1) through GLUT1 in the presence of 20 mM d‐glucose in FT ( ‐βFT) and ST ( ‐ β ST ) fibres a |
‐βFT= 0.0071 ± 0.00057 a 95% CI: 0.00598 ‐ 0.00822 |
‐ β ST = 0.0041 ± 0.000594 a 95% CI: 0.00293 ‐ 0.00526 |
( ‐βFT)/( ‐ β ST ) d = 1.73 ± 0.29 b 95% CI: 1.16‐2.30 |
| Ratio of rate constants of 2‐NBDG uptake through GLUT1 in the absence and presence of 20 mM d‐glucose (R = (α0 ‐ β)/(αGlu ‐ β) b ) in FT (R FT) and ST (R ST) fibres |
R FT =7.31 ± 0.68 b 95% CI: 5.98‐8.64 |
R ST =7.33 ± 1.21 b 95% CI: 4.96‐9.70 |
R FT ≈ R ST e |
The SEMS of sum/difference of two independent random variables x, y was calculated according to the following expression: SEMS = (SEx 2+ SEy 2)1/2, where SEx 2 and SEy 2 are squared standard errors for x and y.
The SEMR of ratio y/x of two independent random variables was calculated according to the following expression: SEMR = (SEy 2+(y2/x2)SEx 2) 1 / 2 /x, where x, y are mean values and SEx 2 and SEy 2 are squared standard errors for x and y (Dunlap and Silver, 1986). 50
(‐βFT)/(‐ βST) > 1, P <.0001, T‐test.
(‐βFT)/(‐βST) > 1, P <.016, T‐test.
R FT ≈ R ST denotes that K’1 in ST fibres (K’ 1 ST) ≈ K’1 in FT fibres (K’ 1 FT) (see text).
An important advantage for using 50 µM 2‐NBDG to measure GLUT‐mediated uptake in muscle fibres is that little 2‐NBDG becomes phosphorylated (at C6) over 1 min or so. As shown in Figure 1A, effectively all 2‐NBDG that entered the muscle fibre during the 60 s exposure to 2‐NBDG came out after wash (5 min) in a fresh BPS droplet, indicating that little 2‐NBDG becomes phosphorylated over this period of time, because when phosphorylated at C6, 2‐NBDG cannot cross the plasma membrane and becomes trapped in the fibre, similar to d‐glucose‐6‐phosphate. Mean data for the rate of increase in the amount of 2‐NBDG that could not be washed out from the fibres, due to phosphorylation, when loading in the presence of 50 µM 2‐NBDG for up to 30 min was 0.311 ± 0.014 (n = 5) and 0.403 ± 0.023 (n = 7) μM/min for FT and ST fibres respectively. The mean value for FT was significantly smaller than that for ST fibres (P < .05; unpaired, double‐sided T test).
Insulin treatment (20 UL‐1) of the central portion of single muscle fibre segments with undamaged surface membrane for 15 min significantly increased (one‐sided T‐tests) the amount of 2‐NBDG uptake after 10 s exposure to 50 μM 2‐NBDG from 15.12 ± 1.41 (9) to 18.6 ± 1.28 (10) μM 2‐NBDG (P < .04) in FT fibres and from 12.23 ± 1.14 (9) to 19.56 ± 2.05 (8) μM 2‐NBDG (P < .003) in ST fibres (Figure 3).
FIGURE 3.

Effect of Insulin on 2‐NBDG uptake in single fast‐ and slow‐twitch fibre segments. Single fast‐twitch fibre segments (A) and slow‐twitch fibre segments (B) had their middle portion initially incubated for 15 min at room temperature either in a droplet of BPS (Control) or BPS +20 Ul‐1 insulin (Insulin). The fibre segments had their middle portion then loaded with 2‐NBDG for 10 s in a BPS droplet with 50 μM 2‐NBDG followed by a brief wash in BPS alone. Data is shown as the mean ± SEM (n). Significance was determined using T‐test (one‐sided) with P values being <0.04 (*) and <0.003 (†) respectively
2.2. 2‐NBDG transport in muscle fibres at rest is asymmetric
The initial rates of 2‐NBDG uptake (V iU) and outflow (ViO ) were measured in a group of three FT fibre segments with intact surface membranes under trans‐zero (with 50 µM 2‐NBDG in the loading solution) and cis‐zero conditions after the fibre segments were first loaded in the presence of 50 µM 2‐NBDG for 60 s respectively. The value of V iU was determined from changes in intracellular 2‐NBDG concentration after the intact fibre segments, devoid of 2‐NBDG, were placed in a BPS droplet with 50 µM 2‐NBDG for 3 s. Conversely, the value of ViO was determined after the same fibre segments that had been first fully loaded in the presence of 50 µM 2‐NBDG, were placed for 3 s in a BPS droplet without 2‐NBDG. (Note that 3s was the shortest time interval that could be measured reproducibly, while handling a fibre segment.)
The measured values of V iO and V iU were −11.6 ± 0.3 µM 2‐NBDG s‐1; 95% CI (−12.19 to −11.01 µM 2‐NBDG s‐1) and 4.2 ± 0.3 µM 2‐NBDG s‐1; 95% CI (3.61‐4.79 µM 2‐NBDG s‐1) respectively. After correction for the very small, non‐GLUT mediated leak of 2‐NBDG into and out of the fibres (≈ 50 µM × βFT = 50 µM × 0.0011 s‐1 = 0.055 µM 2‐NBDG s‐1) during the short measurement period, the values of V iO and V iU had hardly changed to V iO = −11.545 ± 0.299 µM 2‐NBDG s‐1 and V iU = 4.145 ± 0.296 µM 2‐NBDG s‐1. The ratio Ri between the corrected magnitudes of the initial rates of outflow and uptake (Ri = |V iO|/V iU) was 2.785 ± 0.212 (95% CI 2.37‐3.20) and was significantly greater than 1 (P < .0001, double‐sided T‐test), indicating that the 2‐NBDG transport across the plasma membrane of muscle fibres at rest is highly asymmetric.
2.3. Determination of the rate of 2‐NBDG uptake in FT and ST fibres in the absence of d‐glucose
The time course of 2‐NBDG uptake in fibre segments with intact surface membrane was measured using a variation of the standard protocol described in Figure 1. In this case, the middle portion (0.2‐0.3 mm) of a freshly dissected fibre segment of diameter D and 1‐2 mm length, was first exposed to a fresh BPS droplet (≈ 0.1 µL) and then the background noise, B, was measured after the fibre segment was moved under paraffin oil. The middle portion of the fibre segment was then exposed for 3 s to a fresh BPS droplet containing 50 μM 2‐NBDG, briefly washed in a droplet of BPS and then the fluorescence signal was recorded after the fibre segment was moved back under oil. The middle portion of the fibre segment was then again exposed to a fresh droplet of standard BPS containing 50 μM 2‐NBDG for an additional length of time and so on until fibres were exposed 4 more times to 50 μM 2‐NBDG for a total of 153 s (3 + 15 + 25 + 50 + 60 s). In this way, the time‐dependent uptake of 2‐NBDG could be determined using Equation (7) and the results are shown in Figure 4A (see also Figure S2). The 2‐NBDG uptake was 11 ± 1.4 and 9 ± 1.2 µM in FT and ST fibres, respectively, after 3 s loading in BPS with 50 µM 2‐NBDG and after 153 s, the 2‐NBDG uptake effectively reached a steady state level close to 45.2 ± 3.2 and 45.2 ± 2.4 μM (90.4% of 50 μM [2‐NBDG] in the loading solution) in FT and ST fibres respectively.
FIGURE 4.

2‐NBDG uptake in skinned and intact single fast‐ and slow‐twitch fibre segments. A. Single skinned and intact fibre segments had their middle portion incubated in the presence of 50 µM 2‐NBDG for increasing times until steady‐state uptake was observed (153s) as described in the text. Fluorescence intensity measurements normalised to a standard 50 µm fibre diameter and expressed as fibre [2‐NBDG] as indicated in the “Materials and methods” section (see Equation (7) and (10) for intact and skinned fibre segments respectively) are shown as Means ± SEM. Sample sizes for consecutive timepoints are as follows: skinned fast‐twitch fibres (▲, n = 6, 5, 6, 6, 6); skinned slow‐twitch fibres ( , n = 6, 6, 6, 6, 6); intact fast‐twitch fibres (■, n = 10, 10, 10, 8, 10); intact slow‐twitch fibres (
 , n = 14, 14, 14, 14, 14). The rate of 2‐NBDG accumulation was almost identical in skinned fast‐ and slow‐twitch fibre segments. A two‐phase exponential (67% fast (time constant 0.72 s‐1), 33% slow (time constant 0.06 s‐1)) best fitted the skinned fibre data points. By comparison, the rate of 2‐NBDG accumulation was slower for both intact fast‐ and slow‐twitch fibre segments compared to skinned fibres. Intact fibre segment data were fitted using a single‐phase exponential ([2‐NBDG]
i
(t) = [2‐NBDG]o (1 – exp (‐αo
t))) using the mean values of the rate constant αo
derived from the plots in panel B; see text. B. Semilogarithmic plot of intact fibre data from A vs time (Y‐axis: Ln (1 ‐ [2‐NBDG]
i
(t)/[2‐NBDG]o) for values [2‐NBDG]
i
(t)/[2‐NBDG]o < 0.8, see text). The values of the rate constant αo
for fast‐ and slow‐twitch fibres were obtained from the slopes of the lines that best fitted the data points by linear regression: αo = 0.053 ± 0.0024 s‐1 (10) for fast‐twitch fibres (■) and 0.031 ± 0.0021 s‐1 (14) for slow‐twitch fibres (
, n = 14, 14, 14, 14, 14). The rate of 2‐NBDG accumulation was almost identical in skinned fast‐ and slow‐twitch fibre segments. A two‐phase exponential (67% fast (time constant 0.72 s‐1), 33% slow (time constant 0.06 s‐1)) best fitted the skinned fibre data points. By comparison, the rate of 2‐NBDG accumulation was slower for both intact fast‐ and slow‐twitch fibre segments compared to skinned fibres. Intact fibre segment data were fitted using a single‐phase exponential ([2‐NBDG]
i
(t) = [2‐NBDG]o (1 – exp (‐αo
t))) using the mean values of the rate constant αo
derived from the plots in panel B; see text. B. Semilogarithmic plot of intact fibre data from A vs time (Y‐axis: Ln (1 ‐ [2‐NBDG]
i
(t)/[2‐NBDG]o) for values [2‐NBDG]
i
(t)/[2‐NBDG]o < 0.8, see text). The values of the rate constant αo
for fast‐ and slow‐twitch fibres were obtained from the slopes of the lines that best fitted the data points by linear regression: αo = 0.053 ± 0.0024 s‐1 (10) for fast‐twitch fibres (■) and 0.031 ± 0.0021 s‐1 (14) for slow‐twitch fibres ( ); values are significantly different (P <.0001; double‐sided T‐test)
The time course of 2‐NBDG uptake, [2‐NBDG] i (t), appears to follow an exponential plateau equation [2‐NBDG] i (t) = [2‐NBDG]o (1–exp (−αo t)), where [2‐NBDG]o is the plateau value and αo is the rate constant. The rate constant can be determined from the semilogarithmic plot of ln (1‐[2‐NBDG]i(t)/[2‐NBDG]o) vs t as shown in Figure 4B. The data points for both FT and ST fibres in Figure 4B are well fitted by straight lines with slope values of 0.053 ± 0.0024 and 0.031 ± 0.0021 s‐1 which correspond to the rate constants for 2‐NBDG uptake in FT and ST fibres respectively. The rate constant for FT fibres is 71% greater in FT than in ST fibres (P < .001, double‐sided T‐test). The solid curves in Figure 4A were drawn using the average rate constants obtained from Figure 4B. The values of the rate constants αo and αo – β for FT and ST fibres are presented in Table 1.
Parallel experiments were conducted with skinned muscle fibres from which all cellular membranes were removed by Triton‐X 100 treatment (see protocol for using skinned fibres in the “Materials and methods” section) to understand how much faster 2‐NBDG accumulates by simple radial diffusion in fibre segments devoid of a plasma membrane compared with fibre segments with intact surface membrane. After skinning, the fibre segment was washed in a relatively large MMS droplet (1 µL) and then moved under oil, where the background level, B, was measured. Thereafter, the skinned fibre segment was repeatedly transferred between an MMS droplet (1 µL) with 50 μM 2‐NBDG and paraffin oil, where the fluorescence intensity was measured after each exposure to 50 μM 2‐NBDG using the same protocol as for the fibre segments that had intact surface membrane up to a total of 153s (3 + 15 + 25 + 50 + 60 s). The diffusion of 2‐NBDG into skinned fibres (Figure 4A, green trace; see also Figure S2) was then determined from the fluorescent measurements using Equation (10). The results show that the radial diffusion of 2‐NBDG into FT and ST skinned fibres is considerably faster than the 2‐NBDG uptake across the surface membrane of fibre segments with intact surface membrane of same type. If correction is made for the increase in the fibre diameter after skinning by a factor of 1.185 (see “Materials and methods” section), which would slow diffusion by a factor of (1.185)2 = 1.40, then the time course of 2‐NBDG diffusion into skinned fibres would be 1.40‐fold faster than shown in Figure 4A. The maximum [2‐NBDG] in the FT and ST skinned fibres was 47.5 ± 1.9 and 48.5 ± 2.9 µM, respectively, indicating that little 2‐NBDG binds to the proteins forming the contractile apparatus in muscle, which is not removed by Triton‐X‐100. The slightly larger average [2‐NBDG] at steady‐state in skinned fibres (47.5‐48.5 μM) than in “intact” fibre segments (45.2 μM) can be fully explained by the presence of membrane‐bound organelles in “intact” fibre segments compared with Triton‐X‐100 treated fibres, where all membrane‐bound organelles are removed as discussed by Fryer and Stephenson. 15 The presence of membrane‐bound organelles, where 2‐NBDG cannot diffuse, would reduce the 2‐NBDG fluorescence signal from a given illuminated volume for same free 2‐NBDG concentration in “intact” fibre segment compared with the skinned fibre.
Taken together, the results in Figure 4 indicate that the rates of 2‐NBDG uptake in both FT and ST fibres are rather fast at the level of single muscle fibres, achieving equilibration between the [2‐NBDG] in the fibre and the [2‐NBDG] in the external environment within about 150 s when the extracellular 2‐NBDG concentration is 50 µM.
As shown in Figure 5, the 2‐NBDG uptake after 3 s or 93 s is not sensitive to extracellular [Ca2+] < 1.5 mM in either FT or ST fibres. The BPS solutions in these experiments contained either 2 mM EGTA (0 Ca‐BPS) or 1.5 mM CaCl2 (1.5 mM Ca‐BPS). In addition, the 0 Ca‐BPS and 1.5 mM Ca‐BPS used with FT fibres contained 1 mM BTS (N‐benzyl‐p‐toluene sulphonamide) to prevent cross‐bridge formation and development of slow contractures during measurements in FT, 16 while the 0 Ca‐BPS and 1.5 mM Ca‐BPS used with ST fibres contained 20 mM BDM (2,3‐butanedione monoxime), which prevented contractures to occur during measurements in ST fibres. 17
FIGURE 5.

2‐NBDG uptake in FT and ST fibre segments with intact surface membrane is not sensitive to extracellular [Ca2+] < 1.5 mM. 2‐NBDG uptake in single fast‐twitch (A) and slow‐twitch (B) fibre segments that had their middle portion incubated for 3 and 93 s in a droplet of either 0Ca‐BPS or 1.5 mMCa‐BPS solutions with 50 µM 2‐NBDG followed by a brief wash in the respective 0Ca‐BPS or 1.5 mMCa‐BPS without 2‐NBDG (see text). The 0Ca‐BPS and 1.5mMCa‐BPS solutions used with FT fibres and ST fibres also contained 1 mM BTS (N‐benzyl‐p‐toluene sulphonamide) for FT fibres (A) or 20 mM BDM (2,3‐butanedione monoxime), respectively, to prevent movement during measurements. There are no statistically significant differences between the 0 Ca2+ and 1.5 mM Ca2+ results for either FT or ST fibres (P >.5)
2.4. Determination of the rate of 2‐NBDG uptake in single fibres in the presence of extracellular d‐glucose
Figure 6A (see also Figure S3) shows the mean data for experiments examining the time course of 50 μM 2‐NBDG uptake in the presence of 20 mM extracellular d‐glucose. As expected, the rate of 2‐NBDG uptake is greatly reduced in both FT and ST fibres in the presence of 20 mM d‐glucose than in the absence of d‐glucose, validating the fact that most 2‐NBDG and d‐glucose transport in our experiments takes place via GLUTs. The time course of 2‐NBDG uptake in the presence of 20 mM d‐glucose, also follows an exponential plateau equation of type [2‐NBDG]i(t) = [2‐NBDG]o (1 – exp (‐αGlu t)), where αGlu is the rate constant. The semilogarithmic plots of Ln (1 – [2‐NBDG] i (t)/[2‐NBDG]o) vs t for FT and ST fibres shown in Figure 6B, yielded 0.0082 ± 0.0004 s‐1 and 0.0056 ± 0.0002 s for the rate constants associated with the FT and ST fibres respectively. The rate constant for 2‐NBDG uptake in the presence of 20 mM d‐glucose is significantly smaller in ST than in FT fibres (P < .0006). The solid curves in Figure 6A were drawn using the average rate constants obtained from Figure 6B. The values of the rate constants αGlu and αGlu – β together with the values of the ratio Ri = (αo–β)/(αGlu–β) for FT and ST fibres are presented in Table 1.
FIGURE 6.

2‐NBDG uptake in intact single fast‐ and slow‐twitch fibre segments in the presence of 20 mM extracellular d‐glucose. A. Intact fibre segments were incubated in the presence of 50 µM 2‐NBDG and 20 mM extracellular d‐glucose for increasing times up to 153 s using the same protocol as that used for 2‐NBDG uptake in the absence of d‐glucose (Figure 4). Fluorescence intensity measurements normalised to a standard 50 µm fibre diameter and corrected for extracellular dye carry‐over (see Equation (7) in the “Materials and methods” section) are expressed as Means ± SEM of fibre [2‐NBDG]. Sample sizes for consecutive timepoints are as follows: Fast‐ (■) and slow‐twitch fibres ( ) (n = 5 and 7, respectively, for all time points). The rates of 2‐NBDG uptake in the presence of 20 mM d‐glucose were slower for both fast‐ and slow‐twitch fibre segments compared to the rates obtained in the absence of extracellular d‐glucose (fitted curves from Figure 4 A are shown for comparison). The data points were fitted by single‐phase exponentials ([2‐NBDG]i(t) = [2‐NBDG]o
(1 – exp (‐αGlu
t))) using the mean values of the rate constant αGlu derived from the plots in panel B; see text. B. Semilogarithmic plot of fibre data from A vs time (Y‐axis: Ln (1 ‐ [2‐NBDG]i(t)/[2‐NBDG]o
), see text). The values of the rate constant αGlu for fast‐ and slow‐twitch fibres were obtained from the slopes of the lines that best fitted the data points by linear regression: αGlu = 0.0082 ± 0.0004 s‐1 (5) for fast‐twitch fibres (■) and 0.0056 ± 0.0002 s‐1 (7) for slow‐twitch fibres (
) (n = 5 and 7, respectively, for all time points). The rates of 2‐NBDG uptake in the presence of 20 mM d‐glucose were slower for both fast‐ and slow‐twitch fibre segments compared to the rates obtained in the absence of extracellular d‐glucose (fitted curves from Figure 4 A are shown for comparison). The data points were fitted by single‐phase exponentials ([2‐NBDG]i(t) = [2‐NBDG]o
(1 – exp (‐αGlu
t))) using the mean values of the rate constant αGlu derived from the plots in panel B; see text. B. Semilogarithmic plot of fibre data from A vs time (Y‐axis: Ln (1 ‐ [2‐NBDG]i(t)/[2‐NBDG]o
), see text). The values of the rate constant αGlu for fast‐ and slow‐twitch fibres were obtained from the slopes of the lines that best fitted the data points by linear regression: αGlu = 0.0082 ± 0.0004 s‐1 (5) for fast‐twitch fibres (■) and 0.0056 ± 0.0002 s‐1 (7) for slow‐twitch fibres ( ) ; values are significantly different (P <.0005 double‐sided T‐test)
2.5. 2‐NBDG transport in FT and ST muscle fibres at rest occurs predominantly through GLUT1
The almost complete block of 2‐NBDG uptake by cytochalasin B across the surface membrane of both FT and ST fibre segments (Figure 4) and the marked reduction of the 2‐NBDG uptake rate in both FT and ST fibre segments by 20 mM d‐glucose (Figure 6) show that the 2‐NBDG uptake in our experiments is GLUT‐mediated. Furthermore, the observation that the 2‐NBDG transport across the plasma membrane of rested muscle fibres is highly asymmetric showing a 2.785 (± 0.212)‐fold greater initial rate of 2‐NBDG outflow than initial rate of 2‐NBDG uptake, indicates that the transport of 2‐NBDG under our conditions, is mainly mediated by GLUT1 isoform. This is because the only GLUT isoform in mammals that displays such asymmetry is GLUT1. The GLUT1 transport asymmetry arises from the fact that GLUT1 displays about a 10‐fold greater affinity (10‐fold lower dissociation constant) for d‐glucose on the extracellular (import) side than on the cytosolic (export) side of the membrane. 18 , 19 , 20 , 21
In addition to GLUT1, the plasma membrane of rat skeletal muscle at rest also contains the GLUT4 isoform at a molar ratio of GLUT1:GLUT4 polypeptides in the range 0.6‐1.0. 22 GLUT4 is a symmetrical transporter that plays the major role in d‐glucose uptake during activity (exercise) and/or following Insulin stimulation. 23 , 24 , 25 In skeletal muscle, GLUT4 is mainly located in intracellular compartments and is translocated to the plasma membrane (predominately in the tubular system) in response to insulin 26 and/or muscle contraction. 27 , 28 , 29 In contrast, GLUT1 concentration in the plasma membrane does not change remarkably in response to insulin or any other stimuli associated with skeletal muscle activity. 23 , 30 The relative contribution to the overall d‐glucose (or d‐glucose analogue) uptake by GLUT1 compared with that of GLUT4 can be different from the molar ratio GLUT1:GLUT4 in the plasma membrane because the rate of uptake is also proportional to the dissociation rate constant of the d‐glucose, or d‐glucose analogue from the external (import) binding site of the respective transporter and depends on the actual concentration of the transported molecule and its dissociation constant from the external binding site of the transporter. In this context, it is important to note that the apparent Km for d‐glucose uptake via GLUT4 (12.6 mM) is severalfold greater than that through GLUT1 (0.7‐3.2 mM). 31
One can estimate the ratio of GLUT1 2‐NBDG uptake rate: GLUT4 2‐NBDG uptake rate in our study by comparing the results of 2‐NBDG uptake by ST and FT fibres in the presence of 50 µM 2‐NBDG before and after treatment with insulin (20 UL‐1), with the results of 2‐deoxyglucose (2‐DG) uptake obtained by Henriksen et al 24 on rat soleus and EDL muscles in the presence of 1 mM 2‐DG before and after treatment with insulin (2 UL‐1), where the uptake appears to be predominantly through GLUT4. 22 Insulin causes an increase in the GLUT4 concentration in the plasma membrane, without altering the concentration of GLUT1, such that any increase in d‐glucose, or d‐glucose analogue uptake after insulin treatment must be GLUT4‐mediated. The insulin‐dependent, GLUT4‐mediated 2‐DG uptake in the EDL muscle in the study of Henriksen et al 24 was fivefold greater than the predominantly GLUT4‐mediated 2‐DG uptake without insulin treatment. Considering that some 2‐DG uptake in the absence of insulin would have also occurred through GLUT1, it follows that the insulin‐dependent, GLUT4‐mediated 2‐DG uptake in the EDL muscle in the study of Henriksen et al 24 was at least fivefold greater than the GLUT4‐mediated 2‐DG uptake without insulin treatment. Since the insulin‐dependent, GLUT4‐mediated 2‐NBDG uptake in the (FT) EDL fibres in our study was 23% of 2‐NBDG uptake without insulin treatment (Figure 3A), it means that the GLUT4‐mediated 2‐NBDG uptake without insulin treatment in our study was less than 4.6% (23%/5) of the 2‐NBDG uptake without insulin treatment. Consequently, more than 95.4% of the 2‐NBDG uptake in FT fibres occurred via GLUT1 and ratio of GLUT1 2‐NBDG uptake: GLUT4 2‐NBDG uptake at rest is >20.7 (95.4% : 4.6%).
For the soleus muscle, the insulin‐dependent, GLUT4‐mediated 2‐DG uptake in the study of Henriksen et al 24 was at least sixfold greater than the GLUT4‐mediated uptake in the absence of insulin, while the insulin‐dependent, GLUT4‐mediated 2‐NBDG uptake in the (ST) fibres in our study after insulin treatment was effectively the same as the 2‐NBDG uptake before insulin treatment (Figure 3B). Following the same rationale as for the EDL muscle fibres, the GLUT4‐mediated 2‐NBDG uptake in the soleus (ST) fibres without insulin treatment in our study was <10% (60%/6) of the 2‐NBDG uptake without insulin treatment. Consequently, more than 90% of the 2‐NBDG uptake in ST fibres occurred via GLUT1 and the ratio of GLUT1 2‐NBDG uptake: GLUT4 2‐NBDG uptake in the ST fibres at rest is >10.0 (90% : 10%).
Understanding that most of the 2‐NBDG uptake in our experiments likely occurs via the GLUT1 isoform offers the opportunity to derive the kinetic parameters that characterise the transport of 2‐NBDG and d‐glucose through GLUT1 across the plasma membrane of FT and ST skeletal muscle fibres. GLUT1 is the most intensely studied GLUT isoform and the fixed asymmetrical site model of d‐glucose transporters is the simplest kinetics model for d‐glucose transport that circumvents fundamental thermodynamic inconsistencies associated with the alternating access transport model (see Naftalin, 2018). 21 The main feature of this model is the presence of an intermediate pool for d‐glucose within a centrally located cavity of the transporter between the fixed high d‐glucose affinity binding sites on the outside and the fixed low‐affinity d‐glucose binding sites on the inside of the GLUT1 molecule as illustrated in Figure 7. The intermediate pool allows d‐glucose to equilibrate between the two types of fixed binding sites on the opposite sides of the transporter, such that the central pool contains a lower d‐glucose concentration during net d‐glucose influx than during net d‐glucose efflux, when the extracellular and cytosolic concentrations of d‐glucose are reversed. This is because the d‐glucose dissociation rate from the higher affinity sites on the outside must be lower than the d‐glucose dissociation rate from the lower affinity sites on the inside, considering that the d‐glucose affinity site on the extracellular site is 10‐fold greater than on the cytosolic site and that the association rates of d‐glucose to the low and high‐affinity sites are probably diffusion‐limited, 21 and therefore similar. This asymmetry translates into the observed asymmetric magnitude between net d‐glucose influx and d‐glucose efflux when the extracellular and intracellular concentrations are reversed and explains the much larger maximal rates of equilibrium exchange for d‐glucose than the maximal rate of net d‐glucose influx. 19 , 32 For simplicity, the fixed site model in Figure 7 also considers that the d‐glucose binding sites on the transporter are in faster equilibrium with the d‐glucose concentration in the “outside” and the “inside” solution/medium than with the d‐glucose concentration in the intermediate pool.
FIGURE 7.

Diagram of the fixed asymmetrical site model of a d‐glucose transporter (GLUT1). The transporter displays about a 10‐fold greater affinity sites for d‐glucose on the extracellular (cis) side (So ) than on the cytosolic (trans) side (Si ). An intermediate pool for d‐glucose within a centrally located cavity of the transporter between the fixed high and low‐affinity binding sites for d‐glucose allows the d‐glucose concentration in the pool (Gpool ) to equilibrate rapidly to an intermediate value between the d‐glucose concentrations inside (Gi ) and outside (Go ). The rate constants k 1 and k 2 are the dissociation rates of d‐glucose from the high affinity and low‐affinity sites, respectively, and k ‐1, k‐ 2 are the binding rates of d‐glucose to the high and low‐affinity sites respectively. Since k ‐1, k ‐2 are similar in value approaching the d‐glucose diffusion‐limited binding rate of d‐glucose, it follows that k 2 ≈ 10 k 1 . (Note: the thickness of the arrows represents the relative magnitude of the rate constants). In its simplest form, the fixed asymmetrical site model considers that the d‐glucose binding sites on the transporter are in faster equilibrium with the d‐glucose concentration in solution than with the d‐glucose concentration in the intermediate pool. Since in this diagram Go > Gi , there is a net influx of d‐glucose
The Theory section in Supplemental materials shows how the fixed site model for 2‐NBDG and d‐glucose transport through GLUT1 in Figure 7 was used to derive the kinetic parameters that describe 2‐NBDG and d‐glucose transport through GLUT1 at rest shown in Table 2 from the experimental data in this study. Importantly, the data in Table 2 show that the dissociation constants of 2‐NBDG and d‐glucose from the GLUT1 sites and the Michaelis–Menten constants are not different in FT and ST fibres, but that the maximum rates of 2‐NBDG and d‐glucose uptake and outflow are significantly greater in FT in ST fibres due to the higher concentration of functional GLUT1 in FT fibres than in ST fibres.
TABLE 2.
Kinetic parameters for 2‐NBDG and d‐glucose transport in the basal state of FT and ST muscle fibres derived from the experimentally measured data in Table 1, a
| Parameter | FT fibres | ST fibres |
|---|---|---|
| 2‐NBDG dissociation constant of external GLUT1 binding sites (K’ 1, µM) |
10.1 95% CI: 7.7‐13.9 |
10.1 95% CI: 7.7‐13.9 |
| 2‐NBDG dissociation constant of internal GLUT1 binding sites (K’ 2 = 10 K’1 , µM) |
101 95% CI: 77‐ 139 |
101 95% CI: 77‐ 139 |
| Maximum rate of 2‐NBDG uptake (V' maxU, µM s‐1) |
3.64 b 95% CI: 3.09‐4.40 |
2.06 b 95% CI: 1.64‐2.62 |
| Maximum rate of 2‐NBDG outflow (V' maxO =10 V' maxU, µM s‐1) |
36.4 b 95% CI: 30.9‐ 44.0 |
20.6 b 95% CI: 16.4‐26.2 |
| Michaelis‐Menten constant 2‐NBDG uptake (K’ mU =2 K’ 1, µM) |
20.2 95% CI: 15.4‐27.8 |
20.2 95% CI: 15.4‐27.8 |
| Michaelis‐Menten constant for 2‐NBDG outflow (K’ mO =2 K’ 2, µM) |
202 95% CI: 154‐278 |
202 95% CI: 154‐278 |
| d‐glucose dissociation constant of external GLUT1 binding sites (K 1, mM) |
0.456 95% CI: 0.31‐0.72 |
0.455 95% CI: 0.27‐0.90 |
| d‐glucose dissociation constant of internal GLUT1 binding sites (K 2 = 10 K 1, mM) |
4.56 95% CI: 3.1‐7.2 |
4.55 95% CI: 2.7‐9.0 |
| Maximum rate of d‐glucose uptake (V maxU, mM s‐1) |
0.213 95% CI: 0.09‐0.53 |
0.121 95% CI: 0.041‐ 0.40 |
| Maximum rate of d‐glucose outflow (V maxO =10 V maxU, mM s‐1) |
2.13 95% CI: 0.78‐6.1 |
1.21 95% CI: 0.41‐ 4.0 |
| Michaelis‐Menten constant for d‐glucose uptake (K mU =2 K 1, mM) |
0.91 95% CI: 0.62 −1.44 |
0.91 95% CI: 0.54 −1.80 |
| Michaelis‐Menten constant for d‐glucose outflow (K mO =2 K 2, mM) |
9.1 95% CI: 6.2 −14.4 |
9.1 95% CI: 5.4 −18.0 |
For explanation on how the values and the 95% CI were calculated for K’1, V'maxU, K 1 and V maxU see Derivation of the kinetic parameters for 2‐NBDG and d‐glucose transport across the plasma membrane of FT and ST fibres at rest jn the Theory section of the Supplemental materials.
Values for FT fibres are significantly different from those for ST fibres (P < .05).
3. DISCUSSION
Results obtained in this study provide compelling evidence that the use of 2‐NBDG in conjunction with the new technique described in this paper can give deeper insights into the mechanism of GLUT‐dependent d‐glucose transport at single mammalian muscle fibre level. Thus, there is strong evidence that under our conditions, the 2‐NBDG transport in the resting skeletal muscle fibres occurs predominantly through the GLUT1 isoform and that the concentration of GLUT1 is about 75% greater in FT than ST fibres (see Derivation of the kinetic parameters for 2‐NBDG and d‐glucose transport across the plasma membrane of FT and ST fibres at rest in the Theory section of the Supplemental materials). An important advantage for using 2‐NBDG as a d‐glucose analogue to study d‐glucose transport in muscle fibres is that 2‐NBDG does not become quickly trapped inside the fibre after it is transported across the plasma membrane. This allows unimpeded transport of 2‐NBDG in both directions across the plasma membrane for up to several minutes and separation of the actual transport process of free 2‐NBDG, which is fast, from latter processes that entrap the 2‐NBDG molecules following phosphorylation at C6. The quantitative analysis of the results allowed derivation of the kinetic parameters that characterise 2‐NBDG and d‐glucose transport across the plasma membrane of FT and ST mammalian muscle fibres at rest for different sets of conditions.
It is important to point out that the technique described in this paper can also be used for making measurements of glucose uptake via GLUT4 after vastly increasing the GLUT4:GLUT1 ratio in the plasma membrane as we show following insulin treatment. The difference between 2‐NBDG uptake after insulin treatment and 2‐NBDG uptake before insulin treatment represents 2‐NBDG uptake via GLUT4, as we show in Figure 3.
3.1. GLUT‐mediated transport of d‐glucose analogues is much faster than the GLUT‐mediated accumulation of d‐glucose analogues in muscle fibres
Prior to this study, there are no kinetic data available on the real‐time uptake of d‐glucose or d‐glucose analogues across the surface membrane of single fast‐twitch and slow‐twitch skeletal muscle fibres. All studies so far measured the accumulation rate of the phosphorylated form of d‐glucose analogues that become trapped intracellularly and cannot be further metabolised. Therefore, the results obtained in these studies describe the combined effect of d‐glucose analogue uptake and its phosphorylation. Among these studies, there is only one study that measured the rate of deoxyglucose (2‐DG) accumulation in the phosphorylated form (2‐DG‐6P) in individual fast‐twitch fibres after 1 hour incubation of the epitrochlearis muscle from the rat in the presence of tritiated 2‐DG (MacKrell and Cartee, 2012). 33 The 2‐DG molecules that are transported by GLUTs into the fibres are widely believed to be rapidly phosphorylated by hexokinase to 2‐DG‐6P and remain trapped in this form intracellularly because the 2‐DG‐6P molecules cannot be further metabolised. 33 The accumulated 2‐DG‐6P after 1 h incubation was measured in individual fibres that were first isolated by collagenase treatment and then typed with respect to their fast‐twitch myosin heavy chain (MHC) isoform profile.
In our study, we have directly measured the uptake of the non‐phosphorylated form of 2‐NBDG, the fluorescent derivative of 2‐DG and d‐glucose, in the absence and presence of 20 mM d‐glucose, which allowed us to measure for the very first time the rate of 2‐NBDG transport by GLUT1 in single fast‐twitch (type II) and slow‐twitch (type I) fibre segments of the rat EDL and soleus muscles, respectively, and ascertain for the first time the kinetic parameters which characterise d‐glucose transport at the level of single muscle fibres of known type (see below). In comparing our results on single fast‐twitch fibres (type II) with those of MacKrell and Cartee, 33 it is important to note that all fibres in the study of MacKrell and Cartee 33 were of FT‐type, expressing only FT‐ MHC isoforms. In our study, all FT fibres were obtained from EDL fibres of the Long Evans‐hooded rats, which only express type IIB and IIX (IID) MHCs. 34 The average rate of 2‐DG‐6P accumulation by resting muscle fibres that expressed type IIB and IIX (IID) MHC isoforms when incubated for 1 h at 35 ͦC in the presence of 1 mM tritiated 2‐DG was between 0.64 and 0.86 nmol (µL fibre volume)‐1 hr‐1 in the study of MacKrell and Cartee. 33 In contrast, the average rate of 2‐NBDG transport in resting FT fibres incubated for 18 s in the presence of 50 µM 2‐NBDG at 23 ͦC was 27 µmol (L fibre volume)‐1 (18 s)‐1 (see Figure 4A), which is equivalent to 5.4 nmol 2‐NBDG (µL fibre volume)‐1 h‐1. This means that the rate of 2‐NBDG transport by the GLUTs across the plasma membrane measured in the present study in FT muscle fibres from the rat that express type IIB and IIX (IID) MHC isoforms, is some 6.3‐ to 8.4‐fold greater than the rate of 2‐DG‐6P accumulation in same type of fibres reported in the study of MacKrell and Cartee. 33 The discrepancy between our results and those of MacKrell and Cartee 33 is likely even greater if one considers that both the concentration of the d‐glucose analogue and temperature was lower in our study (50 µM 2‐NBDG and 23‐25 ͦC) than in the study of MacKrell and Cartee (1 mM 2‐DG and 35 ͦC). 33 From these results one can conclude that the transport of d‐glucose or d‐glucose analogues across the plasma membrane is not a major barrier that limits their transport into mammalian skeletal muscle in the basal (resting) state and that one cannot determine the rate of transport of d‐glucose from the accumulation rates of d‐glucose analogues in phosphorylated forms. Indeed, the rate of 2‐NBDG phosphorylation by endogenous hexokinases in muscle fibres in this study was <0.5 μM/min (0.3 μM/min in FT and 0.4 μM/min in ST; see “Results” section), which is a very small fraction of d‐glucose phosphorylation rate in muscle, where the intracellular d‐glucose concentration is kept low by high hexokinase activity. 35
3.2. Kinetics of 2‐NBDG and d‐glucose transport in basal state of FT and ST muscle fibres
The data shown in Table 2 indicate that 2‐NBDG binds much more tightly to and dissociates much more slowly from the d‐glucose binding sites on GLUT1 than d‐glucose in the rat skeletal muscle. Similar conclusions were reached by Jakoby et al 13 based on uptake measurements of both fluorescent analogues of d‐glucose (6‐NBDG and 2‐NBDG) and d‐glucose by murine astrocytes that express predominantly GLUT1. The estimated values of the apparent Michaelis–Menten constant for d‐glucose uptake (K mU) in single muscle fibres from this study are close to 1.0 mM for both ST and FT fibres (see Table 2) and are in the range of reported K m values for d‐glucose uptake through GLUT1 (0.3‐3.2 mM 31 ; 1.6 mM 19 ). The larger K m values (5 mM) reported on whole rat muscles (see eg Nesher et al 36 ) were based on d‐glucose concentrations applied on the surface of the whole muscle rather than around the fibres inside the muscle, where the d‐glucose concentration must have been considerably lower because d‐glucose is continuously consumed.
Using parameter values listed in Table 2, one can evaluate the basal rate of d‐glucose uptake in FT and ST muscle fibres under various resting conditions assuming that all d‐glucose transport across the plasma membrane is GLUT1‐mediated. Based on Equation (S2) and considering that k 1 C GLUT1 = V max U (see Equation (S3)), it follows that the rate of intracellular d‐glucose uptake through GLUT1 in FT ((∂Gi /∂t)FT) and ST ((∂Gi /∂t)ST) muscle fibres at rest is defined by the following expressions:
| (1) |
| (2) |
The highest rates of d‐glucose uptake occur when the intracellular d‐glucose concentration, Gi , is low (Gi « G 0) due to high hexokinase activity, which phosphorylates the d‐glucose rapidly, as it enters the muscle fibre. When G0 is in the normal range of d‐glucose concentration in the rat plasma (5.5‐6.2 mM 37 ), the maximum rate of d‐glucose uptake through GLUT1 is about 183‐186 µM s‐1 and 104 −106 µM s‐1 in FT and ST fibres at rest respectively. These values are more than sufficient to cover the energy demands of both FT and ST muscle fibres at rest. Considering that the aerobic degradation of one molecule of d‐glucose produces about 26‐28 molecules of ATP (see Butler et al 38 ), then 183‐186 and 104 −106 µM s‐1 d‐glucose would produce 4.8‐5.2 and 2.7‐3.0 mM s‐1 ATP respectively. This compares with a rate of ATP utilisation in mammalian muscles at rest that is <0.01 mM ATP s‐1 (see Butler et al 38 ).
When hexokinase activity decreases because of reduced metabolic activity, or d‐glucose uptake capacity rises because of GLUT4 translocation from intracellular compartments to the plasma membrane, the value of Gi rises and moves closer to G0 until the net rate of d‐glucose uptake, which is proportional to (G0‐Gi ), is balanced by the rate of d‐glucose phosphorylation. A prolonged rise of Gi in the mM range can be detrimental to the muscle fibre when the G0 is large, as it could cause glycation of myosin 39 and other sarcoplasmic proteins, which, in turn, would negatively impact on muscle function.
In conclusion, this study shows that (i) free d‐glucose transport kinetics can be derived from free 2‐NBDG measurements made in segments of single muscle fibres with intact surface membrane, (ii) GLUT‐mediated transport of d‐glucose analogues is much faster than the GLUT‐mediated accumulation of d‐glucose analogues in muscle fibres, (iii) the rate‐limiting step in d‐glucose uptake in skeletal muscle is not necessarily the GLUT‐mediated transport of d‐glucose, and (iv) d‐glucose uptake through GLUT1 is sufficient to cover the energy demands of both FT and ST muscle fibres in their basal state.
4. MATERIALS AND METHODS
4.1. Animals and muscle dissection
All experiments and procedures used in this study were approved by the La Trobe University Animal Ethics committee in accordance with the National Health and Medical Research Council – Guidelines to promote the wellbeing of animals used for scientific purposes. 4‐8 months old male Long‐Evans Hooded rats housed within the La Trobe University Animal House were killed by overdose isoflurane (2%, v/v) inhalation and the extensor digitorum longus (EDL) and soleus muscles on both hind legs of the rat were dissected out after no visible signs of breathing, movement or pain reflex could be seen (≈ 5 min after exposure to isoflurane). After dissection, the muscles were blotted dry on filter paper to remove attached hairs and excess extracellular fluid and, unless otherwise specified, the muscles were pinned down with entomological pins, at resting length on a layer of Sylgard (184; Dow Corning, USA) in a Petri dish filled with paraffin oil (Ajax chemicals, Sydney, Australia). The dissection procedure, from the moment of rat's death to pinning the muscles in the Petri dish took approximately 10 min to complete. During experiments and when muscles were not in use, muscles were kept cool (~ 10°C) by placing the Petri dish on an ice pack. In this way, muscles remain viable for up to 6 h of experimentation. 40
4.2. Preparation of single muscle fibre segments
Single muscle fibre segments were isolated under paraffin oil from the EDL and soleus muscles using a dissecting microscope at X4‐X40 magnification, micro‐dissecting scissors and jewellers’ forceps. Our laboratory has extensive experience dissecting segments of single skeletal muscle fibres under oil where the surface membrane is either left intact, 41 or is removed by microdissection. 40 , 42 The dissection procedure, preparation of single muscle fibre segments with intact surface membrane and experimental treatment of the fibre segments are illustrated in the Supplemental materials (Figure S1). At the end of an experiment, the fibre segment was split under oil to intentionally damage the surface barrier and then it was moved to a droplet of 6 µM [Sr2+] solution (SrS, see Solutions) to determine if the fibre was ST (type I) or FT (type II). At this [Sr2+], FT (type II) fibres fail to develop any active force and remain relaxed, while ST (type I) fibres produce near maximum (>90%) force and supercontract. 43 , 44 The different sensitivity to Sr2+ has been shown to depend on the troponin C isoform (slow or fast) expressed in the respective fibre, which in turn, is tightly correlated to the MHC isoform expressed (MHCI or MHCII) in the fibre. 43 , 45 , 46 All FT (type II) results in this study are from EDL fibres and all ST (type I) results are from soleus fibres. It is also important to note that the EDL muscles of male Long‐Evans hooded rats aged 4‐6 months were found to contain 50% type IIB, 30% type IIB/IIX(IID) and 20% type IIX(IID) fibres based on the MHC profile. 34 This means that fibres identified as FT in this study could be of type IIB, IIX(IID) or IIB/IIX(IID) but not of type IIA, while all the fibres identified as ST are type I or type I/IIA fibres.
Unless otherwise stated, all experiments were performed at room temperature (23 ± 2⁰C).
4.3. Solutions
The base external physiological solution (BPS) used in this study contained (mM): NaCl, 145; KCl, 3, MgCl2, 3.5; EGTA, 2 (to prevent slow contractures during measurements) and HEPES pH buffer, 10. The pH of the base solution was adjusted to 7.40 with NaOH and the osmolality of the base solution, measured with a Fiske osmometer, was 295 ± 5 momol/kg. When d‐glucose was added to the base solution, the concentration of NaCl was reduced to maintain the osmolality constant. Variants of BPS with 1.5 mM CaCl2 instead of 2 mM EGTA and containing membrane‐permeable compounds to prevent cross‐bridge formation and development of slow contractures during measurements showed that absence of mM Ca2+ in BPS did not affect 2‐NBDG uptake in either FT or ST fibres (see Figure 5 and related text in the “Results” section).
In some experiments, skinned fibre segments were used, where the plasma membrane barrier was deliberately removed (chemically skinned 47 ) by placing the fibre segment in a droplet of intracellular mammalian relaxing solution (MRS) with 2% Triton X‐100 for 5 min after which the fibre segment was washed in the relaxing solution without Triton X‐100 and then equilibrated in a myoplasmic mammalian solution (MMS) that mimics the normal resting myoplasmic milieu. Both solutions (MRS and MMS) are standard in our laboratory for use with skinned muscle fibres. 40 , 47 , 48 The MRS contained (mM) K+, 126; Na+, 36; Mg2+, 1 (MgTotal, 10.3); EGTA2‐, 50; MgATP, 7 (ATPTotal, 8); creatine phosphate2‐, 10; HEPES, 90. The MMS contained the same concentrations of K+, Na+, Mg2+, MgATP, creatine phosphate2‐and HEPES as the MRS, but instead of 50 mM EGTA2‐, it contained 49.95 mM HDTA2‐ (hexamethylene diamine tetraacetate) and 0.05 mM EGTA2‐. Both solutions had the same pH (7.10 ± 0.01) and osmolality (295 ± 5 momol/kg). The free [Ca2+] was <2 nM in MRS and 80 nM in MMS.
The 6 µM [Sr2+] strontium solution (SrS) used at the end of an experiment to determine whether the respective fibre was fast‐twitch (FT, type II) or slow‐twitch (ST, type I) contained (mM) K+, 126; Na+, 36; Mg2+, 1 (MgTotal, 10.0); EGTA2‐, 44; SrEGTA2‐, 6; MgATP, 7 (ATPTotal, 8); creatine phosphate2‐, 10; HEPES, 90 (pH 7.10) and had an osmolality of 295 ± 5 momol/kg.
Unless otherwise indicated, all solutions used were isotonic with respect to water movement across the fibre segments and were prepared and used at 23 ± 2⁰C.
2‐NBDG was obtained from Sigma and was prepared as a 10 mM stock solution in water and frozen in small aliquots. On the day of an experiment, 2‐NBDG was added to a fresh batch of BPS, MRS or MMS solution, as necessary.
4.4. Fluorescence intensity measurements
All fluorescence measurements were made in the dark using a Zeiss Axiovert 100 inverted epifluorescence microscope equipped with a Xenon lamp (Orion), an excitation filter (450‐480 nm), a dichroic mirror (510 nm) and an emission filter (510‐550 nm). The intensity of the emitted light was measured with a photomultiplier tube (EMI 9582) and the signal was recorded on a Linear chart recorder. Using the ×10 objective, the illuminated area on the in‐focus object from which the fluorescence signal was collected, was ~100 μm in diameter as shown in Figure 8A. The fluorescence measurements were made in the middle section of the fibre segment within seconds after the fibre segment was placed under paraffin oil on the coverslip at the bottom of the epoxy resin well as described in Figure S1C. Note that the longitudinal diffusion of dyes in muscle fibres is very slow and that it would take several minutes for the concentration of a dye to significantly decrease in the middle section of a 0.2‐0.3 mm long fibre segment due to longitudinal diffusion 49 after the fibre segment is moved under oil.
FIGURE 8.
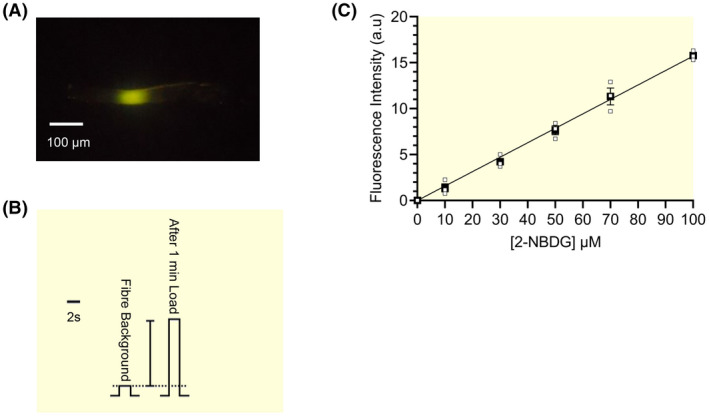
Calibration of the 2‐NBDG fluorescence signal in single intact muscle fibre segments. A. Fluorescence signal from a single FT fibre segment (65 μm diameter) which had its middle portion incubated for 60 s in a BPS droplet with 50 μM 2‐NBDG for 1 min. B. The fluorescence intensity was measured from the single FT fibre segment in A. before (background), and after loading with 2‐NBDG (1 min). The vertical bar shows the fluorescence signal minus the background signal. C. Fluorescence intensity standard curve measured in 3 single fibre segments (after subtraction of background, see B) showing the linear relationship between 2‐NBDG concentration in the loading solution and fluorescence intensity in the fibre. Fibre segments were sequentially loaded in a base physiological solution (BPS) with 10, 30, 50, 70 and 100 μM 2‐NBDG for 2 minutes and the fluorescence intensity was measured after each loading. The fluorescence intensity expressed in arbitrary units (a.u.) was measured in each fibre and was then normalised to a standard fibre segment diameter of 50 μm (see “Materials and methods” section)
Two fluorescent probes were used in this study: the d‐glucose analogue 2‐NBDG and the FITC‐Dextran (4 kDa). 2‐NBDG was employed to measure the kinetic properties of the d‐glucose analogue uptake across the surface of single muscle fibre segments, while FITC‐Dextran (4 kDa), which is membrane impermeable, was used to quantify the amount of extracellular 2‐NBDG carried by the muscle fibre segment after a brief wash in the BPS following exposure to 2‐NBDG, as described later in this section.
In all 2‐NBDG uptake experiments, we used 50 μM 2‐NBDG in the loading solutions. This [2‐NBDG] was sufficient to provide a clear fluorescence intensity signal from the fibre segments (Figure 8B) that was directly proportional to the concentration of 2‐NBDG in the loading solution (Figure 8C) and yet, was sufficiently low to permit measurement of the GLUT dissociation constants and allow the development of the theoretical framework (see Theory section in Supplemental materials) to determine the key parameters that characterise the transport of 2‐NBDG and d‐glucose across plasma membrane.
The 2‐NBDG concentration in the fibre segments was calibrated using a square glass microslide (Vitrodynamics, Rockaway, NJ, USA) with a cross‐section of 50 × 50 μm filled with the same 2‐NBDG containing solution of concentration C m to which the fibre was exposed. The microslide was placed under oil on the same coverslip next to the fibre segment using the same beam of light and microscope and photomultiplier settings for the fluorescence intensity measurements. Considering that the measured fluorescence intensity from a fibre or microslide is proportional to the amount of fluorescent dye in the light path, which in turn is proportional to the cross‐sectional area of these long and narrow structures, the average concentration C f of the dye in a fibre segment of diameter D can be determined using Equation (3), where (F f ‐B) is the fluorescence intensity measurement made on the fibre F f after the background noise B has been subtracted and (F m ‐B) is the fluorescence intensity measurement F m made on the square microslide (of cross‐sectional area CSAm = 2,500 μm2), after the background noise has been subtracted:
| (3) |
Equation (3) can be recast to express the concentration of the dye in the fibre (C f) relative to the concentration of the dye in the microslide (C m), which was the same as the concentration of the dye in the droplet to which the fibre segment was exposed:
| (4) |
Also, in order to permit comparisons to be made between fluorescence measurements on fibre segments of different diameter, the fluorescence intensity measurements (F f ‐ B) made on individual fibre segments of various diameters D were converted to fluorescence intensity for a fibre of standard diameter S = 50 μm (F S) using Equation (5) (which takes into consideration that the amount of fluorescent dye in the light path is proportional to the fibre cross‐sectional area):
| (5) |
Substituting F f – B = F S (D2/2500 μm2) from Equation (5) in Equation (4), the ratio between the concentration of the fluorescent dye in the fibre segment and that in the microslide is given by Equation (6):
| (6) |
After the middle of a fibre segment is exposed to the 2‐NBDG‐containing loading solution for a given time, the part exposed to 2‐NBDG was briefly washed in a fresh droplet of BPS by simply passing the middle of the fibre through the BPS droplet to rapidly remove most of the extracellular 2‐NBDG from around the fibre before the fibre was moved into the oil and the fluorescence signal observed. In order to evaluate the residual amount of extracellular 2‐NBDG carried around the fibre following this procedure, we used FITC‐Dextran (4 kDa) as a marker, which is membrane impermeant. Figure 9A shows the results from a single fibre segment of 50 μm diameter where its middle section was exposed to a BPS droplet containing 0.25 μM FITC‐Dextran for 1 min and then briefly washed in a fresh BPS droplet by passing the middle of the fibre through the droplet before the fibre was moved into the oil and the fluorescence signal measured. The fluorescence signal was calibrated against the fluorescence signal from a microslide filled with 0.25 μM FITC‐Dextran in BPS using Equation (6) (after correction of the signals by subtracting the background level) and showed a value of 0.096 for the ratio C f/C m in the 50 μm diameter fibre. The average fluorescence signal observed in 6 fibre segments for the ratio C f/C m (using Equation 6 after the results were standardised for 50 μm diameter) was 0.096 ± 0.007 (Figure 9B) after the brief wash, meaning that in fibre segments that have been briefly washed, 9.6% of the normalised value (C f/C m) is due to dye that was on the outside of the fibre. Note that an unstirred extracellular layer of solution of only 1 μm thickness around a fibre of 50 μm diameter (25 μm radius) would carry enough fluorescent dye from the external solution (concentration C E) to yield an average value of 8% CE in the illuminated fibre segment after a brief wash (π (262‐252) C E/(π 252) = 0.081C E). Therefore, in order to determine the normalised concentration of dye (C f/C m) that crossed the plasma membrane (ie entered the fibre segment) at the time when the brief wash was applied, the contribution of the signal representing the carry‐over of external fluorescent dye (0.096) was subtracted from the overall normalised signal measured in a fibre segment with Equation (7):
| (7) |
FIGURE 9.

A quantitative assessment of the amount of dye carry‐over around the extracellular surface of a fibre segment with intact surface membrane. A. Representative fluorescence signals were obtained from a single FT fibre segment of 50 µM diameter with intact surface membrane. From left to right: the first signal shows the fibre background fluorescence after 1 min equilibration in a standard BPS; the second signal shows fibre fluorescence after 1 min equilibration in a standard BPS containing 0.25 µM FITC Dextran (4 kDa) (which is membrane impermeable) followed by a quick wash in a fresh droplet of BPS; the third signal shows the fluorescence signal obtained from a microslide (50 x 50 µm) that contained 0.25 μM FITC‐Dextran in BPS. The horizontal calibration bar represents the recording time of the fluorescence intensity signals (2s) and the dotted line represents the level of background fluorescence. B. The mean ± SEM data (9.60 ± 0.70%, n = 6) of the FITC‐Dextran concentration associated with the fibre after the quick wash, normalized to the dye concentration in the microslide according to Equation (6) (see “Materials and methods” section). The result expresses the contribution of the dye carried‐over around the fibre, in the extracellular solution (after a quick wash following incubation in the dye‐containing solution) to the overall measured dye concentration in the fibre, as described in the text
4.5. Experimental protocol for measuring 2‐NBDG uptake in fibre segments with intact surface membrane
Typically, from start to finish, experiments on a single fibre segment with intact surface membrane can last some 10‐20 min as indicated in Figure 1A. After the single fibre segment is transferred to the paraffin oil‐filled epoxy resin well, the central 0.2‐0.3 mm portion of the segment (volume of 0.3 mm long segment of 50 µm diameter fibre ≈ 0.0006 µL) is placed into a small droplet (≈ 0.1 µL) of freshly injected standard BPS on the bottom of the well (Figure S1C) by gently manipulating the tether attached to one end (see Figure 1B and Figure S1C). The central portion of the fibre segment is kept in this solution for 1 min and then moved back into oil and the first fluorescence intensity measurement is made from a small area of fixed size of about 0.1 mm diameter defined by the beam of light focused on the fibre in the region in which the fibre was exposed to the BPS solution droplet (Figure 1A, first arrow head). The small signal reflects the background level, B, (which primarily encompasses the dark noise from the photomultiplier and noise from the environment). This procedure is then repeated in which the fibre segment is moved back into another small droplet of BPS this time containing 50 μM 2‐NBDG for a set time interval (1 min in the case shown in Figure 1A), after which the fibre is moved back into the oil. Prior to taking the next fluorescence intensity measurement, F f, from the area of fixed size, in the region where the fibre was exposed to the BPS solution droplet, the middle of the fibre segment is briefly washed in a fresh droplet of standard BPS by simply passing it through the droplet. The average concentration of 2‐NBDG that entered the fibre segment at the time of the brief wash, normalised to the dye concentration (C m) in the droplet, is obtained according to Equation (7) by subtracting 0.096 from the overall normalised concentration value of 2‐NBDG. After correction, the average normalised concentration of 2‐NBDG in the fibre was 45 µM, which corresponds to 90% of the 50 µM 2‐NBDG concentration in the droplet in which the fibre segment was equilibrated for 1 min. The fibre segment was then moved back into a fresh BPS droplet for 5 mins to allow removal of any free 2‐NBDG that accumulated within the fibre segment during the preV iOus 1 min exposure. When the fluorescence signal was again recorded (3rd arrow head in Figure 1A), the signal returned back close to the control “background” level. Note that when using this procedure, the cut ends of the fibre segment must not come in direct contact with the droplets of solution in which the central 0.2‐0.3 mm portion of the fibre is placed.
It is important to emphasize that all fluorescence measurements were made from a small area of fixed size and therefore, fixed fibre length, within the larger region of 0.2‐0.3 mm in the middle of the fibre that was exposed to the small droplet of solution.
4.6. Experimental protocol for measuring 2‐NBDG concentration in skinned fibres
Muscle fibres treated with the non‐ionic detergent Triton‐X‐100 become chemically skinned because the detergent removes the plasma membrane and therefore, the Triton‐X‐100‐treated fibres can be used as reference to understand how much 2‐NBDG accumulates in a muscle fibre in the absence of a plasma membrane and how much slower 2‐NBDG is transported across the plasma membrane of a muscle fibre compared with simple diffusion.
It is important to point out that Triton X‐100 removes not only the plasma membrane but also the membranes of intracellular organelles such as the sarcoplasmic reticulum, mitochondria and the nuclei. Moreover, the diameter of the fibres increased by 18.5 ± 1% (n = 4) after the Triton‐treatment. Bearing in mind these differences between intact fibre segments and skinned fibres, the protocols for measuring the 2‐NBDG concentration in skinned fibres is different from that used for intact fibre segments. After the dissection of a fibre segment under paraffin oil, its diameter D is measured and the preparation is transferred to the paraffin oil‐filled epoxy well, constructed on a glass coverslip, as described before for the fibre segments with intact surface membrane. A larger droplet (1 µL) of MRS with 2% Triton X 100 is injected under oil on the coverslip in which the whole preparation is placed and kept for 5 minutes. After the preparation is chemically skinned, it is washed in a 1 µL MMS droplet and then moved under oil, where the background level, B, is measured. Thereafter, the whole skinned fibre segment is transferred into a droplet of MMS with 2‐NBDG (concentration, C m) for a set time after which it is carefully moved under oil and placed on the coverslip, where the fluorescence intensity F sk is measured. The fluorescence intensity of the microslide filled with 2‐NBDG (F m) at concentration, C m, is measured in parallel using the same settings as for the skinned fibre. Since the diameter of the skinned fibre increases by 18.5% after the Triton treatment, its diameter D sk is now 1.185 D (where D is the initial diameter of the fibre segment, before Triton treatment) and the ratio between the average dye concentration in the skinned fibre, C sk, and the 2‐NBDG concentration in MMS, C m, is given by Equation (4) as applied to skinned fibres:
| (8) |
The fluorescence intensity measurements (F sk–B) made on individual fibres of diameters D sk = 1.185 D (where D is the initial diameter) were converted to fluorescence FS for a fibre of initial standard diameter S = 50 μm which increases after the skinning procedure to S sk = 1.185 × 50 μm using the following equation (which takes into consideration that the amount of fluorescent dye in the light path is proportional to the fibre cross‐sectional area):
| (9) |
Substituting (F sk – B) = F S (D 2/2500 μm2) from Equation (9) in Equation (8), it follows:
| (10) |
4.7. Statistical analysis
The experimental results are expressed as means ± standard error of mean (SEM) and the 95% confidence intervals are also given in Table 1. The values of the derived parameters shown in Table 2 were calculated based on the values of the experimental results in Table 1 and the 95% confidence intervals for the derived parameters in Table 2 were obtained using the 95% confidence intervals of the experimental data. Sample size is indicated by n, which is the number of fibres. Curve fitting and statistical analyses were performed using the scientific analysis software package GraphPad Prism version 9 (GraphPad Software Inc, San Diego, CA, USA). Probability level of statistical significance was tested at P < .05 and all statistical analyses involved the use of either one‐sided or double‐sided (paired or unpaired as appropriate) Student's T‐tests.
CONFLICT OF INTEREST
The authors declare no conflict of interest in performing this study.
Supporting information
Fig S1
ACKNOWLEDGEMENTS
This study was supported by grants from the National Health and Medical Research Council of Australia and the Australian Research Council. We also wish to acknowledge the Cultural Attaché' of The Royal Mission of Saudi Arabia Embassy for financial support. Open access publishing facilitated by La Trobe University, as part of the Wiley ‐ La Trobe University agreement via the Council of Australian University Librarians.
Rudayni HA, Stephenson G, Posterino GS. Measurements of basal d‐glucose transport through GLUT1 across the intact plasma membrane of isolated segments from single fast‐ and slow‐twitch skeletal muscle fibres of rat. Acta Physiol. 2022;234:e13789. doi: 10.1111/apha.13789
Contributor Information
Hassan A. Rudayni, Email: harudayni@imamu.edu.sa.
Giuseppe S. Posterino, Email: g.posterino@latrobe.edu.au.
REFERENCES
- 1. Wasserman K, Van Kessel AL, Burton GG. Interaction of physiological mechanisms during exercise. J Appl Physiol. 1967;22:71‐85. [DOI] [PubMed] [Google Scholar]
- 2. Wasserman DH, Kang L, Ayala JE, Fueger PT, Lee‐Young RS. The physiological regulation of glucose flux into muscle in vivo. J Exp Biol. 2011;214:254‐262. [DOI] [PMC free article] [PubMed] [Google Scholar]
- 3. O’Doher FH, Venkatesan N, Davidson MB. Glucose transport is rate limiting for skeletal muscle glucose metabolism in normal and STZ‐induced diabetic rats. Diabetes. 1988;37:885‐890. [DOI] [PubMed] [Google Scholar]
- 4. Halseth AE, Bracy DP, Wasserman DH. Limitations to exercise‐and maximal insulin‐stimulated muscle glucose uptake. J Appl Physiol. 1998;85:2305‐2313. [DOI] [PubMed] [Google Scholar]
- 5. Halseth AE, Bracy DP, Wasserman DH. Functional limitations to glucose uptake in muscles comprised of different fiber types. Am J Physiol Endocrinol Metab. 2001;280:E994‐999. [DOI] [PubMed] [Google Scholar]
- 6. O’Doherty RM, Bracy DP, Osawa H, Wasserman DH, Granner DK. Rat skeletal muscle hexokinase II mRNA and activity are increased by a single bout of acute exercise. Am J Physiol Endocrinol Metab. 1994;266:E171‐E178. [DOI] [PubMed] [Google Scholar]
- 7. Lloyd PG, Hardin CD, Sturek M. Examining glucose transport in single vascular smooth muscle cells with a fluorescent glucose analogue. Physiol Res. 1999;48:401‐410. [PubMed] [Google Scholar]
- 8. Yamada K, Nakata M, Horimoto N, Saito M, Matsuoka H, Inagaki N. Measurement of glucose uptake and intracellular calcium concentration in single living pancreatic β‐ cells. J Biol Chem. 2000;275:22278‐22283. [DOI] [PubMed] [Google Scholar]
- 9. Gaudreault N, Scriven DRL, Laher I, Moore EDW. Subcellular characterization of glucose uptake in coronary endothelial cells. Microvasc Res. 2008;75:73‐82. [DOI] [PubMed] [Google Scholar]
- 10. Loaiza A, Porras OH, Barros LF. Glutamate triggers rapid glucose transport stimulation in astrocytes as evidenced by real‐time confocal microscopy. J Neurosci. 2003;23:7337‐7342. [DOI] [PMC free article] [PubMed] [Google Scholar]
- 11. Sheth RA, Lee Josephson L, Umar MU. Evaluation and clinically relevant applications of a fluorescent imaging analog to fluorodeoxyglucose positron emission tomography. J Biomed Opt. 2009;14(6):64014. doi: 10.1117/1.3259364. 064014 [DOI] [PMC free article] [PubMed] [Google Scholar]
- 12. Tao J, Diaz RK, Teixeira CRV, Hackmann TJ. Transport of a fluorescent analogue of glucose (2‐NBDG) versus radiolabeled sugars by rumen bacteria and Escherichia coli . Biochemistry. 2016;55:2578‐2589. [DOI] [PubMed] [Google Scholar]
- 13. Jakoby P, Schmidt E, Iván Ruminot I, Gutiérrez R, Barros LF, Deitmer JW. Higher transport and metabolism of glucose in astrocytes compared with neurons: a multiphoton study of hippocampal and cerebellar tissue slices. Cereb Cortex. 2014;24(1):222‐231. [DOI] [PubMed] [Google Scholar]
- 14. Carruthers A. Facilitated diffusion of glucose. Physiol Rev. 1990;70:1135‐1176. [DOI] [PubMed] [Google Scholar]
- 15. Fryer MW, Stephenson DG. Total and sarcoplasmic reticulum calcium contents of skinned fibres from rat skeletal muscle. J Physiology. 1996;493:357‐370. [DOI] [PMC free article] [PubMed] [Google Scholar]
- 16. Cheung A, Dantzig JA, Hollingworth S, et al. A small‐molecule inhibitor of skeletal muscle myosin II. Nature Cell Biol. 2002;4:83‐88. [DOI] [PubMed] [Google Scholar]
- 17. Fryer M, Neering I, Stephenson DG. Effects of 2,3‐butanedione monoxime on the contractile activation properties of fast‐ and slow‐twitch muscle fibers. J Physiol. 1988;415:601‐624. [DOI] [PMC free article] [PubMed] [Google Scholar]
- 18. Baker GF, Naftalin RJ. Evidence of multiple operational affinities for D‐glucose inside the human erythrocyte membrane. Biochim Biophys Acta – Biomembr. 1979;550:474‐484. [DOI] [PubMed] [Google Scholar]
- 19. Carruthers A, DeZutter J, Ganguly A, Devaskar SU. Will the original glucose transporter isoform please stand up! Am J Physiol Endocrinol Metab. 2009;297:E836‐E848. [DOI] [PMC free article] [PubMed] [Google Scholar]
- 20. Karlish S, Leib W, Ram D, Stein W. Kinetic parameters of glucose efflux from human red blood cells under zero‐trans conditions. Biochim Biophys Acta. 1972;255:126‐132. [DOI] [PubMed] [Google Scholar]
- 21. Naftalin RJ. A critique of the alternating access transporter model of uniport glucose transport. Biophys Rep. 2018;4:287‐299. [DOI] [PMC free article] [PubMed] [Google Scholar]
- 22. Klip A, Marette A. Acute and chronic signals controlling glucose transport in skeletal muscle. J Cell Biochem. 1992;48:51‐60. [DOI] [PubMed] [Google Scholar]
- 23. Richter EA, Hargreaves M. Exercise, GLUT4, and skeletal muscle glucose uptake. Physiol Rev. 2013;93:993‐1017. [DOI] [PubMed] [Google Scholar]
- 24. Henriksen EJ, Bourey RE, Rodnick KJ, Koranyi L, Permutt MA, Holloszy JO. Glucose transporter protein content and glucose transport capacity in rat skeletal muscles. Am J Physiol Endocrinol Metab. 1990;259:E593‐E598. [DOI] [PubMed] [Google Scholar]
- 25. Hansen PA, Wang W, Marshall BA, Holloszy JO, Mueckler M. Dissociation of GLUT4 translocation and insulin induced glucose transport in transgenic mice overexpressing GlUT1 in skeletal muscle. J Biol Chem. 1998;273:18173‐18179. [DOI] [PubMed] [Google Scholar]
- 26. Lauritzen HP, Ploug T, Prats C, Tavare JM, Galbo H. Imaging of insulin signaling in skeletal muscle of living mice shows major role of T‐tubules. Diabetes. 2006;55:1300‐1306. [DOI] [PubMed] [Google Scholar]
- 27. Roy D, Marette A. Exercise induces the translocation of GLUT4 to transverse tubules from an intracellular pool in rat skeletal muscle. Biochem Biophys Res Commun. 1996;223:147‐152. [DOI] [PubMed] [Google Scholar]
- 28. Derave W, Lund S, Holman GD, Wojtaszewski J, Pedersen O, Richter EA. Contraction‐stimulated muscle glucose transport and GLUT‐4 surface content are dependent on glycogen content. Am J Physiol Endocrinol Metab. 1999;277:E1103‐E1110. [DOI] [PubMed] [Google Scholar]
- 29. Lauritzen HP, Galbo H, Toyoda T, Goodyear LJ. Kinetics of contraction‐induced GLUT4 translocation in skeletal muscle fibers from living mice. Diabetes. 2010;59:2134‐2144. [DOI] [PMC free article] [PubMed] [Google Scholar]
- 30. Douen AG, Ramlal T, Rastogi S, et al. Exercise induces recruitment of the ‘insulin‐responsive glucose transporter’. Evidence for distinct intracellular insulin‐ and exercise‐recruitable transporter pools in skeletal muscle. J Biol Chem. 1990;265:13427‐13430. [PubMed] [Google Scholar]
- 31. Koepsell H. Glucose transporters in brain in health and disease. Pflügers Arch. 2020;472:1299‐1343. [DOI] [PMC free article] [PubMed] [Google Scholar]
- 32. Carruthers A. Mechanisms for the facilitated diffusion of substrates across cell membranes. Biochemistry. 1991;30:3898‐3906. [DOI] [PubMed] [Google Scholar]
- 33. Mackrell JG, Cartee GD. A novel method to measure glucose uptake and myosin heavy chain isoform expression of single fibers from rat skeletal muscle. Diabetes. 2012;61:995‐1003. [DOI] [PMC free article] [PubMed] [Google Scholar]
- 34. Patterson MF, Stephenson GMM, Stephenson DG. Denervation produces different single fiber phenotypes in fast‐ and slow‐twitch hindlimb muscles of the rat. Am J Physiol Cell Physiol. 2006;291:C518‐C528. [DOI] [PubMed] [Google Scholar]
- 35. Katz A, Nyomba BL, Bogardus C. No accumulation of glucose in human skeletal muscle during euglycemic hyperinsulinemia. Am J Physiol Endocrinol Metab. 1988;255:E942‐E945. [DOI] [PubMed] [Google Scholar]
- 36. Nesher R, Karl IE, Kipnis DM. Dissociation of effects of insulin and contraction on glucose transport in rat epitrochlearis muscle. Am J Physiol Cell Physiol. 1985;249:C226‐C232. [DOI] [PubMed] [Google Scholar]
- 37. Weitgasser R, Davalli AM, Weir GC. Measurement of glucose in rats: differences between glucose meter and plasma laboratory results. Diabetologia. 1999;42:256‐261. [DOI] [PubMed] [Google Scholar]
- 38. Butler PJ, Brown JA, Stephenson DG, Speakman JR. Animal Physiology: An Environmental Perspective, Chapter 2. OUP Oxford; 2021. [Google Scholar]
- 39. Ramamurthy B, Höök P, Jones AD, Larsson L. Changes in myosin structure and function in response to glycation. FASEB J. 2001;15:2415‐2422. [DOI] [PubMed] [Google Scholar]
- 40. Posterino GS, Lamb GD, Stephenson DG. Twitch and tetanic force responses and longitudinal propagation of action potentials in skinned skeletal muscle fibres of the rat. J Physiol. 2000;527:131‐137. [DOI] [PMC free article] [PubMed] [Google Scholar]
- 41. Launikonis BS, Stephenson DG. Tubular system volume changes in twitch fibres from toad and rat skeletal muscle assessed by confocal microscopy. J Physiol. 2002;538:607‐618. [DOI] [PMC free article] [PubMed] [Google Scholar]
- 42. Stephenson DG, Williams DA. Calcium‐activated force responses in fast‐ and slow‐twitch skinned muscle fibres of the rat at different temperatures. J Physiol. 1981;317:281‐302. [DOI] [PMC free article] [PubMed] [Google Scholar]
- 43. Bortolotto SK, Cellini M, Stephenson DG, Stephenson GM. MHC isoform composition and Ca2+ ‐ or Sr2+ ‐activation properties of rat skeletal muscle fibers. Am J Physiol Cell Physiol. 2000;279:C1564‐C1577. [DOI] [PubMed] [Google Scholar]
- 44. Lamboley CR, Murphy RM, McKenna MJ, Lamb GD. Endogenous and maximal sarcoplasmic reticulum calcium content and calsequestrin expression in type I and type II human skeletal muscle fibres. J Physiol. 2013;591:6053‐6068. [DOI] [PMC free article] [PubMed] [Google Scholar]
- 45. O'Connell B, Nguyen LT, Stephenson GM. A single‐fibre study of the relationship between MHC and TnC isoform composition in rat skeletal muscle. Biochem J. 2004;378:269‐274. [DOI] [PMC free article] [PubMed] [Google Scholar]
- 46. O'Connell B, Stephenson DG, Blazev R, Stephenson GMM. Troponin C isoform composition determines differences in Sr2+‐activation characteristics between rat diaphragm fibers. Am J Physiol Cell Physiol. 2004;287:79–87. [DOI] [PubMed] [Google Scholar]
- 47. Lamb GD, Stephenson DG. Measurement of force and calcium release using mechanically skinned fibers from mammalian skeletal muscle. J Appl Physiol. 2018;125:1105‐1127. [DOI] [PubMed] [Google Scholar]
- 48. Lamb GD, Stephenson DG. Effects of intracellular pH and [Mg2+] on excitation–contraction coupling in skeletal muscle fibres of the rat. J Physiol. 1994;478:331‐339. [DOI] [PMC free article] [PubMed] [Google Scholar]
- 49. Kovacs L, Rios E, Schneider MF. Measurement and modification of free calcium transients in frog skeletal muscle fibres by a metallochromic indicator dye. J Physiol. 1983;343:161‐196. [DOI] [PMC free article] [PubMed] [Google Scholar]
- 50. Dunlap WP, Silver NC. Confidence intervals and standard errors for ratios of normal variables. Behav Res Methods Instrum Comput. 1986;18:469‐471. [Google Scholar]
Associated Data
This section collects any data citations, data availability statements, or supplementary materials included in this article.
Supplementary Materials
Fig S1