

Abstract
Background
Higher consumption of coffee and tea has been associated with improved health outcomes in the general population and improved breast cancer (BC) prognosis. This study investigated patterns of coffee and tea consumption and association with patient‐reported outcomes (PROs) and clinical outcomes among survivors of BC.
Methods
The authors included survivors of stage I–III BC enrolled in the CANTO cohort (NCT01993498) that provided post‐treatment assessment of coffee and tea consumption from years 1 to 4 after diagnosis. Group‐based trajectory modeling clustered patients according to daily consumption of coffee and tea. Multivariable mixed models and Cox models examined associations between consumption, PROs and clinical outcomes.
Results
Among 3788 patients, the authors identified four stable patterns of consumption: “Low” (25.8%), “Moderate” (37.6%), “High” (25.3%), and “Very high” (11.3%), corresponding to <1, 2, 3, and ≥ 4 cups of coffee and/or tea per day. Patients in the “Very high” group (vs. “Low”), were more likely to be younger, smokers, with higher monthly income and education. PROs and survival outcomes were similar across the four groups.
Conclusions
Over one in three survivors of BC reported high or very high consumption of coffee and/or tea. The authors found no association between higher consumption of coffee and/or tea, worse PROs and clinical outcomes.
Keywords: breast cancer, coffee, patient‐reported outcome measures, survivors, tea
Short abstract
More than 30% of survivors of breast cancer report high post‐diagnostic consumption of coffee and tea. In this study, the authors did not find any detrimental association between higher consumption of coffee and tea and patient‐reported or clinical outcomes.
INTRODUCTION
Breast cancer (BC) is the most frequently diagnosed malignancy among women living in developed countries. Currently, there are an estimated 5 million survivors of BC in the United States and Europe, 1 and this number is expected to increase over the next decade. 2 A significant proportion of survivors endures severe and persistent physical and psychological sequelae following BC and its treatments. 3 Current guidelines 4 recommend a survivorship care model situated within a comprehensive framework focused on disease‐specific needs and general health promotion. 5 Modifiable lifestyle behaviors such as unhealthy diet, insufficient physical activity and excess weight have been linked to worse oncological outcomes, 6 deterioration of quality of life (QOL) and more severe treatment‐related symptoms. 7 , 8 , 9
Nutrition is a relevant concern 10 for survivors of BC who frequently report post‐diagnostic adoption of healthier dietary habits 11 , 12 and request information to achieve better overall health and prognosis and reduce cancer‐related symptoms. Nevertheless, previous studies report that a substantial proportion of survivors is not adherent 13 , 14 to dietary guidelines. 15
Coffee and tea are among the world's most consumed beverages and contain substantial amounts of caffeine as well as other bioactive compounds that exert both beneficial (e.g., anti‐inflammatory and antioxidant 16 properties) and detrimental (e.g., increased cholesterol levels 17 ) health effects. Higher coffee and tea consumption has been previously associated with reduced risk of type 2 diabetes, 18 cardiovascular, 19 and neurodegenerative diseases 20 , 21 as well as reduced risk of developing 22 , 23 and dying from several cancers. 24 , 25 Despite data on improved health outcomes and possible improvement in breast cancer–specific outcomes, no study has extensively evaluated associations between coffee and tea consumption and QOL evaluated by patient reported outcomes (PROs) in survivors of BC. The objective of this study was to longitudinally describe patterns of coffee and tea consumption and evaluate associations with dimensions of QOL, anxiety and depression, and survival outcomes in a cohort of survivors of BC participating in the CANcer TOxicity (CANTO, NCT01993498) study.
MATERIALS AND METHODS
Data source
Briefly, CANTO is a prospective, multicenter cohort of stage I–III BC patients. The cohort enrolled patients from 26 participating centers across France. CANTO collects longitudinal data at diagnosis (baseline), at follow‐up time points corresponding to completion of primary treatment (surgery, radiotherapy and/or chemotherapy), and approximately yearly afterward. Hormonal and anti‐HER2 therapy may be ongoing during follow‐up. All participants in the study provided informed consent and the study received ethical approval (ID‐RCB:2011‐A01095‐36,11–039). 26
Study cohort
The CANTO database includes 9597 women diagnosed with BC from 2012 to 2018. We included patients with at least two assessments of coffee and tea consumption during follow‐up time period (Fig. S1). Patients experiencing either disease recurrence in the form of breast cancer nodal or distant recurrence, second primary cancers, or fatal comorbidities, terminate the study at the time of event and are therefore censored from subsequent PROs data collection. In contrast, patients with local recurrences continue to provide data at subsequent time points.
Variables of interest
Coffee and tea consumption
Post‐treatment dietary habits were collected using a validated semi‐structured screening food frequency questionnaire (FFQ) 27 , 28 , 29 at year 1 after diagnosis and then every 3 months from years 2 to 4. In total, 13 evaluations were performed. 26 Patients reported weekly frequency of consumption of different foods and beverages. Available answers were: “Never,” “Less than once a week,” “Once a week,” “2–3 times per week,” “4–6 times a week,” and “Once daily or more.” For this last answer, patients had to specify the number of servings per day. Only daily coffee and tea consumption was evaluated for this study and reported as a continuous variable expressing daily consumption in cups per day.
Patient‐reported outcomes
The following PROs were collected at diagnosis and at year 1, year 2, and year 4 after the diagnosis:
1. EORTC QLQ‐C30, a 30‐item questionnaire evaluating functioning domains (e.g., physical, emotional, role) and common cancer symptoms (e.g., fatigue, pain, nausea/vomiting, appetite loss). Answers to the questionnaire are converted to a 0–100 scale where higher scores reflect better functionality or higher symptom severity. 30 The C30 summary score is a summary measure then calculated from the mean of 13 QLQ‐C30 scales. 31
2. The EORTC QLQ‐FA12 32 assessing the physical, emotional, and cognitive dimensions of fatigue.
3. The Hospital Anxiety and Depression Scale (HADS), 33 assessing emotional distress.
Survival outcomes
We evaluated invasive disease‐free (iDFS), distant disease‐free (D‐DFS), and overall survival (OS) defined as per the DATECAN initiative. 34
Covariates
Additional data collected at diagnosis included age, socioeconomic status (education level and income), marital status, Charlson comorbidity index, tobacco and alcohol use, body mass index (BMI), patient‐reported levels of physical activity (Global Physical Activity Questionnaire [GPAQ]), tumor stage, primary treatment data including type of breast surgery, axillary management, receipt of radiotherapy, chemotherapy, hormonal therapy, and anti‐HER2 therapy.
Statistical analysis
Cohort description
Baseline clinical, socioeconomic, tumor, and treatment‐related characteristics of the overall analytic cohort were summarized using descriptive statistic.
Identification of clusters for coffee and tea consumption
Longitudinal repeated assessment of coffee and tea consumption over time was analyzed using group‐based trajectory modeling (GBTM). 35 , 36 GBTM is a semi‐parametric procedure that employs multivariable latent‐class models to describe outcomes over time by identifying longitudinal clusters of individuals following similar trajectories. Model selection requires the iterative evaluation of (1) number of groups to model, and (2) best shape of the trajectory for each group, tested using maximum likelihood methods. The final model includes the best‐fitting number of groups with the best‐fitting trajectory shape (i.e., zero‐order vs. intercept vs. quadratic vs. cubic). GBTM allows developing multi‐variable adjusted models and correcting for baseline characteristics; the procedure automatically drops observations missing data in the predictor variables. A detailed description of the model selection is provided in the Supporting Methods. GBTM assigns patients to one of the trajectory groups based on longitudinal evolution of coffee and tea consumption assessed by repeated collection of FFQ and conditional on baseline characteristics. Once patients' membership has been defined, it remains constant over time, thus allowing comparison across groups. The trajectory groups identified by GBTM were assigned names to briefly describe the identified pattern. Baseline characteristics were summarized by trajectory group. Because caffeine is common to both beverages, consumption of coffee and tea was evaluated together to assess overall consumption of caffeine per day.
Trajectory group membership
After determination of the best‐fitting model, factors associated with group membership were evaluated by maximum likelihood estimates. To improve interpretability of results, odds ratio (OR) with 95% confidence interval (CI) were obtained from estimates and standard errors. The group with low coffee and tea consumption was chosen as reference to evaluate factors associated with increased consumption.
Evaluation of PROs over time
Mean scores and 95% CI for each scale of the EORTC QLQ‐C30, QLQ‐FA12, and HADS questionnaires were calculated by trajectory group at different time points to granularly describe dynamics over time. Longitudinal mixed models assessed associations between membership to trajectory group and continuous outcomes. Covariates included for adjustment in the model included trajectory group, time, trajectory group by time interaction, and baseline covariates. We obtained multivariable model adjusted mean values within groups, adjusted mean between group differences, and respective 95% CI at each time point for each outcome.
Survival analysis
The Kaplan–Meier method was used to evaluate the probability of iDFS, D‐DFS, and OS. The log‐rank test compared differences between groups. Cox hazard proportional models, adjusted for age, stage, and subtype at diagnosis, were used to obtain hazard ratio (HR) and respective 95% CI. Survival events occurring before assessment of dietary habits were excluded by performing a landmark analysis where survival probabilities were calculated starting from year 1 after diagnosis.
Sensitivity analyses
We conducted several sensitivity analyses (1) to assess associations between consumption of coffee alone and tea alone with PROs and clinical outcomes, and (2) to handle dropouts during longitudinal assessments that are responsible for censoring (e.g., other‐than‐local recurrence, second cancer, death) or missing outcome observations later over the course of the trajectory. For the latter, we used the GBTM “dropout” option (modeled at each wave to depend on outcome level and trend) to assess how the modeling extension affects trajectory shapes and model‐based predictions about outcomes and to address potential nonrandom variation of study termination events across trajectory‐groups.
Statistical analysis was performed using SAS Version 9.4 (SAS Institute Inc) including the PROC Traj Procedure developed for SAS. Statistical significance was defined with a two‐sided p < .05.
RESULTS
Cohort characteristics
Table 1 shows the overall characterization of the cohort (N = 3788). Mean age was 56.1 years (SD, 10.9). Mean BMI was 25.7 kg/m2 (SD, 5.3), 45.9% of survivors (n = 1740) were overweight or obese, and 40.7% (n = 1541) were not adherent to physical activity recommendations. 37 Overall, ~18% had a comorbidity score (Charlson Comorbidity Index) of 1 or higher and ~ 70% reported use of concomitant medications (any type) in the whole cohort throughout the observation period.
TABLE 1.
Distribution of Cohort Characteristics at Baseline in the Final Best‐Fitting Model (N = 3788)
| Variable | No. (%) |
|---|---|
| Age, years | |
| Mean (SD) | 56.13 (10.91) |
| Missing | — |
| BMI, continuous, kg/m2 | |
| Mean (SD) | 25.69 (5.30) |
| Missing | — |
| BMI, WHO definition, kg/m2 | |
| Underweight, <18.5 | 87 (2.30) |
| Normal weight, 18.5–24.9 | 1961 (51.77) |
| Overweight, 25.0–29.9 | 1020 (26.93) |
| Obese, ≥30.0 | 720 (19.01) |
| Missing | — |
| Physical activity, continuous, MET‐h/week | |
| Median (Q1–Q3) | 15 (0–38) |
| Missing | — |
| Total physical activity, WHO definition | |
| Sufficiently active (≥10 MET‐h/week) | 2247 (59.32) |
| Insufficiently active (<10 MET‐h/week) | 1541 (40.68) |
| Missing | — |
| Smoking behavior | |
| Former or never smoker | 3208 (84.69) |
| Current smoker | 580 (15.31) |
| Missing | — |
| Daily alcohol consumption | |
| Yes | 530 (13.99) |
| No | 3258 (86.01) |
| Missing | — |
| Menopausal status | |
| Premenopausal | 1481 (39.10) |
| Postmenopausal | 2307 (60.90) |
| Missing | — |
| Depressive symptomatology | |
| Normal | 3141 (82.92) |
| Borderline or case | 647 (17.08) |
| Missing | |
| Anxiety symptomatology | |
| Normal | 1585 (41.84) |
| Borderline or case | 2203 (58.16) |
| Missing | — |
| Charlson Comorbidity Index score | |
| 0 | 3106 (82.00) |
| ≥1 | 682 (18.00) |
| Missing | — |
| Self‐reported concomitant medicationa | |
| Yes | 2673 (70.58) |
| No | 1114 (29.42) |
| Missing | 1 |
| Marital status | |
| Not partnered | 745 (19.67) |
| Partnered | 3043 (80.33) |
| Missing | — |
| Monthly household income, € | |
| <3000 | 2058 (54.33) |
| ≥3000 | 1730 (45.67) |
| Missing | — |
| Highest diploma obtained | |
| Primary school | 444 (11.72) |
| High school | 1762 (46.52) |
| College or higher | 1582 (41.76) |
| Missing | — |
| Diagnostic modality | |
| Symptoms | 1248 (33.60) |
| Mammographic screening | 2466 (66.40) |
| Missing | 74 |
| Stage | |
| I | 1907 (50.34) |
| II | 1527 (40.26) |
| III | 356 (9.40) |
| Missing | — |
| Subtype | |
| HR+/HER2− | 2960 (78.14) |
| HR±/HER2+ | 495 (13.06) |
| HR−/HER2− | 333 (8.79) |
| Missing | — |
| Breast cancer surgery | |
| Mastectomy | 953 (25.16) |
| Partial breast surgery | 2835 (74.84) |
| Missing | — |
| Axillary surgery | |
| Axillary dissection | 1345 (35.51) |
| Sentinel node | 2443 (64.49) |
| Missing | — |
| Chemotherapy | |
| Yes | 1952 (51.53) |
| No | 1836 (48.47) |
| Missing | — |
| Type of chemotherapy | |
| Anthracyclines + taxanes | 1691 (86.63) |
| Anthracyclines | 69 (3.53) |
| Taxanes | 192 (9.84) |
| Missing | — |
| Radiation therapy | |
| Yes | 3501 (92.42) |
| No | 287 (7.58) |
| Missing | — |
| Hormonal therapy | |
| Yes | 3135 (82.76) |
| No | 653 (17.24) |
| Missing | — |
| Type of hormonal therapy, if applicable | |
| Tamoxifen ± LHRH analog | 1006 (26.59) |
| Aromatase inhibitor ± LHRH analog | 1670 (44.14) |
| Tamoxifen + aromatase inhibitor ± LHRH analog | 454 (12.00) |
| Missing | 5 |
| Anti‐HER2 therapy | |
| Yes | 439 (11.59) |
| No | 3349 (88.41) |
| Missing | — |
Note: Anxiety and depression have been scored according to the Hospital Anxiety and Depression Scale: normal (score 0–7), doubtful (8–10), or case (11–21).
Abbreviations: BMI, body mass index; HER2, human epidermal growth factor receptor 2; HR, hormone receptor; LHRH, luteinizing hormone releasing hormone; MET‐h, metabolic‐equivalent of task‐hour; Q, quartile; SD, standard deviation; WHO, World Health Organization.
Collected 1 year after diagnosis.
Trajectory groups description
Participants completed a median of eight post‐treatment dietary evaluations (interquartile range [IQR], 5–9). GBTM clustered patients in four trajectory groups based on number of cups of coffee and/or tea consumed daily (cups/day): “low” (N = 979 [25.8%]), “moderate” (N = 1425 [37.6%]), “high” (N = 957 [25.3%]), and “very high” (N = 427 [11.3%]) consumption (<1, 2, 3, and ≥ 4 cups/day, respectively). Consumption over time was stable in terms of global consumption of coffee and for each beverage assessed independently (Figs. S2 and S3). Metrics for model selection and maximum likelihood parameters for shape selection of the trajectories are available in Tables S1 and S2. Mean scores and 95% CI for QLQ‐C30, QLQ‐FA12, and HADS scales by trajectory group over time are available in Tables S3–S5.
Trajectory group characteristics and membership
Distribution of patients' characteristics by trajectory‐group at diagnosis is displayed in Table 2. Compared to low consumers, patients in the very high trajectory‐group were younger (adjusted OR [aOR] for 1‐year decrease [95% CI], 1.03 [1.01–1.05]), had higher income (vs. low aOR 1.37 [1.02–1.83]), and higher education (aOR for college vs. high or primary school 1.42 [1.08–1.88]). Higher consumption of coffee and tea across groups was consistently associated with former or current smoking status (vs. never: aORs [95% CI] 1.36 [1.10–1.68], 2.48 [2.01–3.07], and 3.89 [2.98–5.06] for moderate, high, and very high groups, respectively) and not receiving anti‐HER2 therapy (vs. yes: aORs [0.56–1.00], 0.60 [0.43–0.83], and 0.48 [0.31–0.74] for moderate, high, and very high groups, respectively).
TABLE 2.
Distribution of Cohort Characteristics at Baseline According to Trajectory‐Group Membership (N = 3788) and ORs with 95% CIs for Trajectory‐Group Membership
| Patient characteristics | Low consumption (N = 979, 25.8%) | Moderate consumption (N = 1425, 37.6%) | High consumption (N = 957, 25.3%) | Very high consumption (N = 427, 11.3%) | ||||||
|---|---|---|---|---|---|---|---|---|---|---|
| No. (%) | No. (%) | aOR (95% CI) | p | No. (%) | aOR (95% CI) | p | No. (%) | aOR (95% CI) | p | |
| Age, years | 1.01 | .5030 | .0022 | .0098 | ||||||
| Mean (SD) | 58.08 (11.62) | 57.39 (10.73) | (0.99–1.02) | 54.31 (10.15) | 1.03 (1.01–1.04) | 51.52 (9.44) | 1.03 (1.01–1.05) | |||
| BMI, continuous, kg/m2 | .0835 | .2133 | .1455 | |||||||
| Mean (SD) | 26.34 (5.54) | 25.66 (5.25) | 0.98 (0.97–1.00) | 25.45 (5.18) | 0.99 (0.97–1.01) | 24.83 (5.03) | 0.98 (0.96–1.01) | |||
| BMI, WHO definition, kg/m2 | — | — | — | — | — | — | ||||
| Underweight or normal weight, <24.9 | 480 (49.03) | 764 (53.61) | 543 (56.74) | 261 (61.12) | ||||||
| Overweight or obese, ≥25.0 | 499 (50.97) | 661 (46.39) | 414 (43.26) | 166 (38.88) | ||||||
| Physical activity, continuous, MET‐h/week | .2906 | .3189 | .2302 | |||||||
| Median (Q1–Q3) | 13.33 (0–36) | 15.67 (2.67–40) | 1.00 (0.99–1.01) | 16 (2.67–38) | 1.00 (0.99–1.002) | 15 (2.67–40) | 1.00 (0.99–1.002) | |||
| Total physical activity, WHO definition | — | — | — | — | — | — | ||||
| Sufficiently active (≥10 MET‐h/week) | 543 (55.46) | 863 (60.56) | 587 (61.34) | 254 (59.48) | ||||||
| Insufficiently active (<10 MET‐h/week) | 436 (44.54) | 562 (39.44) | 370 (38.66) | 173 (40.52) | ||||||
| Smoking behavior | .0040 | .0000 | .0000 | |||||||
| Never smoker | 729 (74.46) | 973 (68.28) | 1.36 (1.10–1.68) | 496 (51.83) | 2.48 (2.01–3.07) | 168 (39.34) | 3.89 (2.98–5.06) | |||
| Current or former smoker | 250 (25.54) | 452 (31.72) | 461 (48.17) | 259 (60.66) | ||||||
| Daily alcohol consumption | .6240 | .2377 | .822 | |||||||
| Yes | 134 (13.69) | 197 (13.82) | 0.93 (0.71–1.23) | 130 (13.58) | 0.84 (0.62–1.12) | 69 (16.16) | 1.04 (0.73–1.49) | |||
| No | 845 (86.31) | 1228 (86.18) | 827 (86.42) | 358 (83.84) | ||||||
| Menopausal status | .1145 | .1179 | .3095 | |||||||
| Premenopausal | 327 (33.40) | 477 (33.47) | 1.29 (0.94–1.76) | 424 (44.31) | 1.30 (0.94–1.80) | 253 (59.25) | 0.81(0.54–1.22) | |||
| Postmenopausal | 652 (66.60) | 948 (66.53) | 533 (55.69) | 174 (40.75) | ||||||
| Depressive symptomatology | .5096 | .5339 | .3015 | |||||||
| Normal | 806 (82.33) | 1196 (83.93) | 0.95 (0.78–1.15) | 776 (81.09) | 1.09 (0.83–1.42) | 363 (85.01) | 0.83 (0.58–1.19) | |||
| Borderline or case | 173 (17.67) | 229 (16.07) | 181 (18.91) | 64 (14.99) | ||||||
| Anxiety symptomatology | .5923 | .8064 | .852 | |||||||
| Normal | 411 (41.98) | 623 (43.72) | 0.92 (0.71–1.19) |
378 (39.50) |
1.03 (0.83–1.27) | 173 (40.52) | 0.97 (0.75–1.28) | |||
| Borderline or case | 568 (58.02) | 802 (56.28) | 579 (60.50) | 254 (59.48) | ||||||
| Charlson Comorbidity Index score | .1549 | .0093 | .3449 | |||||||
| 0 | 812 (82.94) | 1165 (81.75) | 1.19 (0.94–1.52) | 769 (80.36) | 1.41 (1.09–1.82) | 360 (84.31) | 1.18 (0.84–1.67) | |||
| ≥1 | 167 (17.06) | 260 (18.25) | 188 (19.64) | 67 (15.69) | ||||||
| Self‐reported concomitant medicationa | — | — | — | — | — | — | ||||
| Yes | 700 (71.50) | 1007 (70.67) | 677 (70.74) | 289 (67.84) | ||||||
| No | 279 (28.50) | 418 (29.33) | 280 (29.26) | 137 (32.16) | ||||||
| Missing | — | — | — | 1 | ||||||
| Marital status | .3570 | .2133 | .0624 | |||||||
| Not partnered | 191 (19.51) | 287 (20.14) | 0.89 (0.69–1.14) | 177 (18.50) | 0.84 (0.64–1.10) | 90 (21.08) | 0.72 (0.51–1.02) | |||
| Partnered | 788 (80.49) | 1138 (79.86) | 780 (81.50) | 337 (78.92) | ||||||
| Diagnostic modality | — | — | — | — | — | — | ||||
| Symptoms | 317 (33.1) | 442 (31.5) | 311 (33.0) | 178 (42.8) | ||||||
| Mammographic screening | 639 (66.8) | 958 (68.4) | 631 (67.0) | 238 (57.21) | ||||||
| Missing | 23 | 25 | 15 | 11 | ||||||
| Stage | .0102 | .2561 | .1218 | |||||||
| I | 494 (50.46) | 713 (50.00) | 0.99 (0.78–1.25) | 506 (52.87) | 0.86 (0.66–1.12) | 194 (45.43) | 1.29 (0.93–1.80) | |||
| II | 394 (40.25) | 575 (40.35) | 359 (37.51) | 197 (46.14) | ||||||
| III | 91 (9.30) | 137 (9.61) | 92 (9.61) | 36 (8.43) | ||||||
| Subtype | — | — | — | — | — | — | ||||
| HR+/HER2− | 746 (76.21) | 1107 (77.69) | 768 (80.26) | 339 (79.40) | ||||||
| HR±/HER2+ | 151 (15.42) | 186 (13.05) | 111 (11.59) | 47 (11.00) | ||||||
| HR−/HER2− | 82 (8.37) | 132 (9.26) | 78 (8.15) | 41 (9.60) | ||||||
| Breast cancer surgery | .1346 | .3963 | .5557 | |||||||
| Mastectomy | 239 (24.41) | 378 (26.53) | 1.22 (0.94–1.59) | 241 (25.18) | 1.13 (0.85–1.50) | 95 (22.25) | 0.90 (0.62–1.29) | |||
| Partial breast surgery | 740 (75.59) | 1047 (73.47) | 716 (74.82) | 332 (77.75) | ||||||
| Axillary surgery | .6342 | .9926 | .3253 | |||||||
| Axillary dissection | 346 (35.34) | 511 (35.86) | 0.94 (0.73–1.21) | 339 (35.42) | 1.00 (0.76–1.31) | 149 (34.89) | 0.84 (0.60–1.18) | |||
| Sentinel node | 633 (64.66) | 914 (64.14) | 618 (64.58) | 278 (65.11) | ||||||
| Radiation therapy | .1210 | .0906 | .3454 | |||||||
| Yes | 891 (91.01) | 1318 (92.49) | 1.35 (0.92–1.96) | 893 (93.31) | 1.43 (0.94–2.17) | 399 (93.44) | 1.30 (0.76–2.23) | |||
| No | 88 (8.99) | 107 (7.51) | 64 (6.69) | 28 (6.56) | ||||||
| Endocrine therapy | .5028 | .271 | .4787 | |||||||
| Yes | 796 (81.31) | 1176 (82.53) | 1.08 (0.85–1.38) | 804 (84.01) | 1.16 (0.89–1.51) | 359 (84.07) | 1.13 (0.81–1.59) | |||
| No | 183 (18.69) | 249 (17.47) | 153 (15.99) | 68 (15.93) | ||||||
| Chemotherapy | .7588 | .7287 | .2867 | |||||||
| Yes | 500 (51.07) | 738 (51.79) | 1.04 (0.82–1.32) | 490 (51.20) | 0.96 (0.74–1.23) | 224 (52.46) | 0.84 (0.61–1.16) | |||
| No | 479 (48.93) | 687 (48.21) | 467 (48.80) | 203 (47.54) | ||||||
| Anti‐HER2 therapy | .0511 | .0019 | .0008 | |||||||
| Yes | 140 (14.30) | 165 (11.58) | 0.75 (0.56–1.00) | 96 (10.03) | 0.60 (0.43–0.83) | 38 (8.90) | 0.48 (0.31–0.74) | |||
| No | 839 (85.70) | 1260 (88.42) | 861 (89.97) | 389 (91.10) | ||||||
Note: Anxiety and depression have been scored according to the Hospital Anxiety and Depression Scale: normal (score 0–7), doubtful (8–10), or case (11–21).
Abbreviations: aOR, adjusted odds ratio; BMI, body mass index; CI, confidence interval; HER2, human epidermal growth factor receptor 2; HR, hormone receptor; MET‐h, metabolic‐equivalent of task‐hour; OR, odds ratio; Q, quartile; SD, standard deviation; WHO, World Health Organization.
Collected at 1 year after diagnosis.
Evolution of PROs over time by trajectory groups
PROs at baseline were comparable among the four groups with the exception of cognitive fatigue and insomnia that were slightly higher at baseline in patients in the high and very high consumption of coffee and tea groups.
Overall, we observed a significant deterioration in overall quality of life, measured by the C30 Summary Score, from diagnosis to year 1 that never recovered to pretreatment levels (p time = <.0001). However, no association between coffee and tea consumption and this deteriorating trend was observed: overall adjusted mean differences (95% CI) (vs. “little consumption”) were: +0.48 (−0.6, +1.5), +0.10 (−1.0, +1.3), and + 0.20 (−1.3, +1.7) for moderate, high, and very high consumption groups, respectively (p group = .73, p interaction = .15) (Fig. 1A and Table S6). Accordingly, fatigue and pain significantly increased from diagnosis to year 1 (p time = <.0001 for both scales) but no association with patterns of coffee and tea consumption was observed: overall adjusted mean differences in fatigue scale were (95% CI) −0.9 (−2.9, +0.9), −0.05 (−2.2, +2.1), and − 0.6 (−3.4, +2.2) (p group = .49, p interaction = .82) and in pain scale were + 0.6 (−1.5, 2.6), +1.8 (−0.5, 4.0), and + 1.0 ([−0.3, 2.8] (p group = .18, p interaction = .45) for moderate, high, and very high consumption (vs. little consumption), respectively (Figs. 1B,C and Tables S7 and S9). Insomnia was the only PRO where a significant interaction between time and group of coffee and tea consumption was observed (p interaction = <.0001). However, overall adjusted mean differences (95% CI) were similar: −1.5 (−4.3, +1.2), −0.8 (−3.8, +2.3), −0.2 (−4.1, +3.6) for moderate, high, and very high consumption (vs. low consumption), respectively (Fig. 1D and Table S10).
FIGURE 1.
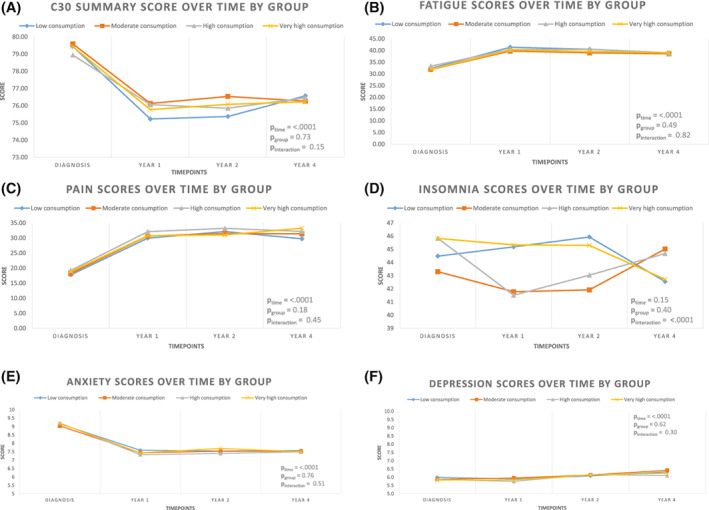
Evolution of mean model‐based C30 Summary Score, Fatigue, Pain and Insomnia scores (EORTC QLQ‐C30) over time (A–D, respectively). In functional scales, higher scores indicate a better condition. For symptom scales, higher scores are indicative of a worse symptomatology. (E and F) Evolution of mean model‐based Hospital Anxiety and Depression scores (HADS) over time. For HADS scale, higher scores indicate a worse symptomatology, scoring: noncase (score, 0–7), doubtful case (8–10), and case (11–21). All values are model‐based multivariable‐adjusted average scores obtained from mixed models including time, trajectory group for coffee and tea consumption, time × group interaction, and covariates available at baseline.
Other PROs explored, including dimensions of fatigue (Fig. S4 and Table S8), anxiety, and depression (Figs. 1E,F and Tables S11 and S12), were similar among groups of coffee and tea consumption.
Clinical outcomes by trajectory groups
In this cohort, we observed 263 iDFS events, 250 D‐DFS events, and 78 OS events with a median follow‐up of 66.5 months (IQR, 49.5–74.7).
We did not observe any statistically significant difference in clinical outcomes according to patterns of coffee and tea consumption. Percentages of survivors who were free of invasive recurrence and distant recurrence were similar across the four groups (p = .92 and .87, respectively). Adjusted HRs (95% CI) (vs. ref. group little consumption) for iDFS were 0.97 (0.71–1.31), 0.97 (0.69–1.36), and 0.98 (0.63–1.53), for moderate, high, and very high groups, respectively, whereas for D‐DFS, they were 0.98 (0.71–1.33), 0.96 (0.67–1.36), and 0.98 (0.62–1.56), respectively (Figs. S5A,B).
Consistently, we did not observe any difference for OS (p = .78) among groups: adjusted HRs (95% CI) (vs. ref. group little consumption) 1.10 (0.63–1.93), 0.89 (0.46–1.73), and 1.43 (0.65–3.12) for moderate, high, and very high groups, respectively (Fig. S5C).
Sensitivity analyses
Results of sensitivity analyses were consistent with main findings (data not shown). Briefly, no significant association was observed between selected PROs and clinical outcomes when coffee and tea consumption was assessed independently one from another. In addition, number of trajectory groups and factors associated with group membership were consistent when we assessed potential nonrandom variation of study termination events across trajectory groups using a model dropout option.
DISCUSSION
We report results from a large longitudinal, prospective study evaluating associations between repeated measure of coffee and tea consumption, PROs, and clinical outcomes in survivors of BC. We identified four trajectory groups according to daily consumption of coffee and tea, with patients consuming either <1, 2, 3, or ≥ 4 cups/day, respectively. Higher consumption was associated with younger age, higher socioeconomic status, and current smoking habit. We observed no detrimental associations between higher consumption of coffee and tea and patient reported outcomes, including overall QOL or survival outcomes.
Cancer diagnosis is described as a powerful incentive for survivors to actively adopt healthy behaviors, 38 because behavioral change may represent a significant coping mechanism. 39 Several studies have evaluated post‐diagnostic dietary modifications in survivors of BC and observed a general tendency toward adoption of healthier behaviors such as increased consumption of fruit, vegetables, and wholegrain as well as reduced consumption of red meat, high‐fat, and high‐sugar products. 11 , 12 , 40 Nevertheless, uptake of healthy behaviors is not ubiquitous across survivors. 41 We previously explored this dimension in the CANTO cohort and observed that (1) a nonnegligible proportion of survivors engages or persists in unhealthy behaviors, such as insufficient physical activity, and gain weight, and (2) specific risk factors linked to these unhealthy behaviors can be identified. 42
In this longitudinal study, no significant modification in global consumption and for each beverage assessed independently was observed over 4 years of follow‐up across groups. This suggests that intake of coffee and tea may not be considered by survivors as a significant behavior to change or less of a priority compared to other dietary behaviors such as increasing servings of fruits and vegetables. Additionally, dietary guidelines for cancers survivors lack specific recommendations on coffee and tea consumption. 15 French national guidelines simply recommend to moderate coffee intake and to consume it without added sugars. 43 Nonetheless, the “Dietary Guidelines for Americans, 2020–2025” indicate a 400 mg limit of caffeine per day as safe for healthy adults, 44 and likely most survivors in our study had consumption levels well below this threshold.
Factors associated with caffeine consumption among survivors of BC have been previously evaluated. In a similar population of survivors, increasing consumption of coffee was associated with unhealthy behaviors including current or former smoking status, similar to what we found, as well as higher daily alcohol intake. 24 In the general population, other authors report that higher consumption of coffee is associated with higher BMI and lower levels of physical activity, associations that did not emerge in our cohort. 45 , 46
Previous data in the general population have linked coffee and tea consumption with probable protective effects on several chronic or noncommunicable diseases, including reduced risk of cardiovascular diseases, type 2 diabetes, and metabolic syndrome. Additional protective effects include reduced risk of developing and dying from some cancers and of developing neurological conditions such as depression and Parkinson's. 25 , 47 , 48 These positive health outcomes are hypothesized to be a result of bioactive compounds contained in coffee and tea that exert anti‐inflammatory and anti‐oxidant properties. 49 , 50 , 51 Coffee and tea significantly influence central nervous system activity, mainly through the activity of caffeine. Caffeine increases the release of excitatory neurotransmitters resulting in increased alertness and vigilance, reduced fatigue, pain, and perhaps depression. 52 , 53 Caffeine, however, can also contribute to insomnia and induce anxiety, 54 although these effects may be partially related to patterns of consumption, individual metabolism, 55 genetic, 56 clinical predisposition, and tolerance. 57
To our knowledge, this is the first study to provide a comprehensive, longitudinal evaluation of the association between coffee and tea consumption and PROs in survivors of BC. We assessed insomnia and measures of psychological distress including cognitive fatigue, anxiety, and depression and observed no significant association between higher consumption of coffee and tea and these outcomes over time. Results from previous literature, although not always focused on cancer survivors, showed beneficial effects on mental health in association with higher consumption of coffee and tea. Smith et al. 58 reported the results of a population study evaluating 3223 nonworking participants and found that regular caffeine intake was associated with a reduced risk of depression compared to no consumption. Similarly, a 20% risk reduction for depression was observed in healthy women consuming more than four cups of coffee per day. 59 Chen et al. 60 observed that in 1399 Chinese survivors of BC, regular tea consumption was associated with lower risk of depression (OR, 0.39; 95% CI, 0.19–0.84).
In our study, we observed increasing scores over time in the HADS depression scale, however, this was comparable among trajectory groups, and no effect was found for either higher consumption of coffee and tea nor interaction between group and time.
A cross‐sectional study of healthy individuals found a null association between higher coffee consumption and the SF‐12 physical composite score (PCS) that evaluates several scales including physical functioning and body pain. 37 Similarly, we observed no association between higher coffee and tea consumption, pain, and physical fatigue scores.
It has been hypothesized that bioactive compounds in coffee and tea may improve survival outcomes via antioxidant activity, 61 reducing insulin resistance, and subsequent hyperinsulinemia, 62 systemic inflammation, 63 and sex hormones levels. 64 Various studies have evaluated the association of both pre‐ and post‐diagnostic coffee and tea consumption with BC and overall survival with conflicting results. 65 , 66 , 67 Farvid et al. 24 recently reported results of a study that explored this association in a cohort of 8900 women with stage I–III BC included from the Nurses' Health Study (NHS) and the NHSII. Using up to 30 years of follow‐up, the authors confirmed that pre‐diagnostic coffee and tea consumption is not associated with survival outcomes in BC. Conversely, consuming more than three cups and two to three cups of coffee per day post‐diagnosis was associated with a 25% and 24% reduction in the risk of breast cancer–specific and overall mortality compared to nondrinkers, respectively. Higher post‐diagnostic tea consumption (>3 cups/day) was similarly associated with a 26% lower risk for all‐cause mortality. 24 We did not observe any association between higher coffee and tea consumption and survival outcomes. However, the number of events and median follow‐up of our cohort were limited, making direct comparison across studies difficult, especially in the context of early‐stage BC.
Strengths of our study include the large sample size, longitudinal design with repeated measures of both dietary habits and PROs, and the wide availability of baseline socio‐demographic, clinical, and treatment data that allowed development of adjusted models. Some limitations to our study must be acknowledged. The questionnaire used did not allow us to separately distinguish, and thus evaluate, associations with: (1) type of coffee (caffeinated vs. decaffeinated), (2) methods of preparation (e.g., filtered vs. unfiltered coffee) associated with different concentrations of caffeine, 68 (3) type of tea consumed, and (4) additional sources of caffeine. Particularly, we acknowledge that in this analysis, we may have overestimated the overall intake of caffeine, by including an unmeasurable proportion of decaffeinated coffee consumption in the assessment of reported intake. However, the relative consumption of decaffeinated coffee in Europe, including France, is overall much lower compared to that of caffeinated coffee (~7%, representing a minor contribution to the overall consumption of coffee product). 69 Finally, even if we could not determine the consumption of decaffeinated coffee, available data suggesting a differential impact of caffeinated versus decaffeinated coffee on the outcomes of interest in the present analysis is scarce. Previous studies focused specifically on breast cancer outcomes either did not have availability of data on decaffeinated coffee consumption 70 , 71 , 72 or suggested similar contribution of both regular and decaffeinated coffee on outcomes. 24 Furthermore, although we had access to multiple evaluations of coffee and tea consumption over time, pre‐diagnostic and baseline consumption were not available. Response attrition is also a recognized and common limitation of longitudinal studies, including CANTO. Although GBTM is particularly solid at accommodating missing outcome data, and sensitivity analyses addressing this limitation confirmed the robustness of the study findings, we acknowledge that part of our results may be driven by short‐ and mid‐term (rather than long‐term) consumption patterns. Additionally, GBMT is a dynamic procedure susceptible of additional follow‐up and therefore assignment of trajectory groups may potentially change as more data become available. Finally, given the observational nature of our study, residual unmeasurable confounders and potential selection bias must be acknowledged. Because our cohort was mainly composed of educated, non‐Hispanic White individuals, our results are not fully applicable to the whole population of survivors of BC. Further studies with a prospective, randomized design and with more thorough dietary evaluation and population diversity are warranted to confirm our results.
In conclusion, our study found no detrimental association of higher post‐diagnostic coffee and tea consumption with PROs as well as with clinical outcomes. These results add to an increasing body of literature evaluating post‐diagnostic dietary habits and short‐term follow‐up outcomes in survivors of BC.
AUTHOR CONTRIBUTIONS
Davide Soldato: Conceptualization, data analyses, and writing–original draft. Ines Vaz‐Luis: Conceptualization, data analyses, writing–original draft, and project supervision. Antonio Di Meglio: Conceptualization, data analyses, writing–original draft, and project supervision. All authors have made substantial contributions to the interpretation of data, revisions to the manuscript for important intellectual content, writing–original draft, and review and approval of the final version.
CONFLICTS OF INTEREST
Ines Vaz‐Luis reports honoraria from Amgen, Pfizer, Novartis, and AstraZeneca. Barbara Pistilli reports consulting/advising for Puma Biotechnology, Novartis, Myriad Genetics, and Pierre Fabre; meeting or travel support from Novartis, AstraZeneca, MSD Oncology, and Pfizer; and research funding from Daiichi, Puma Biotechnology, Novartis, Merus, AstraZeneca, Pfizer and AstraZeneca. Fabrice André reports research funding from Novartis, Pfizer, AstraZeneca, Eli Lilly, Daichii, and Roche. Paul Cottu reports funding from Pfizer and Nanostring; consulting fees from Pfizer, Roche, Lilly, Novartis, Daichi, and Seagen; payment for lecture presentations from Pfizer; and payment for manuscript writing from Novartis. Lucia Del Mastro reports grants or contracts from Eli Lilly, Novartis, Roche, Daiichi Sankyo, and Seagan; payment or honoraria from Roche, Novartis, Pfizer, Eli Lilly, AstraZeneca, MSD, Seagen, Gilead, Pierre Fabre, Eisai, Exact Sciences, and Ipsen; support for attending meetings or travel from Roche, Pfizer, and Eisai; and participation on a Data Safety Monitoring Board or Advisory Board from Novartis, Roche, Eli Lilly, Pfizer, Daiichi Sakyo, Exact Sciences, Gilead, Pierre Fabre, Eisai, and AstraZeneca. Olivier Tredan reports payment or honoraria from Roche, Pfizer, Novartis‐Sandoz, Lilly, MSD, Astra‐Zeneca, Pierre Fabre, Seagen, Daiichi‐Sankyo, Gilead, and Eisai; support for attending meetings and/or travel from Roche, Pfizer, Novartis‐Sandoz, Lilly, MSD, Astra‐Zeneca, Pierre Fabre, Seagen, Daiichi‐Sankyo, Gilead, and Eisai; and support for Participation on a Data Safety Monitoring Board or Advisory Board from Roche, Pfizer, Novartis‐Sandoz, Lilly, MSD, Astra‐Zeneca, Pierre Fabre, Seagen, Daiichi‐Sankyo, Gilead, and Eisai.
Funding information
National Research Agency, Grant/Award Number: ANR‐10‐COHO‐0004; Conquer Cancer, the ASCO Foundation, Grant/Award Number: Career Pathway Grant in Symptom Management; the Rising Tide Foundation for Clinical Cancer Research; Susan G. Komen, Grant/Award Number: CCR17483507; Odyssea; Foundation Gustave Roussy.
Supporting information
Figure S1‐S5 Supporting Information
Appendix S1 Table S1‐S12 Supporting Information
ACKNOWLEDGMENTS
All participants in this study provided informed consent, and the study received ethical approval (ID‐RCB:2011‐A01095‐36,11‐039). The CANcer TOxicity study is supported by the French government under the Investment for the Future program managed by the National Research Agency (ANR‐10‐COHO‐0004). This research was also supported by a Career Pathway Grant in Symptom Management from Conquer Cancer, the ASCO Foundation, and the Rising Tide Foundation for Clinical Cancer Research (to Antonio Di Meglio), a Career Catalyst Research Grant from Susan G. Komen (CCR17483507; to Ines Vaz‐Luis), and grants from Odyssea and Foundation Gustave Roussy.
This study was presented in part at the European Society of Medical Oncology Congress on September 17, 2021.
The trial registration is NCT01993498.
DATA AVAILABILITY STATEMENT
Upon request to Unicancer R&D, data will be available.
REFERENCES
- 1. Miller KD, Siegel RL, Lin CC, et al. Cancer treatment and survivorship statistics, 2016. CA Cancer J Clin. 2016;66(4):271‐289. doi: 10.3322/caac.21349 [DOI] [PubMed] [Google Scholar]
- 2. Bluethmann SM, Mariotto AB, Rowland JH. Anticipating the “silver tsunami”: prevalence trajectories and comorbidity burden among older cancer survivors in the United States. Cancer Epidemiol Biomarkers Prev. 2016;25(7):1029‐1036. doi: 10.1158/1055-9965.EPI-16-0133 [DOI] [PMC free article] [PubMed] [Google Scholar]
- 3. Ferreira AR, di Meglio A, Pistilli B, et al. Differential impact of endocrine therapy and chemotherapy on quality of life of breast cancer survivors: a prospective patient‐reported outcomes analysis. Ann Oncol. 2019;30(11):1784‐1795. doi: 10.1093/annonc/mdz298 [DOI] [PubMed] [Google Scholar]
- 4. Runowicz CD, Leach CR, Henry NL, et al. American Cancer Society/American Society of Clinical Oncology breast cancer survivorship care guideline. J Clin Oncol. 2016;34(6):611‐635. doi: 10.1200/JCO.2015.64.3809 [DOI] [PubMed] [Google Scholar]
- 5. Nekhlyudov L, Mollica MA, Jacobsen PB, Mayer DK, Shulman LN, Geiger AM. Developing a Quality of Cancer Survivorship Care Framework: implications for clinical care, research, and policy. J Natl Cancer Inst. 2019;111(11):1120‐1130. doi: 10.1093/jnci/djz089 [DOI] [PMC free article] [PubMed] [Google Scholar]
- 6. Kroenke CH, Chen WY, Rosner B, Holmes MD. Weight, weight gain, and survival after breast cancer diagnosis. J Clin Oncol. 2005;23(7):1370‐1378. doi: 10.1200/JCO.2005.01.079 [DOI] [PubMed] [Google Scholar]
- 7. Demark‐Wahnefried W, Campbell KL, Hayes SC. Weight management and its role in breast cancer rehabilitation. Cancer. 2012;118(suppl 8):2277‐2287. doi: 10.1002/cncr.27466 [DOI] [PMC free article] [PubMed] [Google Scholar]
- 8. di Meglio A, Michiels S, Jones LW, et al. Changes in weight, physical and psychosocial patient‐reported outcomes among obese women receiving treatment for early‐stage breast cancer: a nationwide clinical study. Breast. 2020;52:23‐32. doi: 10.1016/j.breast.2020.04.002 [DOI] [PMC free article] [PubMed] [Google Scholar]
- 9. Pierce JP, Natarajan L, Caan BJ, et al. Influence of a diet very high in vegetables, fruit, and fiber and low in fat on prognosis following treatment for breast cancer: The Women's Healthy Eating and Living (WHEL) randomized trial. JAMA. 2007;298(3):289‐298. doi: 10.1001/jama.298.3.289 [DOI] [PMC free article] [PubMed] [Google Scholar]
- 10. Cha L, Tevaarwerk AJ, Smith EM, Chandereng T, Huenerberg KJ, Seaborne LA, Carroll CB, Sesto ME Reported concerns and acceptance of information or referrals among breast cancer survivors seen for care planning visits: results from the University of Wisconsin Carbone Cancer Center Survivorship Program. J Cancer Educ. Published online April 26, 2021. doi: 10.1007/s13187-021-02015-0 [DOI] [PMC free article] [PubMed] [Google Scholar]
- 11. Hawkins NA, Smith T, Zhao L, Rodriguez J, Berkowitz Z, Stein KD. Health‐related behavior change after cancer: results of the American Cancer Society's studies of cancer survivors (SCS). J Cancer Surviv. 2010;4(1):20‐32. doi: 10.1007/s11764-009-0104-3 [DOI] [PubMed] [Google Scholar]
- 12. Patterson RE, Neuhouser ML, Hedderson MM, Schwartz SM, Standish LJ, Bowen DJ. Changes in diet, physical activity, and supplement use among adults diagnosed with cancer. J Am Diet Assoc. 2003;103(3):323‐328. doi: 10.1053/jada.2003.50045 [DOI] [PubMed] [Google Scholar]
- 13. Shi Z, Rundle A, Genkinger JM, et al. Distinct trajectories of fruits and vegetables, dietary fat, and alcohol intake following a breast cancer diagnosis: the Pathways Study. Breast Cancer Res Treat. 2020;179(1):229‐240. doi: 10.1007/s10549-019-05457-9 [DOI] [PMC free article] [PubMed] [Google Scholar]
- 14. Gu Q, Dummer TBJ, Spinelli JJ, Murphy RA. Diet quality among cancer survivors and participants without cancer: a population‐based, cross‐sectional study in the atlantic partnership for tomorrow's health project. Nutrients. 2019;11(12):3027. doi: 10.3390/nu11123027 [DOI] [PMC free article] [PubMed] [Google Scholar]
- 15. American Institute for Cancer Research . Recommendations and Public Health and Policy Implications. World Cancer Research Fund. https://www.wcrf.org/wp‐content/uploads/2021/01/Recommendations.pdf
- 16. Martini D, del Bo’ C, Tassotti M, et al. Coffee consumption and oxidative stress: a review of human intervention studies. Molecules. 2016;21(8):979. doi: 10.3390/molecules21080979 [DOI] [PMC free article] [PubMed] [Google Scholar]
- 17. Urgert R, Katan MB. The cholesterol‐raising factor from coffee beans. Annu Rev Nutr. 1997;17(1):305‐324. doi: 10.1146/annurev.nutr.17.1.305 [DOI] [PubMed] [Google Scholar]
- 18. Ding M, Bhupathiraju SN, Chen M, van Dam RM, Hu FB. Caffeinated and decaffeinated coffee consumption and risk of type 2 diabetes: a systematic review and a dose‐response meta‐analysis. Diabetes Care. 2014;37(2):569‐586. doi: 10.2337/DC13-1203 [DOI] [PMC free article] [PubMed] [Google Scholar]
- 19. Ding M, Bhupathiraju SN, Satija A, van Dam RM, Hu FB. Long‐term coffee consumption and risk of cardiovascular disease. Circulation. 2014;129(6):643‐659. doi: 10.1161/CIRCULATIONAHA.113.005925 [DOI] [PMC free article] [PubMed] [Google Scholar]
- 20. Qi H, Li S. Dose‐response meta‐analysis on coffee, tea and caffeine consumption with risk of Parkinson's disease. Geriatr Gerontol Int. 2014;14(2):430‐439. doi: 10.1111/GGI.12123 [DOI] [PubMed] [Google Scholar]
- 21. Liu QP, Wu YF, Cheng HY, et al. Habitual coffee consumption and risk of cognitive decline/dementia: a systematic review and meta‐analysis of prospective cohort studies. Nutrition. 2016;32(6):628‐636. doi: 10.1016/j.nut.2015.11.015 [DOI] [PubMed] [Google Scholar]
- 22. Yu X, Bao Z, Zou J, Dong J. Coffee consumption and risk of cancers: a meta‐analysis of cohort studies. BMC Cancer. 2011;11:96. doi: 10.1186/1471-2407-11-96/FIGURES/9 [DOI] [PMC free article] [PubMed] [Google Scholar]
- 23. Kennedy OJ, Roderick P, Buchanan R, Fallowfield JA, Hayes PC, Parkes J. Coffee, including caffeinated and decaffeinated coffee, and the risk of hepatocellular carcinoma: a systematic review and dose–response meta‐analysis. BMJ Open. 2017;7(5):e013739. doi: 10.1136/BMJOPEN-2016-013739 [DOI] [PMC free article] [PubMed] [Google Scholar]
- 24. Farvid MS, Spence ND, Rosner BA, Willett WC, Eliassen AH, Holmes MD. Post‐diagnostic coffee and tea consumption and breast cancer survival. Br J Cancer. 2021;124(11):1873‐1881. doi: 10.1038/s41416-021-01277-1 [DOI] [PMC free article] [PubMed] [Google Scholar]
- 25. Poole R, Kennedy OJ, Roderick P, Fallowfield JA, Hayes PC, Parkes J. Coffee consumption and health: umbrella review of meta‐analyses of multiple health outcomes. BMJ. 2017;359:j5024. doi: 10.1136/bmj.j5024 [DOI] [PMC free article] [PubMed] [Google Scholar]
- 26. Vaz‐Luis I, Cottu P, Mesleard C, et al. UNICANCER: French prospective cohort study of treatment‐related chronic toxicity in women with localised breast cancer (CANTO). ESMO Open. 2019;4(5):e000562. doi: 10.1136/esmoopen-2019-000562 [DOI] [PMC free article] [PubMed] [Google Scholar]
- 27. Gusto G, Vol S, Bedouet M, et al. Good reproducibility and validity of a self‐administered questionnaire evaluating adherence to the French national nutrition and health program recommendations. Presse Med. 2013;42(7–8):e245‐e258. doi: 10.1016/J.LPM.2013.01.051 [DOI] [PubMed] [Google Scholar]
- 28. Hercberg S, Chat‐Yung S, Chauliac M. The French National Nutrition and Health Program: 2001‐2006‐2010. Int J Public Health. 2008;53:68‐77. doi: 10.1007/s00038-008-7016-2 [DOI] [PubMed] [Google Scholar]
- 29. Estaquio C, Kesse‐Guyot E, Deschamps V, et al. Adherence to the French Programme National Nutrition Santé Guideline Score is associated with better nutrient intake and nutritional status. J Am Diet Assoc. 2009;109(6):1031‐1041. doi: 10.1016/J.JADA.2009.03.012 [DOI] [PubMed] [Google Scholar]
- 30. Aaronson NK, Ahmedzai S, Bergman B, et al. The European Organization for Research and Treatment of Cancer QLQ‐C30: a quality‐of‐life instrument for use in international clinical trials in oncology. https://academic.oup.com/jnci/article/85/5/365/972260 [DOI] [PubMed]
- 31. Fayers PM, Aaronson NK, Bjordal K, et al. EORTC QLQ‐C30 Scoring Manual. 3rd ed. European Organisation for Research and Treatment of Cancer; 2001. https://www.eortc.org/app/uploads/sites/2/2018/02/SCmanual.pdf [Google Scholar]
- 32. Weis J, Tomaszewski KA, Hammerlid E, et al. International Psychometric Validation of an EORTC Quality of Life Module Measuring Cancer Related Fatigue (EORTC QLQ‐FA12). J Natl Cancer Inst. 2017;109(5):djw273. doi: 10.1093/jnci/djw273 [DOI] [PubMed] [Google Scholar]
- 33. Zigmond AS, Snaith RP. The Hospital Anxiety and Depression Scale. Acta Psychiatr Scand. 1983;67(6):361‐370. [DOI] [PubMed] [Google Scholar]
- 34. Gourgou‐Bourgade S, Cameron D, Poortmans P, et al. Guidelines for time‐to‐event end point definitions in breast cancer trials: results of the DATECAN initiative (Definition for the Assessment of Time‐to‐event End points in CANcer trials). Ann Oncol. 2015;26(5):873‐879. doi: 10.1093/annonc/mdv106 [DOI] [PubMed] [Google Scholar]
- 35. Nagin DS, Odgers CL. Group‐based trajectory modeling in clinical research. Ann Rev Clin Psychol. 2010;6:109‐138. doi: 10.1146/annurev.clinpsy.121208.131413 [DOI] [PubMed] [Google Scholar]
- 36. Nagin DS, Jones BL, Passos VL, Tremblay RE. Group‐based multi‐trajectory modeling. Stat Methods Med Res. 2018;27(7):2015‐2023. doi: 10.1177/0962280216673085 [DOI] [PubMed] [Google Scholar]
- 37. Rock CL, Doyle C, Demark‐Wahnefried W, et al. Nutrition and physical activity guidelines for cancer survivors. CA Cancer J Clin. 2012;62(4):242‐274. doi: 10.3322/caac.21142 [DOI] [PubMed] [Google Scholar]
- 38. Demark‐Wahnefried W, Aziz NM, Rowland JH, Pinto BM. Riding the crest of the teachable moment: Promoting long‐term health after the diagnosis of cancer. J Clin Oncol. 2005;23(24):5814‐5830. doi: 10.1200/JCO.2005.01.230 [DOI] [PMC free article] [PubMed] [Google Scholar]
- 39. Maunsell E, Drolet M, Brisson J, Robert J, Deschênes L. Dietary change after breast cancer: extent, predictors, and relation with psychological distress. J Clin Oncol. 2002;20(4):1017‐1025. doi: 10.1200/JCO.2002.20.4.1017 [DOI] [PubMed] [Google Scholar]
- 40. Velentzis LS, Keshtgar MR, Woodside JV, et al. Significant changes in dietary intake and supplement use after breast cancer diagnosis in a UK multicentre study. Breast Cancer Res Treat. 2011;128(2):473‐482. doi: 10.1007/s10549-010-1238-8 [DOI] [PubMed] [Google Scholar]
- 41. Fassier P, Zelek L, Lécuyer L, et al. Modifications in dietary and alcohol intakes between before and after cancer diagnosis: results from the prospective population‐based NutriNet‐Santé cohort. Int J Cancer. 2017;141(3):457‐470. doi: 10.1002/ijc.30704 [DOI] [PMC free article] [PubMed] [Google Scholar]
- 42. di Meglio A, Gbenou AS, Martin E, et al. Unhealthy behaviors after breast cancer: capitalizing on a teachable moment to promote lifestyle improvements. Cancer. 2021;127(15):2774‐2787. doi: 10.1002/cncr.33565 [DOI] [PubMed] [Google Scholar]
- 43. Santé Publique France . Recommendations concerning diet, physical activity and sedentary behaviour for adults. 2019. http://www.santepubliquefrance.fr/determinants‐de‐sante/nutrition‐et‐activite‐physique/documents/rapport‐synthese/
- 44. US Departments of Agriculture and Health and Human Services . Dietary Guidelines for Americans, 2020–2025. 9th ed. December 2020. Available at https://www.DietaryGuidelines.Gov
- 45. Lopez‐Garcia E, Guallar‐Castillon P, Leon‐Muñoz L, Graciani A, Rodriguez‐Artalejo F. Coffee consumption and health‐related quality of life. Clin Nutr. 2014;33(1):143‐149. doi: 10.1016/j.clnu.2013.04.004 [DOI] [PubMed] [Google Scholar]
- 46. Rehm CD, Ratliff JC, Riedt CS, Drewnowski A. Coffee consumption among adults in the united states by demographic variables and purchase location: analyses of nhanes 2011–2016 data. Nutrients. 2020;12(8):1‐13. doi: 10.3390/nu12082463 [DOI] [PMC free article] [PubMed] [Google Scholar]
- 47. Grosso G, Godos J, Galvano F, Giovannucci EL. Coffee, caffeine, and health outcomes: an umbrella review. Annu Rev Nutr. 2017;37:131‐156. doi: 10.1146/annurev-nutr-071816 [DOI] [PubMed] [Google Scholar]
- 48. van Dam RM, Hu FB, Willett WC. Coffee, Caffeine, and health. N Engl J Med. 2020;383(4):369‐378. doi: 10.1056/nejmra1816604 [DOI] [PubMed] [Google Scholar]
- 49. Lopez‐Garcia E, van Dam RM, Qi L, Hu FB. Coffee consumption and markers of inflammation and endothelial dysfunction in healthy and diabetic women. Am J Clin Nutr. 2006;84(4):888‐893. [DOI] [PubMed] [Google Scholar]
- 50. Kempf K, Herder C, Erlund I, et al. Effects of coffee consumption on subclinical inflammation and other risk factors for type 2 diabetes: a clinical trial. Am J Clin Nutr. 2010;91(4):950‐957. doi: 10.3945/ajcn.2009.28548 [DOI] [PubMed] [Google Scholar]
- 51. Jacobs S, Kröger J, Floegel A, et al. Evaluation of various biomarkers as potential mediators of the association between coffee consumption and incident type 2 diabetes in the EPIC‐Potsdam Study. Am J Clin Nutr. 2014;100(3):891‐900. doi: 10.3945/ajcn.113.080317 [DOI] [PubMed] [Google Scholar]
- 52. Clark I, Landolt HP. Coffee, caffeine, and sleep: A systematic review of epidemiological studies and randomized controlled trials. Sleep Med Rev. 2017;31:70‐78. doi: 10.1016/j.smrv.2016.01.006 [DOI] [PubMed] [Google Scholar]
- 53. Smith A. Effects of Caffeine on Human Behavior. Food Chem Toxicol. 2002;40(9):1243‐1255. doi: 10.1016/s0278-6915(02)00096-0 [DOI] [PubMed] [Google Scholar]
- 54. Lara DR. Caffeine, mental health, and psychiatric disorders. J Alzheimers Dis. 2010;20(suppl 1):S239‐S248. doi: 10.3233/JAD-2010-1378 [DOI] [PubMed] [Google Scholar]
- 55. Cornelis MC, Kacprowski T, Menni C, et al. Genome‐wide association study of caffeine metabolites provides new insights to caffeine metabolism and dietary caffeine‐consumption behavior. Hum Mol Genet. 2016;25(24):5472‐5482. doi: 10.1093/hmg/ddw334 [DOI] [PubMed] [Google Scholar]
- 56. Rogers PJ, Hohoff C, Heatherley SV, et al. Association of the anxiogenic and alerting effects of caffeine with ADORA2A and ADORA1 polymorphisms and habitual level of caffeine consumption. Neuropsychopharmacology. 2010;35(9):1973‐1983. doi: 10.1038/npp.2010.71 [DOI] [PMC free article] [PubMed] [Google Scholar]
- 57. Robertson D, Wade D, Workman R, Woosley RL, Oates JA. Tolerance to the humoral and hemodynamic effects of caffeine in man. J Clin Invest. 1981;67(4):1111‐1117. doi: 10.1172/jci110124 [DOI] [PMC free article] [PubMed] [Google Scholar]
- 58. Smith AP. Caffeine, cognitive failures and health in a non‐working community sample. Hum Psychopharmacol. 2009;24(1):29‐34. doi: 10.1002/hup.991 [DOI] [PubMed] [Google Scholar]
- 59. Lucas M, Mirzaei F, Pan A, et al. Coffee, Caffeine, and risk of depression among women. Arch Intern Med. 2011;171(17):1571‐1578. doi: 10.1001/archinternmed.2011.393 [DOI] [PMC free article] [PubMed] [Google Scholar]
- 60. Chen X, Lu W, Zheng Y, et al. Exercise, tea consumption, and depression among breast cancer survivors. J Clin Oncol. 2010;28(6):991‐998. doi: 10.1200/JCO.2009.23.0565 [DOI] [PMC free article] [PubMed] [Google Scholar]
- 61. Cadoná FC, Dantas RF, de Mello GH, Silva FP Jr. Natural products targeting into cancer hallmarks: an update on caffeine, theobromine, and (+)‐catechin. Crit Rev Food Sci Nutr Published online April. 2021;23:1‐20. doi: 10.1080/10408398.2021.1913091 [DOI] [PubMed] [Google Scholar]
- 62. Duggan C, Irwin ML, Xiao L, et al. Associations of insulin resistance and adiponectin with mortality in women with breast cancer. J Clin Oncol. 2011;29(1):32‐39. doi: 10.1200/JCO.2009.26.4473 [DOI] [PMC free article] [PubMed] [Google Scholar]
- 63. Pierce BL, Ballard‐Barbash R, Bernstein L, et al. Elevated biomarkers of inflammation are associated with reduced survival among breast cancer patients. J Clin Oncol. 2009;27(21):3437‐3444. doi: 10.1200/JCO.2008.18.9068 [DOI] [PMC free article] [PubMed] [Google Scholar]
- 64. Kuruto‐Niwa R, Inoue S, Ogawa S, Muramatsu M, Nozawa R. Effects of tea catechins on the ERE‐regulated estrogenic activity. J Agric Food Chem. 2000;48(12):6355‐6361. doi: 10.1021/jf0008487 [DOI] [PubMed] [Google Scholar]
- 65. Harris HR, Bergkvist L, Wolk A. Coffee and black tea consumption and breast cancer mortality in a cohort of Swedish women. Br J Cancer. 2012;107(5):874‐878. doi: 10.1038/bjc.2012.337 [DOI] [PMC free article] [PubMed] [Google Scholar]
- 66. Gapstur SM, Anderson RL, Campbell PT, et al. Associations of coffee drinking and cancer mortality in the cancer prevention study‐II. Cancer Epidemiol Biomarkers Prev. 2017;26(10):1477‐1486. doi: 10.1158/1055-9965.EPI-17-0353 [DOI] [PubMed] [Google Scholar]
- 67. Gunter MJ, Murphy N, Cross AJ, et al. Coffee drinking and mortality in 10 European countries: a multinational cohort study. Ann Intern Med. 2017;167(4):236‐247. doi: 10.7326/M16-2945 [DOI] [PMC free article] [PubMed] [Google Scholar]
- 68. Heckman MA, Weil J, de Mejia EG. Caffeine (1, 3, 7‐trimethylxanthine) in foods: a comprehensive review on consumption, functionality, safety, and regulatory matters. J Food Sci. 2010;75(3):R77‐R87. doi: 10.1111/j.1750-3841.2010.01561.x [DOI] [PubMed] [Google Scholar]
- 69. European Coffee Federation . European Coffee Report: 2011. Accessed March 5, 2022. https://www.ecf‐coffee.org/wp‐content/uploads/2020/09/European‐Coffee‐Report‐2011‐2012.pdf
- 70. Lehrer S, Green S, Rosenzweig KE. Coffee consumption associated with increased mortality of women with breast cancer. J Caffeine Res. 2013;3(1):38‐40. doi: 10.1089/jcr.2013.0001 [DOI] [PMC free article] [PubMed] [Google Scholar]
- 71. Harris HR, Bergkvist L, Wolk A. Coffee and black tea consumption and breast cancer mortality in a cohort of Swedish women. Br J Cancer. 2012;107(5):874‐878. doi: 10.1038/bjc.2012.337 [DOI] [PMC free article] [PubMed] [Google Scholar]
- 72. Simonsson M, Söderlind V, Henningson M, et al. Coffee prevents early events in tamoxifen‐treated breast cancer patients and modulates hormone receptor status. Cancer Causes Control. 2013;24(5):929‐940. doi: 10.1007/S10552-013-0169-1 [DOI] [PubMed] [Google Scholar]
Associated Data
This section collects any data citations, data availability statements, or supplementary materials included in this article.
Supplementary Materials
Figure S1‐S5 Supporting Information
Appendix S1 Table S1‐S12 Supporting Information
Data Availability Statement
Upon request to Unicancer R&D, data will be available.