

Abstract
Therapy‐related myeloid neoplasms (t‐MN) are aggressive malignancies in need of effective therapies. The BCL‐2 inhibitor venetoclax represents a paradigm shift in the treatment of acute myeloid leukemia. However, the effectiveness of venetoclax has not been studied in a large cohort of t‐MN. We retrospectively analyzed 378 t‐MN patients, of which 96 (25.4%, 47 therapy‐related acute myeloid leukemia, 1 therapy‐related chronic myelomonocytic leukemia, 48 therapy‐related myelodysplastic syndrome) received venetoclax. Median interval from t‐MN to venetoclax initiation was 2.9 (Interquartile range [IQR] 0.7–12) months, and patients received a median of 3 (IQR 1–4) cycles. The composite complete remission (CRc) rate, median progression‐free survival (PFS), and overall survival (OS) were 39.1%, 4.9 months, and 7 months, respectively. The upfront use of venetoclax and achieving CRc were associated with improved survival, whereas the presence of Chromosome 7 abnormalities was associated with an inferior survival. Neither the TP53‐status nor the percent bone marrow blast predicted the likelihood of CRc or survival. Paired genetic analysis performed at venetoclax initiation and failure did not show the evidence of the selection of the TP53‐mutated clone. In a propensity‐matched analysis, the use of venetoclax‐based regimen as the first‐line therapy was associated with a superior survival compared to hypomethylating agent (HMA)‐based first‐line therapy (9.4 vs. 6.1 months, p = .01). We conclude that the upfront use of venetoclax with HMA improved survival, though PFS and OS remain poor. As the phenotype at diagnosis or the percent blasts did not predict outcomes, venetoclax should be studied in all t‐MN phenotypes.
1. INTRODUCTION
With improvement in cancer care, the number of cancer survivors—currently estimated at 17 million in the US—is expected to rise. Although this is a welcome trend, it has brought to attention the long‐term complications of DNA‐damaging therapies. Especially devastating is a complication known as therapy‐related myeloid neoplasms (t‐MN). Morphologically, t‐MN can further be classified into therapy‐related myelodysplastic syndrome (t‐MDS), t‐MDS/myeloproliferative neoplasm (t‐MDS/MPN), or therapy‐related acute myeloid leukemia (t‐AML). It is an aggressive leukemia, frequently harboring high‐risk features such as Chromosomes 5, 7, and 17 abnormalities, complex karyotype (CK), monosomal karyotype (MK), and the loss of TP53 function. With no effective therapies, survival following the diagnosis is <1 year, suggesting an urgent need for effective therapeutic strategies. 1 , 2
In newly diagnosed AML, BCL2‐inhibitor venetoclax, in combination with hypomethylating agent (HMA) 5‐azacitidine, led to improved survival compared to HMA alone, 3 though t‐AML constituted only 8% of the cohort and t‐MDS patients were not included. Two studies of t‐AML patients noted a wide range of survival (3.5–15.9 months). 4 , 5 The outcome of venetoclax‐based therapy in t‐MDS, the ideal backbone of chemotherapy, and its impact on outcomes have not been studied. Moreover, the predictors of response to and survival following venetoclax‐based therapy in t‐MN were not studied. Finally, the mechanism of resistance to venetoclax in t‐MN is unknown.
To address this knowledge gaps, we retrospectively analyzed a multicenter international cohort of t‐MDS, t‐MDS/MPN, and t‐AML patients treated with venetoclax‐based regimens. We studied the predictors of response and outcomes using venetoclax‐based regimens. Using paired cytogenetic and next‐generation sequencing (NGS) analysis, we studied the mechanism of resistance to venetoclax in t‐MN.
2. METHODS
This retrospective multicenter study conducted at Mayo Clinic, Rochester (USA), South Australian Local Health Network (South Australia, Australia), and the Alfred Hospital (Melbourne, Victoria; Australia). Following appropriate regulatory approvals at the respective institute, we identified all WHO‐defined t‐MN patients that received venetoclax‐based therapy. Cytogenetics and NGS analyses for a panel of genes known to drive myeloid malignancies were performed using bone marrow samples at t‐MN diagnosis, prior to the initiation of venetoclax, and at venetoclax failure. Details of NGS analysis is provided in Supplementary Methods (Data S1). Response to venetoclax was assessed using the International Working Group criteria for t‐MDS 6 and 2017 European LeukemiaNet 7 criteria for t‐AML patients. Composite complete remission (CRc) was defined as complete remission (CR) or hematological improvement (HI) for MDS and CR or complete remission with incomplete hematologic recovery (CRi) for AML. In a subset of patients treated at Mayo Clinic who achieved morphologic remission (<5% bone marrow [BM] blasts), minimal residual disease (MRD) was assessed by multiparameter flow cytometry (sensitivity 0.1%).
The statistical analysis for continuous and categorical variable were performed using Mann–Whitney test and chi‐squared test, respectively. Progression‐free survival (PFS) was calculated from the time of venetoclax initiation to progression of the disease, the utilization of the next line of therapy, or death due to t‐MN. Patients undergoing allogeneic stem cell transplant (SCT) were censored at the time of SCT. Overall survival (OS) was calculated from the time of venetoclax to the last follow up or death, whichever came first. The Kaplan–Meier was used to estimate the OS and PFS and the statistical analysis was performed using log‐rank test.
Logistic regression analyses for CRc, PFS, and OS were performed using univariate and multivariate analysis. Factors included in the univariate analysis are described in Supplementary Methods (Data S1). The multivariate logistic regression was performed using all significant variables for composite complete remission achievement. The final multivariate analysis for CR was also confirmed by both backward and forward selection method. Multivariate Cox proportional hazard analysis was performed using all significant variables for survival outcomes (PFS and OS). The final multivariate analysis for PFS and OS were confirmed by backward selection method.
To compare outcomes for patients treated with HMA or venetoclax as the first line, we implemented the propensity score matching method 8 with an aim to obtain comparable subpopulations matched for age, t‐MN phenotype at diagnosis, the presence of CK, and the utilization of SCT. This was followed by univariate comparison of the matched groups for OS and PFS.
The statistical analysis was performed using R statistical software (Version 4.1.1., Vienna, Austria) Graphs were prepared using BlueSky (Version 7, Chicago, IL, USA) and GraphPad Prism (Version 9, San Diego, CA, USA).
3. RESULTS
3.1. Patient characteristics
Of 378 t‐MN patients (Table S1), 96 (25.4%) received venetoclax‐based regimens. Median age, hemoglobin, white blood cells, and platelets at t‐MN diagnosis were comparable between the two cohorts. Higher proportion receiving venetoclax had t‐AML phenotype (49% vs. 32.6%; p = .002), high‐risk cytogenetics abnormalities at t‐MN diagnosis, including Chromosome 17 abnormalities (38.9% vs. 18.1%, p < .001), CK (63.2% vs. 45.5%, p = .004), and MK (60.6% vs. 45.1%, p = .012). The proportion of patients with TP53 somatic pathogenic variant (PV) did not differ between the two cohorts (50.6% vs. 37.6%, p = .067). Patient characteristics stratified by the use of venetoclax as the first line or as subsequent lines are shown in Table S2. Patients who received venetoclax as the first line were older, more likely to present with t‐AML and were less likely to have Chromosome 17 abnormality or CK.
Clinical characteristics of the venetoclax cohort is shown (Figure 1A ). Median interval from t‐MN diagnosis to the initiation of venetoclax was 2.9 months (IQR 0.7–12; Table S3). Patients had received a median of 0 (IQR 0–1) lines of prior therapy with 31 (32.3%) having received a prior HMA. Of the 23 (24%) patients who underwent SCT, 8 received venetoclax pre‐SCT, 11 post‐SCT, and 4 both pre‐ and post‐SCT. Ten out of 11 patients who received venetoclax post‐SCT, received it for relapsed t‐MN, whereas one patient received it as maintenance. Median exposure to venetoclax was three cycles (IQR 1–4). Accompanying chemotherapeutic agents were HMA 74 (77.1%), low‐dose cytarabine (LDAC) 14 (14.6%), multiple/other 4 (4.2%), or none 4 (4.2%). Of 74 patients who received HMA 41 (55%) received 5‐azacitidine, 30 (4%) received decitabine, and 3 (4%) received both.
FIGURE 1.
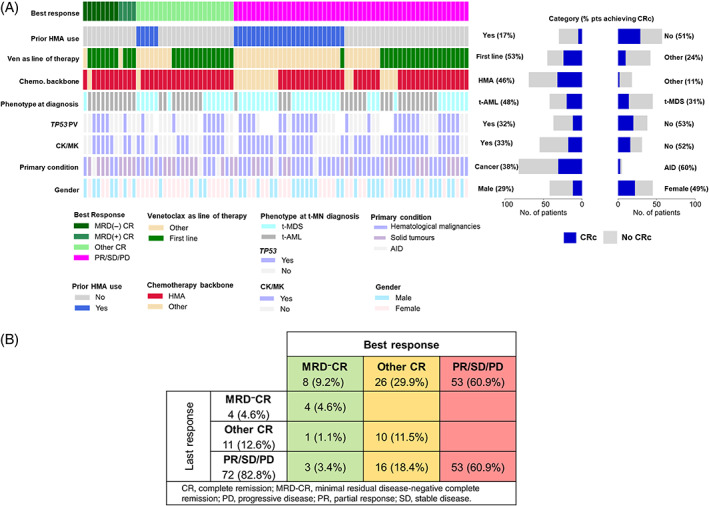
(A) Clinical, genetic, and cytogenetic characteristics of therapy‐related myeloid neoplasm (t‐MN) patients treated with venetoclax. White color denotes data not available; (B) the best and the last response to venetoclax in t‐MN [Color figure can be viewed at wileyonlinelibrary.com]
3.2. Response assessment following venetoclax therapy
Paired best and last response were available for 87 (90.6%) patients. CRc rate was 39.1% (Figure 1B ). At the last follow‐up, 4 (4.6%) and 11 (12.6%) patients remained in MRD− CR and other CR, respectively, with a CRc of 17.2% and 72 (82.8%) had progressive disease. At least one MRD assessment was available for 15 patients achieving CRc, of which 9 (60%) achieved MRD‐negativity.
Factors associated with the likelihood of achieving CRc are shown (Table 1 ). Notably, a higher proportion of patients achieved CRc when venetoclax was used as the first line compared to second or subsequent line of therapy (55% vs. 23%, p = .005). Upon stepwise multivariate analysis, prior use of HMA was the only factor predicting a lower likelihood of achieving CRc (OR 0.19, p = .003).
TABLE 1.
Univariate and multivariate analyses for composite complete remission, progression‐free survival, and overall survival
| Variables | Univariate analysis | Multivariate | ||||
|---|---|---|---|---|---|---|
| OR | 95% CI | p‐value | OR | 95% CI | p‐value | |
| Composite complete remission | ||||||
| Prior HMA therapy (vs. not) | 0.18 | 0.001 | .05 | 0.24 | 0.01–0.98 | .05 |
| Primary hematological malignancy (vs. solid tumor) | 2.56 | 1.06–6.4 | .04 | 2.38 | 0.87–6.73 | .094 |
| t‐MDS at diagnosis (vs. t‐AML) | 2.35 | 1.01–5.6 | .05 | 1.20 | 0.42–3.30 | .730 |
| Accompanying chemotherapy HMA (vs. others) | 0.33 | 0.09–0.93 | .05 | 0.35 | 0.09–1.14 | .095 |
| Venetoclax as the first line of therapy (vs. other) | 0.29 | 0.11–0.68 | .005 | 0.94 | 0.28–3.16 | .924 |
| Progression‐free survival | ||||||
| Best response with venetoclax no CRc (vs. CRc) | 6.39 | 3.47–11.8 | <.001 | 5.34 | 2.78–10.2 | <.001 |
| Chromosome 7 abnormality at venetoclax initiation (vs. not) | 1.69 | 1.05–2.71 | .03 | 2.06 | 1.21–3.47 | .007 |
| Prior HMA therapy (vs. not) | 2.35 | 1.45–3.8 | <.001 | 1.03 | 0.51–2.06 | .942 |
| Venetoclax as the first‐line therapy (vs. other) | 0.48 | 0.3–0.78 | .002 | 0.71 | 0.35–1.40 | .319 |
| Accompanying chemotherapy HMA (vs. others) | 0.5 | 0.3–0.85 | .011 | 0.87 | 0.49–1.54 | .638 |
| Prior radiation (vs. not) | 0.61 | 0.38–0.98 | .04 | 0.61 | 0.36–1.04 | .07 |
| Overall survival | ||||||
| Best response with venetoclax no CRc (vs. CRc) | 9.52 | 4.47–20.3 | <.001 | 8.20 | 3.20–21.0 | <.001 |
| Venetoclax as the first‐line therapy (vs. other) | 0.3 | 0.23–0.63 | <.001 | 0.33 | 0.12–0.86 | .025 |
| Monosomy 17 at venetoclax initiation (vs. not) | 2.08 | 1.08–4.02 | .029 | 1.66 | 0.74–3.73 | .217 |
| PV in TP53 (vs. not) | 1.8 | 1–3.23 | .048 | 1.75 | 0.79–3.86 | .168 |
| Prior HMA therapy (vs. not) | 2.84 | 1.69–4.79 | <.001 | 1.10 | 0.42–2.81 | .847 |
| Accompanying chemotherapy HMA (vs. others) | 0.42 | 0.24–0.78 | .002 | 1.12 | 0.44–2.83 | .805 |
Abbreviations: CI, confidence interval; CRc, composite complete remission; HMA, hypomethylating agent; HR, hazard ratio; OR, odds ratio; PV, pathogenic variant; t‐AML, therapy‐related acute myeloid leukemia; t‐MDS, therapy‐related myelodysplastic syndrome.
3.3. Outcomes following venetoclax therapy
Median PFS and OS from venetoclax initiation was 4.9 and 7 months, respectively (Figure 2A,B ). The factors‐associated improved PFS are shown in Table 1. Upon multivariate analysis, the presence of Chromosome 7 abnormalities (4.3 vs. 5.3 months, p = .03) and not achieving CRc (2.2 vs. 10.1 months, p < .001) were associated with an inferior PFS (Figure 2C,E ). Moreover, multivariate analysis of the variables that are available at the time of venetoclax initiation (i.e., excluding the response status) showed that venetoclax as the first line (hazard ratio [HR] 0.42, p = .0005), the presence of Chromosome 7 abnormalities (HR 2.1, p = .005), and history of prior radiotherapy (HR 0.4, p = .005) significantly influenced PFS.
FIGURE 2.
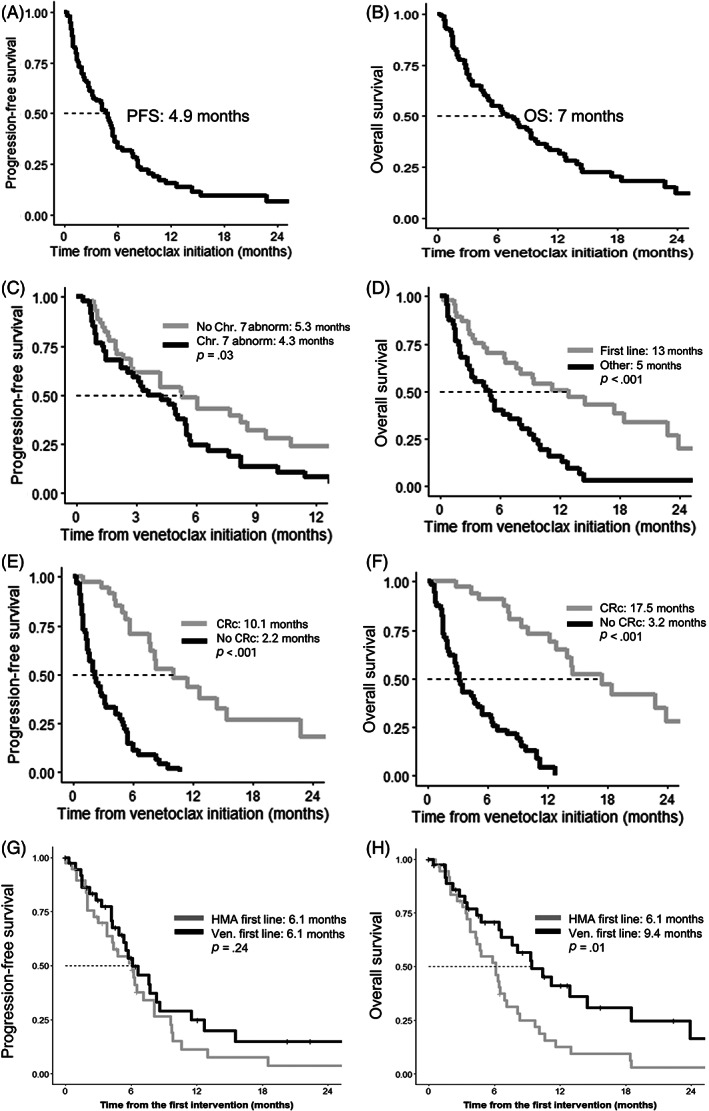
(A) Progression‐free (PFS) from the initiation of venetoclax; (B) PFS as stratified by the presence of Chromosome 7 abnormality at venetoclax initiation; and (C) PFS as stratified by the best response achieved with venetoclax. (D) Overall survival (OS) calculated from the initiation of venetoclax; (E) as stratified by venetoclax as the line of therapy; (F) best response achieved with venetoclax; (G) PFS stratified by the first‐line hypomethylating agents (HMA) or venetoclax‐based therapy; and (H) OS stratified by the first‐line HMA or venetoclax‐based therapy. CRc, composite complete remission
Predictors of an inferior OS included the presence of monosomy 17 at venetoclax initiation, PV in TP53, prior HMA therapy, non‐HMA backbone, the use of venetoclax other than the first‐line therapy, and not achieving CRc as the best response with venetoclax. Multivariate analysis showed that using venetoclax as a subsequent line of therapy (5 vs. 13 months, p < .001,) and not achieving CRc (3.2 vs. 17.5 months, p < .001) were associated with an inferior OS (Figure 2D,F ). When the patients achieving CRc were further stratified based on the depth of response (i.e., MRD− vs. other), PFS and OS did not differ (Figure S1). Furthermore, multivariate analysis of the variables that are available at the time of venetoclax initiation showed that venetoclax as the first line of therapy (HR 0.23, p < .001) and the presence of TP53 PV (HR 2.34, p = .005) independently predicted OS.
In treatment‐naïve AML, the presence of TP53 PV is associated with a lower likelihood of CRc, shorter PFS, and OS. 9 In contrast, in t‐MN, the TP53 status did not predict the likelihood of achieving CRc or PFS, but was associated with a shorter OS from the time of venetoclax initiation on univariate analysis (Figure S2). On multivariate analysis, TP53 status did not predict CRc, PFS, or OS. Next, we asked if monoallelic versus biallelic TP53 loss had a differential impact on response to venetoclax. Fourteen patients had biallelic TP53 loss, defined as 2 TP53 PV and/or 1 TP53 PV +17p loss); whereas 23 had monoallelic TP53 loss. PFS and OS from the initiation of venetoclax were not different between these two cohorts, though analysis is limited by a small sample size. The presence of RAS PV did not predict PFS, though there was a trend toward an inferior survival in patients with RAS PV compared to RAS‐wt (3.3 vs. 8.2 months, p = .05). On the other hand, the presence of IDH1/2 PV did not predict PFS or OS (Figure S3).
Finally, the likelihood of achieving CRc, PFS, or OS did not differ by the phenotype at diagnosis (t‐MDS vs. t‐AML, data not shown) or the percentage of bone marrow blasts (<20% vs. ≥20%) at venetoclax initiation (Figure S4).
3.4. Comparison of outcomes with the first‐line HMA versus venetoclax‐based therapies
A propensity score‐matched analysis was performed on a subset of 38 patients that received venetoclax‐based therapies in the first line compared to 38 patients who received HMA as the first‐line treatment. Following propensity matching, the clinical characteristics noted in Section 2 were proportionally distributed between the two cohorts (Figure S5). Although PFS was not different when stratified by HMA or venetoclax‐based first line of therapy (6.1 vs. 6.1 months, p = .24, Figure 1G ), the overall survival was improved with the use of first‐line venetoclax (9.4 vs. 6.1 months, p = .01, Figure 1H ). Among the patients who received HMA or venetoclax as the first line of therapy, 15 patients underwent allogeneic SCT during their treatment course. The proportion of patients proceeding to SCT was similar (19% for HMA first line and 20% for venetoclax first line), suggesting that the utilization of allogeneic SCT is unlikely to explain the survival difference observed.
3.5. Mechanism of resistance to venetoclax
Paired cytogenetic analysis before and at venetoclax resistance were available for 36 patients: 12 (33%) had no change, whereas 24 (67%) showed clonal evolution (Table S4). The proportion of patients with clonal evolution was not different when stratified by if venetoclax was used as the first or subsequent line of therapy (p = .35).
Paired NGS before and at venetoclax resistance was available for 24 patients: 12 (50%) had evidence of clonal evolution on NGS (Table 2). Six of 7 variants acquired were in the signaling kinase pathways (KIT, FLT3, NRAS, or KRAS). A significantly higher proportion of patients (67% vs. 7%, p = .004) had emergence of a signaling kinase mutation when venetoclax was used as a subsequent line of therapy compared to when used as the first line.
TABLE 2.
Paired next‐generation sequencing at the initiation of and the time of progression on venetoclax in therapy‐related myeloid neoplasm patients
| No. | UPIN | Gender | VEN. as the line‐of‐therapy | Best response to venetoclax | % Bone marrow blasts in the context of VEN. | Next‐generation sequencing (NGS) in the context of VEN (gene [%VAF]) | NGS summary | Cytogenetics summary | ||
|---|---|---|---|---|---|---|---|---|---|---|
| At initiation | At prog. | At initiation | At progression | |||||||
| 1 | 1014 | Female | First line | Other CR | 80 | 2 | BCOR (26), IDH1 (37), WT1 (68) | BCOR (22), IDH1 (30), WT1 (52) | No change | Clonal evolution |
| 2 | 1042 | Female | First line | PR/SD/PD | 15 | Focal CD34 | TP53 (88) | TP53 (45) | No change | Clonal evolution |
| 3 | 1043 | Female | First line | Other CR | 93 | CEBPA (44), DNMT3A (47), TET2 (46), TET2 (42) | CEBPA (49), DNMT3A (50), KIT (45) | Emergence of KIT | No change | |
| 4 | 1230 | Male | First line | PR/SD/PD | 22 | 13 | DNMT3A (10), DNMT3A (34), RUNX1 (10), TET2 (27) | DNMT3A (16), DNMT3A (38), RUNX1 (33), TET2 (33) | No change | Clonal evolution |
| 5 | 1240 | Female | First line | Other CR | 28 | NA | CBL, SRSF2, TET2 | None | CBL, SRSF2, and TET2 not detected | Clonal evolution |
| 6 | 1259 | Male | First line | PR/SD/PD | 4 | 2 | TP53 (96) | None | TP53 not detected | Clonal evolution |
| 7 | 1273 | Male | First line | PR/SD/PD | 0 | Dry tap | TP53 (14), SRSF2 (21) | None | TP53 and SRSF2 not detected | |
| 8 | 1274 | Female | First line | Other CR | NA | 1 | None | None | No change | No change |
| 9 | 2009 | Male | First line | Other CR | 70 | 0 | IDH2 (29), SRSF2 (23) | IDH2 (44) a | No change | |
| 10 | 2017 | Female | First line | Other CR | 15 | 30 | TP53 (69) | None | TP53 not detected | Clonal evolution |
| 11 | 2022 | Male | First line | PR/SD/PD | 25 | 50 | TP53 (31), TP53 (32) | TP53 (40), TP53 (37) | No change | |
| 12 | 2029 | Female | First line | PR/SD/PD | 2 | 2 | ASXL1 (36), RUNX1 (41), EZH2 (41), NRAS (42), STAG2 (87) | ASXL1 (35), RUNX1 (41), EZH2 (39), NRAS (41), STAG2 (80) | No change | No change |
| 13 | 2033 | Female | First line | PR/SD/PD | 47 | 52 | None | None | No change | Clonal evolution |
| 14 | 2037 | Male | First line | PR/SD/PD | 30 | 18 | TP53 (89) | TP53 (84) | No change | Clonal evolution |
| 15 | 2432 | Female | First line | PR/SD/PD | 10 | 23 | TP53 (74), DNMT3A (38) | TP53 (71), DNMT3A (51) | No change | No change |
| 16 | 1031 | Male | Other | PR/SD/PD | 7 | 13 | TP53 (39), TP53 (37) | TP53 (43), TP53 (42) | No change | Clonal evolution |
| 17 | 1075 | Male | Other | PR/SD/PD | 83 | 95 | FLT3‐wild type b , c | FLT3‐TKD (9) b | Emergence of FLT3‐TKD | No change |
| 18 | 1108 | Female | Other | PR/SD/PD | 58 | 65 | IDH2 (47), RUNX1 (28), SRSF2 (37) | FLT3‐ITD (35%, AR 0.5), IDH2 (47), RUNX1 (37) | Emergence of FLT3‐ITD | No change |
| 19 | 1114 | Female | Other | PR/SD/PD | 60 | 54 | None a | RUNX1 (50) | Emergence of RUNX1 | No change |
| 20 | 1164 | Female | Other | PR/SD/PD | 8 | 13 | None d | DNMT3A (37), IDH1 (34), NRAS (20), PHF6 (38), RUNX1 (38) | Reemergence of the original clone + NRAS, RUNX1 | Clonal evolution |
| 21 | 1243 | Female | Other | Other CR | 40 | 50 | TP53 (9) | TP53‐wt b | TP53 not detected | Clonal evolution |
| 22 | 2007 | Female | Other | Other CR | 30 | 18 | None | None a | No change | No change |
| 23 | 2023 | Female | Other | PR/SD/PD | 9 | 80 | None | FLT3‐TKD D835Y (9), FLT3‐TKD D835V (24) | Emergence of FLT3‐TKD x2 | Clonal evolution |
| 24 | 2031 | Female | Other | MRD+ CR | 45 | 19 | None | KRAS (42) | Emergence of KRAS | Clonal evolution |
Abbreviations: AR, allelic ratio; CR, complete remission; D, aspartic acid; MRD, minimal residual disease; PD, progressive disease; PR, partial response; prog., progression; SD, stable disease; UPIN, unique patient identification number; V, valine; VAF, variance allele frequency; VEN., venetoclax; Y, tyrosine.
Four‐genes assessed (FLT3, IDH1, IDH2, TP53).
Single‐gene test.
DNMT3A, IDH1, PHF6 at t‐MN diagnosis.
DNTMA, SRSF2, TET2, TET2 at t‐MN diagnosis.
We also assessed the role of TP53 PV on outcomes of venetoclax‐treated patients. At venetoclax initiation, 40 (50.6%) of 79 evaluable patients had PV in TP53. TP53 status did not predict the likelihood of CRc, PFS, or OS. The analysis of the paired samples at venetoclax initiation and failure showed two patterns: first, no patients acquired PV in TP53 at venetoclax failure, and second, the variance allele frequency of TP53 did not change significantly at resistance.
4. DISCUSSION
Despite improved understanding of the biology and pathogenesis, the current treatment landscape of t‐MN remains highly unsatisfactory. HMAs—long considered to be a cornerstone for treatment of high‐risk MDS and unfit AML patients—do not substantially improve outcomes in t‐MN. 10 , 11 , 12 Similarly, while SCT remains the “gold standard” modality, <20% patients are able to undergo SCT and outcomes following SCT remain sobering. 12 , 13 , 14 As opposed to relatively homogenous entity of AML, t‐MN is a clinicopathological entity encompassing t‐MDS, t‐MDS/MPN, and t‐AML. Therefore, there is an urgent need to assess the role of novel agents.
BCL2‐inhibitor venetoclax is approved for newly diagnosed AML patients unfit for intensive chemotherapy as well as in relapsed/refractory AML. In previously untreated AML patients, the addition of venetoclax to 5‐azacitidine or LDAC results in OS of 10.1–14.7 months. 3 , 15 In a subset analysis, t‐AML patients received a median of five cycles of venetoclax with a median OS of 16.9 months. 5 In contrast, in a retrospective study, median OS following venetoclax was 3.5 months when used as a subsequent line of therapy. 4
Here, we assessed the efficacy, outcomes, and mechanism of resistance to venetoclax‐based therapies in t‐MN. In the largest multinational cohort of t‐MN patients that included 50% t‐MDS patients, CRc rate was 39.1%. Thus, CRc rate was lower than de novo (54%–66.4%) 3 , 15 as well as t‐AML (61%). 5 Despite the initial response, progression was seen in a majority of cases and median PFS and OS in our cohort compared unfavorably to the published data in de novo AML. 3 , 15 A possible explanation of this observation is the higher proportion of high‐risk t‐MN disease biology. Our cohort consisted of 63.2% and 50.6% patients with CK and TP53 PV, compared to 16% and 13%, respectively, in de novo AML. 16 Other potential confounder is that, unlike the landmark study, t‐MDS patients were included. However, the phenotype at diagnosis (t‐MDS vs. t‐AML) or percentage bone marrow blasts (≥20% vs. <20%) at the initiation of venetoclax was not associated with differential CRc rate, PFS, or OS. In the de novo AML study, venetoclax was used as the first‐line therapy. Whereas, in our study, it was used as the first as well as a subsequent line of therapy. The upfront use resulted in a higher CRc rate (55% vs. 23%, p = .005), PFS (6.1 vs. 2.7 months, p = .01), and OS (13 vs. 5 months, p < .001). Moreover, propensity‐matched analysis controlling for age, t‐MN phenotype at diagnosis, the presence of CK, and the utilization of SCT, showed that median OS was significantly superior among those receiving the first‐line venetoclax‐based therapy (9.4 vs. 6.1 months) compared to the first‐line HMA therapy. Combined, our results support prior observations that earlier use of venetoclax may improve survival in t‐MN.
Our understanding of the mechanisms of resistance to venetoclax is rapidly evolving. 17 The presence of NPM1 or IDH2 PV may predict sensitivity to venetoclax‐based therapy in de novo AML, whereas IDH1/2 or NPM1 were not associated with differential response to venetoclax in our cohort. On the other hand, the emergence of activating mutations in signaling kinases (such as FLT3‐ITD) and biallelic TP53 loss were noted at the time of acquired resistance. Using paired cytogenetic and NGS analyses at venetoclax initiation and failure, we noted that the acquisition of mutations in signaling kinases was a common mechanism of resistance–especially when venetoclax was used as a subsequent line of therapy. Our observations lend credence to evaluating the addition of FLT3‐inhibitors to venetoclax in both FLT3‐mutated and wild‐type patients, especially in previously treated t‐MN. 18 , 19 , 20
Finally, TP53 status is a known adverse risk factor in almost all the known malignancies, including MDS, AML, and t‐MN. 1 , 13 , 21 Biallelic TP53 loss is associated with a more aggressive phenotype and an inferior survival in MDS, but not AML. 22 , 23 In newly diagnosed AML, the likelihood of CRc, duration of response, and survival were inferior in those with TP53 PV. 9 Moreover, the acquisition of TP53 alteration was associated with venetoclax failure. In our cohort, 50.6% of patients who received venetoclax, harbored TP53 mutations and the likelihood of CRc, PFS, or OS did not differ based on TP53‐status. In contrast to de novo AML, we did not find clear evidence of the selection of the TP53‐mutated clone as a mechanism of venetoclax resistance in t‐MN. Whether these differences are due to differences in the cohort characteristics, the presence of other high‐risk features (e.g., complex cytogenetics), or due to the uniqueness of the t‐MN biology is not known. Ultimately, dedicated studies of targeted agents such as APR‐246 and nontargeted approaches such as CD47 blockade in t‐MN will be needed to improve the outcomes of these patients. 24
Limitations of our study are that of multicenter retrospective studies. Venetoclax was used in diverse contexts and the disease and response assessments—including MRD assessment—were obtained at the treating physician's discretion. Second, pre‐ and post‐venetoclax cytogenetics and NGS was available in a subset of patients. Third, PPM1D that has a well‐known association with t‐MN 25 ; as well as CUX1, 26 recently described to be a gatekeeper in t‐MN pathogenesis, were not assessed. Majority of patients received therapy locally, due to which reliable dosing and safety information was not available. Finally, the strength of the study is the inclusion of both t‐MDS and t‐AML. However, given the heterogeneity, the outcomes cannot be directly compared with the published literature on AML. Therefore, these observations will need to be confirmed in a larger prospective cohort.
In the largest cohort of t‐MN that included both t‐MDS and t‐AML patients, the upfront use of venetoclax with HMA improved survival with CRc rate and OS comparable to the de novo experience. As the phenotype at diagnosis or the percent blasts did not predict response or outcomes, venetoclax should be studied in all the subtypes of t‐MN. Finally, given the unique biology, t‐MN may represent a novel model to study the mechanism of resistance to venetoclax.
AUTHOR CONTRIBUTIONS
Mithun Vinod Shah and Devendra Hiwase designed the study. Mithun Vinod Shah, Rakchha Chhetri, Ruchita Dholakia, and Chung H. Kok collated the data and performed statistical analysis; Chung H. Kok performed statistical analysis; Mithun Vinod Shah, Naseema Gangat, Hassan B. Alkhateeb, Aref Al‐Kali, Mrinal M. Patnaik, Anmol Baranwal, Kebede H. Begna, Ing Soo Tiong, Andrew H. Wei, and Devendra Hiwase contributed patients; Patricia T. Greipp acquired samples for NGS and performed cytogenetic analysis; Rong He acquired performed NGS analysis; Mithun Vinod Shah and Devendra Hiwase drafted the manuscript, and all authors agree to the final version of the manuscript.
CONFLICT OF INTERESTS
Aref Al‐Kali—Research support to institution: Novartis, Astex. Mrinal M. Patnaik—Membership on an entity's Board of Directors or advisory committees (Stemline Therapeutics) and Research funding (Kura Oncology). Patricia T. Greipp—Membership on an entity's advisory board (AbbVie). Andrew H. Wei—Membership on an entity's Board of Directors or advisory committees, Research Funding and Speakers Bureau (Janssen, AbbVie, Novartis, Amgen, Servier, Macrogenics, Pfizer, Celgene/BMS, Agios, Astra Zeneca, Roche, Genentech, Astellas, Gilead). Devendra Hiwase—Membership on an entity's Board of Directors or advisory committees (AbbVie, Novartis). All other authors declare no conflict of interest.
Supporting information
FIGURE S1 (i) Progression‐free and (ii) overall survival as stratified by the best response achieved with venetoclax.
FIGURE S2 (i) Progression‐free and (ii) overall survival as stratified by the presence of pathogenic variant in TP53.
FIGURE S3 (i) Progression‐free survival (PFS) stratified by the presence of pathogenic variant in RAS; (ii) overall survival (OS) stratified by the presence of pathogenic variant in RAS; (iii) PFS stratified by the presence of pathogenic variant in IDH1/2; (iv) OS stratified by the presence of pathogenic variant in IDH1/2.
FIGURE S4 (i) the likelihood of achieving complete remission; (ii) progression‐free and (ii) overall survival as stratified by the percentage of bone marrow blasts at the initiation of venetoclax
FIGURE S5 (i) Distribution of propensity scores and (ii) covariate balance of t‐MN patients who received first‐line venetoclax‐based therapies (treated) and hypomethylating agent based (control units).
TABLE S1 Characteristics of therapy‐related myeloid neoplasm patients treated with venetoclax compared to those who did not receive venetoclax.
TABLE S2 Characteristics of therapy‐related myeloid neoplasm patients who received venetoclax as first line compared to as subsequent‐line therapy.
TABLE S3 Characteristics of venetoclax use in therapy‐related myeloid neoplasms
TABLE S4 Paired cytogenetic analysis before and following progression on venetoclax therapy (attached Microsoft Excel file).
DATA S1 Supplementary methods
ACKNOWLEDGMENTS
We are grateful to our patients and their families. Mithun Vinod Shah was supported by Paul Calabresi Program in Clinical/Translational Research at Mayo Clinic (K12CA090628); Leukemia Research Foundation New Investigator Award; and Bridget Kiely Clinician Career Development in Transplant Research. Devendra Hiwase was supported by Investigator Grant, NHMRC/MRFF and Cancer Australia. Open access publishing facilitated by The University of Adelaide, as part of the Wiley ‐ The University of Adelaide agreement via the Council of Australian University Librarians.
Shah MV, Chhetri R, Dholakia R, et al. Outcomes following venetoclax‐based treatment in therapy‐related myeloid neoplasms. Am J Hematol. 2022;97(8):1013‐1022. doi: 10.1002/ajh.26589
Funding information Investigator Grant, NHMRC/MRFF and Cancer Australia; Bridget Kiely Clinician Career Development in Transplant Research; Leukemia Research Foundation New Investigator Award; Paul Calabresi Program in Clinical/Translational Research at Mayo Clinic, Grant/Award Number: K12CA090628
Contributor Information
Mithun Vinod Shah, Email: shah.mithun@mayo.edu.
Devendra Hiwase, Email: devendra.hiwase@sa.gov.au.
DATA AVAILABILITY STATEMENT
The data are not publicly available due to privacy or ethical restrictions.
REFERENCES
- 1. McNerney ME, Godley LA, Le Beau MM. Therapy‐related myeloid neoplasms: when genetics and environment collide. Nat Rev Cancer. 2017;17(9):513‐527. [DOI] [PMC free article] [PubMed] [Google Scholar]
- 2. Higgins A, Shah MV. Genetic and genomic landscape of secondary and therapy‐related acute myeloid leukemia. Genes. 2020;11(7):749. [DOI] [PMC free article] [PubMed] [Google Scholar]
- 3. DiNardo CD, Jonas BA, Pullarkat V, et al. Azacitidine and venetoclax in previously untreated acute myeloid leukemia. N Engl J Med. 2020;383(7):617‐629. [DOI] [PubMed] [Google Scholar]
- 4. Aldoss I, Yang D, Aribi A, et al. Efficacy of the combination of venetoclax and hypomethylating agents in relapsed/refractory acute myeloid leukemia. Haematologica. 2018;103(9):e404‐e407. [DOI] [PMC free article] [PubMed] [Google Scholar]
- 5. Pullarkat V, Pratz K, Dohner H, et al. Venetoclax and azacitidine combination in chemotherapy ineligible untreated patients with therapy‐related myeloid neoplasms, antecedent myelodysplastic syndromes, or myelodysplastic/myeloproliferative neoplasms. J Clin Oncol. 2021;39(suppl 15):7011. [Google Scholar]
- 6. Cheson BD, Greenberg PL, Bennett JM, et al. Clinical application and proposal for modification of the International Working Group (IWG) response criteria in myelodysplasia. Blood. 2006;108(2):419‐425. [DOI] [PubMed] [Google Scholar]
- 7. Döhner H, Estey E, Grimwade D, et al. Diagnosis and management of AML in adults: 2017 ELN recommendations from an international expert panel. Blood. 2017;129(4):424‐447. [DOI] [PMC free article] [PubMed] [Google Scholar]
- 8. D'Agostino RB Jr. Propensity score methods for bias reduction in the comparison of a treatment to a non‐randomized control group. Stat Med. 1998;17(19):2265‐2281. [DOI] [PubMed] [Google Scholar]
- 9. Pollyea DA, Pratz KW, Wei AH, et al. Outcomes in patients with poor‐risk cytogenetics with or without TP53 mutations treated with venetoclax combined with hypomethylating agents. Blood. 2021;138(suppl 1):224. [Google Scholar]
- 10. Kabel CC, Goldman DA, Buie LW, Klimek VM. Choice of hypomethylating agent (HMA) for initial treatment does not influence outcome or survival for therapy‐related myeloid neoplasms (t‐MN). Blood. 2019;134(suppl 1):1718. [Google Scholar]
- 11. Chhetri R, Sharplin K, Proudman W, et al. Hypomethylating therapy does not improve outcome of therapy‐related myeloid neoplasm including TP53 mutated and complex karyotype subgroups. Blood. 2021;138(suppl 1):3702. [Google Scholar]
- 12. Baranwal A, Chhetri R, Kok C, et al. Factors predicting survival following allogeneic stem cell transplant in patients with therapy‐related myeloid neoplasms. Poster presented at: Transplantation and Cellular Therapy Meetings; 2022; Salt Lake City.
- 13. Nadiminti K, Sidiqi MH, Meleveedu K, et al. Characteristics and outcomes of therapy‐related myeloid neoplasms following autologous stem cell transplantation for multiple myeloma. Blood Cancer J. 2021;11(3):63. [DOI] [PMC free article] [PubMed] [Google Scholar]
- 14. Metheny L, Callander NS, Hall AC, et al. Allogeneic transplantation to treat therapy‐related myelodysplastic syndrome and acute myelogenous leukemia in adults. Transplant Cell Ther. 2021;27(11):923.e1‐923.e12. [DOI] [PMC free article] [PubMed] [Google Scholar]
- 15. Wei AH, Strickland SA Jr, Hou J‐Z, et al. Venetoclax combined with low‐dose cytarabine for previously untreated patients with acute myeloid leukemia: results from a phase Ib/II study. J Clin Oncol. 2019;37(15):1277‐1284. [DOI] [PMC free article] [PubMed] [Google Scholar]
- 16. Teodora K, Bhumika JP, Srinivasa RS, et al. Genomics of therapy‐related myeloid neoplasms. Haematologica. 2020;105(3):e98‐e101. [DOI] [PMC free article] [PubMed] [Google Scholar]
- 17. DiNardo CD, Tiong IS, Quaglieri A, et al. Molecular patterns of response and treatment failure after frontline venetoclax combinations in older patients with AML. Blood. 2020;135(11):791‐803. [DOI] [PMC free article] [PubMed] [Google Scholar]
- 18. Raghuveer Singh M, Qi Z, RosaAnna D, et al. Venetoclax combines synergistically with FLT3 inhibition to effectively target leukemic cells in FLT3‐ITD+ acute myeloid leukemia models. Haematologica. 2020;106(4):1034‐1046. [DOI] [PMC free article] [PubMed] [Google Scholar]
- 19. Perl AE, Daver NG, Pratz KW, et al. Venetoclax in combination with Gilteritinib in patients with relapsed/refractory acute myeloid leukemia: a phase 1b study. Blood. 2019;134(suppl 1):3910. [Google Scholar]
- 20. A study to assess safety and efficacy of venetoclax in combination with gilteritinib in participants with relapsed/refractory acute myeloid leukemia. NCT03625505 2021. Accessed Dcember 1, 2021. http://clinicaltrials.gov/ct/show/NCT03625505.
- 21. Kuykendall A, Duployez N, Boissel N, Lancet JE, Welch JS. Acute myeloid leukemia: the good, the bad, and the ugly. Am Soc Clin Oncol Educ Book. 2018;38:555‐573. [DOI] [PubMed] [Google Scholar]
- 22. Rücker FG, Schlenk RF, Bullinger L, et al. TP53 alterations in acute myeloid leukemia with complex karyotype correlate with specific copy number alterations, monosomal karyotype, and dismal outcome. Blood. 2012;119(9):2114‐2121. [DOI] [PubMed] [Google Scholar]
- 23. Bernard E, Nannya Y, Hasserjian RP, et al. Implications of TP53 allelic state for genome stability, clinical presentation and outcomes in myelodysplastic syndromes. Nat Med. 2020;26(10):1549‐1556. [DOI] [PMC free article] [PubMed] [Google Scholar]
- 24. Molica M, Mazzone C, Niscola P, de Fabritiis P. TP53 mutations in acute myeloid leukemia: still a daunting challenge? Frontiers in Oncology. 2021;10:1‐16. [DOI] [PMC free article] [PubMed] [Google Scholar]
- 25. Hsu JI, Dayaram T, Tovy A, et al. PPM1D mutations drive clonal hematopoiesis in response to cytotoxic chemotherapy. Cell Stem Cell. 2018;23(5):700‐713.e706. [DOI] [PMC free article] [PubMed] [Google Scholar]
- 26. Imgruet MK, Lutze J, An N, et al. Loss of a 7q gene, CUX1, disrupts epigenetically driven DNA repair and drives therapy‐related myeloid neoplasms. Blood. 2021;138(9):790‐805. [DOI] [PMC free article] [PubMed] [Google Scholar]
Associated Data
This section collects any data citations, data availability statements, or supplementary materials included in this article.
Supplementary Materials
FIGURE S1 (i) Progression‐free and (ii) overall survival as stratified by the best response achieved with venetoclax.
FIGURE S2 (i) Progression‐free and (ii) overall survival as stratified by the presence of pathogenic variant in TP53.
FIGURE S3 (i) Progression‐free survival (PFS) stratified by the presence of pathogenic variant in RAS; (ii) overall survival (OS) stratified by the presence of pathogenic variant in RAS; (iii) PFS stratified by the presence of pathogenic variant in IDH1/2; (iv) OS stratified by the presence of pathogenic variant in IDH1/2.
FIGURE S4 (i) the likelihood of achieving complete remission; (ii) progression‐free and (ii) overall survival as stratified by the percentage of bone marrow blasts at the initiation of venetoclax
FIGURE S5 (i) Distribution of propensity scores and (ii) covariate balance of t‐MN patients who received first‐line venetoclax‐based therapies (treated) and hypomethylating agent based (control units).
TABLE S1 Characteristics of therapy‐related myeloid neoplasm patients treated with venetoclax compared to those who did not receive venetoclax.
TABLE S2 Characteristics of therapy‐related myeloid neoplasm patients who received venetoclax as first line compared to as subsequent‐line therapy.
TABLE S3 Characteristics of venetoclax use in therapy‐related myeloid neoplasms
TABLE S4 Paired cytogenetic analysis before and following progression on venetoclax therapy (attached Microsoft Excel file).
DATA S1 Supplementary methods
Data Availability Statement
The data are not publicly available due to privacy or ethical restrictions.