

Abstract
While atypical sensory perception is reported among individuals with autism spectrum disorder (ASD), the underlying neural mechanisms of autism that give rise to disruptions in sensory perception remain unclear. We developed a neural model with key physiological, functional and neuroanatomical parameters to investigate mechanisms underlying the range of representations of visual illusions related to orientation perception in typically developed subjects compared to individuals with ASD. Our results showed that two theorized autistic traits, excitation/inhibition imbalance and weakening of top‐down modulation, could be potential candidates for reduced susceptibility to some visual illusions. Parametric correlation between cortical suppression, balance of excitation/inhibition, feedback from higher visual areas on one hand and susceptibility to a class of visual illusions related to orientation perception on the other hand provide the opportunity to investigate the contribution and complex interactions of distinct sensory processing mechanisms in ASD. The novel approach used in this study can be used to link behavioural, functional and neuropathological studies; estimate and predict perceptual and cognitive heterogeneity in ASD; and form a basis for the development of novel diagnostics and therapeutics.
Keywords: atypical sensory perception, autism spectrum disorder (ASD), excitation/inhibition imbalance, reduced top‐down modulation, visual cortex
Individuals with autism perceive the external world, including visual scenes, differently. To better understand potential brain changes in autism, we developed a neural model that can mimic our brain's visual system and showed that people with autism are less susceptible to some visual illusions, because of potential changes in brain wiring. This work can form a framework for the study of autism heterogeneity and the development of new diagnostics.
Abbreviations
- 1D
one dimensional
- 2D
two dimensional
- ASD
autism spectrum disorder
- DF
degrees of freedom
- E/I
excitation/inhibition or excitatory/inhibitory
- EPF
enhanced perceptual functioning
- GABA
gamma‐aminobutyric acid
- SQ
systemizing quotient
- TD
typically developed
- V1
primary visual cortex
- V2
secondary visual cortex
- V4
one of the extrastriate visual cortices in the ventral stream
- WCC
weak central coherence theory
1. INTRODUCTION
Autism spectrum disorder (ASD) is a complex developmental disorder manifested through heterogeneous symptoms—such as restricted and stereotypical behaviors, avoiding eye contact and difficulty connecting with others socially and emotionally (Frith, 1989). In addition, individuals with ASD frequently report atypical sensory perception, which could cascade into deficits in social and emotional interactions (Green et al., 2015; Horder et al., 2014; Robertson & Baron‐Cohen, 2017; Thye et al., 2018; Wood et al., 2021). Within the context of atypical sensory perception in ASD, Happé (1996) introduced the idea that individuals with ASD might be less susceptible to visual illusions by testing them with the Poggendorff and Ponzo illusions, among others. Several illusions, including the Ponzo, Poggendorff and Zöllner illusions, could share a common underlying mechanism, related to misperception of orientation (Prinzmetal & Beck, 2001) (Figure 1). Subsequent studies further support Happé's (1996) findings. For example, Ishida et al. (2009) showed that individuals with ASD are less susceptible to the Ponzo illusion but not to the Muller–Lyer illusion, which is in a different category of visual illusions, not associated with orientation misperception. Moreover, the finding of reduced susceptibility to visual illusions in individuals with ASD is also consistent with Bayesian account of ASD, which suggests inflexibility in processing prediction errors in individuals with autism that could result in reduced global integration (Booth & Happé, 2018; van de Cruys et al., 2014).
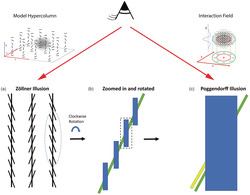
FIGURE 1.
Relation between the Zöllner and Poggendorff illusions. (a) Zöllner illusion: The vertical lines are perceived to be tilted in opposite directions of the local contextual lines. In (b), the right segment of (a) is rotated clockwise by 15° so that the local contextual lines are vertically oriented. (c) Poggendorff illusion: Although the tilted green line on the right is physically aligned with the green line on the left, it is perceptually aligned with the yellow line. (c) Can be considered the enlarged segment of (b) with a thicker vertical line and the yellow line implying that the Poggendorff and Zöllner illusions are related and the directions of misperception are the same in both. Therefore, having one or two context lines in the Zöllner illusion (instead of full set of context lines) could produce illusion magnitude similar to that of the Poggendorff illusion, because in the latter, there are only two‐line intersections contributing to the illusion. This suggests that these illusions share a common underlying mechanism
However, some behavioural studies resulted in highly variable findings that could not reliably show significant differences between individuals with ASD and control groups in illusion susceptibilities (Hoy et al., 2004; Milne & Scope, 2008; Ropar & Mitchell, 1999; Utzerath et al., 2019), likely due to limited sample size, methodological differences, lack of sensitivity in estimates and heterogeneity within the autism population. In addition, individuals with ASD could be less susceptible to only certain kinds of visual illusions, but not all. To this effect, Walter et al. (2009) collected data from large samples (146 neurotypical individuals) and showed that the systemizing quotient (SQ), a scoring scale that reflects systematic traits that may be associated with ASD, is negatively correlated with susceptibilities to the Ponzo and Poggendorff illusions, although the Zöllner illusion did not follow the same trend when tested individually (Baron‐Cohen, 2006; Walter et al., 2009). Therefore, even though visual illusions could potentially serve as apertures into the sophisticated information‐processing mechanisms of our brain (Gori et al., 2016), it remains unclear whether visual illusions can be useful proxies for the study of the underlying sensory processing mechanisms that are disrupted in ASD.
To address this gap, we built a neural model of the visual system that can simulate orientation perception, investigate possible underlying neural mechanisms of visual illusions and provide the means for the necessary, detailed parametric correlation that is challenging to get in experimental studies. We used this platform to simulate the representation of Zöllner and Poggendorff illusions, both of which rely on misperception of orientation and, therefore, could share a common underlying mechanism (Prinzmetal & Beck, 2001) but result in differential susceptibility trends in the literature (Baron‐Cohen, 2006; Walter et al., 2009). Then, we incorporated into our neural model connectivity and physiological circuit and network interactions to facilitate parametrization of the ratio of excitation/inhibition and top‐down modulation of visual networks that may underlie ASD pathology (Chung & Son, 2020; Flevaris & Murray, 2015; Isler et al., 2010; Kessler et al., 2016; Robertson et al., 2014; Schallmo et al., 2020; Seymour et al., 2019; Snijders et al., 2013; Spiegel et al., 2019). This enabled us to investigate whether parametric changes of these mechanisms can also lead to model visual representation changes, shifting the degree of misperception produced by these visual illusions and recapitulating the perceptual differences observed in ASD.
2. MATERIALS AND METHODS
We developed a computational neural model that can simulate visual processing underlying orientation perception. The study did not involve human subjects (not‐human subjects research), as reviewed, and approved by the Institutional Review Board of Boston University.
2.1. Units of the neural model
Neurons in the input layer of the neural model have preferred orientations, which mimic the preferred orientation tuning of neurons in early visual areas (Briggs & Usrey, 2004). Given the fast, reciprocal pathway between the Lateral Geniculate Nucleus (LGN) and visual cortex in primates (Briggs & Usrey, 2007), we considered the model LGN‐V1 as an integrated compartment with its neurons (V1 model neurons) having orientation preference. As such, we constructed the receptive field of orientation selective model neurons via matrix multiplication of two Gaussian kernels with a small and a large sigma to generate elliptical Gaussians (Figure 2). After the elliptical Gaussian was constructed, we used the rotation matrix to generate the receptive field of orientation selective model neurons with different preferred orientations (Figure 2a). Further, we exploited the nature of matrix multiplication to control the E/I ratio and aspect ratio of the receptive field of orientation selective model neurons (Figure 2b).
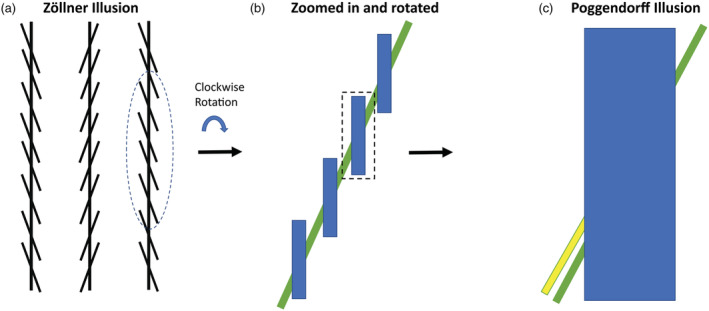
FIGURE 2.
The receptive field (RF) of the model orientation selective neurons. (a) Model elliptical receptive fields (RFs) with different preferred orientations. (b) Model RFs with different aspect ratios and excitatory/inhibitory (E/I) ratios. The RFs' excitatory and inhibitory subfields are two‐dimensional elliptical Gaussians with wide and narrow axes ( and ). The ratio of to is referred to as aspect ratio. The inhibitory side bands stem from larger of inhibitory compared to of excitatory subfields. The ratio of excitatory to inhibitory is called excitatory/inhibitory (E/I) ratio. (C) How the elliptical Gaussian is constructed for orientation selective model neurons by matrix multiplication of circular Gaussians: The circular Gaussian with small sigma (left) determines the , and the circular Gaussian with larger sigma (right) determines the of the resultant elliptical Gaussian (bottom)
Our neural model is structurally organized by hypercolumns and functionally by interaction fields (Figure 3). A hypercolumn is composed of 18 orientation selective model neurons that are tuned to different orientations from 0° to 180° and process orientation information in each retinotopic location (x, y). The hypercolumn field is designed to model the hypercolumnar organization in the visual cortex (Hubel & Wiesel, 1977). The proposed interaction field in the neural model represents interactions of hypercolumns and top‐down modulation from higher areas: Interconnected areas (such as V1–V2) form a functional interaction emerging from the fast inter‐areal signals (Bullier, 2001; Layton et al., 2014). The higher the visual areas, the more complex the interactions become (Layton et al., 2012) for which there are sparse data related to ASD. For the cross‐orientation interaction, which is the focus of the current work, we considered the impact of interaction from higher areas to be relayed from V2 to V1 which in turn feeds the interaction field; therefore, the interaction field impacts the model interconnected V1–V2. Together, these offer a basic model of impact of higher areas on V1–V2 and show how interareal underconnectivity in ASD can be modelled by shrinking interaction field size, which also limits the range of cross orientation competition as well as across space interaction.
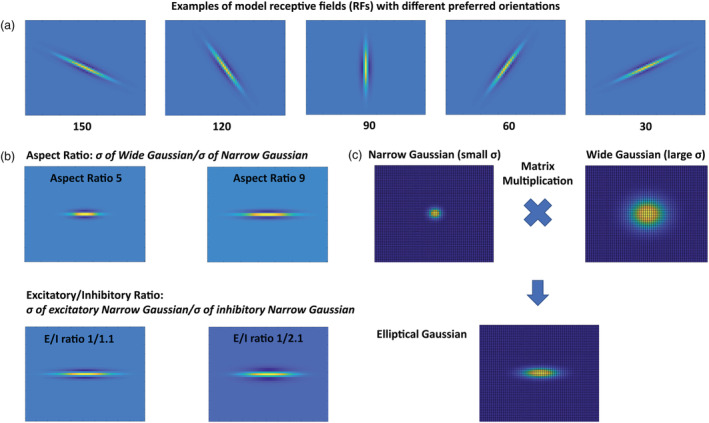
FIGURE 3.
Model hypercolumn neural units interaction via interaction field. (a) The schematic diagram of the model hypercolumn field. Each layer of the hypercolumn is sensitive to the same orientation ( ) at different retinotopic positions (x, y). Neurons in each column are sampling the same retinotopic position (x, y) with different preferred orientations ( ). This way, the hypercolumn would be sensitive to all orientations spanning retinotopic positions. (b) The interaction field is a three‐dimensional on centre off surround kernel that is designed to represent interactions across retinotopic positions (x, y) and orientations ( ) across the hypercolumn. The x and y range of the interaction field determines the range of lateral interaction across hypercolumns; that is, the projection of 3D interaction field over x‐y plane would be a 2D on‐centre/off‐surround interaction. The projection of interaction field along each orientation column is a 1D on‐centre/off surround interaction; therefore, the 3D interaction field is a combination of 2D on‐centre/off‐surround across visual space (x, y) and 1D on‐centre/off‐surround across orientations in each column resulting in cross orientation interaction. The interaction field implemented in model V1 which propagates within model interconnected V1–V2 reflects the impact of higher visual areas to areas V1 and V2 that act as active blackboards (Bullier, 2001)
2.2. Model neurons general equation
The dynamics of our model neurons are rate based and represented by a single compartment voltage that obeys the following shunting equation (Grossberg, 1973; Grossberg & Mingolla, 1985; Layton et al., 2012, 2014; Layton & Yazdanbakhsh, 2015):
| (1) |
In Equation (1), denotes the membrane capacitance and denotes the constant decay (leakage) rate, which brings back to zero when there is no excitatory or inhibitory input to the neuron to fulfil the physiological constraints that bring a neuron without input to its resting potential. and specify the summed excitatory and inhibitory inputs to the neuron at each time. The terms , , and refer to leak, excitatory, and inhibitory reversal potentials, respectively, which keep within , , and range to fulfil the physiological constraints of the limited dynamical range of neurons activity.
Equation (2) represents the activity dynamic of V1 Hypercolumn neurons with 18 orientation selectivity ( ):
| (2) |
Equation (2) can be derived from Equation (1) by setting = , = , = 0, = , = − , = feedforward input, = feedback input from V2 or other association cortices, is the excitatory elliptical Gaussian Kernel, representing the excitatory subfield of RFs, and is the inhibitory elliptical Gaussian Kernel, representing the inhibitory subfield of RFs (Figure 2). The oriented RFs' excitatory and inhibitory subfields are two‐dimensional elliptical Gaussians (Figure 2) with wide and narrow axes ( and ). The elliptical Gaussian is constructed for orientation selective model neurons by matrix multiplication of circular 2D Gaussians (A exp ). The circular Gaussian with small sigma (n for narrow) and the circular Gaussian with larger sigma (w for wide) build the short and long axis of the resultant elliptical Gaussian after matrix multiplication. The inhibitory side bands stem from larger of inhibitory compared to of excitatory subfields. The ratio of excitatory to inhibitory is called excitatory/inhibitory (E/I) ratio. To generate different orientation selectivity, we matrix multiplied rotation matrix for , 30°, 60°, 90°, 120° and 150° with the two‐dimensional elliptical Gaussian (Figure 2).
The operation ‘*’ indicates convolution, and ‘.*’ represents elementwise multiplication. indicates the neural activation of orientation selective model neurons with receptive fields centred at each input location over time. is the decay rate of each orientation selective model neuron, and its value is 0.55. and are the upper and lower bounds of neural activity, and the value of each is 1.
The following equation characterizes Hypercolumnar Interaction ( ) via Interaction Field:
| (3) |
In Equation (3), is the decay rate with the value of 0.55. and are the upper and lower bounds of activity and the value of each is 1.
The interaction field excitatory and inhibitory subfields are 3D Gaussians:
| (4) |
and
| (5) |
Equations (4)–(5) show that the excitatory and inhibitory components of the Interaction Field span the visual space (x, y) as a 2D on‐centre/off‐surround unit (Figure 3b) and span hypercolumn angle range ( ) similar to a 1D on‐centre/off‐surround unit (Figure 3b).
The following equation characterizes model V2 (or other association cortices) with 18 Orientation Selective Neurons:
| (6) |
In Equation (6), is decay rate with the value of 0.55. and are the upper and lower bounds of activity, and the value of each is 1. is the input from the interaction field (see Equation (3)). The receptive field of orientation selective model neurons in V2 or other association cortices, with excitatory and inhibitory subfields, is larger than the receptive field of orientation selective neurons in V1, as the receptive field of higher visual areas tends to be larger than the receptive field of lower areas (Kennedy et al., 1985).
We considered HI, as the impact of higher visual areas to model V1–V2 interconnected areas, within visual space (x, y) where signals engage in an on centre off‐surround interaction and within angle range ( ) along which the cross‐orientation interaction takes place. We simulated the changes of feedback from higher visual areas to V1–V2 as the change of parameters of interaction field, that is, the extent of its excitatory ( ) and inhibitory ( ) subfields in Equations (4) and 5). Weaker feedback of higher visual areas is represented by shrinking the extent of interaction field (see Section 3). This way, the interaction field signal (HI) passed to V2 (Equation (6)) and V2 signal fed back to model V1 (Equation (2)) reflect the impact of higher visual areas to the interconnected areas V1–V2 that act as active blackboards (Bullier, 2001).
2.3. Decoding population response via vector summation to represent orientation perception
The brain can process sensory information via population coding, as initially proposed by Georgopoulos et al. (1986), who used population vectors to represent the direction of arm movement. The visual cortex is also shown to employ population coding to process‐oriented stimuli (Gilbert & Wiesel, 1990; Tanabe, 2013; Vogels, 1990). After we built the neural model, we used vector summation to decode the population response of the hypercolumn field in order to represent the orientation perception. An oriented stimulus can elicit differential response from the orientation selective model neurons in the hypercolumns. Depending on the orientation of the stimulus, the orientation selective model neuron that aligns with the orientation of the stimulus will elicit the maximum response. Adjacent orientation selective model neurons will elicit lesser responses, and the orientation selective model neuron that is orthogonal to the orientation of the stimulus would elicit almost no response. The visual illustration of this population response is summarized as the population response curve (Figure 4). Each hypercolumn has its own population response, and we vector summed the population response of the individual hypercolumns and generated quiver graphs to represent orientation perception. Each thin blue line in Figure 4 is the result of vector summation of the population response of the individual hypercolumns and shows that the neural model can represent the true orientation of single oriented bars.
FIGURE 4.
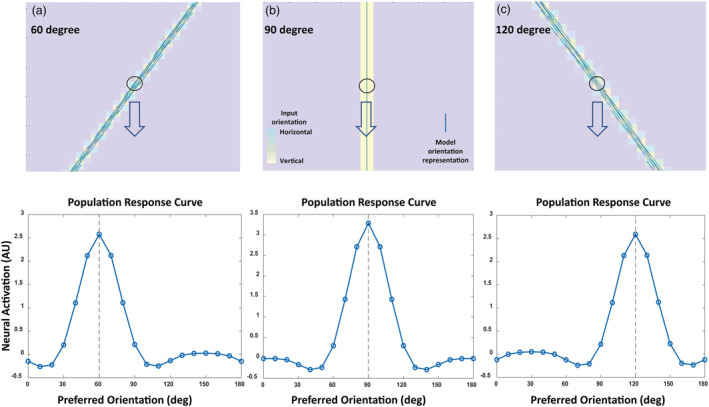
Simulating orientation representation via vector summation of population response. Yellow bars are oriented stimuli, and the blue lines show the neural model response to the oriented stimuli, (a) 60°, (b) 90°, and (c) 120°. Blue lines are obtained by weighted vector summation of each orientation within a hypercolumn at a given location (x, y). The weights for weighted vector summation are obtained from the activity level of each orientation selective model neuron within the hypercolumn illustrated by the population response curves in the bottom row. Note that the neural model orientation representation (blue lines) aligns with the actual orientation of the stimulus (yellow bar)
After we confirmed that our neural model can serve as a proxy for the orientation processing mechanism, we simulated the Zöllner and Poggendorff illusions, which are thought to be driven by misperception in orientation (Prinzmetal & Beck, 2001). We reasoned that if the Zöllner and Poggendorff illusions are driven by misperception in orientation, then our neural model, which can serve as a proxy for the orientation processing mechanism, should be able to simulate these visual illusions. If our neural model can accurately simulate these visual illusions, then the direction of distortion that we see in our visual perception should align with the neural model response to these visual illusions. Figure 5a–c shows that the neural model response to the vertical line was tilted in the opposite direction of the tilted local contexts. This aligns with the direction of distortion that we perceive in the Zöllner illusion. While we may not necessarily note the distortion in the tilted local contexts, our model response to the tilted local contexts was also distorted. This is because through interaction field and feedback in the neural model responses to the tilted local contexts and vertical line mutually modulate each other.
FIGURE 5.
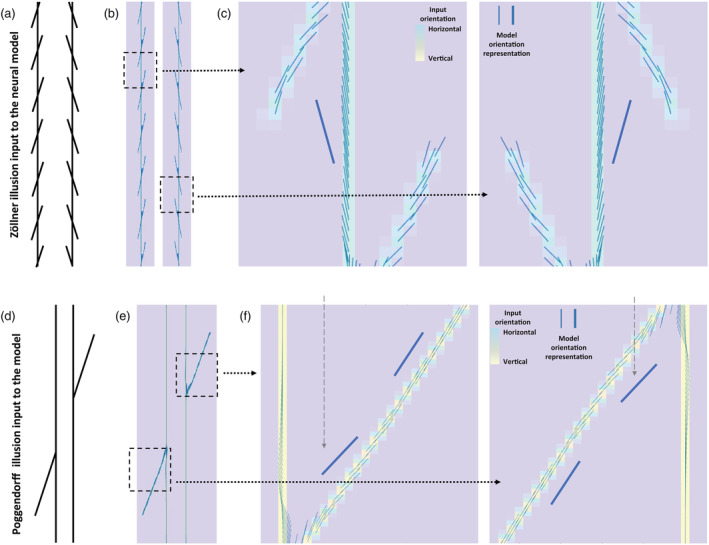
The neural model response to the Zöllner and Poggendorff illusions. (a) The Zöllner illusion stimulus as the input to the neural model. The vertical lines are perceived as titled in the opposite direction of the tilted local contexts. (b) The neural model response to the Zöllner illusion. (c) The zoomed in regions of (b) around the intersections in order to see the neural model orientation representation by small blue lines clearly. The orientation representation along the vertical line is shifted to the opposite direction of the tilted local contexts, which is sketched by the tilted thick blue line on the side, consistent with the tilted percept of the vertical line in (a). The angles of tilted local context lines are 70° and 110°. The larger blue lines on the side are drawn parallel to the small blue lines to highlight the model represented orientation. (d) The Poggendorff illusion stimulus as the input to the neural model. The perceived misalignment is consistent with a line tilted away from the vertical lines. (e) The neural model orientation representation of the Poggendorff illusion. (f) The zoomed in regions of (e) around the intersections in order to see the neural model orientation representation by small blue lines clearly. The orientation representation (blue lines) along the tilted line is consistent with the illusion of perceived misalignment. The angle of the tilted line is 70°. The larger blue lines on the side are sketched on the side to highlight the model represented orientation
We also tested if our neural model can simulate the Poggendorff illusion, by examining whether the model responses show distortion of the tilted line in the opposite direction of the vertical line. The neural model response to the Poggendorff illusion shows that the tilted line is pushed away from the vertical line, that is, larger tilt angle from the vertical line (Figure 5d–f). The neural model response to the tilted line gets veridical farther away from the intersection with the vertical line. This is because when the tilted line is farther away from the intersection with the vertical line, the interaction field cannot span the vertical line and the segment of the tilted line concurrently due to their farther separation. Overall, this outcome shows that the neural model can simulate the Zöllner and Poggendorff illusions consistently, and thus, we can proceed with the neural model to examine how adopting autistic traits can change the susceptibilities to these visual illusions.
2.4. Statistical analysis
Data were analysed using MATLAB R2020a (Statistics and Machine Learning Toolbox). We calculated the magnitude of orientation representation deviations from the illusion stimuli by subtracting the actual orientation of the illusion stimulus line from the neural model angle representation along the stimuli lines. After obtaining orientation representation deviations along the illusion line, the magnitude of attraction was calculated by summing the positive orientation representation deviations (i.e., deviation as if the angle shrinks) along the illusion line, and the magnitude of repulsion was calculated by summing the negative orientation representation deviations (i.e., deviation as if the angle expands) along the illusion line. Then, we performed Pearson correlation and linear regression analysis to examine the relationship between variables (interaction field size vs. repulsion magnitude, σ of inhibitory subunit vs. repulsion magnitude, interaction field size vs. repulsion/attraction ratio and σ of inhibitory subunit vs. repulsion/attraction ratio). In our linear regression analysis, we included 12 values/steps for interaction field size, E/I ratio and corresponding illusion magnitude (dependent variable). In linear regression, the slope and intercept each use up one freedom degree from the total number of observations and, therefore, the degrees of freedom (DF) is the number of observations (12 in our case) − 2 = 10. We also report measures of effect size, which for the linear regression are the correlation coefficient (r) and p values for the significance. The stronger the correlation, the absolute the value of r approaches 1. Our analyses yielded large effect sizes (>0.5) in all cases, shown by the (r) and p values, as the indication of effect size and significance. For the comparison between illusory strengths of the Zöllner and Poggendorff illusions, we computed the mean of the magnitude of repulsion, standard deviation, standard error of mean and Hedge's g.
3. RESULTS
3.1. The Poggendorff and Zöllner illusions share a common underlying mechanism: Angle repulsion
Before we examine how adopting autistic traits can affect susceptibilities to visual illusions, we wanted to establish a clear relation between the Zöllner and Poggendorff illusions. As explained in Section 2, we vector summed the population responses of hypercolumns and generated a quiver graph to represent orientation perception. This means that the orientation distortions in the neural model response arose from shifts in the population response of hypercolumns. In the Zöllner illusion, the direction of the orientation distortion of the vertical line is in the opposite direction of the orientation of the tilted lines, which implied repulsion that was driven by lateral inhibition processes among hypercolumns (Blakemore et al., 1970; Gibson & Radner, 1937) (Figure 6a,d). In the neural model, this process was implemented by the interaction field. The interaction field in our model functionally brings together the impact of higher cortical areas on context processing in the visual cortex. In this regard, there are other neural models of top‐down influences on local gain and contextual interactions in visual cortex (McManus et al., 2011; Piëch et al., 2013; Ramalingam et al., 2013) that make similar assumptions and support the use of such parameters. The visual illustration of repulsion in the Zöllner illusion is shown in Figure 6b (interaction field size: 2 and E/I ratio: 1/2.1). The population response that represents the orientation distortion of the vertical line is shown by the blue curve, which is the result of interaction between the vertical line and the tilted lines. The population response to vertical and tilted lines when presented in isolation to the model is shown by yellow and brown curves. Consistent with Zöllner illusion, the blue curve peak compared to the yellow curve peak is farther away from the brown curve peak, indicating the amount of representation tilt (repulsion) induced by the illusion in the model.
FIGURE 6.
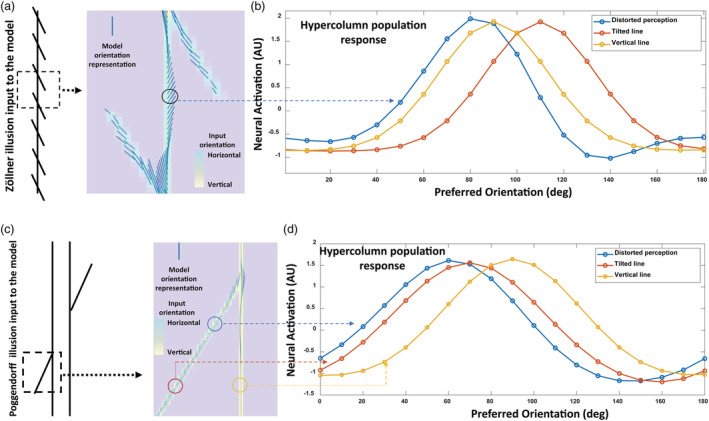
The underlying model mechanism representing the Zöllner and Poggendorff illusions. (a) The Zöllner illusion stimulus as the input to the model, and orientation representation of the model shown by small blue lines. The angle of the tilted lines is 110°. (b) Hypercolumn population response (blue curve) within the circle outlined region in (a). For reference, brown/yellow curves show the hypercolumn response for the contextual tilted line/vertical line in isolation (without the presence of the vertical/tilted line, respectively). Note that the peak of the blue curve compared to the yellow curve is farther away from the brown curve peak indicating the amount of representation tilt (repulsion) induced by the illusion in the model. (c) The Poggendorff illusion as the input to the model. The angle of the tilted line is 70°. (d) Hypercolumn population response curves obtained from the circle outlined regions; the color of each curve in (d) matches the circle color of the region it corresponds to in (c). Note that the peak shift of the blue curve in (d) indicates repulsion. Comparison with panels (a) and (b) supports a common underlying mechanism for the Zöllner and Poggendorff illusions can be suggested
Then, we simulated the Poggendorff illusion to see whether these illusions share a common underlying mechanism (Figure 6c,d). Our results show that the model emergent mechanism of angle repulsion can replicate the representation of the Poggendorff illusion (Figure 6d; interaction field size: 3 and E/I ratio: 1/2.6), which supports previous findings that the Poggendorff and Zöllner illusions are driven by the same underlying mechanism, along with other related illusions such as the Ponzo and Tilt illusions (Clifford, 2014; Prinzmetal & Beck, 2001; Schwartz et al., 2009). Since the Zöllner and Poggendorff illusions are driven by the same underlying mechanism, we proceeded to use this neural model to examine in depth the features and relationship of these illusions. In particular, our goal was to better understand and possibly clarify or re‐interpret the mixed results of Walter et al.'s (2009) study, where they showed that SQ negatively correlated with the Ponzo, Poggendorff and other related illusions, but not with the Zöllner illusion.
We hypothesized that a possible explanation for the findings in Walter et al.'s (2009) study could be that the Zöllner illusion is a stronger illusion than the Poggendorff illusion. The Zöllner illusion is composed of one illusion‐induced line (vertical line) and many illusion‐inducing lines (tilted lines), whereas the Poggendorff illusion is composed of one illusion‐induced line (tilted line) and two illusion‐inducing lines (vertical lines). Having more illusion‐inducing lines could produce more interactions among hypercolumns and thus more distortion. Hence, we simulated the Zöllner and Poggendorff illusions under the same conditions to check the possibility that the Zöllner illusion is stronger than the Poggendorff illusion (Figure 7). In the Zöllner illusion, the number of hypercolumns in the vertical line that showed repulsion was 108. In the Poggendorff illusion, the number of hypercolumns in the tilted line that showed repulsion was 26. The mean magnitude of repulsion was 17.9° (SD = 5.8) for the Zöllner illusion and 5.8° (SD = 5.0) for the Poggendorff illusion. The hedges' g was 1.236, suggesting large effect size. The standard error of mean was 1.0193 for the Zöllner illusion and 0.9797 for the Poggendorff illusion. As expected, the Zöllner illusion produced more repulsion than the Poggendorff illusion. The stronger nature of the Zöllner illusion could explain why subjects with higher SQ were less susceptible to other related illusions but still susceptible to the Zöllner illusion in Walter et al.'s (2009) study.
FIGURE 7.
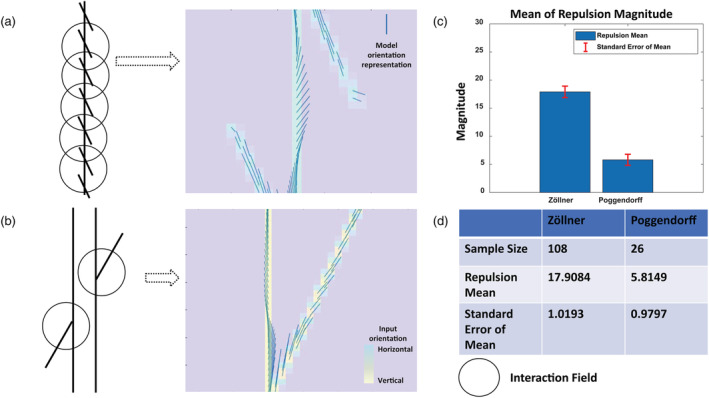
Induced tilt effect is stronger for the Zöllner compared to the Poggendorff illusion with the same model parameters. The model orientation representation of the Zöllner illusion (a) and the Poggendorff illusion (b). In both, the interaction field size is three units, and E/I ratio is 2.1. The mean magnitude of repulsion in the Zöllner illusion is greater than the Poggendorff illusion (c). (d) The number of model neurons along the illusion lines showing repulsion (sample size) with mean and standard error of mean (SEM). Therefore, with the same model parameters, the Zöllner illusion induces more tilt in orientation representation than the Poggendorff illusion. This is likely because the Zöllner illusion is composed of many illusion‐inducing tilted lines, producing more interactions through interaction fields and thus more illusory tilt, whereas the Poggendorff illusion is composed of two illusion‐inducing vertical lines with fewer interactions and less induced tilt
3.2. Illusion susceptibility decreases with reduced top‐down modulation
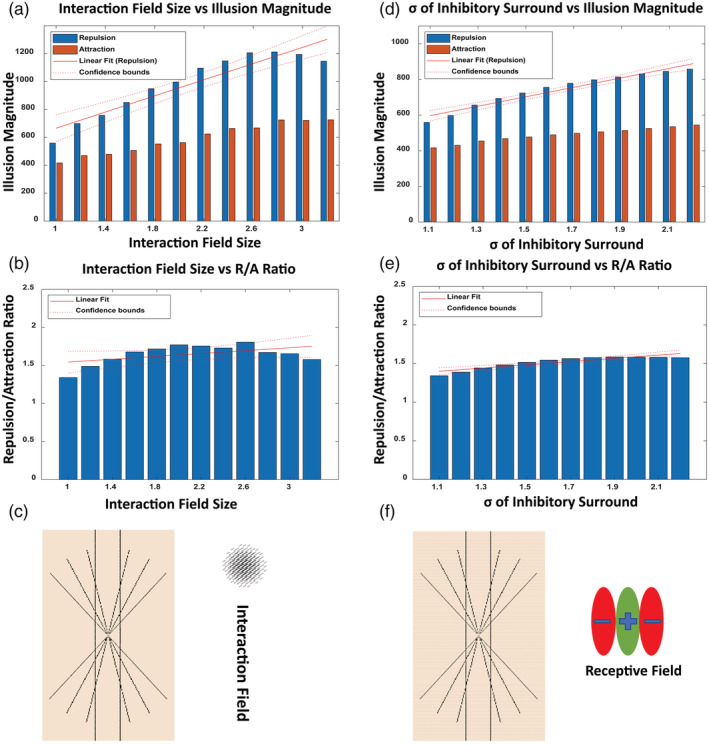
The first autistic trait we adopted was reduced cortical feedback input from higher areas (Frith, 2004; Hughes, 2007; Just et al., 2007; Kana et al., 2011; Watanabe & Rees, 2017), which is also observed in the visual system of individuals with autism (Isler et al., 2010; Kessler et al., 2016), as early as in the V4 to V1 feedback loop (Seymour et al., 2019) that modulates the range of hypercolumnar lateral interaction in primary visual cortex (Liang et al., 2017; Michalareas et al., 2016). These reduced hypercolumnar interactions can be interpreted as reduced size of the interaction field in our neural model (McManus et al., 2011; Piëch et al., 2013; Ramalingam et al., 2013). Hence, we varied the size of the interaction field in our neural model and investigated how the model's response to the Poggendorff illusion was changed (Figure 8). Pearson correlation indicated that there was a significant positive correlation between the interaction field size and repulsion magnitude (r [10] = .91, p = 3.381e−5), and a significant positive correlation between the interaction field size and repulsion/attraction ratio (r [10] = .97, p = 2.398e−7). We report r (10), because in linear regression, the slope and intercept each use up one freedom degree from the total number of observations and, therefore, the degrees of freedom (DF) is the number of observations (12 in our case) − 2 = 10. We used the repulsion/attraction ratio as a metric to estimate the relative strength of repulsion against attraction, which is always less than repulsion (Figures 8 and 9) and to indicate the strength of illusory orientation representation by the model. A linear regression analysis indicated that the interaction field size significantly predicted the magnitude of the repulsion (β = 50.55, t [10] = 7.08, p = 3.381e−5) and explained a significant proportion of variance in repulsion magnitude (R 2 = .83, F [1, 10] = 50.1, p = 3.381e−5). Further, the interaction field size significantly predicted the repulsion/attraction ratio (β = .62, t [10] = 12.25, p = 2.398e−7) and explained a significant proportion of the variance in the repulsion/attraction ratio (R 2 = .93, F [1, 10] = 150, p = 2.398e−7). We observed an irregular pattern when the interaction field size was less than 1.8 (Figure 8d). This is likely because some level of interaction is necessary for accurate simulation of visual illusions and very small interactions can elicit responses that are off balance, which can result in irregular patterns. However, we observed an upward trend in the repulsion/attraction ratio when the interaction field size was small (Figure 8e), suggesting domination of repulsion over attraction. Overall, our results suggest that reduced interaction among hypercolumns, which could stem from the weakening of top‐down modulation, can decrease susceptibility to the Poggendorff illusion.
FIGURE 8.
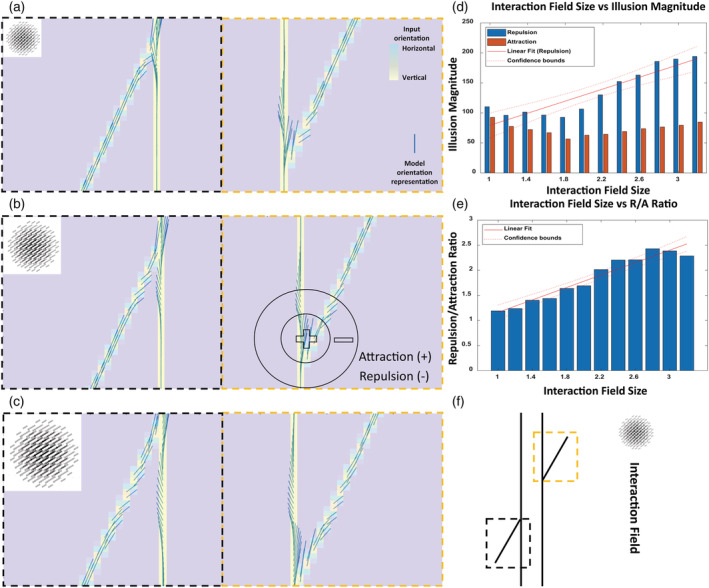
Susceptibility to the Poggendorff illusion decreases with reduced top‐down modulation. Model orientation representation of the Poggendorff illusion with the interaction field size of 1 (a), 2 (b) and 3 (c). (d) The total sum of magnitude of repulsion and attraction along the tilted line for each incremental interaction field size, showing positive relationship between the size of interaction field and repulsion, which represents the illusory strength. (e) Increasing trend of repulsion/attraction ratio with increasing size of interaction field, supporting the positive relationship between the extent of contextual modulation stemming from interaction field size and illusory strength. (f) The Poggendorff illusion input to the neural model. The black dotted square in (f) corresponds to the black dotted square in (a), (c) and (c). The gold dotted square in (f) corresponds to the gold dotted square in (a), (b) and (c). The E/I ratio is held constant at 1/1.1 in order to minimize its influence on the neural model response. The sphere represents the relative size of the interaction field. We observe lower susceptibility to the Poggendorff illusion with reduced interaction that represents top‐down modulation
FIGURE 9.

Susceptibility to the Poggendorff illusion decreases with elevated E/I ratio. Model orientation representation of the Poggendorff illusion with E/I ratio of 1/1.1 (a), 1/1.6 (b) and 1/2.1 (c). (d) The total sum of magnitude of repulsion and attraction along the tilted line for varying E/I ratio, showing positive relationship between the of inhibitory subunit and repulsion, which represents the illusory strength. (e) Increasing trend of repulsion/attraction ratio with increase of the of inhibitory subunit, supporting the positive relationship between the elevated E/I ratio and illusory strength. (f) The Poggendorff illusion input to the neural model. The black dotted square in (f) corresponds to the black dotted square in (a), (b) and (c). The gold dotted square in (f) corresponds to the gold dotted square in (a), (b) and (c). The interaction field size is held constant at 2 in order to minimize its influence on the neural model response. We observe lower susceptibility to the Poggendorff illusion with elevated E/I ratio
3.3. Illusion susceptibility decreases with elevated excitatory/inhibitory ratio
Another autistic trait that we adopted in the neural model was excitation/inhibition imbalance. Excitation/inhibition imbalance is a well‐known trait of autism, and there is evidence of elevated E/I ratio in the early visual cortex of individuals with ASD (Chung & Son, 2020; Flevaris & Murray, 2015; Robertson et al., 2014, 2016; Rubenstein & Merzenich, 2003; Snijders et al., 2013; Spiegel et al., 2019). To incorporate excitation/inhibition imbalance in the neural model, we changed the E/I ratio (Figure 9) of the receptive field of orientation selective model neurons and the interaction field (Figure 8). Pearson correlation indicated that there was a significant positive association between σ of inhibitory subunit and repulsion magnitude, (r [10] = .90, p = 6.866e−5) and a significant positive association between σ of inhibitory subunit and repulsion/attraction ratio (r [10] = .67, p = 1.822e−2). A linear regression analysis indicated that the σ of inhibitory subunit significantly predicted repulsion magnitude (β = 53.58, t [10] = 6.50, p = 6.866e−5) and explained a significant proportion of variance in repulsion magnitude (R 2 = .80, F [1, 10] = 42.3, p = 6.866e−5). Further, σ of inhibitory subunit significantly predicted repulsion/attraction ratio (β = .34, t [10] = 2.82, p = 1.822e−2) and explained an adequate proportion of variance in repulsion/attraction ratio (R 2 = .44, F [1, 10] = 7.94, p = 1.822e−2). Since lower σ of inhibitory subunit results in elevated E/I ratio, our result suggests that the susceptibility to the Poggendorff illusion can decrease with elevated E/I ratio. Moreover, our statistical analysis on repulsion/attraction ratio suggests greater influence of reduced top‐down modulation (Pearson: r [10] = .97, linear regression: β = .62) on illusion susceptibility than E/I ratio (Pearson: r [10] = .67, linear regression: β = .34), which also aligns with more apparent difference in distortion shown in Figure 8 with varying size of the interaction field than shown in Figure 9 with different E/I ratio; however, further research is needed to confirm this possibility.
Moreover, because the interaction field and E/I ratio changes may differentially influence illusion susceptibility and offer distinct mechanistic interpretations for observed ASD pathology, we additionally tested the behaviour of our model with the Hering illusion that is related to orientation perception and has been widely used in the literature, (Bölte et al., 2007; Hoy et al., 2004). We found a positive relationship between increasing interaction field size and repulsion, which bows the vertical lines in Hering illusion and represents illusory strength (Figure 10). Pearson correlation indicated that there was a significant positive correlation between the interaction field size and repulsion magnitude (r [10] = .93, p = 5.623e−6) and a positive correlation between the interaction field size and repulsion/attraction ratio (r [10] = .51, p = .08). A linear regression analysis indicated that the interaction field size significantly predicted the magnitude of the repulsion (β = 289.84, t [10] = 8.70, p = 5.623e−6) and explained a significant proportion of variance in repulsion magnitude (R 2 = .88, F [1, 10] = 75.6, p = 5.62e−6). Further, the interaction field size predicted the repulsion/attraction ratio (β = .10, t [10] = 1.89, p = .088) and explained proportion of the variance in the repulsion/attraction ratio (R 2 = .26, F [1, 10] = 3.59, p = .087).
FIGURE 10.
Susceptibility to the Hering illusion decreases with reduced top‐down modulation and elevated E/I ratio. (a–c) Model orientation representation of the Hering illusion with increasing interaction field size of 1, 2 and 3 and constant E/I ratio at 1/1.1, in order to minimize its influence on the neural model response. (A) shows the total sum of magnitude of repulsion and attraction along the Hering bowed line for each incremental interaction field size, showing positive relationship between the size of interaction field and repulsion, which represents the illusory strength. (b) Increasing trend of repulsion/attraction ratio with increasing size of interaction field, supporting the positive relationship between the extent of contextual modulation stemming from interaction field size and illusory strength. (c) The Hering illusion input to the neural model. The sphere represents the relative size of the interaction field. We observe lower susceptibility to the Hering illusion with reduced interaction that represents top‐down modulation. (d–f) Model orientation representation of the Hering illusion with decreasing E/I ratio of 1/1.1, 1/1.6 and 1/2.1, and constant interaction field size at 1, in order to minimize its influence on the neural model response. (d) The total sum of magnitude of repulsion and attraction along the tilted line for varying E/I ratio, showing positive relationship between the of inhibitory surround and repulsion, which represents the illusory strength. (e) Increasing trend of repulsion/attraction ratio with increase of the of inhibitory surround, supporting the positive relationship between the elevated E/I ratio and illusory strength. (f) The Hering illusion input to the neural model. We observe lower susceptibility to the Hering illusion with elevated E/I ratio
4. DISCUSSION
Our proposed neural model relied on parameters stemming from the weighted neuroanatomical connectivity and embedded physiology of circuits that are involved in visual orientation representation, providing correlation between cortical suppression, balance of excitation/inhibition, feedback from higher visual areas on one hand and susceptibility to a class of visual illusions related to orientation perception on the other hand. Therefore, the neural model provides a platform to integrate behavioural, functional imaging, physiological and neuropathological studies in ASD that measure the magnitude of cortical suppression and its relation with illusory tilt perception and studies of top‐down feedback governing contextual modulation in the visual cortex. By adopting in our model few observed neurophysiological changes in ASD inferred from functional imaging, physiological and neuroanatomical data, we investigated the ASD‐TD range of model representations of visual orientation. Our work provides a framework that we can use to identify and study likely mechanisms and autistic traits underlying illusion susceptibility and more generally disruptions in sensory processing. Behavioural measures and data that examined illusion susceptibilities in individuals with ASD are heterogeneous and can lead to mixed results that are hard to interpret. The neural modelling approach we employed can be used not only to resolve such ambiguity through reliable and objective quantitative measures of the sensitivity to visual illusions but also to circumvent limitations of behavioural approaches, such as small sample sizes and methodological differences, and facilitate testing of hypotheses regarding distinct underlying pathologies. Further, our neural modelling approach can provide a unique and mechanistic perspective of illusion susceptibility in individuals with ASD and can be used to cross‐validate previous findings in the behavioural experiments that examined illusion susceptibility. To that effect, we showed that the Zöllner illusion is a stronger visual illusion than the Poggendorff illusion. This insight provides a possible explanation for the discrepancy in Walter et al.'s (2009) study, where they found that SQ was negatively correlated to the Poggendorff but not to the Zöllner illusion even though these illusions are driven by the same underlying mechanism. While it is possible that systemizing traits are associated with reduced susceptibilities to the Poggendorff, Zöllner, and other related illusions, the stronger nature of the Zöllner illusion could likely result in persistent, yet reduced susceptibility in ASD, which may be below the detection threshold of behavioural approaches. Based on our findings, we can predict that removing context lines from the Zöllner illusion would decrease susceptibility to this illusion, because each context line partially contributes to the illusion. In other words, having one or two context lines in the Zöllner illusion (instead of full set of context lines) could produce illusion magnitude similar to that of the Poggendorff illusion, because in the latter, there are only two‐line intersections contributing to the illusion. Moreover, if an individual is less susceptible to the Poggendorff illusion compared to the average population, then our model would predict that the individual would also be less susceptible to other visual illusions that share the same underlying mechanism of the Poggendorff illusion (i.e., visual orientation based), such as the Hering illusion (Bölte et al., 2007; Hoy et al., 2004). The Hering illusion is one of several illusions Hoy et al. (2004) and Bölte et al. (2007) used to obtain their reported susceptibility scores, which were the summed‐up scores from all the illusions they used. As such, the direction of the Hering illusion susceptibility was consistent with the other two illusions we tested, because of similar angle elements between illusion lines. Therefore, the two components of the model worked similarly for this illusion, that is, E/I disturbance, and interaction field size reduction reduce the angle repulsion (illusion susceptibility for angle‐based illusions, including Hering illusion, similar to Zöllner and Poggendroff illusions). With all these considered, variety of interaction effects between main factors can be possible, that is, interaction between SQ and illusion strength in such a way to influence more, the stronger illusions.
In this study, we associated two key ASD network dysfunction traits with reduced susceptibility to visual illusions. The first trait was reduced top‐down modulation from higher areas. Our results showed that the susceptibility to the Poggendorff illusion decreased with reduced size of the interaction fields, which facilitates contextual modulation in the neural model. This is in line with other studies that identified reduced top‐down modulation as a potential cause for reduced susceptibility to visual illusions, such as the Sheppard illusion and Kanizsa Triangle (Mitchell et al., 2010; Pak et al., 2020). Though our neural model is focused on early visual areas, the same modulation of feedback from higher association to lower association or primary areas may exist in other brain regions of individuals with ASD, according to the underconnectivity theory of autism and other findings that showed reduced or weakening of long‐range connectivity in autism (Just et al., 2007; Zikopoulos, García‐Cabezas, et al., 2018). Interestingly, neuropathological and functional studies suggest that feedback pathways and processing may be affected preferentially in ASD (Kolodny et al., 2020; Liu et al., 2020; Thakkar et al., 2008; Trutzer et al., 2019). Khan et al. (2015) suggest that feedback projections from higher areas control non‐linear aspects of cortical processing, whereas feedforward projections are inherently linear. This implies that reduced feedback from higher areas would result in reduction in the non‐linear aspects of cortical processing while the linear aspects remain intact, leading to more veridical perception of the external world. In this context, this would mean that veridical perception of the Poggendorff illusion, which is equal to reduced susceptibility, can arise from reduced contextual modulation or reduced non‐linear cortical processing, which is facilitated by feedback from higher areas.
The lack of top‐down modulation may also be related to the observed narrower focus of attention in individuals with ASD (Robertson et al., 2013). Ronconi et al. (2018) suggested that individuals with ASD have weaker neural suppression surrounding the focus of attention due to impaired feedback projections from higher areas. This idea is further supported by the research of Schallmo et al. (2020), who showed how weaker neural suppression could arise from narrow top‐down gain or narrower window of attention. This is in line with our results shown in Figure 5a–c. When the size of interaction fields is reduced (narrowed) due to the lack of feedback from higher areas, the absolute width of surround suppression is reduced, even though the E/I ratio may be intact. This suggests possible links between the lack of top‐down modulation and detailed‐focused processing style (narrower focus) in individuals with ASD. Happé's (1996) original argument is also in line with our result, when she explained the reduced susceptibility to certain visual illusions in individuals with ASD with Weak Central Coherence Theory (WCC), which predicts that individuals with ASD would be less susceptible to visual illusions due to the relatively weakened integration of illusion‐inducing line and illusion‐induced line. The reduced size of the Interaction Field in our model can reflect this possibility. This line of reasoning is also consistent with Bayesian account of ASD, which predicts that the inflexibility of processing prediction errors would result in reduced influence of contextual modulation in the perception of individuals with ASD (van de Cruys et al., 2014), and related with the model results reported in Figure 8 that demonstrate how reduced top‐down modulation can result in the relatively weakened integration of illusion‐inducing line and illusion‐induced line. Thus, this lack of top‐down modulation, which has been raised by multiple researchers as potential underlying pathology in ASD, could underlie atypical perceptual processing in individuals with ASD (Brosnan et al., 2004; Castelli et al., 2002; Frith, 2004; Gilbert & Li, 2013; Happé & Frith, 2006; Just et al., 2004).
Compared to typically developed individuals, another neurobiological change in ASD is excitation/inhibition (E/I) imbalance. Our results showed that the susceptibility to the Poggendorff illusion decreased with elevated E/I ratio. Incorporating elevated E/I ratio in our model resulted in a reduced representation of the Poggendorff illusion. Excitation/inhibition imbalance is often suggested as the core characteristic of the brain in ASD and the potential underlying cause of atypical sensory perception of individuals with ASD in multiple sensory modalities, including atypical response to auditory stimuli (Ida‐Eto et al., 2017; Kondo & Lin, 2020; Visser et al., 2013), tactile stimuli (Orefice et al., 2016; Tannan et al., 2008) and visual stimuli (Casanova et al., 2003; Chung & Son, 2020; Robertson et al., 2014; Robertson et al., 2016; Rosenberg et al., 2015; Rubenstein & Merzenich, 2003; Snijders et al., 2013; Spiegel et al., 2019). In fact, Flevaris and Murray (2015) found that orientation‐specific suppression in V1 decreases with increasing autistic tendency, which is directly relevant to our results. Genetic studies of autism also link GABA receptor gene alterations with autism (Ma et al., 2005; Piton et al., 2013). In addition, fewer GABA subunits have been identified in post‐mortem brain of individuals with ASD (Fatemi et al., 2014), and the density of inhibitory interneurons in some cortical areas may be reduced in ASD (Ariza et al., 2018; Hashemi et al., 2017; Zikopoulos & Barbas, 2013). These pieces of evidence suggest that reduced inhibition could be the cause of elevated E/I ratio; however, this does not rule out the possibility that increased glutamatergic levels or increased density of excitatory pathways may be the cause of elevated E/I ratio (Dickinson et al., 2016; Shinohe et al., 2006; Vattikuti & Chow, 2010; Zikopoulos & Barbas, 2010; Zikopoulos, García‐Cabezas, et al., 2018; Zikopoulos, Liu, et al., 2018). Our approach is one of the possible ways through which the balance of excitation and inhibition can change, because we use normalized Gaussian for the excitatory and inhibitory components, when the standard deviation (sigma) changes, the peak amplitude changes; hence, the balance between excitation and inhibition changes.
Taken together, our findings highlight potential mechanisms underlying the heterogeneity of ASD, since each of the traits we examined aligns with distinct frameworks that have been developed to account for atypical sensory processing in ASD. Specifically, the WCC theory and Bayesian account of ASD, which are compatible with the idea of reduced illusion susceptibility due to a processing bias that could result in reduced contextual modulation (Happé, 1996), align well with weak top‐down modulation. Conversely, Enhanced Perceptual Functioning (EPF) hypothesis, which stipulates that there is a preference in local over global processing in ASD (Van der Hallen et al., 2015), aligns more with excitation/inhibition imbalance.
In summary, in our model of the primate visual system, we incorporated potential neurobiological changes in ASD inferred from functional imaging, physiological and neuroanatomical data to investigate their impact on the representation of a class of visual illusions, related to orientation perception based on angle repulsion, which stems from inhibitory interactions in visual orientation processing (Blakemore et al., 1971; Clifford, 2014; Prinzmetal & Beck, 2001; Seymour et al., 2018). Considering the replication of ASD visual representation by the neural model, we propose that the neuronal disruptions that result in relatively weakened inhibition in the orientation processing mechanism would contribute in reduced susceptibility to the Poggendorff illusion. In our parameterizations of the model, susceptibility to the Poggendorff illusion decreased with relatively weakened inhibition, either from excitation/inhibition imbalance or reduced top‐down modulation, or both. Together, these insights led us to propose that the presence of excitation/inhibition imbalance or/and reduced top‐down modulation in visual cortices could lead to less susceptibility to the Poggendorff illusion and related visual orientation‐based illusions. These two traits, excitation/inhibition imbalance and reduced top‐down modulation, are likely present in visual cortices of individuals with ASD (Casanova et al., 2003; Chung & Son, 2020; Flevaris & Murray, 2015; Isler et al., 2010; Kessler et al., 2016; Robertson et al., 2014, 2016; Rosenberg et al., 2015; Rubenstein & Merzenich, 2003; Seymour et al., 2019; Snijders et al., 2013; Spiegel et al., 2019). Therefore, the presence of either one or both of these traits in the visual cortices of individuals with ASD could lead to less susceptibility to the Poggendorff and related illusions that share the same rod‐and‐frame underlying mechanism, such as Zöllner, Roelof, Tilt and Ponzo illusions (Blakemore et al., 1971; Bridgeman et al., 2018; Clifford, 2014; Prinzmetal & Beck, 2001; Seymour et al., 2018).
Limitations of our study, which stem from inherent limitations of neural models, involve simplifications and assumptions about circuit interactions, processes and pathology that may not capture all relevant details in typical sensory processing networks and in ASD. Moreover, additional neurobiological changes in ASD will need to be incorporated in neural models to investigate potential contributions in sensory abnormalities reported in individuals with ASD. The current approach is designed to quantify the strength of the effects of key relevant neurobiological features and processes, such as the imbalance in excitation/inhibition and reduced top‐down modulation, in the strength of perception of orientation‐based illusions and in reduced illusion susceptibility in ASD. Importantly, our approach can be used to systematically test the range of changes in a variety of ASD traits that cover the spectrum of phenotypes and the heterogeneous nature of autism. To further verify our neural modelling result that excitation/inhibition imbalance or/and reduced top‐down modulation can lead to reduced illusion susceptibility in some individuals with ASD, future research could, for instance, measure the E/I ratio of individuals along with susceptibility to visual illusions and examine the relationship between these measures. Despite numerous studies highlighting disruption of sensory perception in ASD, there is a need for additional studies on the mechanisms underlying sensory abnormalities in individuals with ASD. Thus, it would be informative to further expand in future research on how specific autistic traits give rise to perceptual abnormalities in individuals with ASD. The neural modelling approach we developed can be used to investigate the atypical perceptual processing in autism, shed light on the relationship between heterogeneous neurological traits and circuit disruptions in ASD and uncover novel pathological processes and interactions.
5. LAY SUMMARY
Individuals with autism perceive the external world, including visual scenes, differently. To better understand potential brain changes in autism, we developed a neural model that can mimic our brain's visual system and showed that people with autism are less susceptible to some visual illusions, because of potential changes in brain wiring. This work can form a framework for the study of autism heterogeneity and the development of new diagnostics.
CONFLICT OF INTEREST
The authors declare no competing financial interests.
PEER REVIEW
The peer review history for this article is available at https://publons.com/publon/10.1111/ejn.15739.
ACKNOWLEDGEMENT
We would like to thank Dr. Helen Tager‐Flusberg for her useful comments during discussions of this work.
Park, S. , Zikopoulos, B. , & Yazdanbakhsh, A. (2022). Visual illusion susceptibility in autism: A neural model. European Journal of Neuroscience, 56(3), 4246–4265. 10.1111/ejn.15739
Funding informationBZ and AY are supported by the National Institute of Mental Health R01MH118500.
Edited by: Panayiota Poirazi
Funding information National Institute of Mental Health, Grant/Award Number: R01MH118500
Contributor Information
Basilis Zikopoulos, Email: zikopoul@bu.edu.
Arash Yazdanbakhsh, Email: yazdan@bu.edu.
DATA AVAILABILITY STATEMENT
The source codes for the neural model and analysis are available online (https://github.com/sangwookparkbu/sangwookparkbu).
REFERENCES
- Ariza, J. , Rogers, H. , Hashemi, E. , Noctor, S. C. , & Martínez‐Cerdeño, V. (2018). The number of chandelier and basket cells are differentially decreased in prefrontal cortex in autism. Cerebral Cortex, 28(2), 411–420. 10.1093/cercor/bhw349 [DOI] [PMC free article] [PubMed] [Google Scholar]
- Baron‐Cohen, S. (2006). The hyper‐systemizing, assortative mating theory of autism. Progress in Neuro‐Psychopharmacology and Biological Psychiatry, 30(5), 865–872. 10.1016/j.pnpbp.2006.01.010 [DOI] [PubMed] [Google Scholar]
- Blakemore, C. , Carpenter, R. H. , & Georgeson, M. A. (1970). Lateral inhibition between orientation detectors in the human visual system. Nature, 228(5266), 37–39. https://orcid.org/10.1038/228037a0 [DOI] [PubMed] [Google Scholar]
- Blakemore, C. , Carpenter, R. H. S. , & Georgeson, M. A. (1971). Lateral thinking about lateral inhibition. Nature, 234(5329), 418–419. 10.1038/234418b0 4945909 [DOI] [Google Scholar]
- Bölte, S. , Holtmann, M. , Poustka, F. , Scheurich, A. , & Schmidt, L. (2007). Gestalt perception and local‐global processing in high‐functioning autism. Journal of Autism and Developmental Disorders, 37, 1493–1504 Available at: http://link.springer.com/10.1007/s10803-006-0231-x. 10.1007/s10803-006-0231-x [DOI] [PubMed] [Google Scholar]
- Booth, R. D. L. , & Happé, F. G. E. (2018). Evidence of reduced global processing in autism spectrum disorder. Journal of Autism and Developmental Disorders, 48(4), 1397–1408. 10.1007/s10803-016-2724-6 [DOI] [PMC free article] [PubMed] [Google Scholar]
- Bridgeman, B. , Dassonville, P. , & Lester, B. D. (2018). The Roelofs and induced Roelofs effects. Consciousness and Cognition, 64, 6–12. 10.1016/j.concog.2018.05.009 [DOI] [PubMed] [Google Scholar]
- Briggs, F. , & Usrey, W. M. (2004). A shrewd insight for vision. Nature Neuroscience, 7(8), 796–797. 10.1038/nn0804-796 [DOI] [PMC free article] [PubMed] [Google Scholar]
- Briggs, F. , & Usrey, W. M. (2007). A fast, reciprocal pathway between the lateral geniculate nucleus and visual cortex in the macaque monkey. Journal of Neuroscience, 27(20), 5431–5436. 10.1523/JNEUROSCI.1035-07.2007 [DOI] [PMC free article] [PubMed] [Google Scholar]
- Brosnan, M. J. , Scott, F. J. , Fox, S. , & Pye, J. (2004). Gestalt processing in autism: Failure to process perceptual relationships and the implications for contextual understanding. Journal of Child Psychology and Psychiatry and Allied Disciplines, 45(3), 459–469. 10.1111/j.1469-7610.2004.00237.x [DOI] [PubMed] [Google Scholar]
- Bullier, J. (2001). Integrated model of visual processing. Brain Research. Brain Research Reviews, 36(2–3), 96–107. 10.1016/s0165-0173(01)00085-6 [DOI] [PubMed] [Google Scholar]
- Casanova, M. F. , Buxhoeveden, D. , & Gomez, J. (2003). Disruption in the inhibitory architecture of the cell minicolumn: Implications for autisim. The Neuroscientist, 9(6), 496–507. 10.1177/1073858403253552 [DOI] [PubMed] [Google Scholar]
- Castelli, F. , Frith, C. , Happé, F., & Frith, U. (2002). Autism, Asperger syndrome and brain mechanisms for the attribution of mental states to animated shapes. Brain, 125, 1839–1849. 10.1093/brain/awf189 [DOI] [PubMed] [Google Scholar]
- Chung, S. , & Son, J. W. (2020). Visual perception in autism spectrum disorder: A review of neuroimaging studies. Journal of the Korean Academy of Child and Adolescent Psychiatry, 31(3), 105–120. 10.5765/jkacap.200018 [DOI] [PMC free article] [PubMed] [Google Scholar]
- Clifford, C. W. G. (2014). The tilt illusion: Phenomenology and functional implications. Vision Research, 104, 3–11. 10.1016/j.visres.2014.06.009 [DOI] [PubMed] [Google Scholar]
- Dickinson, A. , Jones, M. , & Milne, E. (2016). Measuring neural excitation and inhibition in autism: Different approaches, different findings and different interpretations. In brain research (Vol. 1648). Elsevier. 10.1016/j.brainres.2016.07.011 [DOI] [PubMed] [Google Scholar]
- Fatemi, S. H. , Reutiman, T. J. , Folsom, T. D. , Rustan, O. G. , Rooney, R. J. , & Thuras, P. D. (2014). Downregulation of GABAA receptor protein subunits α6, β2, δ, ε, γ2, θ, and ρ2 in superior frontal cortex of subjects with autism. Journal of Autism and Developmental Disorders, 44(8), 1833–1845. 10.1007/s10803-014-2078-x [DOI] [PubMed] [Google Scholar]
- Flevaris, A. V. , & Murray, S. O. (2015). Orientation‐specific surround suppression in the primary visual cortex varies as a function of autistic tendency. Frontiers in Human Neuroscience, 8, 1017. 10.3389/fnhum.2014.01017 [DOI] [PMC free article] [PubMed] [Google Scholar]
- Frith, C. (2004). Is autism a disconnection disorder? Lancet Neurology, 3, 577. 10.1016/S1474-4422(04)00875-0 [DOI] [PubMed] [Google Scholar]
- Frith, U. (1989). Autism: Explaining the enigma. Blackwell Science. [Google Scholar]
- Georgopoulos, A. P. , Schwartz, A. B. , & Kettner, R. E. (1986). Neuronal population coding of movement direction. Science, 233(4771), 1416–1419. 10.1126/science.3749885 [DOI] [PubMed] [Google Scholar]
- Gibson, J. J. , & Radner, M. (1937). Adaptation, after‐effect and contrast in the perception of tilted lines. I. Quantitative studies. Journal of Experimental Psychology, 20(5), 453–467. 10.1037/h0059826 [DOI] [Google Scholar]
- Gilbert, C. , & Li, W. (2013). Top‐down influences on visual processing. Nature Review Neuroscience, 14, 350–363. 10.1038/nrn3476 [DOI] [PMC free article] [PubMed] [Google Scholar]
- Gilbert, C. D. , & Wiesel, T. N. (1990). The influence of contextual stimuli on the orientation selectivity of cells in primary visual cortex of the cat. Vision Research, 30(11), 1689–1701. 10.1016/0042-6989(90)90153-C [DOI] [PubMed] [Google Scholar]
- Gori, S. , Molteni, M. , & Facoetti, A. (2016). Visual illusions: An interesting tool to investigate developmental dyslexia and autism spectrum disorder. Frontiers in Human Neuroscience, 10, 175. 10.3389/fnhum.2016.00175 [DOI] [PMC free article] [PubMed] [Google Scholar]
- Green, S. A. , Hernandez, L. , Tottenham, N. , Krasileva, K. , Bookheimer, S. Y. , & Dapretto, M. (2015). Neurobiology of sensory overresponsivity in youth with autism Spectrum disorders. JAMA Psychiatry, 72(8), 778–786. 10.1001/jamapsychiatry.2015.0737 [DOI] [PMC free article] [PubMed] [Google Scholar]
- Grossberg, S. (1973). Contour enhancement, short term memory, and constancies in reverberating neural networks. Studies in Applied Mathematics, 52(3), 213–257. 10.1002/sapm1973523213 [DOI] [Google Scholar]
- Grossberg, S. , & Mingolla, E. (1985). Neural dynamics of perceptual grouping: Textures, boundaries, and emergent segmentations. Perception & Psychophysics, 38(2), 141–171. 10.3758/BF03198851 [DOI] [PubMed] [Google Scholar]
- Happé, F. , & Frith, U. (2006). The weak coherence account: Detail‐focused cognitive style in autism spectrum disorders. Journal of Autism and Developmental Disorders, 36(1), 5–25. 10.1007/s10803-005-0039-0 [DOI] [PubMed] [Google Scholar]
- Happé, F. G. E. (1996). Studying weak central coherence at low levels: Children with autism do not succumb to visual illusions. A research note. Journal of Child Psychology and Psychiatry, 37, 873–877. PMID: Available at: https://onlinelibrary.wiley.com/doi/10.1111/j.1469-7610.1996.tb01483.x [DOI] [PubMed] [Google Scholar]
- Hashemi, E. , Ariza, J. , Rogers, H. , Noctor, S. C. , & Martínez‐Cerdeño, V. (2017). The number of parvalbumin‐expressing interneurons is decreased in the prefrontal cortex in autism. Cerebral Cortex, 27(3), 1931–1943. 10.1093/cercor/bhw021 [DOI] [PMC free article] [PubMed] [Google Scholar]
- Horder, J. , Wilson, C. E. , Mendez, M. A. , & Murphy, D. G. (2014). Autistic traits and abnormal sensory experiences in adults. Journal of Autism and Developmental Disorders, 44(6), 1461–1469. 10.1007/s10803-013-2012-7 [DOI] [PMC free article] [PubMed] [Google Scholar]
- Hoy, J. A. , Hatton, C. , & Hare, D. (2004). Weak central coherence: A cross‐domain phenomenon specific to autism? Autism, 8(3), 267–281. 10.1177/1362361304045218 [DOI] [PubMed] [Google Scholar]
- Hubel, D. H. , & Wiesel, T. N. (1977). Ferrier lecture: Functional architecture of macaque monkey visual cortex. Proceedings of the Royal Society of London B: Biological Sciences, 198(1130), 1–59. 10.1098/rspb.1977.0085 [DOI] [PubMed] [Google Scholar]
- Hughes, J. R. (2007). Autism: The first firm finding = underconnectivity? Epilepsy and Behavior, 11(1), 20–24. 10.1016/j.yebeh.2007.03.010 [DOI] [PubMed] [Google Scholar]
- Ida‐Eto, M. , Hara, N. , Ohkawara, T. , & Narita, M. (2017). Mechanism of auditory hypersensitivity in human autism using autism model rats. Pediatrics International, 59(4), 404–407. 10.1111/ped.13186 [DOI] [PubMed] [Google Scholar]
- Ishida, R. , Kamio, Y. , & Nakamizo, S. (2009). Perceptual distortions of visual illusions in children with high‐functioning autism spectrum disorder. Psychologia, 52(3), 175–187. 10.2117/psysoc.2009.175 [DOI] [Google Scholar]
- Isler, J. R. , Martien, K. M. , Grieve, P. G. , Stark, R. I. , & Herbert, M. R. (2010). Reduced functional connectivity in visual evoked potentials in children with autism spectrum disorder. Clinical Neurophysiology, 121(12), 2035–2043. 10.1016/j.clinph.2010.05.004 [DOI] [PubMed] [Google Scholar]
- Just, M. A. , Cherkassky, V. L. , Keller, T. A. , Kana, R. K. , & Minshew, N. J. (2007). Functional and anatomical cortical underconnectivity in autism: Evidence from an fmri study of an executive function task and corpus callosum morphometry. Cerebral Cortex, 17(4), 951–961. 10.1093/cercor/bhl006 [DOI] [PMC free article] [PubMed] [Google Scholar]
- Just, M. A. , Cherkassky, V. L. , Keller, T. A. , & Minshew, N. J. (2004). Cortical activation and synchronization during sentence comprehension in high‐functioning autism: Evidence of underconnectivity. Brain, 127(8), 1811–1821. 10.1093/brain/awh199 [DOI] [PubMed] [Google Scholar]
- Kana, R. K. , Libero, L. E. , & Moore, M. S. (2011). Disrupted cortical connectivity theory as an explanatory model for autism spectrum disorders. Physics of Life Reviews, 8(4), 410–437. 10.1016/j.plrev.2011.10.001 [DOI] [PubMed] [Google Scholar]
- Kennedy, H. , Martin, K. A. C. , Orban, G. A. , & Whitteridge, D. (1985). Receptive field properties of neurones in visual area 1 and visual area 2 in the baboon. Neuroscience, 14(2), 405–415. 10.1016/0306-4522(85)90300-8 [DOI] [PubMed] [Google Scholar]
- Kessler, K. , Seymour, R. A. , & Rippon, G. (2016). Brain oscillations and connectivity in autism spectrum disorders (ASD): New approaches to methodology, measurement and modelling. Neuroscience and Biobehavioral Reviews, 71, 601–620. 10.1016/j.neubiorev.2016.10.002 [DOI] [PubMed] [Google Scholar]
- Khan, S. , Michmizos, K. , Tommerdahl, M. , Ganesan, S. , Kitzbichler, M. G. , Zetino, M. , Garel, K. L. A. , Herbert, M. R. , Hämäläinen, M. S. , & Kenet, T. (2015). Somatosensory cortex functional connectivity abnormalities in autism show opposite trends, depending on direction and spatial scale. Brain, 138(5), 1394–1409. 10.1093/brain/awv043 [DOI] [PMC free article] [PubMed] [Google Scholar]
- Kolodny, T. , Schallmo, M. P. , Gerdts, J. , Bernier, R. A. , & Murray, S. O. (2020). Response dissociation in hierarchical cortical circuits: A unique feature of autism spectrum disorder. Journal of Neuroscience, 40(10), 2269–2281. 10.1523/JNEUROSCI.2376-19.2020 [DOI] [PMC free article] [PubMed] [Google Scholar]
- Kondo, H. M. , & Lin, I. F. (2020). Excitation‐inhibition balance and auditory multistable perception are correlated with autistic traits and schizotypy in a non‐clinical population. Scientific Reports, 10(1), 1–12. 10.1038/s41598-020-65126-6 [DOI] [PMC free article] [PubMed] [Google Scholar]
- Layton, O. W. , Mingolla, E. , & Yazdanbakhsh, A. (2012). Dynamic coding of border‐ownership in visual cortex. Journal of Vision, 12(13), 1–21. 10.1167/12.13.8 [DOI] [PubMed] [Google Scholar]
- Layton, O. W. , Mingolla, E. , & Yazdanbakhsh, A. (2014). Neural dynamics of feedforward and feedback processing in figure‐ground segregation. Frontiers in Psychology, 5(SEP), 1–20. 10.3389/fpsyg.2014.00972 [DOI] [PMC free article] [PubMed] [Google Scholar]
- Layton, O. W. , & Yazdanbakhsh, A. (2015). A neural model of border‐ownership from kinetic occlusion. Vision Research, 106, 64–80. 10.1016/j.visres.2014.11.002 [DOI] [PubMed] [Google Scholar]
- Liang, H. , Gong, X. , Chen, M. , Yan, Y. , Li, W. , & Gilbert, C. D. (2017). Interactions between feedback and lateral connections in the primary visual cortex. Proceedings of the National Academy of Sciences of the United States of America, 114(32), 8637–8642. 10.1073/pnas.1706183114 [DOI] [PMC free article] [PubMed] [Google Scholar]
- Liu, X. , Bautista, J. , Liu, E. , & Zikopoulos, B. (2020). Imbalance of laminar‐specific excitatory and inhibitory circuits of the orbitofrontal cortex in autism. Molecular Autism, 11(1), 1–19. 10.1186/s13229-020-00390-x [DOI] [PMC free article] [PubMed] [Google Scholar]
- Ma, D. Q. , Whitehead, P. L. , Menold, M. M. , Martin, E. R. , Ashley‐Koch, A. E. , Mei, H. , Ritchie, M. D. , Delong, G. R. , Abramson, R. K. , Wright, H. H. , Cuccaro, M. L. , Hussman, J. P. , Gilbert, J. R. , & Pericak‐Vance, M. A. (2005). Identification of significant association and gene‐gene interaction of GABA receptor subunit genes in autism. American Journal of Human Genetics, 77(3), 377–388. 10.1086/433195 [DOI] [PMC free article] [PubMed] [Google Scholar]
- McManus, J. N. J. , Li, W. , & Gilbert, C. D. (2011). Adaptive shape processing in primary visual cortex. Proceedings of the National Academy of Sciences of the United States of America, 108(24), 9739–9746. 10.1073/pnas.1105855108 [DOI] [PMC free article] [PubMed] [Google Scholar]
- Michalareas, G. , Vezoli, J. , van Pelt, S. , Schoffelen, J. M. , Kennedy, H. , & Fries, P. (2016). Alpha‐Beta and Gamma rhythms subserve feedback and feedforward influences among human visual cortical areas. Neuron, 89(2), 384–397. 10.1016/j.neuron.2015.12.018 [DOI] [PMC free article] [PubMed] [Google Scholar]
- Milne, E. , & Scope, A. (2008). Are children with autistic spectrum disorders susceptible to contour illusions? British Journal of Developmental Psychology, 26(1), 91–102. 10.1348/026151007X202509 [DOI] [Google Scholar]
- Mitchell, P. , Mottron, L. , Soulières, I. , & Ropar, D. (2010). Susceptibility to the Shepard illusion in participants with autism: Reduced top‐down influences within perception? Autism Research, 3(3), 113–119. 10.1002/aur.130 [DOI] [PubMed] [Google Scholar]
- Orefice, L. L. , Zimmerman, A. L. , Chirila, A. M. , Sleboda, S. J. , Head, J. P. , & Ginty, D. D. (2016). Peripheral Mechanosensory neuron dysfunction underlies tactile and behavioral deficits in mouse models of ASDs. Cell, 166(2), 299–313. 10.1016/j.cell.2016.05.033 [DOI] [PMC free article] [PubMed] [Google Scholar]
- Pak, A. , Ryu, E. , Li, C. , & Chubykin, A. A. (2020). Top‐down feedback controls the cortical representation of illusory contours in mouse primary visual cortex. Journal of Neuroscience, 40(3), 648–660. 10.1523/JNEUROSCI.1998-19.2019 [DOI] [PMC free article] [PubMed] [Google Scholar]
- Piëch, V. , Li, W. , Reeke, G. N. , & Gilbert, C. D. (2013). Network model of top‐down influences on local gain and contextual interactions in visual cortex. Proceedings of the National Academy of Sciences of the United States of America, 110(43), E4108–E4117. 10.1073/pnas.1317019110 [DOI] [PMC free article] [PubMed] [Google Scholar]
- Piton, A. , Jouan, L. , Rochefort, D. , Dobrzeniecka, S. , Lachapelle, K. , Dion, P. A. , Gauthier, J. , & Rouleau, G. A. (2013). Analysis of the effects of rare variants on splicing identifies alterations in GABA a receptor genes in autism spectrum disorder individuals. European Journal of Human Genetics, 21(7), 749–756. 10.1038/ejhg.2012.243 [DOI] [PMC free article] [PubMed] [Google Scholar]
- Prinzmetal, W. , & Beck, D. M. (2001). The tilt‐constancy theory of visual illusions. Journal of Experimental Psychology: Human Perception and Performance, 1, 206–217. 10.1037//0096-1523.27.1.206 [DOI] [PubMed] [Google Scholar]
- Ramalingam, N. , McManus, J. N. J. , Li, W. , & Gilbert, C. D. (2013). Top‐down modulation of lateral interactions in visual cortex. Journal of Neuroscience, 33(5), 1773–1789. 10.1523/JNEUROSCI.3825-12.2013 [DOI] [PMC free article] [PubMed] [Google Scholar]
- Robertson, C. E. , & Baron‐Cohen, S. (2017). Sensory perception in autism. Nature Reviews Neuroscience, 18(11), 671–684. 10.1038/nrn.2017.112 [DOI] [PubMed] [Google Scholar]
- Robertson, C. E. , Kravitz, D. J. , Freyberg, J. , Baron‐Cohen, S. , & Baker, C. I. (2013). Tunnel vision: Sharper gradient of spatial attention in autism. Journal of Neuroscience, 33(16), 6776–6781. 10.1523/JNEUROSCI.5120-12.2013 [DOI] [PMC free article] [PubMed] [Google Scholar]
- Robertson, C. E. , Ratai, E. M. , & Kanwisher, N. (2016). Reduced GABAergic action in the autistic brain. Current Biology, 26(1), 80–85. 10.1016/j.cub.2015.11.019 [DOI] [PubMed] [Google Scholar]
- Robertson, C. E. , Thomas, C. , Kravitz, D. J. , Wallace, G. L. , Baron‐Cohen, S. , Martin, A. , & Baker, C. I. (2014). Global motion perception deficits in autism are reflected as early as primary visual cortex. Brain, 137(9), 2588–2599. 10.1093/brain/awu189 [DOI] [PMC free article] [PubMed] [Google Scholar]
- Ronconi, L. , Gori, S. , Federici, A. , Devita, M. , Carna, S. , Sali, M. E. , Molteni, M. , Casartelli, L. , & Facoetti, A. (2018). Weak surround suppression of the attentional focus characterizes visual selection in the ventral stream in autism. NeuroImage: Clinical, 18(912–922), 912–922. 10.1016/j.nicl.2018.02.014 [DOI] [PMC free article] [PubMed] [Google Scholar]
- Ropar, D. , & Mitchell, P. (1999). Are individuals with autism and Asperger's syndrome susceptible to visual illusions? Journal of Child Psychology and Psychiatry and Allied Disciplines, 40(8), 1283–1293. 10.1017/S0021963099004667 [DOI] [PubMed] [Google Scholar]
- Rosenberg, A. , Patterson, J. S. , & Angelaki, D. E. (2015). A computational perspective on autism. Proceedings of the National Academy of Sciences of the United States of America, 112(30), 9158–9165. 10.1073/pnas.1510583112 [DOI] [PMC free article] [PubMed] [Google Scholar]
- Rubenstein, J. L. R. , & Merzenich, M. M. (2003). Model of autism: Increased ratio of excitation/inhibition in key neural systems. Genes, Brain and Behavior, 2(5), 255–267. 10.1034/j.1601-183X.2003.00037.x [DOI] [PMC free article] [PubMed] [Google Scholar]
- Schallmo, M. P. , Kolodny, T. , Kale, A. M. , Millin, R. , Flevaris, A. V. , Edden, R. A. E. , Gerdts, J. , Bernier, R. A. , & Murray, S. O. (2020). Weaker neural suppression in autism. Nature Communications, 11(1), 1–13. 10.1038/s41467-020-16495-z [DOI] [PMC free article] [PubMed] [Google Scholar]
- Schwartz, O. , Sejnowski, T. J. , & Dayan, P. (2009). Perceptual organization in the tilt illusion. Journal of Vision, 9(4), 1–20. 10.1167/9.4.19 [DOI] [PMC free article] [PubMed] [Google Scholar]
- Seymour, K. J. , Stein, T. , Clifford, C. , & Sterzer, P. (2018). Cortical suppression in human primary visual cortex predicts individual differences in illusory tilt perception. Journal of Vision, 18(11), 3. 10.1167/18.11.3 [DOI] [PubMed] [Google Scholar]
- Seymour, R. A. , Rippon, G. , Gooding‐Williams, G. , Schoffelen, J. M. , & Kessler, K. (2019). Dysregulated oscillatory connectivity in the visual system in autism spectrum disorder. Brain, 142(10), 3294–3305. 10.1093/brain/awz214 [DOI] [PMC free article] [PubMed] [Google Scholar]
- Shinohe, A. , Hashimoto, K. , Nakamura, K. , Tsujii, M. , Iwata, Y. , Tsuchiya, K. J. , Sekine, Y. , Suda, S. , Suzuki, K. , Sugihara, G. , Matsuzaki, H. , Minabe, Y. , Sugiyama, T. , Kawai, M. , Iyo, M. , Takei, N. , & Mori, N. (2006). Increased serum levels of glutamate in adult patients with autism. Progress in Neuro‐Psychopharmacology and Biological Psychiatry, 30(8), 1472–1477. 10.1016/j.pnpbp.2006.06.013 [DOI] [PubMed] [Google Scholar]
- Snijders, T. M. , Milivojevic, B. , & Kemner, C. (2013). Atypical excitation‐inhibition balance in autism captured by the gamma response to contextual modulation. NeuroImage: Clinical, 3, 65–72. 10.1016/j.nicl.2013.06.015 [DOI] [PMC free article] [PubMed] [Google Scholar]
- Spiegel, A. , Mentch, J. , Haskins, A. J. , & Robertson, C. E. (2019). Slower binocular rivalry in the autistic brain. Current Biology, 29(17), 2948–2953.e3. 10.1016/j.cub.2019.07.026 [DOI] [PubMed] [Google Scholar]
- Tanabe, S. (2013). Population codes in the visual cortex. Neuroscience Research, 76(3), 101–105. 10.1016/j.neures.2013.03.010 [DOI] [PMC free article] [PubMed] [Google Scholar]
- Tannan, V. , Holden, J. K. , Zhang, Z. , Baranek, G. T. , & Tommerdahl, M. A. (2008). Perceptual metrics of individuals with autism provide evidence for disinhibition. Autism Research, 1(4), 223–230. 10.1002/aur.34 [DOI] [PMC free article] [PubMed] [Google Scholar]
- Thakkar, K. N. , Polli, F. E. , Joseph, R. M. , Tuch, D. S. , Hadjikhani, N. , Barton, J. J. S. , & Manoach, D. S. (2008). Response monitoring, repetitive behaviour and anterior cingulate abnormalities in autism spectrum disorders (ASD). Brain, 131(9), 2464–2478. 10.1093/brain/awn099 [DOI] [PMC free article] [PubMed] [Google Scholar]
- Thye, M. D. , Bednarz, H. M. , Herringshaw, A. J. , Sartin, E. B. , & Kana, R. K. (2018). The impact of atypical sensory processing on social impairments in autism spectrum disorder. Developmental Cognitive Neuroscience, 29, 151–167. 10.1016/j.dcn.2017.04.010 [DOI] [PMC free article] [PubMed] [Google Scholar]
- Trutzer, I. M. , García‐Cabezas, M. Á. , & Zikopoulos, B. (2019). Postnatal development and maturation of layer 1 in the lateral prefrontal cortex and its disruption in autism. Acta Neuropathologica Communications, 7(1), 40. 10.1186/s40478-019-0684-8 [DOI] [PMC free article] [PubMed] [Google Scholar]
- Utzerath, C. , Schmits, I. C. , Kok, P. , Buitelaar, J. , & de Lange, F. P. (2019). No evidence for altered up‐ and downregulation of brain activity in visual cortex during illusory shape perception in autism. Cortex, 117, 247–256. 10.1016/j.cortex.2019.03.011 [DOI] [PubMed] [Google Scholar]
- van de Cruys, S. , Evers, K. , van der Hallen, R. , van Eylen, L. , Boets, B. , de‐Wit, L. , & Wagemans, J. (2014). Precise minds in uncertain worlds: Predictive coding in autism. Psychological Review, 121(4), 649–675. 10.1037/a0037665 [DOI] [PubMed] [Google Scholar]
- van der Hallen, R. , Evers, K. , Brewaeys, K. , van den Noortgate, W. , & Wagemans, J. (2015). Global processing takes time: A meta‐analysis on local–global visual processing in ASD. Psychological Bulletin, 141, 549–573. PMID: Available at: http://doi.apa.org/getdoi.cfm?doi=10.1037/bul0000004 [DOI] [PubMed] [Google Scholar]
- Vattikuti, S. , & Chow, C. C. (2010). A computational model for cerebral cortical dysfunction in autism spectrum disorders. Biological Psychiatry, 1, 67(7), 672–678. 10.1016/j.biopsych.2009.09.008 [DOI] [PMC free article] [PubMed] [Google Scholar]
- Visser, E. , Zwiers, M. P. , Kan, C. C. , Hoekstra, L. , van Opstal, J. , & Buitelaar, J. K. (2013). Atypical vertical sound localization and sound‐onset sensitivity in people with autism spectrum disorders. Journal of Psychiatry and Neuroscience, 38(6), 398–406. 10.1503/jpn.120177 [DOI] [PMC free article] [PubMed] [Google Scholar]
- Vogels, R. (1990). Population coding of stimulus orientation by striate cortical cells. Biological Cybernetics, 64(1), 25–31. 10.1007/BF00203627 [DOI] [PubMed] [Google Scholar]
- Walter, E. , Dassonville, P. , & Bochsler, T. M. (2009). A specific autistic trait that modulates visuospatial illusion susceptibility. Journal of Autism and Developmental Disorders, 39, 339–349. 10.1007/s10803-008-0630-2 [DOI] [PMC free article] [PubMed] [Google Scholar]
- Watanabe, T. , & Rees, G. (2017). Brain network dynamics in high‐functioning individuals with autism. Nature Communications, 8(May), 1–14. 10.1038/ncomms16048 [DOI] [PMC free article] [PubMed] [Google Scholar]
- Wood, E. T. , Cummings, K. K. , Jung, J. , Patterson, G. , Okada, N. , Guo, J. , O'Neill, J. , Dapretto, M. , Bookheimer, S. Y. , & Green, S. A. (2021). Sensory over‐responsivity is related to GABAergic inhibition in thalamocortical circuits. Translational Psychiatry, 11(1), 39. 10.1038/s41398-020-01154-0 [DOI] [PMC free article] [PubMed] [Google Scholar]
- Zikopoulos, B. , & Barbas, H. (2010). Changes in prefrontal axons may disrupt the network in autism. Journal of Neuroscience, 30(44), 14595–14609. 10.1523/JNEUROSCI.2257-10.2010 [DOI] [PMC free article] [PubMed] [Google Scholar]
- Zikopoulos, B. , & Barbas, H. (2013). Altered neural connectivity in excitatory and inhibitory cortical circuits in autism. Frontiers in Human Neuroscience, 7, 609. 10.3389/fnhum.2013.00609 [DOI] [PMC free article] [PubMed] [Google Scholar]
- Zikopoulos, B. , García‐Cabezas, M. Á. , & Barbas, H. (2018). Parallel trends in cortical gray and white matter architecture and connections in primates allow fine study of pathways in humans and reveal network disruptions in autism. In. PLoS Biology, 16(2), e2004559. 10.1371/journal.pbio.2004559 [DOI] [PMC free article] [PubMed] [Google Scholar]
- Zikopoulos, B. , Liu, X. , Tepe, J. , Trutzer, I. , John, Y. J. , & Barbas, H. (2018). Opposite development of short‐ and long‐range anterior cingulate pathways in autism. Acta Neuropathologica, 136(5), 759–778. 10.1007/s00401-018-1904-1 [DOI] [PMC free article] [PubMed] [Google Scholar]
Associated Data
This section collects any data citations, data availability statements, or supplementary materials included in this article.
Data Availability Statement
The source codes for the neural model and analysis are available online (https://github.com/sangwookparkbu/sangwookparkbu).