

Abstract
Health care presents significant contributions towards climate change. An awareness of a health systems carbon footprint provides a quantification of its environmental impact, an understanding of carbon intensive areas to target with reduction measures and a means of mapping trends in emissions over time. Attempts at calculating the carbon footprint of national health systems are few, predominantly of developed nations, and are limited by data availability and methodological inadequacies. There is a need to mobilise countries to understand the role of health care in contributing towards climate change and for them to start engaging in ongoing calculations of their national health system carbon footprints. There is also a need to improve data availability and information systems to allow for such calculations, especially in developing countries where there may be differences in carbon hotspots. Finally, there is a need for continued improvements in the carbon footprint modelling methodology of health systems as data collection and available emission factors, especially of health care specific products and supply chain emissions, improves. Health systems need to join the global fight against climate change.
Keywords: carbon footprint, climate change, health systems
Highlights
Climate change is a significant threat to global health.
Health systems contribute to climate change.
Carbon footprint modelling allows focused decarbonisation of health systems.
Improvements in health care data collection for carbon modelling is needed.
1. INTRODUCTION
Anthropogenic climate change has been repeatedly publicised as being the ‘biggest global health threat of the 21st century’. 1 Efforts to mitigate the effects of human activities on the climate and environment are occurring internationally and at multiple levels, although, arguably, they are not reducing global warming at the desired rate. As the health effects of climate change become more prevalent, health systems will begin to take strain as they are burdened with increasing volumes of patients as well as subjected to extreme weather events, water and energy insecurity and resource constraints. Indeed, much work is being done at present to improve the climate change resilience of health systems, especially in developing nations. 2 , 3 , 4 Although attention has been focused on preparing health systems for climate change, an often‐neglected topic is the contribution of the health sector itself towards climate change. While other industries have been subject to policy and regulation surrounding their contribution to climate change, the health sectors contribution has, for the most part, been ignored, largely due to the nature of the service it provides, and the notion that contribution to climate change is a necessary cost of providing adequate health care. 5 This thinking has started to change, however, especially with the growing understanding of the harmful effects of health care on the environment.
Carbon footprint modelling is a tool that has been applied to countries, institutions, industries and individuals to determine the total greenhouse gas (GHG) emissions that are caused by an activity or product over its life stages. 6 While it is not without its flaws, carbon footprint modelling is widely used, has a vast quantity of published methodology on it and is a way to quantify the environmental impact of an activity and identify areas to target to reduce this impact. Its application in the health sector is fairly recent, but it has a large scope to aid policy makers, health care supply chain procurement, hospital managers and clinical practitioners to develop novel solutions to reduce the climate change contributions of health care. Successful decarbonisation strategies require national‐level health sector data on GHG emissions. This analysis piece discusses the current research on carbon footprint modelling of national health systems, the opportunities that awareness of a health systems carbon footprint provides, challenges to determining such a carbon footprint and recommendations for further research.
2. NATIONAL HEALTH SYSTEM CARBON FOOTPRINTS
At the time of writing, six countries have calculated their national carbon footprint while other researchers have modelled the carbon footprint of the Organisation for Economic Co‐operation and Development (OECD) countries, India and China (Figure 1). 7 , 8 , 9 , 10 , 11 , 12 , 13 The United Kingdom (UK) presents one of the most established measurements of their health system, the National Health Service's (NHS), carbon footprint. Indeed, the NHS's Sustainable Development Unit began measuring its carbon footprint in 2008 and has been doing so since. A recent study by Tennison et.al., used hybrid modelling to measure the emissions from the NHS between 1990 and 2019. 7 They found that in 2019, the NHS produced 25 megatonnes of carbon dioxide equivalent (CO2e) of which the largest proportion of emissions came from the supply chain (62%), delivery of care (24%) and travel to the NHS (10%). 7 Its per capita emissions are 540 kg CO2e. 7 They calculated that emissions had decreased by 26% from 1990, largely due to decarbonisation of the health system, phasing out of chlorofluorocarbon propellants in inhalers and improvement of technology. 7
FIGURE 1.
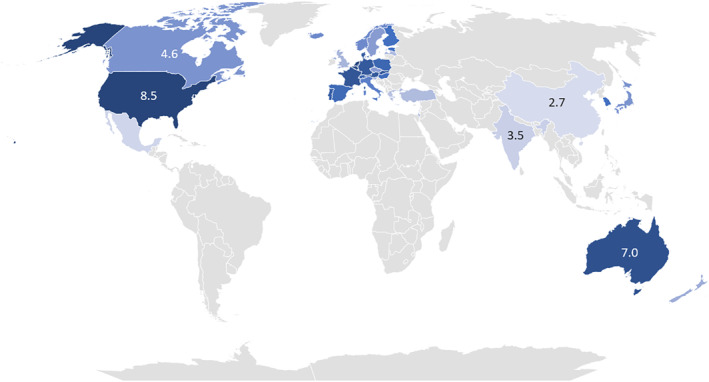
National Health System Carbon Footprints. (Source: Adapted from Pichler et.al., Tennison et.al, Wu, Malik et.al., Eckelman et.al., Nansai et.al.)
The carbon footprint of the American (USA) health system was calculated by Chung and Meltzer in 2009. 8 They found that the health sector contributed 546 million metric tons CO2e, representing 8% of total national GHG emissions, of which 39% was due to hospital activities with 14% due to prescription pharmaceuticals. 8 In 2020, Eckelman et.al., performed economy‐wide modelling and found that GHG emissions of the USA health system were 1692 kg CO2e per capita in 2018 and had risen by 6% between 2010 and 2018. 14 Eckelman et.al., also used an economic‐environmental‐epidemiological modelling framework to determine that Canada's health system produced 33 million tonnes of CO2e in 2014, accounting for 4·6% of national emissions, with hospitals and pharmaceuticals, again, contributing the most. 9
Malik et.al., calculated the Australian health systems carbon footprint between 2014 and 2015 finding that it contributed 35,772 kilotonnes CO2e, representing 7% of the country's total emissions. 10 Public hospitals and pharmaceuticals were the main contributors to emissions. To put it into perspective, the authors noted that ‘the CO2e emissions of health care were about half those of the construction of every single building, house, pipeline, dam, oil rig, road and rail line in Australia in 2014 to 2015’. 10
The carbon footprint of the Chinese health system was calculated by Wu in 2012 and was found to produce 315 megatonnes of CO2e, or 2·7% of China's total emissions. 11 Similar to the previous studies, public hospitals (47%) and non‐hospital pharmaceuticals (18%) were the largest contributors. Overall, pharmaceuticals contributed 55% of the total carbon footprint. 11
The last country that has currently published a carbon footprint of their health system is Japan. Nansai et. al., calculated Japan's carbon footprint in 2011 to be 62·5 × 106 metric tonnes of CO2e which was 4·6% of their total national emissions. 12 They demonstrated an increase of over 15% of total emissions to 72·0 metric tonnes CO2e by 2015. 12 They also found that medical care and pharmaceuticals are the main contributors with the prescription of unused medication resulting in 1·24 metric tonnes CO2e of avoidable emissions. 12
In addition to the above calculations of individual health system carbon footprints, another group of researchers, Pichler et.al., estimated the CO2e emissions of health systems in all OECD countries, China and India between 2000 to 2012. 13 They found that the largest producers of GHG emissions related to health systems were China, USA, Japan, India and Germany, while the contribution of the health systems of the countries in the study was 4·4% of global GHG emissions in 2014. 13 If the carbon footprints of the Chinese and the American health systems were considered as countries, they would rank 10th and 14th globally, and the health sector was found to be the largest contributor towards national carbon footprints in most countries. 13 Medical retail, hospitals and ambulatory health services were the health care areas that contributed the most towards GHG emissions, with 38% of emissions due to electricity and water use, 22% associated with transport and 10% from the pharmaceutical and chemical industries. 13 Of note, the contribution to national carbon footprints of the UK, USA, Canada, Japan, China and Australia differed between the individual studies on these countries health system carbon footprint and the carbon footprint calculated by Pichler et.al. This is testimony to the methodological differences in calculating carbon footprints and the value of access to sufficient data to enable a thorough calculation.
3. OPPORTUNITIES OF NATIONAL HEALTH SECTOR CARBON FOOTPRINT MODELLING
The carbon footprint modelling discussed above provides insight into the extent of the environmental impact of health systems and determines the areas of health care, at a country‐specific level, that have the largest impact. The opportunities that this information provides are massive. As an example, by routinely performing carbon footprint assessments of their health system, the NHS have been able to identify carbon intensive areas and implement measures to reduce it. This includes strategies such as increasing on‐site renewable energy, water efficiency projects, phasing in electric ambulances, engaging in low‐carbon procurement policy, phasing out chlorofluorocarbon propellants in inhalers and investing in sustainable technologies. 7 In addition, knowledge of the carbon footprint breakdown of the NHS and other health systems has provided researchers with areas in which to expand on more nuanced analyses of the environmental impact of health care. For example, equipped with the knowledge of national health system carbon footprints and health care specific modelling methodology, researchers have undertaken focused carbon footprint analysis of health care facilities, of medical disciplines, of medical procedures, of specific clinical conditions and care pathways and of medical equipment. 15 , 16 , 17 , 18 , 19 , 20 , 21 , 22 , 23 Some researchers have taken this to the next level and estimated the reduction in carbon footprint by implementing certain interventions, usually which span multiple disciplines, such as energy and water savings methods, switching to reusable medical equipment, using alternative treatment options or employing new technology in health care. 24 , 25 , 26 , 27 , 28 , 29 , 30 , 31 , 32 , 33 , 34
4. CHALLENGES TO CARBON FOOTPRINT MODELLING
Unfortunately, carbon footprint modelling is often an expensive, highly skilled and time‐consuming process, especially at a national level. The fact that so few countries have engaged in modelling their health systems carbon footprint, is likely a result of challenges to calculating it at this level as well as a lack of realisation of its importance.
A carbon footprint can be calculated using process analysis, environmental input‐output analysis or a hybrid approach. The GHG Protocol by the World Resources Institute and World Business Council for Sustainable Development, 2000, was the first standard to define carbon footprinting and is the basis for carbon footprinting standards. 35 It defines three scopes in the framework of carbon footprinting; (a) scope one: direct emissions, for example, fuel used in personal vehicles or gas used in generators; (b) scope two: indirect admissions, for example, purchased electricity and heat; and (c) scope three: other indirect emissions, for example, from purchased products, waste disposal and public transportation. 35 A thorough carbon footprint model includes all three scopes, however, while scope one and two data may be readily available, accessing scope three data can be a challenge.
The NHS's methodology for calculating their health systems carbon footprint is probably the most advanced. Table 1 shows a comparison between the areas included in the calculation of the NHS's carbon footprint and the recommended scopes of the GHG Protocol. The NHS makes use of hybrid analysis, using a bottom‐up approach for scopes one and two and a top‐down approach for scope three. 7 This contrasts with Pichler et.al., who only utilised a top‐down approach using environmental input‐output modelling of health care expenditure data. 13 Often it is only possible to do a top‐down analysis and while this still provides some insight into the issues, it must be analysed with an understanding of its limitations.
TABLE 1.
A comparison of NHS emission categories and GHG Protocol scope categories
| NHS emission categories | GHG protocol scopes | |
|---|---|---|
| Scope 1 | On‐site fossil fuel use | Direct emissions from sources owned or controlled by the company |
| Anaesthetic gases | ||
| Fleet and leased vehicles | ||
| Scope 2 | Purchased electricity | Indirect emissions from generation of purchased energy |
| Scope 3 | Water and waste | Purchased goods and services |
| Metred dose inhalers | Emissions from capital goods | |
| Business travel | Emissions from fuel and energy | |
| Staff commute | Upstream transportation and distribution | |
| Pharmaceuticals and chemicals | Waste generated in operations | |
| Medical equipment | Business commuting | |
| Non‐medical equipment | Employee commuting | |
| Business services | Upstream leased assets | |
| Food and catering | Downstream transportation and distribution | |
| Commissioned health services | Processing of sold products | |
| Other procurement | Use of sold products | |
| End of life treatment of sold products | ||
| Downstream leased assets | ||
| Franchises | ||
| Investments | ||
| Non‐protocol |
Patient travel Visitor travel |
Abbreviations: GHG, greenhouse gas; NHS, National Health Service's.
Calculating the carbon footprint of a health system also requires the development of very specific methodology and categories of emissions. For example, unique to the health system is the use of anaesthetic gases and metre dose inhalers. Both of these required researchers to determine specific emission factors for these products; research which has now been included by the NHS in their carbon footprint assessment. 31 , 36 Health systems also have unique scope three emissions, including pharmaceutical agents and medical equipment. Scope three is challenging for all industries to determine, as it requires the entire supply chain to produce data on their emissions, often of specific products. Most of health care's supply chain has only recently started calculating their emissions, as can be seen from exploring the websites of pharmaceutical companies, medical device companies and other health care suppliers. Many still do not have data. In addition, it is often challenging for suppliers to calculate their emissions at the level of an individual product as the methodology for such a calculation is sparse. This is particularly true for pharmaceutical agents, as, although research has started to investigate this, the emission factors and methodology to capture the entire life cycle of conversion of active pharmaceutical ingredients into a pharmaceutical product is lacking. 37 , 38 , 39 , 40
One of the biggest limiting factors to calculating a national‐level carbon footprint of a health system is the lack of available data. This is especially true of developing countries. This is a huge gap in the research and knowledge of the area, as all the national carbon footprint assessments of health systems have been performed in developed countries. It is possible that there may be different areas of high carbon intensity in developing health systems as opposed to developed ones. Indeed, while developing countries may be more frugal with their resource use as a result of resource scarcity, and thus may have a lower carbon footprint in this area, most developing countries still rely on coal‐based energy which would result in a higher carbon footprint in this area. Developing health systems may not prioritise environmental issues as they are burdened with an immense number of other issues, however, climate change is inevitably going to impact on developing countries more. Developing countries need to start engaging, both with how they can increase the resilience of their health systems, but also how they can improve them to function at a lower carbon intensity which is invariably cheaper, uses fewer resources and has health benefits for staff, patients and communities.
5. RECOMMENDATIONS
There is a need for all countries to calculate the carbon footprint of their health systems in order to implement targeted measures to reduce it. As all health systems function differently, it is not possible to make anything more than a general comparison about a health system's carbon hotspots based on another country's carbon footprint assessment. In order to determine a country's health systems carbon footprint, there needs to be more investment in bottom‐up data collection and an improvement in information systems. Like the NHS, countries should also perform repeat carbon footprint modelling of their health systems in order to obtain a trend and map areas where there is improvement and areas where there is a need for ongoing intervention. Countries need to invest in measures to decarbonise their health systems which will, in the long term, offer both financial and environmental benefits. Individuals performing carbon footprint modelling of health systems need to align their calculations with the GHG protocol while taking into account health care specific elements like inhalers and anaesthetic gases. There should be a collaboration on refining the methodology for health system carbon footprint modelling as access to information, especially along the supply chain, improves. There needs to be education and awareness of the impact of health systems on the environment and health care should no longer be able to neglect its responsibility to the environment while hiding behind its service to patients.
6. CONCLUSION
Health care is a carbon intensive sector. It has evaded responsibility towards the environment until recently, due to the nature of the services it provides. Although countries are beginning to focus on the contribution of health care to national emissions, there are still very few countries that have performed a carbon footprint analysis of their health system. Those researchers that have performed carbon footprint modelling have often done so using a top‐down approach, due to data limitations, reducing its accuracy. The advantage of having an overall understanding of a health care carbon footprint is that sustainable actions can be targeted to carbon intensive areas. However, there are several challenges to calculating such a carbon footprint, namely, data availability and methodology limitations. Countries, especially developing, need to invest in improved data collection of their health systems and awareness and action to reduce the environmental impact of health care needs to become a priority.
CONFLICT OF INTEREST
I confirm that I have no competing interests.
ETHICS STATEMENT
Ethics approval was not required for this article. This material is the authors' own work which has not been published elsewhere. It reflects the authors own analysis and properly credits the sources used.
ACKNOWLEDGEMENTS
This work was carried out while being funded by a Rhodes Scholarship.
Booth A. Carbon footprint modelling of national health systems: Opportunities, challenges and recommendations. Int J Health Plann Mgmt. 2022;37(4):1885‐1893. 10.1002/hpm.3447
DATA AVAILABILITY STATEMENT
Data sharing is not applicable to this article as no new data were created or analysed in this study.
REFERENCES
- 1. Costello A, Mustafa A, Allen A, et al. Managing the health effects of climate change. Lancet. 2009;373:1693‐1733. [DOI] [PubMed] [Google Scholar]
- 2. Biddle L, Wahedi K, Bozorgmehr K. Health system resilience: a literature review of empirical research. Health Pol Plann. 2020;35(8):1084‐1109. [DOI] [PMC free article] [PubMed] [Google Scholar]
- 3. Ebi KL, Boyer C, Bowen KJ, Frumkin H, Hess J. Monitoring and evaluation indicators for climate change‐related health impacts, risks, adaptation, and resilience. Int J Environ Res Public Health. 2018;15(9):1943. [DOI] [PMC free article] [PubMed] [Google Scholar]
- 4. Keim ME. Building human resilience: the role of public health preparedness and response as an adaptation to climate change. Am J Prev Med. 2008;35(5):508‐516. [DOI] [PubMed] [Google Scholar]
- 5. Romm J. Climate Politics and Policies. Climate Change: What Everyone Needs to Know. Oxford University Press; 2018. [Google Scholar]
- 6. Wiedmann T, Minx J. A definition of 'carbon footprint. In: Pertsova C, ed. Ecological Economics Research Trends. Nova Science Publishers; 2008. [Google Scholar]
- 7. Tennison I, Roschnik S, Ashby B, Boyd R, Hamilton I, Oreszcyn T. Health care's response to climate change: a carbon footprint assessment of the NHS in England. Lancet Planet Health. 2021;5(2):84‐92. [DOI] [PMC free article] [PubMed] [Google Scholar]
- 8. Chung J, Meltzer D. Estimate of the Carbon Footprint of the US Health Care Sector. 2009. [DOI] [PubMed] [Google Scholar]
- 9. Eckelman MJ, Sherman JD, MacNeill AJ. Life cycle environmental emissions and health damages from the Canadian healthcare system: an economic‐environmental‐epidemiological analysis. PLoS Med. 2018;15(7):e1002623. [DOI] [PMC free article] [PubMed] [Google Scholar]
- 10. Malik A, Lenzen M, McAlister S, McGain F. The carbon footprint of Australian health care. Lancet Planet Health. 2018;2(2):27‐35. [DOI] [PubMed] [Google Scholar]
- 11. Wu R. The carbon footprint of the Chinese health‐care system: an environmentally extended input‐output and structural path analysis study. Lancet Planet Health. 2019;3(10):e413‐e419. [DOI] [PubMed] [Google Scholar]
- 12. Nansai K, Fry J, Malik A, Takayanagi W, Kondo N. Carbon footprint of Japanese health care services from 2011 to 2015. Resour Conserv Recycl. 2020:152. [Google Scholar]
- 13. Pichler P, Jaccard I, Weisz U, Weisz H. International comparison of health care carbon footprints. Environ Res Lett. 2019. [Google Scholar]
- 14. Eckelman MJ, Sherman J. Environmental Impacts of the U.S. Health Care System and Effects on Public Health. PLoS ONE; 2016. [DOI] [PMC free article] [PubMed] [Google Scholar]
- 15. Bambarén‐Alatrista C, Alatrista‐Gutiérrez MDS. Carbon footprint in five third‐level health care centers in Peru, 2013. Rev Peru Med Exp Salud Publica. 2016;33(2):274‐277. [PubMed] [Google Scholar]
- 16. Morris D, Somner T, Conner A. The Carbon Footprint of Cataract Surgery. Eye; 2013. [DOI] [PMC free article] [PubMed] [Google Scholar]
- 17. Thiel CL, Eckelman M, Guido R, et al. Environmental impacts of surgical procedures: life cycle assessment of hysterectomy in the United States. Environ Sci Technol. 2015;49(3):1779‐1786. [DOI] [PMC free article] [PubMed] [Google Scholar]
- 18. Rizan C, Steinbach I, Nicholson R, Lillywhite R, Reed M, Bhutta MF. The carbon footprint of surgical operations a systematic review. Ann Surg. 2020;272(6):986‐995. [DOI] [PubMed] [Google Scholar]
- 19. Tan E, Lim D. Carbon footprint of dermatologic surgery. Australas J Dermatol. 2020;62(2):170‐177. [DOI] [PubMed] [Google Scholar]
- 20. Connor A, Lillywhite R, Cooke M. The carbon footprint of a renal service in the United Kingdom. QJM Int J Med. 2010;103(12):965‐975. [DOI] [PubMed] [Google Scholar]
- 21. Lim A, Perkins A, Agar J. The carbon footprint of an Australian satellite haemodialysis unit. Aust Health Rev. 2013;37(3):369‐374. [DOI] [PubMed] [Google Scholar]
- 22. McGain F, Burnham J, Lau R, Aye L, Kollef M, McAlister S. The carbon footprint of treating patients with septic shock in the intensive care unit. Crit Care Resusc. 2018;20(4):304‐312. [PMC free article] [PubMed] [Google Scholar]
- 23. Chua ALB, Amin R, Zhang J, Thiel CL, Gross JS. The environmental impact of interventional radiology: an evaluation of greenhouse gas emissions from an academic interventional radiology practice. J Vasc Interv Radiol. 2021;32(6):907‐915. e3. [DOI] [PubMed] [Google Scholar]
- 24. Grimmond TR, Bright A, Cadman J, et al. Before/after intervention study to determine impact on life‐cycle carbon footprint of converting from single‐use to reusable sharps containers in 40 UK NHS trusts. BMJ Open. 2021;11(9):e046200. [DOI] [PMC free article] [PubMed] [Google Scholar]
- 25. Davis NF, McGrath S, Quinlan M, Jack G, Lawrentschuk N, Bolton DM. Carbon footprint in flexible ureteroscopy: a comparative study on the environmental impact of reusable and single‐use ureteroscopes. J Endourol. 2018;32(3):214‐217. [DOI] [PubMed] [Google Scholar]
- 26. McGain F, McAlister S, McGavin A, Story D. A life cycle assessment of reusable and single‐use central venous catheter insertion kits. Anesth Analg. 2012;114(5):1073‐1080. [DOI] [PubMed] [Google Scholar]
- 27. Eckelman M, Mosher M, Gonzalez A, Sherman J. Comparative life cycle assessment of disposable and reusable laryngeal mask airways. Anesth Analg. 2012;114(5):1067‐1072. [DOI] [PubMed] [Google Scholar]
- 28. Donahue LM, Hilton S, Bell SG, Williams BC, Keoleian GA. A comparative carbon footprint analysis of disposable and reusable vaginal specula. Am J Obstet Gynecol. 2020;223(2):225.e1‐225.e7. [DOI] [PubMed] [Google Scholar]
- 29. Hänsel M, Bambach T, Wachtel H. Reduced environmental impact of the reusable Respimat(®) soft Mist™ inhaler compared with pressurised metered‐dose inhalers. Adv Ther. 2019;36(9):2487‐2492. [DOI] [PMC free article] [PubMed] [Google Scholar]
- 30. Wilkinson A, Braggins R, Steinbach I, Smith J. Costs of switching to low global warming potential inhalers. An economic and carbon footprint analysis of NHS prescription data in England. Respir Med. 2018;9(10). [DOI] [PMC free article] [PubMed] [Google Scholar]
- 31. Sherman J, Le C, Lamers V, Eckelman M. Life cycle greenhouse gas emissions of anesthetic drugs. Anesth Analg. 2012;114(5):1086‐1090. [DOI] [PubMed] [Google Scholar]
- 32. Holmner Å, Ebi KL, Lazuardi L, Nilsson M. Carbon footprint of telemedicine solutions ‐ unexplored opportunity for reducing carbon emissions in the health sector. PLoS ONE. 2014;9(9):e105040. [DOI] [PMC free article] [PubMed] [Google Scholar]
- 33. Oliveira TC, Barlow J, Gonçalves L, Bayer S. Teleconsultations reduce greenhouse gas emissions. J Health Serv Res Policy. 2013;18(4):209‐214. [DOI] [PubMed] [Google Scholar]
- 34. Purohit A, Smith J, Hibble A. Does telemedicine reduce the carbon footprint of healthcare? A systematic review. Future Healthc J. 2021;8(1):e85‐e91. [DOI] [PMC free article] [PubMed] [Google Scholar]
- 35. The Greenhouse Gas Protocol: Technical Report. World Resources Institute and World Business Council for Sustainable Development 2000.
- 36. Wilkinson A, Woodcock A. The environmental impact of inhalers for asthma; a green challenge and a golden opportunity. Br J Clin Pharmacol. 2021. [DOI] [PubMed] [Google Scholar]
- 37. De Soete W, Debaveye S, De Meester S, et al. Environmental sustainability assessments of pharmaceuticals: an emerging need for simplification in life cycle assessments. Environ Sci Technol. 2014;48(20):12247‐12255. [DOI] [PubMed] [Google Scholar]
- 38. Tobiszewski M, Namieśnik J, Pena‐Pereira F. Environmental risk‐based ranking of solvents using the combination of a multimedia model and multi‐criteria decision analysis. Green Chem. 2017;19(4):1034‐1042. [Google Scholar]
- 39. Onken U, Koettgen A, Scheidat H, Schueepp P, Gallou F. Environmental metrics to drive a cultural change: our green eco‐label. Chimia (Aarau). 2019;73(9):730‐736. [DOI] [PubMed] [Google Scholar]
- 40. Roschangar F, Zhou Y, Constable DJC, et al. Inspiring process innovation via an improved green manufacturing metric: iGAL. Green Chem. 2018;20(10):2206‐2211. [Google Scholar]
Associated Data
This section collects any data citations, data availability statements, or supplementary materials included in this article.
Data Availability Statement
Data sharing is not applicable to this article as no new data were created or analysed in this study.