Abstract
Objective
The intersection between immunology and metabolism contributes to the pathogenesis of obesity‐associated metabolic diseases as well as molecular control of inflammatory responses. The metabolite itaconate and the cell‐permeable derivatives have robust anti‐inflammatory effects; therefore, it is hypothesized that cis‐aconitate decarboxylase (Acod1)‐produced itaconate has a protective, anti‐inflammatory effect during diet‐induced obesity and metabolic disease.
Methods
Wild‐type and Acod1−/− mice were subjected to diet‐induced obesity. Glucose metabolism was analyzed by glucose tolerance tests, insulin tolerance tests, and indirect calorimetry. Gene expression and transcriptome analysis was performed using quantitative reverse transcription‐polymerase chain reaction (qRT‐PCR) and RNA sequencing.
Results
Wild‐type and Acod1−/− mice on high‐fat diet had equivalent weight gain, but Acod1−/− mice had impaired glucose metabolism. Insulin tolerance tests and glucose tolerance tests after 12 weeks on high‐fat diet revealed significantly higher blood glucose levels in Acod1−/− mice. This was associated with significant enrichment of inflammatory gene sets and a reduction in genes related to adipogenesis and fatty acid metabolism. Analysis of naive Acod1−/− mice showed a significant increase in fat deposition at 3 and 6 months of age and obesity and insulin resistance by 12 months.
Conclusions
The data show that Acod1 has an important role in the regulation of glucose homeostasis and obesity under normal and high‐fat diet conditions.
Study Importance.
What is already known?
Chronic inflammation is an important contributor in the pathophysiology of obesity and associated insulin resistance and type 2 diabetes mellitus.
The metabolite itaconate has important immunoregulatory and suppressive effects on inflammation.
What does this study add?
cis‐Aconitate decarboxylase (Acod1) is expressed in adipose tissue during inflammation and obesity.
Acod1 is an important regulator of glucose homeostasis during obesity.
Acod1 is critical for maintenance of body weight and glucose control with aging.
How might these results change the direction of research or the focus of clinical practice?
Regulation of immunometabolism through Acod1/itaconate action is critical to our understanding of obesity and metabolic dysfunction and could be an important therapeutic approach.
INTRODUCTION
The obesity epidemic represents a major challenge to public health because of its role in the development of type 2 diabetes mellitus and its association with adverse health consequences. Chronic, low‐grade systemic inflammation is a widely recognized aspect of obesity and is a contributing factor in the development of insulin resistance and other associated comorbidities. Adipose tissue is one of the major metabolic tissues driving systemic inflammation during obesity, and this is largely because of a significant influx of inflammatory cells as well as activation of resident immune cells. Adipose tissue macrophages are present in lean, visceral white adipose tissue depots, but they are further recruited and they undergo activation and proinflammatory signaling in response to excessive adipose tissue expansion during obesity [1]. This occurs in coordination with a network of other innate and adaptive immune cells, and this proinflammatory response impairs adipocyte function and contributes to insulin resistance.
Metabolic regulation and immune responses during obesity and adipose tissue inflammation are critically intertwined. There is a body of literature which has demonstrated that proinflammatory cytokines and chemokines can promote inflammation and induce both localized and systemic insulin resistance and metabolic dysfunction [2, 3]. Nutrient metabolism and intracellular metabolic pathways also have critical roles in governing immune cell function and metabolic responses in nonimmune cells [4]. Metabolism, particularly mitochondrial metabolism, and the production of metabolites has been shown to be critical in regulating inflammatory signaling and macrophage phenotype [5]. Itaconate is a tricarboxylic acid (TCA) cycle–derived metabolite produced by the enzyme cis‐aconitate decarboxylase 1 (Acod1/Irg1), and Acod1 and itaconate are among the most highly upregulated genes and metabolites during proinflammatory macrophage activation [6]. Itaconate has been shown to have anti‐inflammatory and antioxidative effects in vitro in macrophages through multiple mechanisms including succinate dehydrogenase inhibition, induction of ATF3 and Nrf2, and inhibition of NLRP3 inflammasome activity [6, 7, 8, 9, 10, 11].
Augmentation of itaconate signaling has also been shown to be effective in mitigating inflammation in various animal models of disease. The cell‐permeable itaconate derivatives dimethyl itaconate (DMI) and 4‐octyl itaconate (4‐OI) have been employed as a strategy to target immunometabolism to regulate hypoxia and inflammation in disease. Itaconate has been shown to decrease oxidative phosphorylation and reactive oxygen species (ROS) production both by diverting cycle intermediates toward itaconate production and by inhibiting succinate dehydrogenase. Itaconate derivatives have been shown to be effective in mitigating injury during hypoxia responses such as cardiac ischemia [6], cerebral ischemia [12, 13], and experimental colitis [14]. Hypoxia and oxidative responses mediated by HIF1α and ROS are also thought to play a role in the pathophysiology of adipose dysfunction and insulin resistance during obesity [15, 16]. In addition, itaconate derivatives have been shown to be effective in a wide array of inflammatory and autoimmune models of disease [17, 18, 19, 20, 21, 22, 23, 24, 25].
Although Acod1 and itaconate have been the focus of many studies on immune metabolism and immunoregulation, none has addressed the in vivo role in glucose metabolism, obesity, or diabetes mellitus. Because of the anti‐inflammatory effects of itaconate in immune cells, we hypothesized that Acod1/itaconate would have a beneficial effect on adiposity and metabolic dysfunction during diet‐induced obesity (DIO) by dampening adipose tissue inflammatory responses. In the present study, we examined the role of endogenous itaconate in the development of obesity and diabetes using Acod1‐deficient mice as a model of itaconate deficiency in the context of diet‐induced obesity. Here we defined the effects of Acod1 knockout (KO) on adiposity and glucose homeostasis in both obese and aging mice.
METHODS
Animals
Male Acod1−/− mice (Acod1tm1a[KOMP]Wtsi) and littermate controls were on a C57BL/6N background, and myeloid Acod1−/− (MyAcod1−/−: Acod1fl/fl‐LysM‐Cre) and floxed controls were on a C57BL/6J background [6, 26]. Mice were multihoused in static cages in a temperature‐controlled specific‐pathogen‐free (SPF) room (21–23°C) with a light:dark cycle of 12:12 hours (lights on at 6 am). Mice were maintained on standard laboratory chow (5L0D, LabDiet) or high‐fat diet (HFD) (60% of kilocalories from fat [D12492, Research Diets]) and water ad libitum. Estimation of required sample size for all experiments was based on a priori power analysis calculations using expected standard deviations from previous experiments. All animal procedures were performed in accordance with the National Academy of Sciences Guide for the Care and Use of Laboratory Animals (8th ed.) and were approved by the Institutional Animal Care and Use Committee of the University of Michigan.
Food consumption
Food intake was repeatedly measured in both standard static cages and metabolic cages over 2‐ to 3‐day periods.
Lipopolysaccharide‐induced systemic inflammation
See online Supporting Information Methods.
Transcriptomic analysis
Total RNA was extracted from tissues using TRIzol reagent and purified using an RNeasy Mini Kit (Qiagen) with on‐column DNase digestion. RNA sequencing (RNA‐seq) was performed by the University of Michigan Advanced Genomics Core, using the Lexogen QuantSeq library prep kit and sequenced on an Illumina NextSeq system (~10 million raw reads per sample). Data were trimmed using TrimGalore (version 0.5.0; https://www.bioinformatics.babraham.ac.uk/projects/trim_galore/) and aligned using STAR (version 2.6.0). Differential expression analysis was performed using the DESeq2 package in R.
Body composition
See online Supporting Information Methods.
Glucose and insulin tolerance tests
For glucose tolerance tests (GTT), mice were fasted for 6 hours (5:00 am–11:00 am) before receiving an intraperitoneal injection of glucose. Glucose dose (1.25 mg/g lean mass) was determined from lean body mass to avoid confounding effects from obesity [27, 28]. Blood glucose was measured at 0, 15, 30, 60, and 120 minutes after glucose injection using a Contour (Bayer) glucometer. For insulin measurements, plasma was collected at 0, 30, and 60 minutes after glucose injection and plasma insulin was assayed using an Ultra Sensitive Mouse Insulin ELISA Kit (Crystal Chem). For insulin tolerance tests (ITT), mice were injected with insulin (0.5 U/kg lean mass) (Humulin R; Lilly), and blood glucose was measured at 0, 15, 30, 60, and 120 minutes.
Gene expression analysis
Relative mRNA expression was determined using quantitative reverse transcription–polymerase chain reaction (qRT‐PCR). Total RNA was extracted from tissues using TRIzol reagent and purified using an RNeasy Mini Kit (Qiagen) with on‐column DNase digestion. RNA (1 μg) was reverse transcribed to complementary DNA (cDNA) with an Applied Biosystems kit and qRT‐PCR was performed using a 7900HT Fast Real‐Time PCR System (Applied Biosystems). The relative mRNA expression was quantified by the comparative method and normalized to the housekeeping gene L32.
Flow cytometry
See online Supporting Information Methods.
Indirect calorimetry
See online Supporting Information Methods.
3T3‐L1 adipocyte culture
3T3‐L1 cells were cultured to confluency and treated with preadipocyte expansion media (DMEM + 10% calf serum). After 48 hours, cells were then cultured in differentiation media (DMEM + 10% fetal bovine serum [FBS], 1.0 μM dexamethasone, 0.5 mM 3‐isobutyl‐1‐methylxanthine [IBMX], 1.0‐μg/mL bovine insulin) for 2 days and then cultured in adipocyte maintenance media (DMEM + 10 % FBS, 1.0‐μg/mL bovine insulin) for 10 days. Differentiated 3T3‐L1 adipocyte cultures were then pretreated with DMI (125 or 250 μM) and 4‐OI (250 μM) for 18 hours and then stimulated with lipopolysaccharide (LPS) (100 ng/mL) for 3 hours or palmitic acid (PA, 0.5 mM) or vehicle for 24 hours. The PA:fatty acid free (FFA)‐bovine serum albumin (BSA) conjugate (6:1 molar ratio PA:BSA) was made by dissolving PA in ethanol and then combining with FFA‐BSA dissolved in DMEM. The PA:FFA‐BSA mixture was sonicated to promote solvation of the PA:FFA‐BSA conjugate.
Statistical analysis
A Shapiro–Wilk normality test was used to determine whether data were normally distributed. For normally distributed data with equal variance, values are presented as mean ± SEM, and statistical comparison of mean values between multiple groups was performed by Student t test, one‐way ANOVA with a Tukey post test, or two‐way ANOVA with a Tukey post test as indicated in the text. For normally distributed data with unequal variance, Welch's t test was used. Data that were not normally distributed were analyzed with the nonparametric Mann–Whitney test. All statistical analysis of data was performed in GraphPad Prism (version 7), and p < 0.05 was considered significant.
RESULTS
Acod1 expression is increased during DIO but does not affect weight gain or fat deposition
To delineate the role of Acod1/itaconate during DIO, we used Acod1−/− mice from KOMP, which employ the tm1a cassette to produce global gene inactivation. We confirmed using bone marrow‐derived macrophages (BMDM) a total inhibition of LPS‐induced Acod1 expression in Acod1−/− mice (Figure 1A). Systemic inflammation by LPS treatment showed significant induction of Acod1 expression in mouse fat depots (Figure 1B). Similarly, mice on HFD also had significantly elevated expression of Acod1 in gonadal WAT (Figure 1C). We detected robust induction of Acod1 expression in various tissues after induction of systemic inflammation with LPS (Supporting Information Figure S1A). Induction of itaconate production in high expressing tissues (liver and spleen) and deficiency in Acod1−/− mice was also confirmed (Supporting Information Figure S1B).
FIGURE 1.
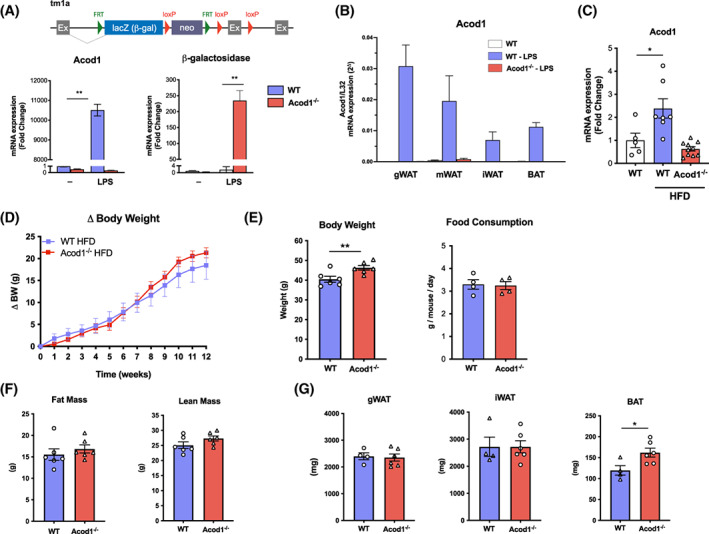
Acod1 is increased in adipose tissue during inflammation and obesity. (A) tm1a construct from KOMP used to generate Acod1−/− mice. Bone marrow‐derived macrophages from Acod1−/− mice treated with LPS show efficient knockout. (B) Effect of LPS and (C) high‐fat diet (HFD) on Acod1 expression by qPCR in adipose tissue. (D) Acod1−/− mice on HFD gain the same amount of weight as wild‐type (WT) controls. (E) Body weight (BW) after 12 weeks on HFD and food consumption. (F) Total fat mass and lean mass measured by MRI at 12 weeks on HFD. (G) Fat depot mass at 12 weeks on HFD. N = 4–10. *p < 0.05, **p < 0.01 [Color figure can be viewed at wileyonlinelibrary.com]
To determine the role of Acod1 in the pathogenesis of diet‐induced obesity and metabolic disease, wild‐type (WT) and Acod1−/− mice were placed on HFD for 12 weeks. WT and Acod1−/− mice gained weight at an equivalent rate and displayed similar levels of food consumption (Figure 1D,E). Although body weights of Acod1−/− mice were marginally greater at the end of the study (Figure 1E), this was because of a higher baseline body weight prior to administration of HFD. Both fat mass and lean body mass were similar between WT and Acod1−/− mice on HFD (Figure 1F). Subsequent analysis of major WAT depots revealed a similar degree of gonadal WAT and inguinal WAT expansion in WT and Acod1−/− mice on HFD (Figure 1G), although Acod1−/− mice had a significant increase in the brown adipose tissue depot compared with WT mice.
Acod1 is important in maintaining glucose homeostasis and insulin sensitivity during obesity
To assess whether disruption of Acod1 and itaconate function is involved in glucose metabolism during obesity, we performed GTT and ITT on WT and Acod1−/− mice. After 2 weeks on HFD, no differences were detected between WT and Acod1−/− mice on HFD (Figure 2A). By week 12, Acod1−/− mice had significantly elevated blood glucose levels during GTT compared with WT controls (Figure 2A). Acod1−/− mice also displayed signs of insulin resistance during ITT, in which they showed increased glucose levels with significant impairment of glucose disposal (Figure 2B). No statistically significant differences were detected in fasting glucose or insulin, although the mean fasting insulin levels were greater and suggestive of insulin impairment (Figure 2C).
FIGURE 2.
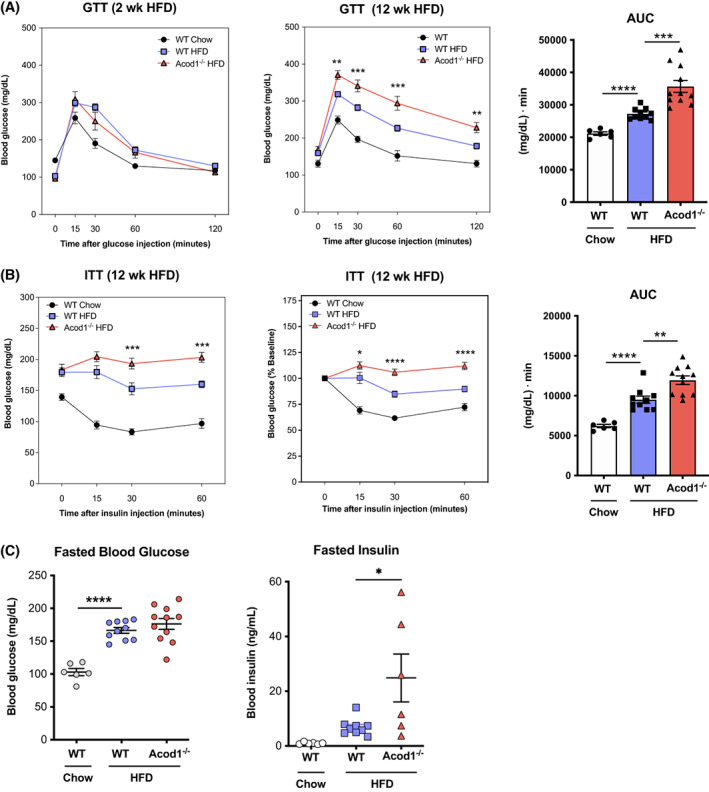
Acod1 deficiency impairs glucose metabolism during obesity. (A) Glucose tolerance tests (GTT) at 2 and 12 weeks on high‐fat diet (HFD) and area under the curve (AUC) for 12‐week GTT data. (B) Insulin tolerance tests (ITT) at 12 weeks on HFD and AUC for nonnormalized ITT data. (C) Fasted blood glucose and insulin levels. N = 6–11. *p < 0.05, **p < 0.01, ***p < 0.001, ****p < 0.0001 [Color figure can be viewed at wileyonlinelibrary.com]
Acod1−/− mice have increased inflammatory gene expression in adipose tissue
Histological analysis of adipose tissue after HFD did not reveal any structural or morphological differences between WT and Acod1−/− mice (Figure 3A). Because itaconate has anti‐inflammatory effects, and Acod1 is largely upregulated in inflammatory macrophages, we analyzed the expression of inflammatory genes in adipose tissue by qRT‐PCR. Acod1 deficiency selectively regulated inflammatory gene expression during DIO. We detected increases in the expression of the chemokine MCP1/CCL2 and IL‐1RA but not other inflammatory cytokines such as TNFα or IL‐6 (Figure 3B). Acod1−/− mice also had a significant decrease in the insulin‐sensitizing adipokine adiponectin.
FIGURE 3.
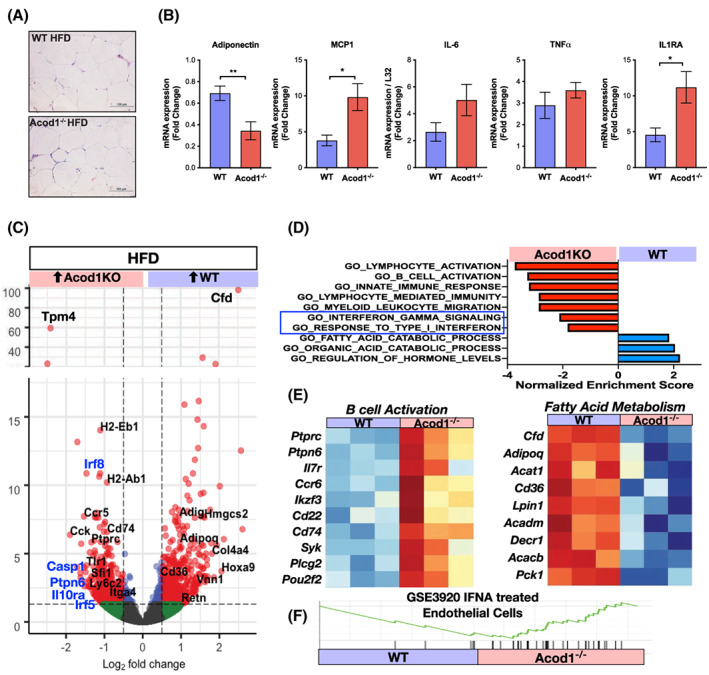
Increased inflammatory gene expression in eWAT of obese Acod1−/− mice. (A) eWAT histology at 12 weeks on high‐fat diet (HFD). (B) qRT‐PCR analysis of inflammatory genes from eWAT. RNA‐seq (QuantSeq) was performed on eWAT from diet‐induced obese wild‐type (WT) and Acod1−/− mice. (C) Volcano plots of differentially expressed genes. Inflammatory (black) and interferon‐responsive (blue) genes are highlighted. (D) Enriched pathways in HFD eWAT (GSEA analysis; all p adj <0.05). (E) Heat maps of B‐cell and FA metabolic genes. (F) GSEA of interferon alpha (IFNA)‐dependent genes. N = 4–6. *p < 0.05, **p < 0.01 [Color figure can be viewed at wileyonlinelibrary.com]
We next performed RNA‐seq on epididymal WAT (eWAT) from HFD‐fed Acod1−/− and WT mice and identified 1033 differentially expressed genes. Gene set enrichment analysis (GSEA) analysis showed that Acod1−/− mice had significant enrichment of inflammatory gene sets related to B‐cell activation, lymphocyte activation, interferon responses, and myeloid responses (Figure 3C–E). Enrichment of B‐cell–related genes in the Acod1−/− mice was prominent and supported by enrichment analysis in the Immgen database. WT mice had increased expression of adipogenic (Adipoq, Cd36) and fatty acid (FA) catabolic genes (Lpin1, Acat1) suggesting Acod1 may play a role in enhancing FA metabolism and limiting fat expansion. Although there was significant enrichment of inflammatory gene sets by transcriptomic analysis, we did not detect any differences in the percentage of circulating or infiltrated immune cells by flow cytometry (Supporting Information Figure S2), suggesting a potential change in functional phenotype rather than through leukocyte trafficking.
Adipocytes express Acod1 and have attenuated inflammatory signaling with itaconate treatment
Most reports suggest Acod1 expression is mainly from macrophages, but there is accumulating evidence for Acod1 induction in nonmacrophage cell types. Injection of mice with LPS showed attenuation of Acod1 expression in myeloid Acod1 KO mice (LysM‐Cre) in the spleen, liver, and eWAT; however, Acod1 induction was not completely lost, suggesting activation of Acod1 in LysM‐negative cells (Supporting Information Figure S3A). Stratification of eWAT and inguinal WAT after LPS injection showed that myeloid Acod1 KO mice had a significant decrease in Acod1 induction in the adipose stromal‐vascular fraction, especially compared with whole adipose tissue. This suggests that adipocyte Acod1 contributes significantly to whole‐tissue Acod1 expression and that there is significant retention of Acod1 expression in the stromal‐vascular fraction even after deletion from macrophages, consistent with nonmyeloid sources for Acod1/itaconate in adipose tissue (Supporting Information Figure S3B).
To further assess the possibility that itaconate has a role in regulating adipocyte function, we cultured 3T3‐L1 adipocytes and stimulated them with LPS. Acod1 expression was significantly upregulated with the addition of LPS (Figure 4A). This is consistent with a previous report showing that treatment of 3T3‐L1 adipocytes with TNFα can induce Acod1 expression [29]. To evaluate whether the cell‐permeable itaconate derivatives 4‐OI and DMI (Figure 4B) can influence adipocyte differentiation, 3T3‐L1 cells were differentiated with or without the itaconate analogues; however, no differences in cell proliferation or morphology were observed (Figure 4C,D). To further evaluate the effect of itaconate derivatives on inflammation, 3T3‐L1 adipocytes were treated with LPS in the presence or absence of 4‐OI or DMI. Both 4‐OI and DMI significantly suppressed LPS‐induced MCP1 and IL‐6 expression (Figure 4E). The Nrf2‐dependent gene Nqo1 (NAD[P]H quinone dehydrogenase 1) was also induced by DMI and 4‐OI in adipocytes, suggesting Nrf2‐dependent suppression of inflammatory genes in adipocytes.
FIGURE 4.
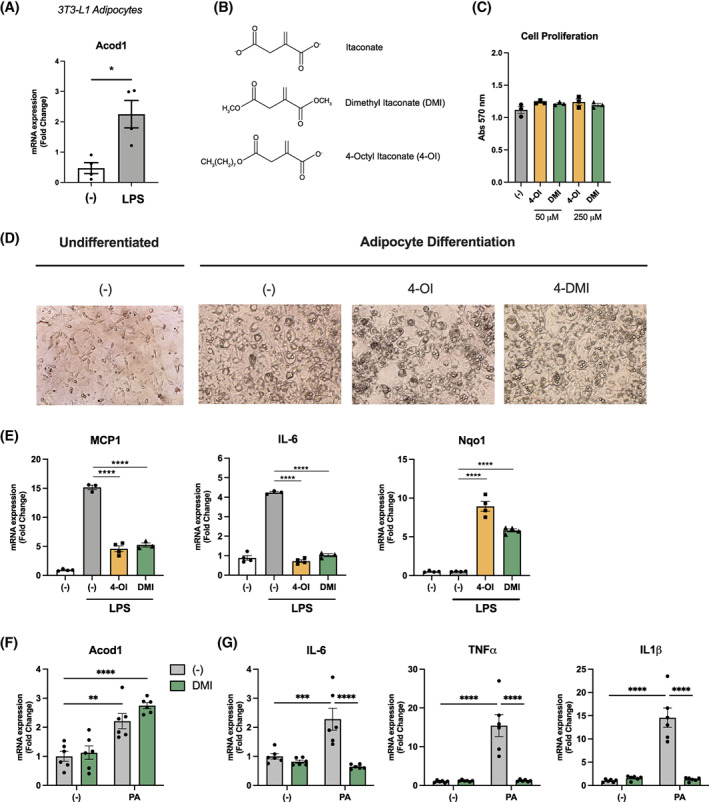
3T3‐L1 adipocytes express Acod1 and have attenuated inflammatory signaling with itaconate treatment. (A) Acod1 expression in LPS‐treated 3T3‐L1 adipocytes. (B) Structure of itaconate and cell‐permeable derivatives. (C) Cell proliferation of 3T3‐L1 adipocytes measured by MTT assay after adipocyte differentiation. (D) Photomicrograph of 3T3‐L1 cells before and after differentiation. (E) mRNA gene expression of MCP1, IL‐6, and Nqo1 from 3T3‐L1 adipocytes treated with LPS in the presence and absence of itaconate derivatives. (F) Acod1 expression in 3T3‐L1 adipocytes after 24 hours of palmitic acid (PA) treatment. (G) mRNA gene expression of inflammatory genes in 3T3‐L1 adipocytes treated with PA after 12 hours of pretreatment with DMI. n = 3–6 per group. *p < 0.05, **p < 0.01, ***p < 0.001, ****p < 0.0001 [Color figure can be viewed at wileyonlinelibrary.com]
PA is one of the most abundant circulating FFA in serum and it promotes inflammation and insulin resistance in tissues. Similar to LPS stimulation, treatment of 3T3‐L1 adipocytes with PA resulted in a modest increase in Acod1 mRNA expression (Figure 4F). We also evaluated the effects of DMI and found that pretreatment with DMI (125 μM) significantly suppressed PA‐induced inflammatory gene expression (Figure 4G).
Acod1−/− mice develop spontaneous obesity, glucose intolerance, and adipose tissue inflammation with age
While analyzing multiple cohorts of mice, we observed that the body weights of the male Acod1−/− mice were significantly larger than littermate WT control mice. Body weights began to diverge at 6 months of age, and 12‐month‐old Acod1−/− mice were markedly larger in body weight compared with WT controls (Figure 5A). The difference in body weight was due to increased fat mass in Acod1−/− mice based on body composition analysis (magnetic resonance imaging [MRI]) and weight of fat depots (Figure 5B). Analysis of glucose metabolism by GTT and ITT revealed that old Acod1−/− mice were glucose intolerant and insulin resistant compared with age‐matched WT controls (Figure 5C,D). This was associated with significantly increased adipocyte size in eWAT from 12‐month‐old Acod1−/− mice (Figure 5E). Further analysis of Acod1−/− mice revealed a significant increase in both cardiac and kidney mass (Supporting Information Figure S4A,B). Cardiac hypertrophy in Acod1−/− mice was associated with increased cardiomyocyte size (Supporting Information Figure S4C).
FIGURE 5.
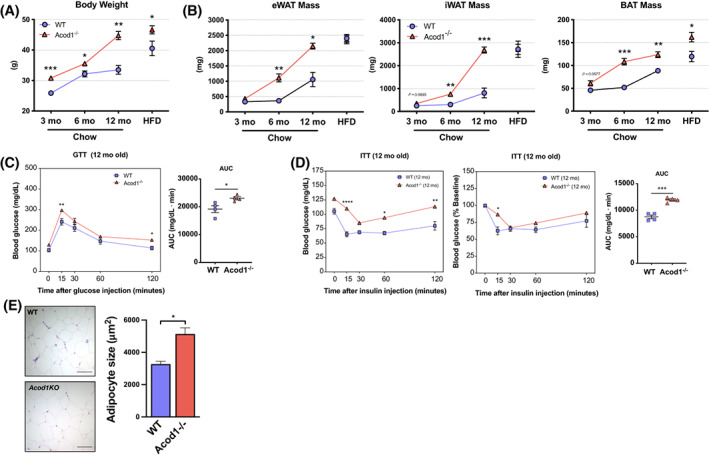
Acod1−/− mice develop spontaneous obesity and impaired glucose metabolism with age. (A) Body weight time course in wild‐type (WT) and Acod1−/− mice. (B) Time course of eWAT, iWAT, and BAT fat pad mass. (C) Glucose tolerance tests (GTT) and (D) insulin tolerance tests (ITT) in naive 12‐month Acod1−/− mice and area under the curve (AUC) of nonnormalized ITT data. (E) Adipocyte size in 12‐month Acod1−/− mice. N = 4–7 per group. *p < 0.05, **p < 0.01, ***p < 0.001, ****p < 0.0001 [Color figure can be viewed at wileyonlinelibrary.com]
RNA‐seq was performed on eWAT from 12‐month‐old mice, and principal components analysis demonstrated that the old Acod1−/− mice gene profiles clustered with HFD‐fed mice (Figure 6A). Compared with age‐matched controls, old Acod1−/− mice had significant enrichment of inflammatory genes related to macrophage activation (Itgax, Trem2, Spp1), lymphocyte activation, and genes in the Chen Metabolic Syndrome Network (Figure 6B,C). Similar to DIO mice, old Acod1−/− mice had increased B‐cell activation genes (Figure 6D). These data demonstrate that Acod1−/− mice develop obesity with age that leads to features of unhealthy WAT expansion and exaggerated myeloid inflammation.
FIGURE 6.
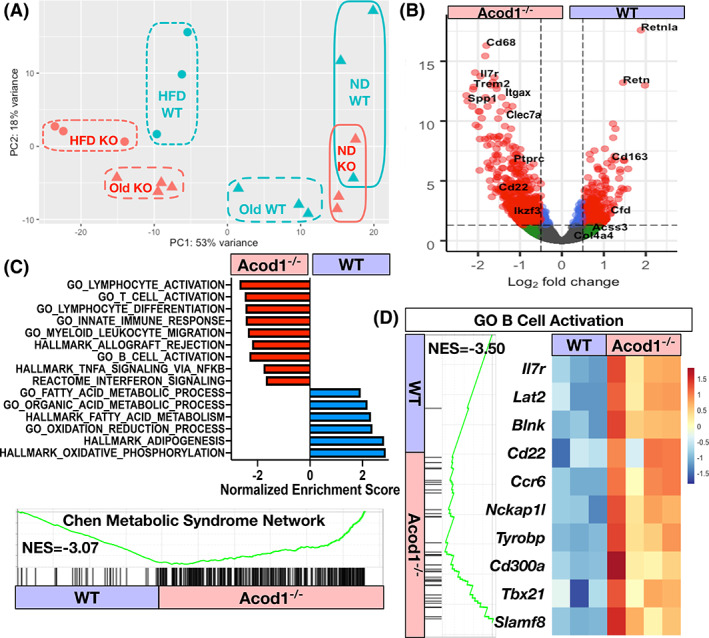
Old Acod1−/− mice have increased inflammatory gene expression. RNA‐seq of eWAT from 12‐month‐old mice. (A) Principal components analysis of normal diet (ND), high‐fat diet (HFD), and old wild‐type (WT) and Acod1−/− mice. (B) Volcano plot of differentially expressed genes between 12‐month‐old WT and Acod1−/− mice. (C) Most enriched pathways from differentially expressed genes (GSEA) in 12‐month‐old WT and Acod1−/− mice. (p adj < 0.05). (D) B‐cell activation module (all p adj < 0.05). N = 3–4 per group. NES, normalized enrichment score [Color figure can be viewed at wileyonlinelibrary.com]
Acod1−/− mice have increased FA synthetic gene expression in adipose tissue
To better understand the mechanisms of the increased weight gain in the 12‐month‐old Acod1−/− mice, we used a comprehensive lab animal monitoring system (CLAMS) to evaluate an independent cohort of weight‐matched 3‐month‐old mice before body weight between genotypes diverged. During the CLAMS, Acod1−/− mice had increased food intake and increased resting energy expenditure per mouse that disappeared when normalized for lean body mass (Figure 7A,B). Activity and respiratory exchange ratio (RER) were not different between KO and WT mice. Assessment of substrate utilization demonstrated a decrease in fat oxidation and an increase in glucose oxidation in Acod1−/− mice compared with controls (Figure 7C). RNA‐seq was performed in eWAT from weight‐matched, 3‐month‐old, chow‐fed Acod1−/− and WT mice, and 1,279 differentially expressed genes were identified (Figure 7D,E). eWAT from Acod1−/− mice had a significant increase in the expression of pathways related to adipogenesis, lipid biosynthesis, and FA synthesis (Acly, Fasn, Slc27a1, Acbp).
FIGURE 7.
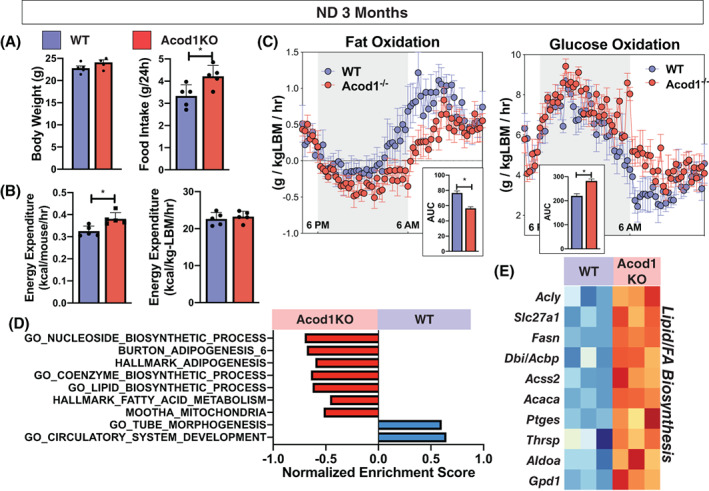
Nonobese Acod1−/− mice have altered energy substrate utilization. Three‐month‐old chow‐diet‐fed weight‐matched wild‐type (WT) and Acod1 −/− mice analyzed by (A) CLAMS for food intake, (B) energy expenditure, and (C) fat and glucose oxidation. (D) Enriched pathways in chow‐fed WT and Acod1 −/− mice (GSEA; p adj < 0.05). (E) Heat map of differentially expressed genes related to fatty acid (FA) synthesis. N = 5 per group. *p < 0.05. LBM, lean body mass; ND, normal diet [Color figure can be viewed at wileyonlinelibrary.com]
DISCUSSION
The intersection between immune and metabolic responses is a widely recognized feature of metabolic dysfunction that occurs during both obesity and aging. Although many proinflammatory pathways that contribute to adipose tissue inflammation and insulin resistance have been identified, many of the intracellular metabolic pathways that govern immune cell function and metabolism are largely undefined.
In this study, we investigated the role of the anti‐inflammatory TCA‐cycle metabolite itaconate during the pathogenesis of obesity and metabolic dysfunction. Through disruption of itaconate production by Acod1 deficiency, we identified that Acod1/itaconate had a critical role in glucose homeostasis and adiposity with HFD and aging. We showed that Acod1−/− mice had impaired glucose homeostasis during obesity, and this was associated with increased inflammatory signaling in visceral adipose tissue. Naive Acod1−/− mice also developed obesity, insulin resistance, and enhanced inflammatory signatures with age, highlighting an important endogenous, immunometabolic mechanism that protected against obesity and glucose dysregulation. To our knowledge, this is the first investigation to link Acod1 and itaconate to glucose metabolism and obesity.
Although global deletion of Acod1 did not have any effect on weight gain during DIO, it did result in increased glucose intolerance and insulin resistance. Acod1−/− and itaconate deficiency were also associated with increased inflammation in Acod1−/− mice as determined by gene expression and transcriptomic analysis using qPCR and RNA‐seq. These findings are consistent with the hypothesis that Acod1 has a protective, anti‐inflammatory effect during DIO through suppression of the immune response. This is also consistent with reported in vitro and in vivo studies using both genetic (Acod1−/−) and pharmacological (itaconate derivatives: DMI, 4‐OI) approaches that have shown itaconate has potent anti‐inflammatory effects. Mills and colleagues found that 4‐OI effectively suppressed inflammatory cytokines (IL‐1β and TNFα) in serum after induction of systemic inflammation [8]; therefore, it will also be important to further investigate whether Acod1/itaconate affects chronic systemic inflammation in our DIO model.
Acod1 is known to be most highly upregulated in macrophages, and adipose tissue macrophages are major regulators of adipose tissue inflammation. Our data showed significant enrichment in inflammatory gene sets involving innate immune response, myeloid leukocyte migration, and interferon signaling and response pathways. There was also enrichment of inflammatory gene sets related to lymphocyte and B‐cell activation. Although there are limited reports of Acod1 effects outside of activated macrophages, there is a growing body of literature implicating B‐cells in the pathogenesis of obesity and aging [30, 31, 32, 33]. Similar to obesity, aging is also associated with chronic inflammation with B‐cell infiltration that drives insulin resistance and metabolic dysfunction. This would be consistent with our findings showing significant enrichment of B‐cell–related genes in Acod1−/− mice with both DIO and aging.
Further analysis using cell‐specific ablation models will be critical to delineate critical cell types producing and responding to itaconate. In addition to the potential role of immune cells within adipose tissue, skeletal muscle and liver are also critically involved in regulation of glucose homeostasis. In skeletal muscle cells, DMI was found to mitigate palmitate‐induced insulin resistance through suppression of inflammation [34]. In our studies, PA resulted in a modest but significant upregulation of Acod1 expression, and DMI was able to effectively suppress PA‐induced inflammatory gene expression. Future studies will be important to test whether itaconate can mitigate PA‐induced insulin resistance through regulation of inflammatory signaling. Itaconate derivatives have been shown to suppress liver inflammation in models of disease [35, 36, 37, 38], and it is unknown whether this has any impact on glucose homeostasis. Our data in 3T3‐L1 cells also implicated a possible role for Acod1 in adipocytes as either a potential producer of itaconate or as an effector cell. Overall, our results suggest a novel role for Acod1 in immune cells with evidence suggestive of innate immune cells and B‐cells as effectors or primary responders to the action of Acod1/itaconate.
Acod1−/− mice had alterations in energy substrate utilization with a decrease in FA oxidation and increase in glucose oxidation. These observations suggest that loss of Acod1/itaconate relieves inhibition of glycolysis and promotes glucose oxidation at the expense of fat oxidation. Changes in substrate utilization were associated with increases in genes related to adipogenesis, lipid biosynthesis, and FA synthesis. This suggests a tonic role for Acod1 limiting FA deposition in adipose tissue under chow diet conditions as a potential mechanism for the age‐induced obesity. Thus, in lean mice, tonic Acod1 expression and itaconate production protect against age‐induced obesity by counteracting lipid deposition in adipocytes either by promoting lipolysis, suppressing lipogenesis, or promoting adipogenesis. With DIO or aging, the expression of Acod1 in myeloid cells, B‐cells, and/or adipocytes and other nonimmune cell types limits the inflammatory response in adipose tissue and protects against insulin resistance.
The various mechanisms by which itaconate exerts its anti‐inflammatory effects are thought to have a role in dampening immune activation to limit host tissue damage. Although Acod1 is increased in adipose tissue during DIO and it has an important role in controlling insulin resistance, this response is not able to adequately suppress inflammation or modulate other potentially direct mechanisms (i.e., adipocyte function) to maintain insulin sensitivity. Although it is important to have mechanisms to negatively regulate immune cell activation, these endogenous mechanisms are not sufficient to inhibit inflammation and compensate for the excess lipid and FA alterations that result in chronic inflammation and adipose tissue dysfunction. However, the anti‐inflammatory mechanisms of endogenous itaconate can be potentially exploited with administration of exogenous itaconate derivatives to achieve a therapeutic effect.
We have identified a new connection between immunometabolism and metabolic dysfunction, but it remains to be determined whether this pathway can be manipulated to protect against disease. Numerous studies have employed the use of cell‐permeable itaconate derivatives (DMI and 4‐OI) to augment itaconate signaling and modulate and suppress inflammation during various models of disease. Future studies will be focused on determining whether supplementation with exogenous itaconate derivatives can suppress inflammation and mitigate metabolic dysfunction. However, these derivatives are esterified to enhance cell permeability, and they do not fully recapitulate the endogenous effects of itaconate as they do not get metabolized to itaconate. Therefore, although beneficial and potentially useful as a therapeutic agent, the role of endogenous itaconate signaling will still be critical to understand by using genetic tools to manipulate the metabolic system.
As discussed here, it will also be important to delineate the itaconate‐producing and itaconate‐responsive cell types during DIO and insulin resistance. Acod1/itaconate effects may be a result of intracellular action or they could reflect a more complex intercellular communication involving itaconate secretion and uptake. Further analysis of isolated cell types to define changes in both Acod1 and itaconate during aging and DIO will also be important for delineating the critical cell types regulating these physiological and pathophysiological processes. Although itaconate production is the only known function of Acod1, it will be important to confirm the role of itaconate in this Acod1 deficiency model by correlating phenotypic changes with alterations in itaconate levels.
CONCLUSION
In summary, our data advance our understanding of the Acod1/itaconate pathway in immunometabolism and show that it protects against metabolic dysfunction in DIO and age. This is critical to our understanding of the pathogenesis of metabolic dysfunction that occurs with obesity and aging, because although many of the proinflammatory mechanisms are well defined, we know very little about anti‐inflammatory immunometabolism pathways that can be targeted for therapeutic intervention. Attenuating low‐grade, systemic inflammation during obesity through modulation of immunometabolism may have therapeutic potential to regulate glucose homeostasis and prevent metabolic dysfunction.
AUTHOR CONTRIBUTIONS
Conceived and designed the study (RAF, RMM), acquired data (RAF, TMV, JS, CL), analyzed data and constructed figures (RAF, CNL), wrote the manuscript (RAF), interpreted results (DRG, CNL, RAF, RMM).
CONFLICT OF INTEREST
The authors declared no conflict of interest.
Supporting information
Appendix S1 Supporting Information.
ACKNOWLEDGMENTS
We would like to thank Dr. Michael Diamond (Washington University School of Medicine, St. Louis, Missouri) for sharing the Acod1 knockout mice that were used in this study.
Frieler RA, Vigil TM, Song J, et al. Aconitate decarboxylase 1 regulates glucose homeostasis and obesity in mice. Obesity (Silver Spring). 2022;30(9):1818‐1830. doi: 10.1002/oby.23509
Funding information This study was supported by National Institutes of Health grant F31NS108617 (TMV), National Institutes of Health grant T32‐HL125242, Crohns and Colitis Foundation award 609962 (RAF), and P30 grants DK020572 (Michigan Diabetes Research Center [MDRC]), DK089503 (Michigan Nutrition Obesity Research Center [MNORC]), and 1U2CDK110678–01 (Michigan Mouse Metabolic Phenotyping Center [Mi‐MMPC]).
Contributor Information
Ryan A. Frieler, Email: rfrieler@umich.edu.
Richard M. Mortensen, Email: rmort@umich.edu.
REFERENCES
- 1. Weisberg SP, McCann D, Desai M, Rosenbaum M, Leibel RL, Ferrante AW Jr. Obesity is associated with macrophage accumulation in adipose tissue. J Clin Invest. 2003;112:1796‐1808. [DOI] [PMC free article] [PubMed] [Google Scholar]
- 2. Xu H, Barnes GT, Yang Q, et al. Chronic inflammation in fat plays a crucial role in the development of obesity‐related insulin resistance. J Clin Invest. 2003;112:1821‐1830. [DOI] [PMC free article] [PubMed] [Google Scholar]
- 3. de Luca C, Olefsky JM. Inflammation and insulin resistance. FEBS Lett. 2008;582:97‐105. [DOI] [PMC free article] [PubMed] [Google Scholar]
- 4. Lee YS, Wollam J, Olefsky JM. An integrated view of immunometabolism. Cell. 2018;172:22‐40. [DOI] [PMC free article] [PubMed] [Google Scholar]
- 5. O'Neill LA, Kishton RJ, Rathmell J. A guide to immunometabolism for immunologists. Nat Rev Immunol. 2016;16:553‐565. [DOI] [PMC free article] [PubMed] [Google Scholar]
- 6. Lampropoulou V, Sergushichev A, Bambouskova M, et al. Itaconate links inhibition of succinate dehydrogenase with macrophage metabolic remodeling and regulation of inflammation. Cell Metab. 2016;24:158‐166. [DOI] [PMC free article] [PubMed] [Google Scholar]
- 7. Bambouskova M, Gorvel L, Lampropoulou V, et al. Electrophilic properties of itaconate and derivatives regulate the IκBζ‐ATF3 inflammatory axis. Nature. 2018;556:501‐504. [DOI] [PMC free article] [PubMed] [Google Scholar]
- 8. Mills EL, Ryan DG, Prag HA, et al. Itaconate is an anti‐inflammatory metabolite that activates Nrf2 via alkylation of KEAP1. Nature. 2018;556:113‐117. [DOI] [PMC free article] [PubMed] [Google Scholar]
- 9. Swain A, Bambouskova M, Kim H, et al. Comparative evaluation of itaconate and its derivatives reveals divergent inflammasome and type I interferon regulation in macrophages. Nat Metab. 2020;2:594‐602. [DOI] [PMC free article] [PubMed] [Google Scholar]
- 10. Hooftman A, Angiari S, Hester S, et al. The immunomodulatory metabolite itaconate modifies NLRP3 and inhibits inflammasome activation. Cell Metab. 2020;32:468‐478.e467. [DOI] [PMC free article] [PubMed] [Google Scholar]
- 11. Bambouskova M, Potuckova L, Paulenda T,et al. Itaconate confers tolerance to late NLRP3 inflammasome activation. Cell Rep. 2021;34:108756. doi: 10.1016/j.celrep.2021.108756 [DOI] [PMC free article] [PubMed] [Google Scholar]
- 12. Zhang D, Lu Z, Zhang Z, et al A likely protective effect of dimethyl itaconate on cerebral ischemia/reperfusion injury. Int Immunopharmacol. 2019;77:105924. doi: 10.1016/j.intimp.2019.105924 [DOI] [PubMed] [Google Scholar]
- 13. Vigil TM, Frieler RA, Kilpatrick KL, Wang MM, Mortensen RM. Aconitate decarboxylase 1 suppresses cerebral ischemia‐reperfusion injury in mice. Exp Neurol. 2022;347:113902. doi: 10.1016/j.expneurol.2021.113902 [DOI] [PMC free article] [PubMed] [Google Scholar]
- 14. Wang Q, Li XL, Mei Y, et al. The anti‐inflammatory drug dimethyl itaconate protects against colitis‐associated colorectal cancer. J Mol Med (Berl). 2020;98:1457‐1466. doi: 10.1007/s00109-020-01963-2 [DOI] [PubMed] [Google Scholar]
- 15. Trayhurn P. Hypoxia and adipose tissue function and dysfunction in obesity. Physiol Rev. 2013;93:1‐21. [DOI] [PubMed] [Google Scholar]
- 16. Takikawa A, Mahmood A, Nawaz A, et al. HIF‐1alpha in myeloid cells promotes adipose tissue remodeling toward insulin resistance. Diabetes. 2016;65:3649‐3659. [DOI] [PubMed] [Google Scholar]
- 17. Zhang S, Jiao Y, Li C, et al. Dimethyl itaconate alleviates the inflammatory responses of macrophages in sepsis. Inflammation. 2020;44:549‐557. [DOI] [PubMed] [Google Scholar]
- 18. Tang C, Wang X, Xie Y, et al. 4‐octyl itaconate activates Nrf2 signaling to inhibit pro‐inflammatory cytokine production in peripheral blood mononuclear cells of systemic lupus erythematosus patients. Cell Physiol Biochem. 2018;51:979‐990. [DOI] [PubMed] [Google Scholar]
- 19. Kuo PC, Weng WT, Scofield BA, et al. Dimethyl itaconate, an itaconate derivative, exhibits immunomodulatory effects on neuroinflammation in experimental autoimmune encephalomyelitis. J Neuroinflammation. 2020;17:138. doi: 10.1186/s12974-020-01768-7 [DOI] [PMC free article] [PubMed] [Google Scholar]
- 20. Xin Y, Zou L, Lang S. 4‐octyl itaconate (4‐OI) attenuates lipopolysaccharide‐induced acute lung injury by suppressing PI3K/Akt/NF‐κB signaling pathways in mice. Exp Ther Med. 2021;21:141. doi: 10.3892/etm.2020.9573 [DOI] [PMC free article] [PubMed] [Google Scholar]
- 21. Li Y, Chen X, Zhang H, et al. 4‐octyl itaconate alleviates lipopolysaccharide‐induced acute lung injury in mice by inhibiting oxidative stress and inflammation. Drug Des Devel Ther. 2020;14:5547‐5558. [DOI] [PMC free article] [PubMed] [Google Scholar]
- 22. Gu L, Lin J, Wang Q, et al. Dimethyl itaconate protects against fungal keratitis by activating the Nrf2/HO‐1 signaling pathway. Immunol Cell Biol. 2020;98:229‐241. [DOI] [PMC free article] [PubMed] [Google Scholar]
- 23. Shan Q, Li X, Zheng M, et al. Protective effects of dimethyl itaconate in mice acute cardiotoxicity induced by doxorubicin. Biochem Biophys Res Commun. 2019;517:538‐544. [DOI] [PubMed] [Google Scholar]
- 24. Xu M, Jiang P, Sun H, et al. Dimethyl itaconate protects against lipopolysaccharide‐induced endometritis by inhibition of TLR4/NF‐κB and activation of Nrf2/HO‐1 signaling pathway in mice. Iran J Basic Med Sci. 2020;23:1239‐1244. [DOI] [PMC free article] [PubMed] [Google Scholar]
- 25. Zhao C, Jiang P, He Z, et al Dimethyl itaconate protects against lippolysacchride‐induced mastitis in mice by activating MAPKs and Nrf2 and inhibiting NF‐κB signaling pathways. Microb Pathog. 2019;133:103541. doi: 10.1016/j.micpath.2019.05.024 [DOI] [PubMed] [Google Scholar]
- 26. Nair S, Huynh JP, Lampropoulou V, et al. Irg1 expression in myeloid cells prevents immunopathology during M. tuberculosis infection. J Exp Med. 2018;215:1035‐1045. [DOI] [PMC free article] [PubMed] [Google Scholar]
- 27. Ayala JE, Samuel VT, Morton GJ, et al.; NIH Mouse Metabolic Phenotyping Center Consortium . Standard operating procedures for describing and performing metabolic tests of glucose homeostasis in mice. Dis Model Mech. 2010;3:525‐534. [DOI] [PMC free article] [PubMed] [Google Scholar]
- 28. McGuinness OP, Ayala JE, Laughlin MR, Wasserman DH. NIH experiment in centralized mouse phenotyping: the Vanderbilt experience and recommendations for evaluating glucose homeostasis in the mouse. Am J Physiol Endocrinol Metab. 2009;297:E849‐E855. [DOI] [PMC free article] [PubMed] [Google Scholar]
- 29. Ruan H, Hacohen N, Golub TR, Van Parijs L, Lodish HF. Tumor necrosis factor‐alpha suppresses adipocyte‐specific genes and activates expression of preadipocyte genes in 3T3‐L1 adipocytes: nuclear factor‐kappaB activation by TNF‐alpha is obligatory. Diabetes. 2002;51:1319‐1336. [DOI] [PubMed] [Google Scholar]
- 30. Camell CD, Günther P, Lee A, et al. Aging induces an Nlrp3 inflammasome‐dependent expansion of adipose B cells that impairs metabolic homeostasis. Cell Metab. 2019;30:1024‐1039.e6. [DOI] [PMC free article] [PubMed] [Google Scholar]
- 31. Nishimura S, Manabe I, Takaki S, et al. Adipose natural regulatory B cells negatively control adipose tissue inflammation. Cell Metab. 2013;18:759‐766. [DOI] [PubMed] [Google Scholar]
- 32. DeFuria J, Belkina AC, Jagannathan‐Bogdan M, et al. B cells promote inflammation in obesity and type 2 diabetes through regulation of T‐cell function and an inflammatory cytokine profile. Proc Natl Acad Sci U S A. 2013;110:5133‐5138. [DOI] [PMC free article] [PubMed] [Google Scholar]
- 33. Winer DA, Winer S, Shen L, et al. B cells promote insulin resistance through modulation of T cells and production of pathogenic IgG antibodies. Nat Med. 2011;17:610‐617. [DOI] [PMC free article] [PubMed] [Google Scholar]
- 34. Park SY, Lee HJ, Song JH, et al. Dimethyl itaconate attenuates palmitate‐induced insulin resistance in skeletal muscle cells through the AMPK/FGF21/PPARδ‐mediated suppression of inflammation. Life Sci. 2021;287:120129. doi: 10.1016/j.lfs.2021.120129 [DOI] [PubMed] [Google Scholar]
- 35. Dwivedi DK, Jena GB. Simultaneous modulation of NLRP3 inflammasome and Nrf2/ARE pathway rescues thioacetamide‐induced hepatic damage in mice: role of oxidative stress and inflammation. Inflammation. 2022;45:610‐626. [DOI] [PubMed] [Google Scholar]
- 36. Fu L, Liu H, Cai W, et al. 4‐octyl itaconate supplementation relieves soybean diet‐induced liver inflammation and glycolipid metabolic disorders by activating the Nrf2‐Pparγ pathway in juvenile Gibel carp. J Agric Food Chem. 2021;70:520‐531. [DOI] [PubMed] [Google Scholar]
- 37. Li R, Yang W, Yin Y, Zhang P, Wang Y, Tao K. Protective role of 4‐octyl itaconate in murine LPS/D‐GalN‐induced acute liver failure via inhibiting inflammation, oxidative stress, and apoptosis. Oxid Med Cell Longev. 2021;2021:9932099. doi: 10.1155/2021/9932099 [DOI] [PMC free article] [PubMed] [Google Scholar]
- 38. Xu Y, Li Z, Lu S, et al. Integrative analysis of the roles of lncRNAs and mRNAs in Itaconate‐mediated protection against liver ischemia‐reperfusion injury in mice. J Inflamm Res. 2021;14:4519‐4536. [DOI] [PMC free article] [PubMed] [Google Scholar]
Associated Data
This section collects any data citations, data availability statements, or supplementary materials included in this article.
Supplementary Materials
Appendix S1 Supporting Information.


