

Abstract
Here, we describe a workflow for high‐detail microCT imaging of formalin‐fixed and paraffin‐embedded (FFPE) equine embryos recovered on Day 34 of pregnancy (E34), a period just before placenta formation. The presented imaging methods are suitable for large animals' embryos with intention to study morphological and developmental aspects, but more generally can be adopted for all kinds of FFPE tissue specimens. Microscopic 3D imaging techniques such as microCT are important tools for detecting and studying normal embryogenesis and developmental disorders. To date, microCT imaging of vertebrate embryos was mostly done on embryos that have been stained with an X‐ray dense contrast agent. Here, we describe an alternative imaging procedure that allows to visualize embryo morphology and organ development in unstained FFPE embryos. Two aspects are critical for high‐quality data acquisition: (i) a proper sample mounting leaving as little as possible paraffin around the sample and (ii) an image filtering pipeline that improves signal‐to‐noise ratio in these inherently low‐contrast data sets. The presented workflow allows overview imaging of the whole embryo proper and can be used for determination of organ volumes and development. Furthermore, we show that high‐resolution interior tomographies can provide virtual histology information from selected regions of interest. In addition, we demonstrate that microCT scanned embryos remain intact during the scanning procedure allowing for a subsequent investigation by routine histology and/or immunohistochemistry. This makes the presented workflow applicable also to archival paraffin‐embedded material.
Keywords: embryonic development, histology, multimodal Imaging, organogenesis, X‐Ray microtomography
1. INTRODUCTION
Microscopic X‐ray computed tomography (microCT) is a tomographic imaging technique that allows to acquire genuine and isotropic 3D image volumes from dense and non‐transparent objects at micron resolution. Since the 1990s, microCT has been extensively used in industrial imaging and metrology (deChiffre et al., 2014; Maire & Withers, 2014; Stock, 1999; Stock, 2020; Vasarhelyi et al., 2020). During the last two decades, microCT also became more widespread in biomedical and biological research, gradually evolving into a routine technique for structural imaging of biological specimens (Mizutani & Suzuki, 2012; Rawson et al., 2020; Ritman, 2004, 2011; Stock, 2020). Initially, microCT was used mainly to study mineralized animal tissues. Most prominently, microCT was used for quantitative bone imaging in mouse models (Bouxsein et al., 2010; Buie et al., 2007; Jiang et al., 2005; Laib et al., 2001), but early applications included also fossils (Tafforeau et al., 2006) or hard parts of invertebrates (Marxen et al., 2008; Stock et al., 2003). More recently, the introduction of X‐ray dense contrast agents made it possible to image also soft (non‐mineralized) tissues with high contrast (Busse et al., 2018; Gabner et al., 2020; Metscher, 2009a, 2009b; Mizutani & Suzuki, 2012; Müller et al., 2018; Pauwels et al., 2013). Subsequently, microCT rapidly spread in the biological community and became a standard tool in many research areas such as comparative and functional morphology (Gignac et al., 2016; Handschuh et al., 2019), neurobiology (Glueckert et al., 2018) and invertebrate biology (Schwaha et al., 2018; Sombke et al., 2015; Ziegler et al., 2018). MicroCT imaging also became a key player in developmental imaging and embryo phenotyping. The first proof of principle that microCT is a powerful tool for embryo phenotyping was published already more than 15 years ago (Johnson et al., 2006). Subsequent refinements in embryo preparation and data analysis (Wong et al., 2014; Wong, Spring, & Henkelman, 2013) made microCT a powerful tool for large‐scale automated screening for novel phenotypes in lethal mouse lines (Dickinson et al., 2016).
While pre‐treatment with X‐ray contrast agents is to date the gold standard for high‐contrast imaging of fixed biological soft tissues, other approaches have been utilized as well. These approaches aim at reducing X‐ray attenuation in the background by replacing the aqueous environment of biological specimens by a medium with a lower X‐ray attenuation than water, instead of increasing X‐ray attenuation of tissue. As one example, drying of specimens by using either HMDS or critical point drying procedures substantially improves tissue contrast (Keklikoglou et al., 2019; Markel et al., 2021). Another example is dehydration of samples to high‐percentage alcohols such as ethanol, because ethanol also possesses a lower X‐ray density than water (Dudak et al., 2016). Tissue embedded in paraffin wax also shows reasonable microCT contrast due to the rather low X‐ray attenuation of paraffin. Already in 2008, it was shown that different structures such as hair follicles and collagen bundles can be discriminated in punch biopsies of skin (Cnudde et al., 2008). More recently, microCT imaging of paraffin samples has been become more popular for imaging of tissue biopsies (Gabner et al., 2021; Walton et al., 2015) and pathology samples (Hutchinson et al., 2017; Jones et al., 2016; Katsamenis et al., 2019; Scott et al., 2015; Senter‐Zapata et al., 2016; Teplov et al., 2019) and has also been used for high‐resolution imaging of brain tissue (Deyhle et al., 2018; Eckermann et al., 2021; Töpperwien et al., 2018; Töpperwien et al., 2019). Moreover, it has been demonstrated that microCT can be used to image early mouse development (before E9.5) in unstained paraffin‐embedded samples (Ermakova et al., 2018).
The present study presents an optimized workflow for high‐detail microCT imaging of FFPE embryos, demonstrated on equine embryos on Day 34 of development (E34). Furthermore, we provide a detailed discussion on the impact of sample mounting and image processing on image quality in reconstructed tomographic volumes. Early pregnancy embryos of large vertebrates such as horse pose peculiar problems. They are already quite large while still being early in gestation. This means, that a horse embryo E34 has roughly a length of 15 mm and thus a similar size as a mouse fetus at the time of birth (E19). However, the E34 equine embryo is much earlier in development and organogenesis, showing less compact tissues and some transient organs such as the mesonephros. Tissues are less developed and compact in earlier vertebrate embryos possessing a higher amount of water and a lower amount of proteins (Toro‐Ramos et al., 2015). This poses a special challenge to X‐ray imaging because attenuation contrast of unstained soft tissue in paraffin is already low for adult tissues and thus even lower for tissues of early embryos. Despite low intrinsic X‐ray contrast of embryonic tissues, we demonstrate that microCT is capable both to provide whole embryo information as well as histology‐scale detail for selected regions of interest in early pregnancy FFPE embryos of large vertebrates. Furthermore, we demonstrate that specimens remain intact during the imaging procedure, thus allowing subsequent histological and immunohistochemical analysis.
2. MATERIALS AND METHODS
2.1. Conceptus collection, fixation and embedding
Sample collection and preparation were approved by the Austrian Federal Ministry for Science and Research (animal experimentation licence 68.205/067‐V/3b/2018) and has been described in detail before (Okada et al., 2020). In brief, in eleven mares the genital tract was monitored by transrectal ultrasonography during oestrus, the periovulatory phase and gestation until 34 days (E34), when the conceptuses were recovered. Each mare was bred twice, with one pregnancy serving as control group whereas the other one served as treatment group (injection of prostaglandin F2α for 4 days from ovulation). For the conceptus collection on Day 34, the allantois was punctured using a transvaginal ultrasound‐guided needle (ExaPad; IMV Imaging, Angoulême, France) to reduce fluid inside the embryonic membranes. This withdrawal decreased the volume and allowed for conceptus recovery by uterine flushing using a flexible silicon tube of 2 cm diameter, which was introduced carefully through the cervix. Due to size and fragility, only 7 pairs of embryos were collected completely unharmed. Then, the embryo proper was separated from the embryonic membranes and fixed in 2% formaldehyde for 48 h. After fixation, embryos were stored in 70% ethanol until paraffin embedding. Specimens were dehydrated in graded series of ethanol solutions and embedded in paraffin wax (VOGEL Histo Comp 56°, Sanova Pharma GesmbH, Vienna, AT) using xylene as intermedium. In total, scans from three embryos are shown in the paper. The first embryo was used for comparison of sample mounting 1 and 2 (see below). The second embryo was used to test sample mounting 3. The third embryo was used for correlation to histological and immunohistochemistry data and for acquiring an interior tomography in order to explore virtual histology information of tomograms at higher resolutions.
2.2. Specimen mounting
To optimize the microCT imaging workflow for large embryos, we explored three different ways of sample mounting. (1) Routine embedding using a cassette and block holder. During embedding the embryo lay flat inside the embedding cassette with either the left or right body side facing the block holder (Figure 1a). (2) The embryo was embedded in an upright position in the paraffin block. Before scanning, surplus paraffin around the embryo was trimmed off with a razor blade (Figure 1b). (3) The paraffin‐infiltrated embryo was freely mounted in a vertical position (Figure 1c). For this mounting, a small paraffin base was prepared on a block holder. Subsequently, the paraffin‐infiltrated embryo was taken out of the 60°C melted paraffin and attached to this base in upright position by another drop of liquid paraffin. Before the paraffin solidified at room temperature, the embryo needed to be held in place by the umbilical region for several seconds using soft tweezers (Figure 1g). Upon CT scanning, block holders were glued to the sample stage using double‐sided adhesive tape. Because these embryos are very sensitive to external pressure, manipulation can lead to damage or breakage. Therefore, a minimum length of the embryonic membranes was left attached to the umbilical region during paraffin preparation to facilitate fixation.
FIGURE 1.
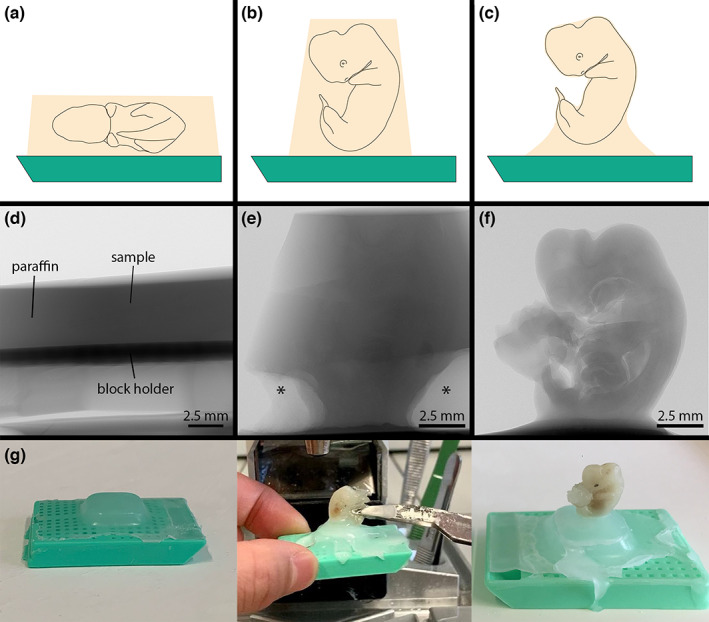
Effect of paraffin coating on image contrast. FFPE horse embryos mounted three different ways. (a) Sample mounting 1: Horizontal mounting in a paraffin block. (b) Sample mounting 2: Vertical mounting in a paraffin block with surplus paraffin trimmed away. (c) Sample mounting 3: Vertical mounting by attaching the paraffin‐infiltrated embryo to a small base with a drop of liquid paraffin. (d) X‐ray projection image of an embryo using sample mounting 1. Note that, due to the low specimen contrast and the high amount of surplus paraffin around the embryo, the specimen is almost invisible in the X‐ray image. (e) X‐ray projection imaging of an embryo using sample mounting 2. Here, the X‐ray beam has to pass through much less paraffin compared to (d), thus image contrast is considerably higher allowing to see interior structures in the projection image. Asterisks denote empty areas close to the embryo formed by air bubbles caught during embedding. (f) X‐ray projection imaging of an embryo using sample mounting 3. This type of mounting brings the best image contrast, because no surplus paraffin is present around the embryo except for the base. (g) Step‐by‐step description of attaching the paraffin‐infiltrated embryo to a sample carrier. In the first step, a small base of paraffin is prepared on a block holder (left image). Then a drop of liquid paraffin is put on this base, the embryo is taken out of the liquid 60° paraffin bath and put on the liquid paraffin drop in a vertical orientation. The embryo needs to be held in place for several seconds with soft tweezers in order to allow the paraffin to solidify at room temperature (middle image). After the paraffin has solidified, the embryo is ready for microCT imaging (right image).
2.3. MicroCT Image acquisition
Scans were acquired using an XRadia MicroXCT‐400 (Carl Zeiss X‐ray Microscopy, Pleasanton, CA, USA) with a source peak voltage of 40 kVp and a current of 200 μA. Scans of whole embryos were acquired using the 0.4X detector assembly (no detector binning). No X‐ray filter was applied. Projection images were recorded over a 360° specimen rotation with an angular increment of 0.225° between projections. Exposure time was 15 s for sample mounting 1 and 2 (Figure 1a,b) and 30 s for sample mounting 3 (Figure 1c). Isotropic voxel size was 8.17 μm for sample mounting 1, 6.16 μm for sample mounting 2 and 6.16 μm for sample mounting 3. Furthermore, we acquired a high‐resolution interior tomography from the mesonephros region of one embryo specimen with the 4X detector assembly. Projections of the interior tomography were acquired with 30 s exposure and an angular increment of 0.225°. Isotropic voxel size in the high‐resolution scan was 1.68 μm. Virtual slices (tomograms) were reconstructed with the XMReconstructor software supplied with the scanner, and reconstructed tomography volumes were saved in *.TXM format.
2.4. Image processing
Since sample contrast is very weak in paraffin‐embedded embryos, the tomograms showed a very high level of image noise when reconstructed with full voxel resolution (no reconstruction binning). To compensate for image noise, we tested and compared three different image filtering pipelines. Information on which filtering pipeline was used for which data set is provided in the results section. All image filtering steps were performed in Amira 2019 (FEI Visualization Sciences Group, part of Thermo Fisher Scientific, Mérignac Cédex, FR). The first image filtering pipeline (two‐filter pipeline) included two steps of 3D Gaussian filtering (step 1: Kernel size factor = 2, Stdev 1*1*1; step 2: Kernel size factor = 2, Stdev 2*2*2). The second pipeline (five‐filter pipeline) consisted of three steps of 3D bilateral filtering (step 1: kernel = 3*3*3, similarity = 20.000; step 2: kernel = 3*3*3, similarity = 40.000; step 3: kernel = 3*3*3, similarity = 60.000) followed by two steps of 3D Gaussian filtering (step 4: Kernel size factor = 2, Stdev 2*2*2; step 5: Kernel size factor = 2, Stdev 3*3*3). The third pipeline (four‐filter pipeline) was used for freely mounted embryos in vertical position and consisted of three steps of 3D bilateral filtering (step 1: kernel = 3*3*3, similarity = 15.000; step 2: kernel = 3*3*3, similarity = 30.000; step 3: kernel = 3*3*3, similarity = 45.000) followed by one step of 3D Gaussian filtering (step 4: Kernel size factor = 2, Stdev 2*2*2).
2.5. Measurement of mean CT number of paraffin wax at 40 kVp/200 μA imaging regime
A phantom consisting of three pipette tips containing (i) distilled water, (ii) absolute ethanol and (iii) VOGEL Histo Comp 56° paraffin wax was scanned with the same X‐ray spectrum as used for scanning the E34 horse embryos. Based on attenuation values of water and air, we standardized the intensity values of this scan to Hounsfield units (HU). From the standardized image volume, we calculated the mean CT numbers of materials. CT numbers of absolute ethanol and paraffin wax lie between that of water (0 HU) and air (−1000 HU). The mean CT number of paraffin wax was −467 HU, and thus even lower than that of absolute ethanol (−401 HU).
2.6. Histology and immunohistochemistry
To test the compatibility of microCT imaging with subsequent immunohistochemical staining, we labelled paraffin sections of one microCT scanned specimen with the following antibodies and employing established protocols: monoclonal mouse‐anti‐EGFR [Clone 4575] (1:200 in PBS) (NeoBiotechnlogies; cat. nr. 1956‐MSM25‐P1), monoclonal rabbit‐anti‐EGF [3H11L6] (1:100 in PBS) (Thermo Fisher Scientific; cat. nr. 701538), monoclonal mouse‐anti‐Desmin [Clone D33] (1:300 in PBS) (Dako, Agilent; cat. nr. M0760), monoclonal mouse‐anti‐Vimentin [Clone V9] (1:500 in PBS) (Dako, cat. nr. M0725), monoclonal mouse‐anti‐SMA [Clone 1A4] (1:1000 in PBS) (Dako, cat. nr. M0851) and polyclonal rabbit‐anti‐vWF (1:7000 in PBS) (Dako, cat. nr. A0082). DAB‐stained sections were counterstained with haematoxylin and mounted using DPX (Fluka, Buchs, CH). Slides were imaged with a Pannoramic scan II digital slide scanner (3DHISTECH, Budapest, HU) with 20x objective magnification and a pixel size 0.5 μm.
2.7. Image registration
For evaluation of the interior tomography and correlation of microCT and immunohistochemistry data, we registered all data sets using the Amira Register images tool. First, the interior tomography (isotropic voxel size = 1.68 μm) was registered to the whole embryo scan (isotropic voxel size = 6.16 μm) based on normalized mutual information using volume‐to‐volume registration. Subsequently, whole slide images were resized to a pixel size of 14.2 μm and registered to the microCT whole embryo scan based on normalized mutual information using slice‐to‐volume registration. Finally, higher resolution ROIs of the mesonephros region of the whole slide images (pixel size 0.5 μm) were registered to the interior tomography. All registration procedures used only affine transformations (16 degrees of freedom). Thus, non‐affine (elastic) deformations between the two data sets occurring based on re‐embedding and/or geometric distortions due to sectioning were not compensated, leading to minor deviations between the microCT and immunohistochemistry image data sets. However, this did not affect interpretation, because structures could be detected and correlated down to the level of single glomeruli in the mesonephros already with affine registration.
3. RESULTS
3.1. Sample mounting 1: Imaging of an E34 horse embryo in horizontal position in a paraffin block
First, we explored whether microCT could be used to image an E34 horse embryo embedded in a 30 mm x 20 mm paraffin block using conventional embedding cassettes and block holders. In this sample, the embryo laid on its side facing the block holder (Figure 1a). When looking at this kind of sample in the X‐ray projection image, the embryo was almost invisible inside the paraffin block (Figure 1d). The reconstructed tomograms (no reconstruction binning) showed a very low signal‐to‐noise ratio (SNR). As a result, the embryo could hardly be distinguished even in overview images (Figure 2a,d). Higher magnification of a selected region of interest (ROI) made it evident that no small‐scale features could be detected due to the high level of image noise (Figure 2g). Volume rendering also did not allow 3D visualization of the embryo due to the image noise (Figure 1j). For this reason, we tested two different image filter pipelines for post‐processing of reconstructed image volumes. A two‐filter pipeline (two steps of 3D Gaussian filtering) already brought a clear improvement of SNR, visible both in tomograms (Figure 2b,e,h) and volume rendering (Figure 2k). A five‐filter pipeline (three steps of 3D bilateral filtering followed by two steps of 3D Gaussian filtering) further improved image quality (Figures 2c,f,i,L). The high magnification ROI showed that different organs of the embryo such as mesonephros, liver, intestine or lung could now be unambiguously identified (Figure 2i).
FIGURE 2.
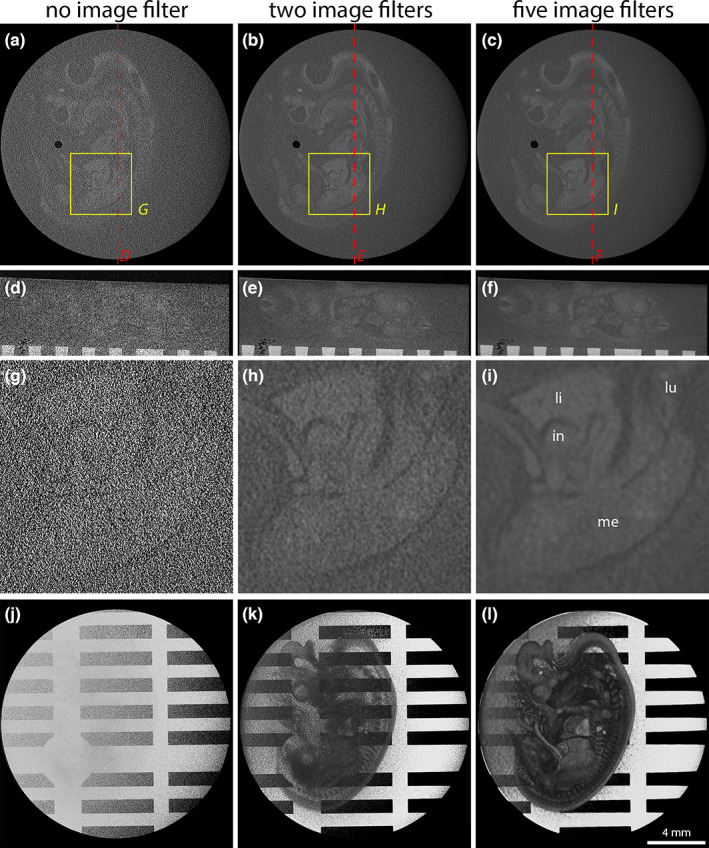
Comparison of different image filtering pipelines to reconstructed tomographic volumes from an E34 horse embryo using sample mounting 1. (a, d and g) Unfiltered tomograms showing a very low signal‐to‐noise ratio. In the magnified ROI (g), almost no anatomical structures can be resolved. (j) Volume rendering of an unfiltered scan showing only the sample carrier. The embryo is obscured by image noise. (b, e and h) Two steps of 3D Gaussian filtering notably improved SNR. (k) Volume rendering of a scan filtered with the two‐filter pipeline already reveals several morphological features. (c, f and i) Three steps of bilateral filtering followed by two steps of 3D Gaussian filtering further improve SNR. In the magnified ROI (i), embryonic organs such as lungs (lu), liver (li), intestine (in) or mesonephros (me) can be unambiguously identified. (l) Volume rendering of a scan filtered with the five‐filter pipeline shows all embryonic organs and tissues with reasonable contrast.
3.2. Sample mounting 2: Imaging of an E34 horse embryo in vertical position in a trimmed paraffin block
In the next step, we tried to improve the quality of X‐ray images by reducing the amount of surplus paraffin around the embryo. In conventional 20 mm x 30 mm paraffin blocks the X‐ray beam needed to pass through 20 mm (width) to 36 mm (diagonal) of paraffin, which obscured the already very low attenuation differences between the paraffin and the embryonic tissue. Thus, we re‐mounted the same embryo shown in Figure 2 in a vertical position and trimmed away surplus paraffin (Figure 1b). In the trimmed sample, the X‐ray beam needed to pass only less than 10 mm in either direction, which considerably increased the sample contrast in projection images. Some embryonic organs such as liver or brain could already be seen in the X‐ray projection images (Figure 1e). This also increased the SNR in reconstructed tomograms (Figure 3). Based on image registration, we compared the tomograms of the two datasets (both filtered with the five‐filter pipeline). Generally, finer morphological details could be discriminated in the trimmed specimen compared with the horizontally embedded specimen in all regions of the embryo (Figure 3f), demonstrated on the structural information gained for heart and lung (Figure 3c,d), or the mesonephros (Figure 3e,f).
FIGURE 3.
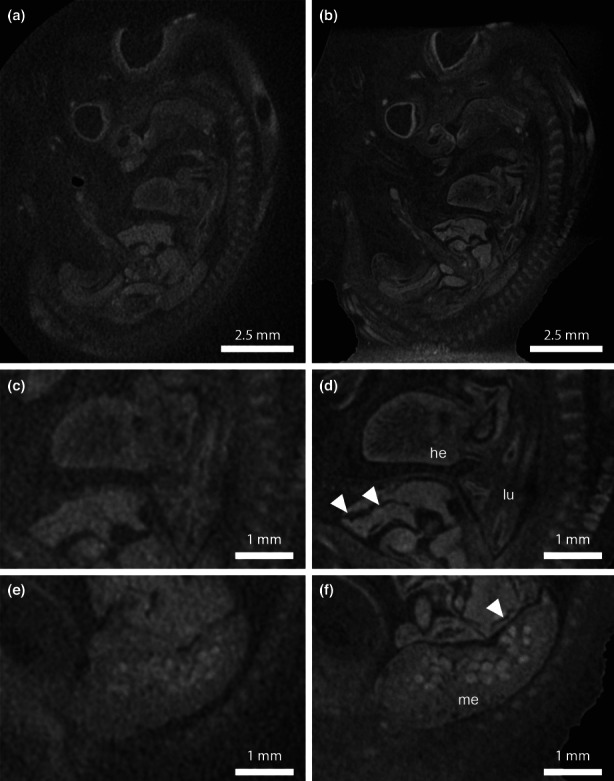
Comparison of tomograms from two scans of the same embryo using two different sample mountings. Both image volumes were filtered using a five‐filter pipeline (three steps of 3D bilateral filtering followed by two steps of 3D Gaussian filtering). (a, c and e) Tomograms from microCT scan using sample mounting 1 (embryo embedded horizontally in conventional 30 × 20 mm paraffin block). (b, d and f) Tomograms from microCT scan using sample mounting 2 (embryo embedded vertically in a paraffin block, surplus paraffin trimmed). The higher image contrast in X‐ray projection images in vertically mounted specimens (Figure 1e) results in a higher SNR in reconstructed and filtered tomograms. Finer morphological structures in embryonic organs such as heart (he), lungs (lu) or mesonephros (me) can be discriminated. Arrowheads denote artefacts in liver tissue, which appear due to re‐melting and re‐mounting of the embryo.
3.3. Sample mounting 3: Imaging of a paraffin‐infiltrated E34 horse embryo mounted without surplus paraffin
Based on the improvement of image quality achieved by vertical sample mounting and trimming, we decided to test one more sample mounting. This time we freely mounted a paraffin‐infiltrated embryo in a vertical position by attaching it on a paraffin base with a drop of liquid paraffin (Figure 1c). Compared with trimmed blocks, this mounting brought two advantages. First, there was no surplus paraffin around the embryo except for lowest part of the specimen where it is attached to the paraffin base. Thus, contrast in the projection images was further improved (Figure 1f). Second, this mounting was very gentle, reducing the mechanical stress and avoiding the risk of damaging the embryo specimen due to trimming. Furthermore, we increased the exposure time from 15 s to 30 s for each projection. The higher image contrast and the lower noise in the X‐ray images yielded an even better SNR in reconstructed tomograms (compared with sample mounting 2). This made it possible to reduce the number of image filters to four (three steps of bilateral filtering followed by one step of Gaussian filtering), thus reducing the amount of blur introduced by Gaussian filtering. Fine‐scale morphological information could be gained in these whole embryo scans at an isotropic voxel resolution of 6.16 μm. This is exemplified on a series of sagittal (Figure 4a,b) and coronal (Figure 4c‐f) tomograms, depicting structural details of the developing brain (Figure 4a‐c), pituitary (Figure 4b,c), eyes (Figure 4c), inner ear (Figure 4d), heart (Figure 4a,b,e), lungs (Figure 4a,b,f), liver (Figure 4a,b,e), stomach (Figure 4e), mesonephros (Figure 4a,d,e,f) or gonads (Figure 4a,e). Using this kind of overview scans, for example the number of developing bronchi in the lungs or many aspects of internal heart structure are depicted. Furthermore, selected ROIs can be imaged at even higher spatial resolutions by acquiring an interior tomography. As an example, we imaged the mesonephros region of one embryo with an isotropic voxel size of 1.68 μm, revealing virtual histology information on various organs of the embryo (Figure 5). This included subtle morphological features of many organs of the embryo, such as the mesonephros (Figure 5b,e), metanephros (Figure 5b,f) or the pancreas primordium (Figure 5g). At an isotropic voxel size of 1.68 μm, even single cells could be resolved in some cases, such as blood cells in the dorsal aorta (Figure 5b,d,f).
FIGURE 4.
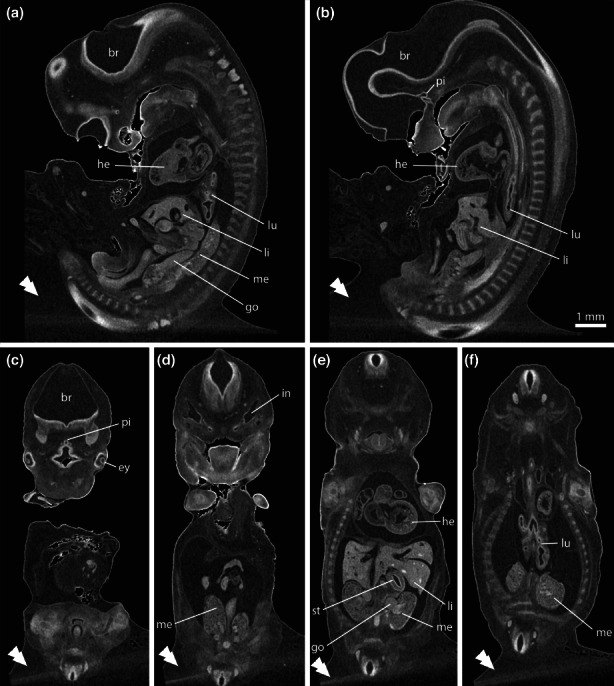
Tomograms from an E34 horse embryo scan using sample mounting 3. The image volume was filtered with a four‐filter pipeline (three steps of 3D bilateral filtering followed by one step of 3D Gaussian filtering). (a and b) Sagittal slices. (c, d, e and f) Coronal slices. This mounting delivers superior image contrast, because no surplus paraffin is present around the embryo except close to the base (double arrowheads). Isotropic voxel resolution of 6.16 μm allows to analyse fine morphological details in embryonic organs such as brain (br), pituitary (pi), eyes (ey), inner ears (in), heart (he), lungs (lu), liver (li), stomach (st) mesonephros (me) or gonads (go).
FIGURE 5.
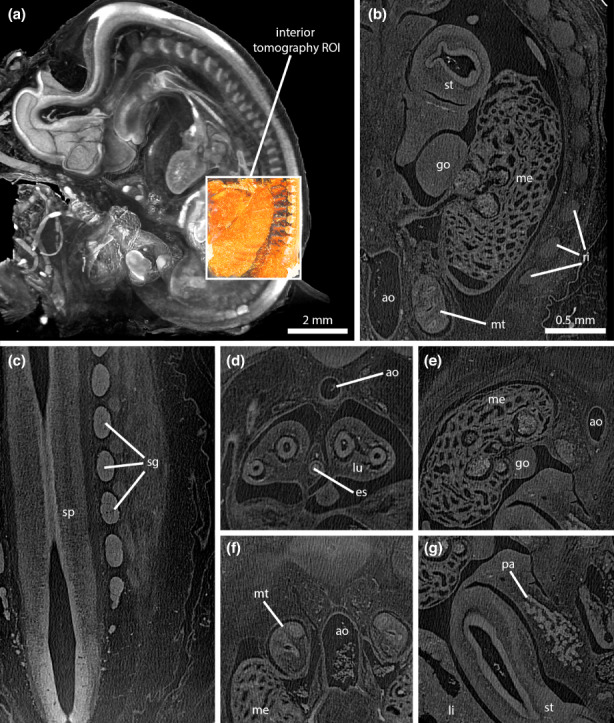
High‐resolution interior tomography scan from the mesonephros region delivers virtual histology information on embryo organs. (a) Volume rendering depicting the 6.16 μm voxel size overview scan (greyscale) and the registered 1.68 μm voxel size interior tomography scan of the mesonephros region (orange). The interior tomography is acquired without any physical specimen manipulation by using a different detector assembly (4X) and by repositioning of the tomography centre. (b) Coronal section showing mesonephros (me), metanephros (mt), gonad (go), stomach (st), ribs (ri) and dorsal aorta (ao). Note that in the dorsal aorta single blood cells can be spatially resolved. (c) Coronal section showing the spinal cord (sp) and several spinal ganglia (sg). (d) Transverse section showing lungs (lu), oesophagus (es), and aorta (ao). (e) Transverse section showing mesonephros (me), gonad (go) and aorta (ao). (f) Transverse section showing mesonephros (me), metanephros (mt), and aorta (ao). (g) Transverse section showing liver (li), stomach (st) and pancreas primordium (pa).
3.4. Sample integrity and subsequent histology and immunohistochemistry evaluation
MicroCT is a non‐destructive imaging technique, which makes it a very powerful tool for correlative imaging. We used one E34 horse embryo to demonstrate how microCT can be combined with subsequent histology and immunohistochemistry investigation. After microCT analysis, the embryo was re‐embedded into paraffin to perform sagittal cuts at 3 μm section thickness. Several immunohistochemistry stains after microCT imaging were tested, and all worked without any restrictions, demonstrating that X‐ray exposure did not hamper subsequent immunohistochemical staining (Figures S1 and S2). We used slice‐to‐volume image registration to correlate the image of an entire sagittal section stained for von Willebrand factor (vWF) with the corresponding virtual microCT slice (Figure 6a,b). Image registration made it possible to correlate microCT and immunohistochemistry information down to the level of subtle morphological features such as specific glomeruli in the mesonephros when correlating the whole slide image with the interior tomography of the mesonephros region (Figure 6c‐f). Based on the tomographic information, a histological analysis pipeline can be designed, and structural information of whole embryo organs can then be correlated with molecular information of immunohistochemistry stains.
FIGURE 6.
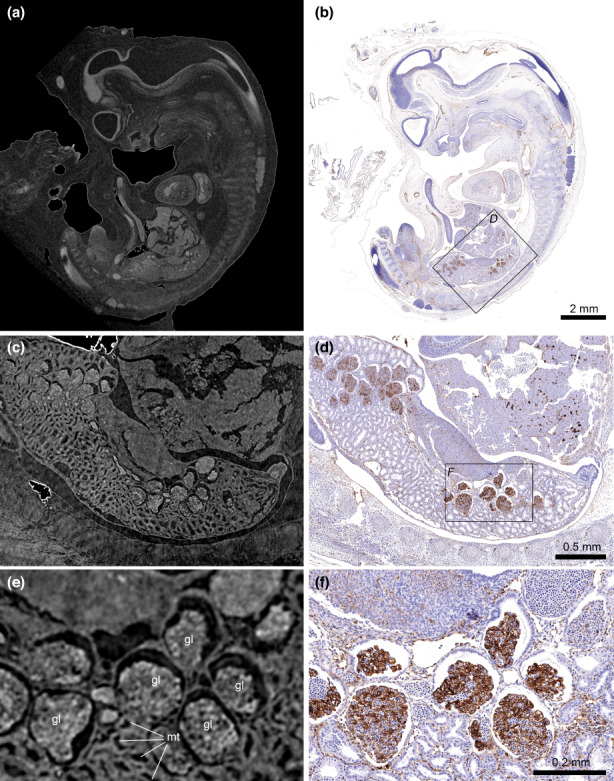
Correlation of microCT and immunohistochemistry data. (a) Sagittal microCT tomogram (isotropic voxel size 6.16 μm). (b) Whole slide image from the corresponding section stained against vWF (von Willebrand factor). The whole slide image was registered to the microCT volume using an intensity‐based slice‐to‐volume registration. Note that minor differences between the two images occur because the registration procedure only compensated affine transformations (rotation, translation, scaling, shearing), and did not compensate non‐affine (elastic) shape changes occurring due to the re‐embedding and sectioning procedure. (c and e) Higher resolution tomograms (isotropic voxel size = 1.68 μm) from an interior tomography acquired from the mesonephros region show virtual histology details such as mesonephric tubules (mt) and glomeruli (gl). (d and f) Corresponding ROIs from the whole slide image, depicting vWF expression in the mesonephros.
4. DISCUSSION
The present paper is the first to address in detail the relationship between sample mounting and image quality when imaging unstained formalin‐fixed and paraffin‐embedded (FFPE) samples. We showed that image contrast is very low when imaging such samples in 30 mm x 20 mm paraffin blocks, resulting in a low SNR and limited morphological detail in reconstructed tomograms. Two steps were critical to achieve enhanced SNR and sufficient morphological detail in data sets. On the one hand, mounting the sample without surplus paraffin yields a much higher image contrast and thus a substantially better SNR in reconstructed tomograms compared with imaging embryos that are embedded lying horizontally in a paraffin block. On the other hand, we found that several subsequent steps of image filtering are inevitable for achieving an image quality that allows interpretation and high‐detail analysis of embryo morphology. Using this approach, we demonstrate that fine morphological details can be analysed already in overview scans of whole embryos (Figure 4). Moreover, interior tomographies of selected regions of interest deliver virtual histology information (Figure 5).
4.1. Relevance for studying development of horses and other large vertebrates
Vertebrate species share similar embryogenesis; however, more accurate studies revealed that species present specificities, important to grade its development and understand the gestational stages. Early pregnancy in horses involves crucial steps such as maternal recognition of pregnancy and conceptus development until formation of the placenta which starts at Day 37 (reviewed by Aurich & Budik, 2015). Studies that allow to decipher details of conceptus development are essential to understand this period, which is considered a risk period with high rates of pregnancy loss (Bergfelt et al., 1992; Betteridge et al., 2012; deMestre et al., 2019; Hinrichs et al., 1987). The implementation of anatomical studies in horse embryos, however, is challenging due to the long gestation together with a limited availability of animals for research. Available information is heterogeneous because different methodologies and embryos at diverse gestational ages were utilized (Acker et al., 2001; Bergin, 1968;Franciolli et al., 2011; Rodrigues et al., 2012).
Previous studies on horse embryo development used both non‐destructive methods such as stereomicroscopic examination of external embryonic features (Acker et al., 2001), and destructive methods such as dissection and histological sectioning for the investigation of internal embryo anatomy (Franciolli et al., 2011; Rodrigues et al., 2012). Especially, the use of destructive methods in the past often restricted the sample to a single analysis. The presented microCT imaging workflow can be used to study both qualitative and quantitative aspects of embryonic development and leaves the samples intact. It allows to detect and qualitatively compare developmental phenotypes, since it provides clear images of the organs' external and internal morphology. Some limitation exists for the evaluation of superficial characteristics of the skin, due to the high edge contrast that originates from phase contrast at the paraffin‐air boundary. Still, ear buds, nasolacrimal groove, nose formation and mouth opening could be properly observed. Besides qualitative evaluations, image segmentation tools can be used for volumetric measurements of selected organs. In a previous study we compared seven pairs of embryos that were produced in either physiological (control) or impaired (prostaglandin F2α [PGF] treatment) pregnancies in the same mare. This precise information made it possible to identify minor differences in development between embryos from impaired and normal pregnancies (Okada et al., 2020). We identified differences not only in overall conceptus size but also in the volume of selected organs such as lung, liver and pituitary (Okada et al., 2020). Furthermore, differences in heart development were determined with a persistent interventricular foramen in five out of seven PGF‐treated embryos and only one out of seven control embryos (Okada et al., 2020). Volumetric comparisons using FFPE embedded soft tissues suffer from tissue shrinkage during fixation and embedding (Rodgers et al., 2022; Senter‐Zapata et al., 2016). Thus, volumes measured from FFPE material are always smaller compared with the fresh unfixed tissue. However, when keeping this in mind, useful comparisons can still be made. When using identical fixation and embedding protocols for all investigated samples, shrinkage should be comparable across all samples thus allowing relative measurements and comparisons. Tissue shrinkage has been an inherent limitation in all quantitative studies performed before on paraffin sections as well.
4.2. Comparison to other 3D imaging techniques
To date, microCT is one of the most widely used microscopic imaging techniques when it comes to structural imaging of biological specimens and tissue biopsies. However, many other techniques have been used for similar purposes, including ultra‐high‐field magnetic resonance imaging (micro‐MRI), high‐resolution episcopic fluorescence microscopy (HREM), light sheet microscopy (LSM) and optical projection tomography (OPT). Each of these techniques has specific strengths and limitations in terms of contrast, specificity, sensitivity and image resolution. Micro‐MRI delivers superior contrast even for untreated soft tissues for non‐transparent objects including vertebrate embryos (Dhenain et al., 2001; Ruffins et al., 2007; Zamyadi et al., 2010); however, voxel resolution is limited to roughly 10 μm (Lee et al., 2015) and access to micro‐MRI systems is very limited. HREM provides high‐contrast structural information based on serial sectioning and block face imaging (Geyer et al., 2014; Geyer & Weninger, 2019; Weninger et al., 2018). As such, it is a powerful imaging method for imaging of samples with sizes between 10 and 20 mm (such as E34 horse embryos shown in the present paper) that delivers fine morphological details and outperforms most microCT setups in terms of contrast and resolution. However, HREM requires specific sample embedding protocols, the sample is destroyed upon physical sectioning, and sections are difficult to maintain for subsequent molecular analyses. Finally, fluorescence whole‐mount imaging techniques such as LSM and OPT are able to deliver 3D images from fluorescence tags (Pitrone et al., 2013; Quintana & Sharpe, 2011; Santi, 2011; Sharpe, 2004; Sharpe et al., 2002; Weber et al., 2014; Wong, Dazai, et al., 2013), but these techniques require tissue clearing which is a step in sample preparation that is not compatible with a typical paraffin sectioning workflow. MicroCT imaging of FFPE samples is less sensitive compared with micro‐MRI, provides less anatomical detail compared to HREM, and does not provide specific molecular information such as LSM and OPT. Nevertheless, microCT imaging of FFPE samples may create a distinct niche within the framework of existing imaging techniques. It works on conventional FFPE material neither requiring a specific fixation nor a tissue staining procedure and thus can be neatly integrated into existing workflows.
4.3. Correlative analysis
Recent challenges in biomedical research often make it necessary to combine two or more imaging techniques to gain as much information out of samples as possible, known as correlative multimodal imaging (Walter et al., 2020). MicroCT imaging can be integrated into analysis pipelines that include paraffin tissue embedding. Previous studies showed that the non‐destructive nature of microCT allows subsequent investigation by histology, immunohistochemistry and immunofluorescence for different types of samples (Katsamenis et al., 2019; Teplov et al., 2019; Walton et al., 2015). Our results confirm these previous observations showing that immunohistochemistry worked well for the tested protocols (Figure 6; Figure S1 and S2), corroborating the high potential of microCT as a tool for screening FFPE samples and planning of subsequent histology and immunohistochemistry analysis. Based on microCT data, orientation for sectioning can be planned and specific regions of interest can be targeted. A similar aspect has been previously exploited for resin‐embedded specimens and correlation of microCT data to light and electron microscopy (Handschuh et al., 2013; Karreman et al., 2016; Karreman et al., 2017; Morales et al., 2016; Sengle et al., 2013). In the present study, this is demonstrated on the mesonephros region of one specimen. Using slice‐to‐volume image registration, stained sections were registered into the microCT volume (Figure 6). Although in the present paper we only used affine registration that does not compensate elastic deformations occurring during re‐embedding and sectioning of the specimen, we were able to correlate comparatively small structures such as single glomeruli of the mesonephros between microCT and immunohistochemistry data. This allows combining the full 3D volumetric information delivered by microCT and the molecular information delivered by immunohistochemistry.
5. OUTLOOK
The present article discussed different approaches for microCT imaging of unstained FFPE tissues and demonstrated that a high level of morphological detail can be achieved even for early pregnancy embryos of large vertebrates, a sample which shows especially low intrinsic tissue contrast due to the higher amount of water and the lower amount of protein in tissues of early embryos (Toro‐Ramos et al., 2015). These results lead us to the conclusion that high‐detail microCT data could be acquired from (almost) every animal or tissue biopsy embedded in paraffin. Thus, our findings can be put into a much broader perspective. The current workflow can be used for imaging all kinds of paraffin‐embedded biological material, including archival or even historical paraffin blocks. Virtual histology data allows screening of paraffin‐embedded specimens and precise targeting of regions of interest, and this information can be used for designing subsequent histological analysis. The possibility to correlate volumetric microCT data to histology and/or immunohistochemistry (Figure 6) will make microCT imaging of FFPE samples especially powerful in multimodal correlative imaging.
DATA SHARING AND ACCESSIBILITY
The data presented in this study are available from the corresponding author [SH], upon reasonable request.
Supporting information
Figure S1
Figure S2
ACKNOWLEDGEMENTS
We thank Claudia Höchsmann from the Institute of Morphology of the University of Veterinary Medicine Vienna for technical assistance. This research was supported using resources of the VetCore Facility (VetImaging) of the University of Veterinary Medicine Vienna.
Handschuh, S. , Okada, C. T. C. , Walter, I. , Aurich, C. , & Glösmann, M. (2022). An optimized workflow for microCT imaging of formalin‐fixed and paraffin‐embedded (FFPE) early equine embryos. Anatomia, Histologia, Embryologia, 51, 611–623. 10.1111/ahe.12834
Stephan Handschuh and Carolina T. C. Okada contributed equally.
REFERENCES
- Acker, D. A. , Curran, S. , Bersu, E. T. , & Ginther, O. J. (2001). Morphologic stages of the equine embryo proper on days 17 to 40 after ovulation. American Journal of Veterinary Research, 62(9), 1358–1364. 10.2460/ajvr.2001.62.1358 [DOI] [PubMed] [Google Scholar]
- Aurich, C. , & Budik, S. (2015). Early pregnancy in the horse revisited ‐ does exception prove the rule? Journal of Animal Science and Biotechnology, 6, 50. 10.1186/s40104-015-0048-6 [DOI] [PMC free article] [PubMed] [Google Scholar]
- Bergfelt, D. R. , Woods, J. A. , & Ginther, O. J. (1992). Role of the embryonic vesicle and progesterone in embryonic loss in mares. Journal of Reproduction and Fertility, 95(2), 339–347. 10.1530/jrf.0.0950339 [DOI] [PubMed] [Google Scholar]
- Bergin, W. C. (1968). Developmental horizons and measurements useful for age determination of equine embryos and fetuses. Manhattan. [Google Scholar]
- Betteridge, K. J. , Waelchli, R. O. , Christie, H. L. , Raeside, J. I. , Quinn, B. A. , & Hayes, M. A. (2012). Relationship between the timing of prostaglandin‐induced luteolysis and effects on the conceptus during early pregnancy in mares. Reproduction Fertility and Development, 24(3), 411–424. 10.1071/RD11132 [DOI] [PubMed] [Google Scholar]
- Bouxsein, M. L. , Boyd, S. K. , Christiansen, B. A. , Guldberg, R. E. , Jepsen, K. J. , & Muller, R. (2010). Guidelines for assessment of bone microstructure in rodents using micro‐computed tomography. Journal of Bone and Mineral Research, 25(7), 1468–1486. 10.1002/jbmr.141 [DOI] [PubMed] [Google Scholar]
- Buie, H. R. , Campbell, G. M. , Klinck, R. J. , MacNeil, J. A. , & Boyd, S. K. (2007). Automatic segmentation of cortical and trabecular compartments based on a dual threshold technique for in vivo micro‐CT bone analysis. Bone, 41(4), 505–515. 10.1016/j.bone.2007.07.007 [DOI] [PubMed] [Google Scholar]
- Busse, M. , Müller, M. , Kimm, M. A. , Ferstl, S. , Allner, S. , Achterhold, K. , Herzen, J. , & Pfeiffer, F. (2018). Three‐dimensional virtual histology enabled through cytoplasm‐specific X‐ray stain for microscopic and nanoscopic computed tomography. Proceedings of the National Academy of Sciences of the United States of America, 115(10), 2293–2298. 10.1073/pnas.1720862115 [DOI] [PMC free article] [PubMed] [Google Scholar]
- Cnudde, V. , Masschaele, B. , Cock, H. E. , de Olstad, K. , Vlaminck, L. , Vlassenbroeck, J. , Dierick, M. , Witte, Y. D. , van Hoorebeke, L. , & Jacobs, P. (2008). Virtual histology by means of high‐resolution X‐ray CT. Journal of Microscopy, 232(3), 476–485. 10.1111/j.1365-2818.2008.02142.x [DOI] [PubMed] [Google Scholar]
- de Chiffre, L. , Carmignato, S. , Kruth, J. P. , Schmitt, R. , & Weckenmann, A. (2014). Industrial applications of computed tomography. CIRP Journal of Manufacturing Science and Technology, 63(2), 655–677. 10.1016/j.cirp.2014.05.011 [DOI] [Google Scholar]
- de Mestre, A. M. , Rose, B. V. , Chang, Y. M. , Wathes, D. C. , & Verheyen, K. L. P. (2019). Multivariable analysis to determine risk factors associated with early pregnancy loss in thoroughbred broodmares. Theriogenology, 124, 18–23. 10.1016/j.theriogenology.2018.10.008 [DOI] [PubMed] [Google Scholar]
- Deyhle, H. , Bikis, C. , Khimchenko, A. , Schweighauser, G. , Hench, J. , Schulz, G. , Muller, B. , & Hieber, S. E. (2018). Visualization and Segmentation of Cells in Unstained Paraffin‐Embedded Cerebral Tissue. Microscopy and Microanalysis, 24, 408–409. [Google Scholar]
- Dhenain, M. , Ruffins, S. W. , & Jacobs, R. E. (2001). Three‐dimensional digital mouse atlas using high‐resolution MRI. Developmental Biology, 232(2), 458–470. 10.1006/dbio.2001.0189 [DOI] [PubMed] [Google Scholar]
- Dickinson, M. E. , Flenniken, A. M. , Ji, X. , Teboul, L. , Wong, M. D. , White, J. K. , Meehan, T. F. , Weninger, W. J. , Westerberg, H. , Adissu, H. , Baker, C. N. , Bower, L. , Brown, J. M. , Caddle, L. B. , Chiani, F. , Clary, D. , Cleak, J. , Daly, M. J. , Denegre, J. M. , … Int Mouse Phenotyping Consortium . (2016). High‐throughput discovery of novel developmental phenotypes. Nature, 537(7621), 508–514. 10.1038/nature19356 [DOI] [PMC free article] [PubMed] [Google Scholar]
- Dudak, J. , Zemlicka, J. , Karch, J. , Patzelt, M. , Mrzilkova, J. , Zach, P. , Hermanova, Z. , Kvacek, J. , & Krejci, F. (2016). High‐contrast X‐ray micro‐radiography and micro‐CT of ex‐vivo soft tissue murine organs utilizing ethanol fixation and large area photon‐counting detector. Scientific Reports, 6, 30385. 10.1038/srep30385 [DOI] [PMC free article] [PubMed] [Google Scholar]
- Eckermann, M. , Schmitzer, B. , van der Meer, F. , Franz, J. , Hansen, O. , Stadelmann, C. , & Salditt, T. (2021). Three‐dimensional virtual histology of the human hippocampus based on phase‐contrast computed tomography. Proceedings of the National Academy of Sciences of the United States of America, 118(48), e2113835118. 10.1073/pnas.2113835118 [DOI] [PMC free article] [PubMed] [Google Scholar]
- Ermakova, O. , Orsini, T. , Gambadoro, A. , Chiani, F. , & Tocchini‐Valentini, G. P. (2018). Three‐dimensional microCT imaging of murine embryonic development from immediate post‐implantation to organogenesis: application for phenotyping analysis of early embryonic lethality in mutant animals. Mammalian Genome, 29(3–4), 245–259. 10.1007/s00335-017-9723-6 [DOI] [PMC free article] [PubMed] [Google Scholar]
- Franciolli, A. L. R. , Cordeiro, B. M. , Da Fonseca, E. T. , Rodrigues, M. N. , Sarmento, C. A. P. , Ambrosio, C. E. , Carvalho, A. F. d. , Miglino, M. A. , & Silva, L. A. (2011). Characteristics of the equine embryo and fetus from days 15 to 107 of pregnancy. Theriogenology, 76(5), 819–832. 10.1016/j.theriogenology.2011.04.014 [DOI] [PubMed] [Google Scholar]
- Gabner, S. , Böck, P. , Fink, D. , Glösmann, M. , & Handschuh, S. (2020). The visible skeleton 2.0: Phenotyping of cartilage and bone in fixed vertebrate embryos and foetuses based on X‐ray microCT. Development, 147(11), dev187633. 10.1242/dev.187633 [DOI] [PubMed] [Google Scholar]
- Gabner, S. , Michels, C. , Lanz, B. , Nell, B. , Handschuh, S. , & Egerbacher, M. (2021). Labial and buccal minor salivary glands of the dog ‐ location, three‐dimensional arrangement and histology. Veterinary Ophthalmology, 24(4), 400–407. 10.1111/vop.12920 [DOI] [PMC free article] [PubMed] [Google Scholar]
- Geyer, S. H. , Nöhammer, M. M. , Mathä, M. , Reissig, L. , Tinhofer, I. E. , & Weninger, W. J. (2014). High‐resolution episcopic microscopy (HREM): A tool for visualizing skin biopsies. Microscopy and Microanalysis, 20(5), 1356–1364. 10.1017/S1431927614013063 [DOI] [PubMed] [Google Scholar]
- Geyer, S. H. , & Weninger, W. J. (2019). High‐resolution episcopic microscopy (HREM): Looking back on 13 years of successful generation of digital volume data of organic material for 3D visualisation and 3D display. Applied Sciences, 9(18), 3826. 10.3390/app9183826 [DOI] [Google Scholar]
- Gignac, P. M. , Kley, N. J. , Clarke, J. A. , Colbert, M. W. , Morhardt, A. C. , Cerio, D. , Cost, I. N. , Cox, P. G. , Daza, J. D. , Early, C. M. , Echols, M. S. , Henkelman, R. M. , Herdina, A. N. , Holliday, C. M. , Li, Z. , Mahlow, K. , Merchant, S. , Müller, J. , Orsbon, C. P. , … Witmer, L. M. (2016). Diffusible iodine‐based contrast‐enhanced computed tomography (diceCT): An emerging tool for rapid, high‐resolution, 3‐D imaging of metazoan soft tissues. Journal of Anatomy, 228(6), 889–909. 10.1111/joa.12449 [DOI] [PMC free article] [PubMed] [Google Scholar]
- Glueckert, R. , Johnson, C. L. , Schmidbauer, D. , Potrusil, T. , Pechriggl, E. J. , Hoermann, R. , Brenner, E. , Reka, A. , Schrott‐Fischer, A. , & Handschuh, S. (2018). Visualization of the membranous labyrinth and nerve fiber pathways in human and animal inner ears using microCT imaging. Frontiers in Neuroscience, 12, 501. 10.3389/fnins.2018.00501 [DOI] [PMC free article] [PubMed] [Google Scholar]
- Handschuh, S. , Baeumler, N. , Schwaha, T. , & Ruthensteiner, B. (2013). A correlative approach for combining microCT, light and transmission electron microscopy in a single 3D scenario. Frontiers in Zoology, 10(1), 44. 10.1186/1742-9994-10-44 [DOI] [PMC free article] [PubMed] [Google Scholar]
- Handschuh, S. , Natchev, N. , Kummer, S. , Beisser, C. J. , Lemell, P. , Herrel, A. , & Vergilov, V. (2019). Cranial kinesis in the miniaturised lizard Ablepharus kitaibelii (Squamata: Scincidae). Journal of Experimental Biology, 222(Pt 9), 1–15. 10.1242/jeb.198291 [DOI] [PubMed] [Google Scholar]
- Hinrichs, K. , Sertich, P. L. , Palmer, E. , & Kenney, R. M. (1987). Establishment and maintenance of pregnancy after embryo transfer in ovariectomized mares treated with progesterone. Journal of Reproduction and Fertility, 80(2), 395–401. 10.1530/jrf.0.0800395 [DOI] [PubMed] [Google Scholar]
- Hutchinson, J. C. , Shelmerdine, S. C. , Simcock, I. C. , Sebire, N. J. , & Arthurs, O. J. (2017). Early clinical applications for imaging at microscopic detail: microfocus computed tomography (micro‐CT). The British Journal of Radiology, 90(1075), 20170113. 10.1259/bjr.20170113 [DOI] [PMC free article] [PubMed] [Google Scholar]
- Jiang, Y. , Zhao, J. , Liao, E.‐Y. , Dai, R.‐C. , Wu, X.‐P. , & Genant, H. K. (2005). Application of micro‐CT assessment of 3‐D bone microstructure in preclinical and clinical studies. Journal of Bone and Mineral Metabolism, 23(Suppl), 122–131. 10.1007/BF03026336 [DOI] [PubMed] [Google Scholar]
- Johnson, J. T. , Hansen, M. S. , Wu, I. , Healy, L. J. , Johnson, C. R. , Jones, G. M. , Capecchi, M. R. , & Keller, C. (2006). Virtual histology of transgenic mouse embryos for high‐throughput phenotyping. PLoS Genetics, 2(4), e61. 10.1371/journal.pgen.0020061 [DOI] [PMC free article] [PubMed] [Google Scholar]
- Jones, M. G. , Fabre, A. , Schneider, P. , Cinetto, F. , Sgalla, G. , Mavrogordato, M. , Jogai, S. , Alzetani, A. , Marshall, B. G. , O'Reilly, K. M. A. , Warner, J. A. , Lackie, P. M. , Davies, D. E. , Hansell, D. M. , Nicholson, A. G. , Sinclair, I. , Brown, K. K. , & Richeldi, L. (2016). Three‐dimensional characterization of fibroblast foci in idiopathic pulmonary fibrosis. JCI Insight, 1(5), 1–11. 10.1172/jci.insight.86375 [DOI] [PMC free article] [PubMed] [Google Scholar]
- Karreman, M. A. , Mercier, L. , Schieber, N. L. , Solecki, G. , Allio, G. , Winkler, F. , Ruthensteiner, B. , Goetz, J. G. , & Schwab, Y. (2016). Fast and precise targeting of single tumor cells in vivo by multimodal correlative microscopy. Journal of Cell Science, 129(2), 444–456. 10.1242/jcs.181842 [DOI] [PMC free article] [PubMed] [Google Scholar]
- Karreman, M. A. , Ruthensteiner, B. , Mercier, L. , Schieber, N. L. , Solecki, G. , Winkler, F. , Goetz, J. G. , & Schwab, Y. (2017). Find your way with X‐Ray: Using microCT to correlate in vivo imaging with 3D electron microscopy. Methods in Cell Biology, 140, 277–301. 10.1016/bs.mcb.2017.03.006 [DOI] [PubMed] [Google Scholar]
- Katsamenis, O. L. , Olding, M. , Warner, J. A. , Chatelett, D. S. , Jones, M. G. , Sgalla, G. , Smit, B. , Larkin, O. J. , Haig, I. , Richeldi, L. , Sinclair, I. , Lackie, P. M. , & Schneider, P. (2019). X‐ray micro‐computed tomography for nondestructive three‐dimensional (3D) X‐ray histology. American Journal of Pathology, 189(8), 1608–1620. 10.1016/j.ajpath.2019.05.004 [DOI] [PMC free article] [PubMed] [Google Scholar]
- Keklikoglou, K. , Faulwetter, S. , Chatzinikolaou, E. , Wils, P. , Brecko, J. , Kvaček, J. , Metscher, B. , & Arvanitidis, C. (2019). Micro‐computed tomography for natural history specimens: a handbook of best practice protocols. European Journal of Taxonomy, 522, 1–55. 10.5852/ejt.2019.522 [DOI] [Google Scholar]
- Laib, A. , Kumer, J. L. , Majumdar, S. , & Lane, N. E. (2001). The temporal changes of trabecular architecture in ovariectomized rats assessed by MicroCT. Osteoporosis International, 12(11), 936–941. 10.1007/s001980170022 [DOI] [PubMed] [Google Scholar]
- Lee, C. H. , Blackband, S. J. , & Fernandez‐Funez, P. (2015). Visualization of synaptic domains in the Drosophila brain by magnetic resonance microscopy at 10 micron isotropic resolution. Scientific Reports, 5, 8920. 10.1038/srep08920 [DOI] [PMC free article] [PubMed] [Google Scholar]
- Maire, E. , & Withers, P. J. (2014). Quantitative X‐ray tomography. International Materials Reviews, 59(1), 1–43. 10.1179/1743280413y.0000000023 [DOI] [Google Scholar]
- Markel, M. , Ginzel, M. , Peukert, N. , Schneider, H. , Haak, R. , Mayer, S. , Suttkus, A. , Lacher, M. , Kluth, D. , & Gosemann, J.‐H. (2021). High resolution three‐dimensional imaging and measurement of lung, heart, liver, and diaphragmatic development in the fetal rat based on micro‐computed tomography (micro‐CT). Journal of Anatomy, 238(4), 1042–1054. 10.1111/joa.13355 [DOI] [PMC free article] [PubMed] [Google Scholar]
- Marxen, J. C. , Prymak, O. , Beckmann, F. , Neues, F. , & Epple, M. (2008). Embryonic shell formation in the snail Biomphalaria glabrata: A comparison between scanning electron microscopy (SEM) and synchrotron radiation micro computer tomography (SR mu CT). Journal of Molluscan Studies, 74, 19–26. 10.1093/mollus/eym044 [DOI] [Google Scholar]
- Metscher, B. D. (2009a). MicroCT for comparative morphology: Simple staining methods allow high‐contrast 3D imaging of diverse non‐mineralized animal tissues. BMC Physiology, 9, 11. 10.1186/1472-6793-9-11 [DOI] [PMC free article] [PubMed] [Google Scholar]
- Metscher, B. D. (2009b). MicroCT for developmental biology: A versatile tool for high‐contrast 3D imaging at histological resolutions. Developmental Dynamics, 238(3), 632–640. [DOI] [PubMed] [Google Scholar]
- Mizutani, R. , & Suzuki, Y. (2012). X‐ray microtomography in biology. Micron, 43(2–3), 104–115. 10.1016/j.micron.2011.10.002 [DOI] [PubMed] [Google Scholar]
- Morales, A. G. , Stempinski, E. S. , Xiao, X. , Patel, A. , Panna, A. , Olivier, K. N. , Mcshane, P. J. , Robinson, C. , George, A. J. , Donahue, D. R. , Chen, P. , & Wen, H. (2016). Micro‐CT scouting for transmission electron microscopy of human tissue specimens. Journal of Microscopy, 263(1), 113–117. 10.1111/jmi.12385 [DOI] [PMC free article] [PubMed] [Google Scholar]
- Müller, M. , Kimm, M. A. , Ferstl, S. , Allner, S. , Achterhold, K. , Herzen, J. , Pfeiffer, F. , & Busse, M. (2018). Nucleus‐specific X‐ray stain for 3D virtual histology. Scientific Reports, 8(1), 17855. 10.1038/s41598-018-36067-y [DOI] [PMC free article] [PubMed] [Google Scholar]
- Okada, C. T. C. , Kaps, M. , Scarlet, D. , Handschuh, S. , Gautier, C. , Melchert, M. , Aurich, J. , & Aurich, C. (2020). Low plasma progestin concentration during the early postovulatory phase impairs equine conceptus development in the late preimplantation phase. Reproduction Fertility and Development, 32(13), 1156–1167. 10.1071/RD20116 [DOI] [Google Scholar]
- Pauwels, E. , van Loo, D. , Cornillie, P. , Brabant, L. , & van Hoorebeke, L. (2013). An exploratory study of contrast agents for soft tissue visualization by means of high resolution X‐ray computed tomography imaging. Journal of Microscopy, 250(1), 21–31. 10.1111/jmi.12013 [DOI] [PubMed] [Google Scholar]
- Pitrone, P. G. , Schindelin, J. , Stuyvenberg, L. , Preibisch, S. , Weber, M. , Eliceiri, K. W. , Huisken, J. , & Tomancak, P. (2013). OpenSPIM: An open‐access light‐sheet microscopy platform. Nature Methods, 10(7), 598–599. 10.1038/nmeth.2507 [DOI] [PMC free article] [PubMed] [Google Scholar]
- Quintana, L. , & Sharpe, J. (2011). Optical projection tomography of vertebrate embryo development. Cold Spring Harbor Protocols, 2011(6), 586–594. 10.1101/pdb.top116 [DOI] [PubMed] [Google Scholar]
- Rawson, S. D. , Maksimcuka, J. , Withers, P. J. , & Cartmell, S. H. (2020). X‐ray computed tomography in life sciences. BMC Biology, 18(1), 1, 21–15. 10.1186/s12915-020-0753-2 [DOI] [PMC free article] [PubMed] [Google Scholar]
- Ritman, E. L. (2004). Micro‐computed tomography‐current status and developments. Annual Review of Biomedical Engineering, 6, 185–208. 10.1146/annurev.bioeng.6.040803.140130 [DOI] [PubMed] [Google Scholar]
- Ritman, E. L. (2011). Current status of developments and applications of micro‐CT. Annual Review of Biomedical Engineering, 13, 531–552. 10.1146/annurev-bioeng-071910-124717 [DOI] [PubMed] [Google Scholar]
- Rodgers, G. , Tanner, C. , Schulz, G. , Migga, A. , Kuo, W. , Bikis, C. , Scheel, M. , Kurtcuoglu, V. , Weitkamp, T. , & Müller, B. (2022). Virtual histology of an entire mouse brain from formalin fixation to paraffin embedding. Part 2: Volumetric strain fields and local contrast changes. Journal of Neuroscience Methods, 365, 109385. 10.1016/j.jneumeth.2021.109385 [DOI] [PubMed] [Google Scholar]
- Rodrigues, R. F. , Rodrigues, M. N. , Franciolli, A. L. R. , Carvalho, R. C. , Rigoglio, N. , Jacob, J. C. F. , Gastal, E. L. , & Miglino, M. A. (2012). Embryonic and fetal development of the cardiorespiratory apparatus in horses (Equus Caballus) from 20 to 115 days of gestation. Journal of Cytology & Histology, 5(4), 1. 10.4172/2157-7099.1000240 [DOI] [Google Scholar]
- Ruffins, S. W. , Martin, M. , Keough, L. , Truong, S. , Fraser, S. E. , Jacobs, R. E. , & Lansford, R. (2007). Digital three‐dimensional atlas of quail development using high‐resolution MRI. TheScientificWorldJOURNAL, 7, 592–604. 10.1100/tsw.2007.125 [DOI] [PMC free article] [PubMed] [Google Scholar]
- Santi, P. A. (2011). Light sheet fluorescence microscopy: A review. The Journal of Histochemistry and Cytochemistry, 59(2), 129–138. 10.1369/0022155410394857 [DOI] [PMC free article] [PubMed] [Google Scholar]
- Schwaha, T. F. , Handschuh, S. , Ostrovsky, A. N. , & Wanninger, A. (2018). Morphology of the bryozoan Cinctipora elegans (Cyclostomata, Cinctiporidae) with first data on its sexual reproduction and the cyclostome neuro‐muscular system. BMC Evolutionary Biology, 18(1), 92. 10.1186/s12862-018-1206-1 [DOI] [PMC free article] [PubMed] [Google Scholar]
- Scott, A. E. , Vasilescu, D. M. , Seal, K. A. , Keyes, S. D. , Mavrogordato, M. N. , Hogg, J. C. , Sinclair, I. , Warner, J. A. , Hackett, T. L. , & Lackie, P. M. (2015). Three dimensional imaging of paraffin embedded human lung tissue samples by micro‐computed tomography. PLoS One, 10(6), e0126230. 10.1371/journal.pone.0126230 [DOI] [PMC free article] [PubMed] [Google Scholar]
- Sengle, G. , Tufa, S. F. , Sakai, L. Y. , Zulliger, M. A. , & Keene, D. R. (2013). A correlative method for imaging identical regions of samples by micro‐CT, light microscopy, and electron microscopy: Imaging adipose tissue in a model system. The Journal of Histochemistry and Cytochemistry, 61(4), 263–271. 10.1369/0022155412473757 [DOI] [PMC free article] [PubMed] [Google Scholar]
- Senter‐Zapata, M. , Patel, K. , Bautista, P. A. , Griffin, M. , Michaelson, J. , & Yagi, Y. (2016). The role of micro‐CT in 3D histology imaging. Pathobiology, 83(2–3), 140–147. 10.1159/000442387 [DOI] [PubMed] [Google Scholar]
- Sharpe, J. (2004). Optical projection tomography. Annual Review of Biomedical Engineering, 6, 209–228. 10.1146/annurev.bioeng.6.040803.140210 [DOI] [PubMed] [Google Scholar]
- Sharpe, J. , Ahlgren, U. , Perry, P. , Hill, B. , Ross, A. , Hecksher‐Sørensen, J. , Baldock, R. , & Davidson, D. (2002). Optical projection tomography as a tool for 3D microscopy and gene expression studies. Science, 296(5567), 541–545. 10.1126/science.1068206 [DOI] [PubMed] [Google Scholar]
- Sombke, A. , Lipke, E. , Michalik, P. , Uhl, G. , & Harzsch, S. (2015). Potential and limitations of X‐ray micro‐computed tomography in arthropod neuroanatomy: a methodological and comparative survey. Journal of Comparative Neurology, 523(8), 1281–1295. 10.1002/cne.23741 [DOI] [PMC free article] [PubMed] [Google Scholar]
- Stock, S. R. (1999). X‐ray microtomography of materials. International Materials Reviews, 44(4), 141–164. 10.1179/095066099101528261 [DOI] [Google Scholar]
- Stock, S. R. (2020). Microcomputed tomography: methodology and applications. CRC Press/Taylor & Francis. [Google Scholar]
- Stock, S. R. , Barss, J. , Dahl, T. , Veis, A. , Almer, J. D. , & Carlo, F. (2003). Synchrotron X‐ray studies of the keel of the short‐spined sea urchin Lytechinus variegatus: absorption microtomography (microCT) and small beam diffraction mapping. Calcified Tissue International, 72(5), 555–566. 10.1007/s00223-002-1037-2 [DOI] [PubMed] [Google Scholar]
- Tafforeau, P. , Boistel, R. , Boller, E. , Bravin, A. , Brunet, M. , Chaimanee, Y. , Cloetens, P. , Feist, M. , Hoszowska, J. , Jaeger, J. J. , Kay, R. F. , Lazzari, V. , Marivaux, L. , Nel, A. , Nemoz, C. , Thibault, X. , Vignaud, P. , & Zabler, S. (2006). Applications of X‐ray synchrotron microtomography for non‐destructive 3D studies of paleontological specimens. Applied Physics A‐Materials Science & Processing, 83(2), 195–202. 10.1007/s00339-006-3507-2 [DOI] [Google Scholar]
- Teplov, A. , Tabata, K. , Fu, X. , Uraoka, N. , Roehrl, M. , Ntiamoah, P. , Humm, J. L. , Sirintrapun, S. J. , Murray, M. P. , Shia, J. , Travis, W. D. , Brogi, E. , Hameed, M. , & Yagi, Y. (2019). Development of standard operating procedure (SOP) of Micro‐computed tomography (micro‐CT) in pathology. Diagnostic Pathology, 5, 273. 10.17629/www.diagnosticpathology.eu [DOI] [Google Scholar]
- Töpperwien, M. , Markus, A. , Alves, F. , & Salditt, T. (2019). Contrast enhancement for visualizing neuronal cytoarchitecture by propagation‐based x‐ray phase‐contrast tomography. NeuroImage, 199, 70–80. 10.1016/j.neuroimage.2019.05.043 [DOI] [PubMed] [Google Scholar]
- Töpperwien, M. , van der Meer, F. , Stadelmann, C. , & Salditt, T. (2018). Three‐dimensional virtual histology of human cerebellum by X‐ray phase‐contrast tomography. Proceedings of the National Academy of Sciences of the United States of America, 115(27), 6940–6945. 10.1073/pnas.1801678115 [DOI] [PMC free article] [PubMed] [Google Scholar]
- Toro‐Ramos, T. , Paley, C. , Pi‐Sunyer, F. X. , & Gallagher, D. (2015). Body composition during fetal development and infancy through the age of 5 years. European Journal of Clinical Nutrition, 69(12), 1279–1289. 10.1038/ejcn.2015.117 [DOI] [PMC free article] [PubMed] [Google Scholar]
- Vasarhelyi, L. , Konya, Z. , Kukovecz, A. , & Vajtai, R. (2020). Microcomputed tomography‐based characterization of advanced materials: A review. Materials Today Advances, 8, 100084. 10.1016/j.mtadv.2020.100084 [DOI] [Google Scholar]
- Walter, A. , Paul‐Gilloteaux, P. , Plochberger, B. , Sefc, L. , Verkade, P. , Mannheim, J. G. , Slezak, P. , Unterhuber, A. , Marchetti‐Deschmann, M. , Ogris, M. , Buehler, K. , Fixler, D. , Geyer, S. H. , Weninger, W. J. , Gloesmann, M. , Handschu, S. , & Wanek, T. (2020). Correlated multimodal imaging in life sciences: expanding the biomedical horizon. Frontiers in Physics, 8, 1–28. 10.3389/fphy.2020.00047 [DOI] [Google Scholar]
- Walton, L. A. , Bradley, R. S. , Withers, P. J. , Newton, V. L. , Watson, R. E. B. , Austin, C. , & Sherratt, M. J. (2015). Morphological characterisation of unstained and intact tissue micro‐architecture by X‐ray computed micro‐ and nano‐tomography. Scientific Reports, 5, 1–14. 10.1038/srep10074 [DOI] [PMC free article] [PubMed] [Google Scholar]
- Weber, M. , Mickoleit, M. , & Huisken, J. (2014). Light sheet microscopy. Methods in Cell Biology, 123, 193–215. 10.1016/B978-0-12-420138-5.00011-2 [DOI] [PubMed] [Google Scholar]
- Weninger, W. J. , Maurer‐Gesek, B. , Reissig, L. F. , Prin, F. , Wilson, R. , Galli, A. , Adams, D. J. , White, J. K. , Mohun, T. J. , & Geyer, S. H. (2018). Visualising the cardiovascular system of embryos of biomedical model organisms with high resolution episcopic microscopy (HREM). Journal of Cardiovascular Development and Disease, 5(4), 58. 10.3390/jcdd5040058 [DOI] [PMC free article] [PubMed] [Google Scholar]
- Wong, M. D. , Dazai, J. , Walls, J. R. , Gale, N. W. , & Henkelman, R. M. (2013). Design and implementation of a custom built optical projection tomography system. PLoS One, 8(9), e73491. 10.1371/journal.pone.0073491 [DOI] [PMC free article] [PubMed] [Google Scholar]
- Wong, M. D. , Maezawa, Y. , Lerch, J. P. , & Henkelman, R. M. (2014). Automated pipeline for anatomical phenotyping of mouse embryos using micro‐CT. Development, 141(12), 2533–2541. 10.1242/dev.107722 [DOI] [PMC free article] [PubMed] [Google Scholar]
- Wong, M. D. , Spring, S. , & Henkelman, R. M. (2013). Structural stabilization of tissue for embryo phenotyping using micro‐CT with iodine staining. PLoS One, 8(12), e84321. 10.1371/journal.pone.0084321 [DOI] [PMC free article] [PubMed] [Google Scholar]
- Zamyadi, M. , Baghdadi, L. , Lerch, J. P. , Bhattacharya, S. , Schneider, J. E. , Henkelman, R. M. , & Sled, J. G. (2010). Mouse embryonic phenotyping by morphometric analysis of MR images. Physiological Genomics, 42A(2), 89–95. 10.1152/physiolgenomics.00091.2010 [DOI] [PMC free article] [PubMed] [Google Scholar]
- Ziegler, A. , Bock, C. , Ketten, D. R. , Mair, R. W. , Mueller, S. , Nagelmann, N. , Pracht, E. D. , & Schröder, L. (2018). Digital three‐dimensional imaging techniques provide new analytical pathways for malacological research. American Malacological Bulletin, 36(2), 248–273. 10.4003/006.036.0205 [DOI] [Google Scholar]
Associated Data
This section collects any data citations, data availability statements, or supplementary materials included in this article.
Supplementary Materials
Figure S1
Figure S2