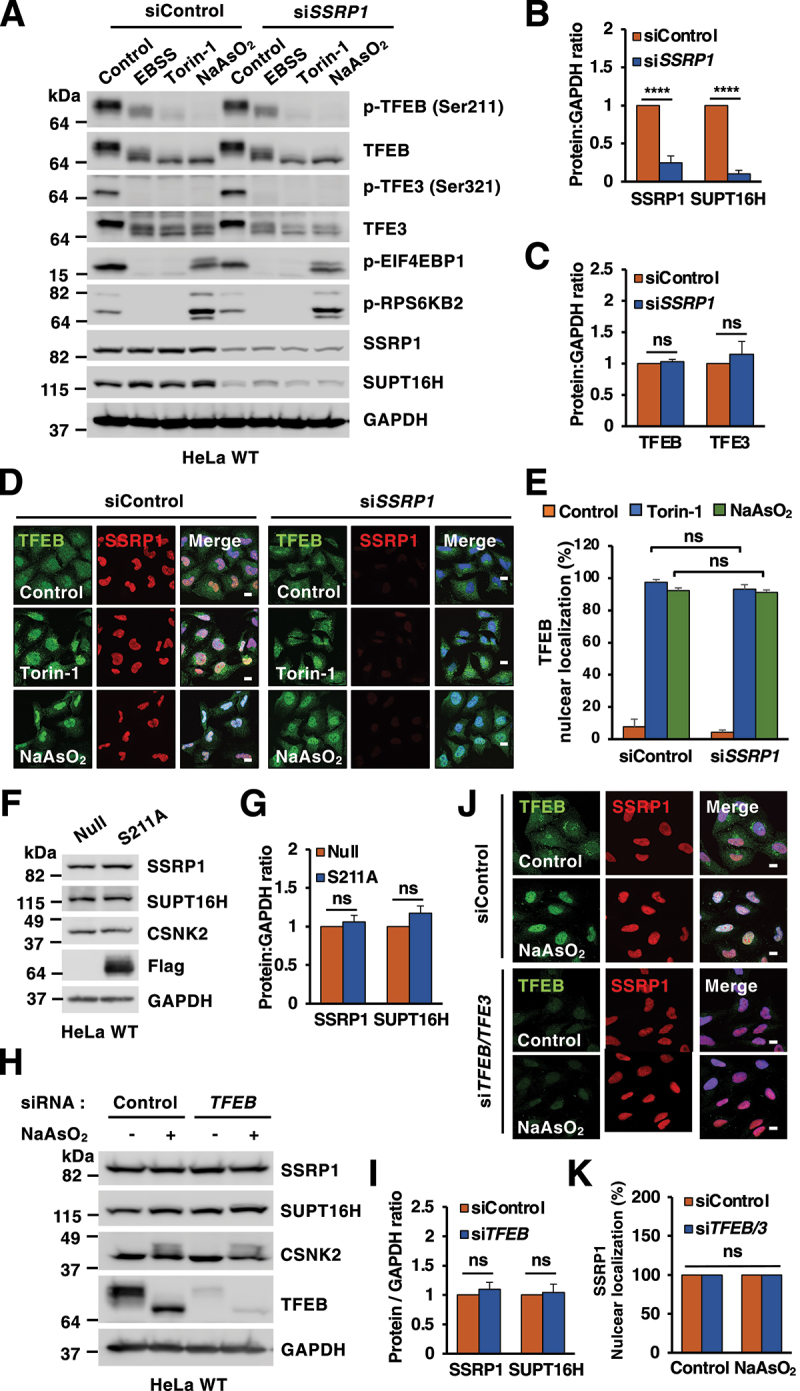
Figure 3.

Depletion of the FACT complex does not alter TFEB or TFE3 activation. (A) Immunoblots of protein lysates from HeLa WT cells transfected with the indicated siRNAs upon incubation with DMSO (Control), EBSS for 4 h, Torin-1 (250 nM) for 2 h or NaAsO2 (50 μM) for 6 h. (B and C) Quantification of immunoblots shown in (A). Significance tested with two-way ANOVA with Sidak’s multiple comparisons test (****p < 0.0001) from three independent experiments. (D) Immunofluorescence confocal microscopy analysis of siRNA-transfected HeLa WT cells treated with DMSO (Control), Torin-1 (250 nM) for 2 h or NaAsO2 (50 μM) for 6 h and stained with antibodies against TFEB and SSRP1. Scale bars: 10 μm. (E) Quantification of immunofluorescence images shown in (D). Significance tested with two-way ANOVA with Sidak’s multiple comparisons test from three independent experiments and >100 cells counted per trial. (F) Immunoblot analysis of protein lysates from HeLa WT cells infected with either Ad-Null or Ad-TFEB-S211A-Flag for 40 h. (G) Quantification of immunoblots shown in (F). Significance tested with two-way ANOVA with Sidak’s multiple comparisons testfrom three independent experiments. (H) Immunoblots of protein lysates from HeLa WT cells depleted of TFEB and treated with NaAsO2 (50 μM) for 6 h. (I) Quantification of immunoblots shown in (H). Significance tested with two-way ANOVA with Sidak’s multiple comparisons test from three independent experiments. (J) Immunofluorescence confocal microscopy analysis of HeLa WT cells depleted of TFEB and TFE3 stained with antibodies against endogenous TFEB and SSRP1. Scale bars: 10 μm. (K) Quantification of immunofluorescence images shown in (J). Significance tested with two-way ANOVA with Sidak’s multiple comparisons test from three independent experiments and >100 cells counted per trial.
