

Abstract
Hydrogenation and hydrogenolysis are two important reactions for electrochemical reductive valorization of biomass‐derived oxygenates such as 5‐hydroxymethylfurfural (HMF). In general, hydrogenolysis (which combines hydrogenation and deoxygenation) is more challenging than hydrogenation (which does not involve the cleavage of carbon–oxygen bonds). Thus, identifying factors and conditions that can promote hydrogenolysis is of great interest for reductive valorization of biomass‐derived oxygenates. For the electrochemical reduction of HMF and its derivatives, it is known that aldehyde hydrogenation is not a part of aldehyde hydrogenolysis but rather a competing reaction; however, no atomic‐level understanding is currently available to explain their electrochemical mechanistic differences. In this study, combined experimental and computational investigations were performed using Cu electrodes to elucidate the key mechanistic differences between electrochemical hydrogenation and hydrogenolysis of HMF. The results revealed that hydrogenation and hydrogenolysis of HMF involve the formation of different surface‐adsorbed intermediates via different reduction mechanisms and that lowering the pH promoted the formation of the intermediates required for aldehyde and alcohol hydrogenolysis. This study for the first time explains the origins of the experimentally observed pH‐dependent selectivities for hydrogenation and hydrogenolysis and offers a new mechanistic foundation upon which rational strategies to control electrochemical hydrogenation and hydrogenolysis can be developed.
Keywords: 5-hydroxymethylfurfural, deoxygenation, electrochemistry, hydrogenation, hydrogenolysis
A matter of pH: This study shows that hydrogenation and hydrogenolysis of 5‐hydroxymethylfurfual involve the formation of different surface‐adsorbed intermediates via different reduction mechanisms, which for the first time explains why pH affects the relative selectivities for hydrogenation and hydrogenolysis.

Introduction
The use of cellulosic biomass and its derivatives to produce organic chemicals and transportation fuels has gained increasing attention as a promising alternative to the use of fossil resources.[ 1 , 2 , 3 , 4 ] 5‐Hydroxymethylfurfural (HMF) is an important lignocellulose‐derived biomass platform molecule, which can be produced by acid‐catalyzed dehydration of cellulose and further converted into a variety of desirable chemicals.[ 5 , 6 , 7 ] The traditional reductive conversion of HMF with a heterogenous catalyst consumes H2 gas and requires elevated reaction temperatures and pressures, leading to additional energy costs. In contrast, electrochemical conversion has the advantage of operating at ambient temperature and pressure, does not require H2, and can employ renewable (e.g., solar, wind) electricity, which is becoming increasingly accessible and inexpensive. Furthermore, in the electrochemical approach, the reduction of HMF can be paired with an electrochemical oxidation reaction at the anode that produces other value‐added products at the same time, enhancing the overall efficiency and productivity of the single process.[ 8 , 9 , 10 , 11 ]
Previous studies have shown that the electrochemical reduction of HMF can produce a variety of products depending on the electrode material and electrolyte used.[ 6 , 13 , 14 ] For example, the hydrogenation of the C=O bond of HMF (i.e., addition of hydrogen to form alcohols without cleaving the C−O bond) results in 2,5‐bis(hydroxymethyl)furan (BHMF), which can be used as a monomer for the production of polyurethane foams and polyesters (Figure 1).[ 15 , 16 , 17 ] On the other hand, hydrogenolysis of both the C=O and C−OH bonds of HMF (i.e., addition of hydrogen to cleave C=O and C−O bonds to form CH x ) results in 2,5‐dimethylfuran (DMF) (Figure 1), which is a biofuel with an energy density 40 % greater than that of ethanol.[ 18 , 19 ] While electrocatalysts and reduction conditions to produce BHMF efficiently and selectively have been reported,[ 16 , 20 ] electrochemical DMF production has been more challenging. [12] In general, hydrogenolysis of the aldehyde and alcohol groups (which involves deoxygenation) is more difficult than hydrogenation of the aldehyde group. Furthermore, it has been reported that for electrochemical reduction, once the C=O group of HMF is hydrogenated to form BHMF, the hydrogenolysis of the C−OH bond does not occur readily, making BHMF a terminal product (Figure 1). [12] This means that aldehyde hydrogenation is not part of aldehyde hydrogenolysis but rather is a competing reaction. A similar observation has been made for the hydrogenation and hydrogenolysis of the aldehyde group of furfural and other furfural derivatives.[ 12 , 21 ]
Figure 1.

Possible pathways for the electrochemical reduction of HMF with the furan ring remaining intact. Blue arrows indicate the hydrogenation of an aldehyde, green arrows indicate the hydrogenolysis of an aldehyde, and red arrows indicate the hydrogenolysis of an alcohol. The dashed arrows indicate steps experimentally found to be difficult to occur at pH 9.2. [12]
The observation that electrochemical aldehyde hydrogenation and electrochemical aldehyde hydrogenolysis are competing reactions suggests that they may involve different mechanisms and/or different reaction intermediates; however, currently no atomic‐level understanding is available to explain their mechanistic differences. Hydrogenolysis, which not only adds hydrogen but also eliminates oxygen, considerably increases the energy density of the starting molecule and is of great importance in any reductive organic conversion reactions. Thus, establishing a mechanistic foundation for electrochemical hydrogenolysis will be highly beneficial as it enables the development of rational strategies to enhance hydrogenolysis selectivity.
In this study, we performed combined experimental and computational investigations on HMF reduction using Cu electrodes to achieve the following specific goals. The first goal is to experimentally examine how the pH affects the selectivities toward hydrogenation and hydrogenolysis of HMF. There are a few studies that thoroughly investigated the effect of pH on the reduction of furfural,[ 21 , 22 ] but quantitatively rigorous investigation of the impact of pH on all HMF reduction pathways, which is critical for accurate mechanistic understanding of HMF hydrogenation and hydrogenolysis, has not yet been achieved. In this study, the instability of a few HMF reduction products in acidic media and the difficulty in accurately quantifying DMF were carefully examined, in order to provide an accurate and systematic analysis of the pH effects on the conversion of HMF to various reduction products. Using these results, the second goal is to identify the most plausible hydrogenolysis pathways from HMF to DMF in acidic media. We note that understanding the hydrogenolysis pathways for HMF is considerably more complicated than understanding those for furfural. For example, the conversion of HMF to DMF requires the hydrogenolysis of both the alcohol and aldehyde groups and elucidating which group undergoes hydrogenolysis first (which is never a concern when considering furfural reduction as it has only an aldehyde group) is at the heart of understanding the selectivity for DMF production. The third and most important goal is to elucidate why the selectivities for hydrogenolysis and hydrogenation of HMF show the opposite trend upon pH change. Our results show that a decrease in pH promotes hydrogenolysis [i.e., the faradaic efficiency (FE) for DMF production increases from 1 to 28 % when the pH is lowered from 9 to 2] while suppressing hydrogenation. A similar trend has been observed for the reduction of furfural;[ 21 , 22 , 23 ] however, the reason for the observed pH dependence has not yet been elucidated in any of the prior studies. In this study, we computationally examined all possible HMF reduction pathways and the most feasible mechanistic routes [i.e., hydrogen atom transfer (HAT) and proton coupled electron transfer (PCET)] to form the intermediates for each of the pathways. By comparing computational and experimental results and considering the influence of pH on HAT and PCET, we for the first time reveal how pH can impact hydrogenolysis and hydrogenation selectivities.
Results and Discussion
Experimental investigations
In this study, we used high‐surface‐area nanocrystalline Cu foam electrodes to increase the yield of products so that we could more reliably quantify them and obtain accurate results for their selectivities. SEM images of the high‐surface‐area Cu foam electrodes used in this study are shown in Figure 2. The Cu foam electrodes were prepared by electrodepositing Cu metal onto an electrode that is concurrently reducing water to H2. [24] The H2 bubbles formed during electrodeposition served as in situ templates to produce a foam structure with a macroporous morphology (Figure 2a). The wall of the foam electrode is composed of corncob‐like dendritic Cu nanocrystals, further increasing the surface area (Figure 2b).
Figure 2.

Scanning electron microscopy (SEM) images of a nanostructured Cu foam electrode. (a) Low magnification image showing the macroporous foam structure. (b) High magnification image showing the nanocrystals comprising the wall.
pH dependence
The electrocatalytic properties of Cu foam electrodes under different pH conditions were first investigated using linear sweep voltammetry (LSV). The LSVs of Cu foam electrodes obtained in pH 2 (sulfate), pH 4.5 (acetate), pH 7 (phosphate), and pH 9 (borate) buffered solutions are shown in Figure 3. The black lines show LSVs in the absence of HMF where the current comes only from the hydrogen evolution reaction (HER), while the red lines show LSVs in the presence of HMF. With the addition of 20 mm HMF, the onset potential of the reduction current shifts to the positive direction for all pH conditions, which indicates that with the Cu foam electrode the reduction of HMF is easier than HER for every pH condition tested in this study.
Figure 3.
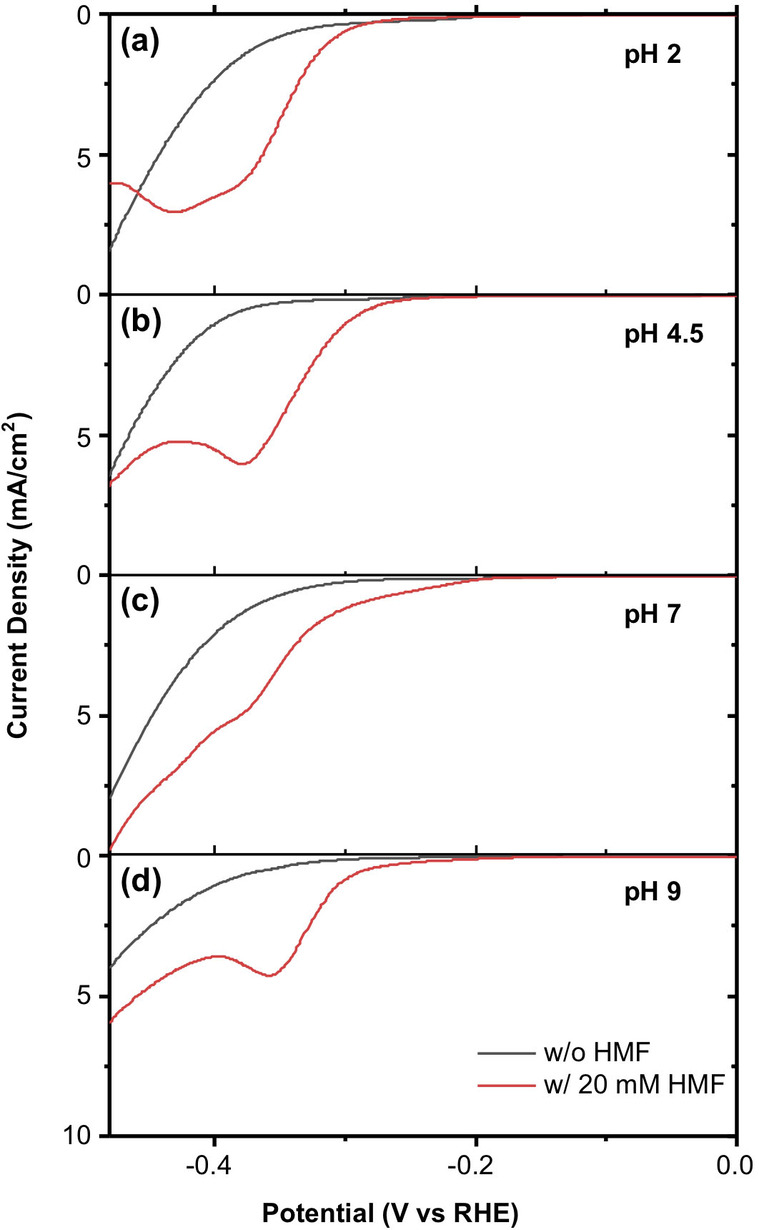
LSVs obtained with a Cu foam electrode in (a) pH 2, (b) pH 4.5, (c) pH 7, and (d) pH 9 buffered solutions with (red) and without (black) 20 mm HMF (scan rate: 10 mV s−1).
To investigate the influence of pH on the product distribution, constant potential electrolyses were performed in various pH solutions containing 20 mm HMF. Three different potentials [−0.5, −0.6, and −0.7 V vs. the reversible hydrogen electrode (RHE)] were tested under each pH condition, and 38.6 C were passed for the 10 mL solutions, which is the stoichiometric amount of charge necessary to convert all the HMF to BHMF (2e− per molecule HMF). The products soluble in the solution were quantified by proton nuclear magnetic resonance (1H NMR) spectroscopy while the volatile DMF was collected by a cyclohexane extraction layer and quantified by gas chromatography–mass spectrometry (GC‐MS) as explained in the Experimental Section. The use of a reliable and accurate method to collect DMF was essential for our study, and we provide a detailed comparison of our method with previously used DMF detection methods in the Experimental Section to point out various experimental errors that can result in inaccurate DMF quantification.
The results at −0.5 V vs. RHE, which are representative of results obtained from other potential conditions, are shown in Figure 4. The complete dataset from all potentials and pH values is shown in Figure S1 (the potential effect at each pH), Figure S2 (the pH effect at each potential), and Table S1. In acidic media (pH≤4.5), 2,5‐hexanedione (HD), which forms through reductive ring opening reactions, [25] was detected in addition to the products where the furan ring remained intact. However, HD was only a minor product (FE<4 %). Our previous paper showed that the reductive ring opening of HMF is a dominant reduction reaction only on zinc (FE=72 %). [25] Overall, the results shown in Figure 4 and Figures S1 and S2 indicate that as pH decreases, the preference toward hydrogenation of the aldehyde group decreases while the preference for hydrogenolysis of both aldehyde and alcohol groups increases. For example, BHMF, the hydrogenation product, is the dominant product under near‐neutral pH conditions, which is consistent with our previous research. [12] As pH decreases from 9 to 2, however, the selectivity towards BHMF decreases from 70 (pH 9) to 32 % (pH 2), and the FE for BHMF decreases from 39 (pH 9) to 19 % (pH 2). The possibility that the decreased selectivity for BHMF at lower pH values may be due to a more facile conversion of BHMF to other products under acidic conditions was excluded because, as is shown in the next section, the electrolysis of BHMF shows an extremely low conversion (<5 %), meaning BHMF is inactive for further reduction under the given conditions.
Figure 4.

Selectivity (left) and FE (right) for BHMF, MFA, MF, HD, and DMF produced by a Cu foam electrode at −0.5 V vs. RHE in various pH solutions containing 20 mm HMF. The stoichiometric amount of charge necessary to convert all HMF in the solution to BHMF (2e − per molecule HMF) was passed before product analysis.
The FE towards 5‐methylfurfuryl alcohol (MFA), a product of partial hydrogenolysis (i.e., hydrogenolysis of only the aldehyde C=O bond), increases as pH decreases from pH 9 (7 %) to pH 4.5 (30 %). It, however, appears to decrease significantly when the pH is further lowered to 2 (4 %). We found that the sudden FE drop for MFA production in pH 2 is not due to a true FE change but rather due to the instability of the produced MFA in acidic media (Figure S3), which decreases the amount of detectable MFA. Thus, we believe that MFA production increases as pH decreases. The effects of pH on the conversion pathways of HMF to MFA are discussed below.
Most interestingly, the FE towards DMF increases significantly, from 1 to 28 % as pH decreases from pH 9 to pH 2. As the production of DMF from HMF must involve the hydrogenolysis of both the alcohol and aldehyde group, the increased yield of DMF indicates that either one or both of the hydrogenolysis reactions are facilitated with decreasing pH. Thus, it is important to elucidate the hydrogenolysis step(s) that are enhanced with decreasing pH along with which hydrogenolysis occurs first and what are the key intermediates involved in the conversion of HMF to DMF in acidic media. Corresponding experiments and discussions are provided in the following section.
We note that the sum of the selectivities of all identifiable HMF reduction products at each pH condition is less than 100 % (Figure 4). The missing HMF is most likely due to the formation of humins that cannot be easily detected or quantified due to their irregular polymeric structures and compositions. [26] In pH 2, the instability of the produced MFA also contributed to the selectivity sum being less than 100 %. At pH 4.5, 7, and 9, HMF and all detectable products have been found to be stable (<1 % degradation) over 8 h. This is much longer than even our longest electrolysis times (≈2 h) so degradation of these compounds would not contribute to the selectivity loss. We also note that hydrofuroin‐like dimer was not detected as a reduction product for reduction conditions investigated in our study because of the relatively low concentration of HMF (20 mm) used in this study. The sum of the FEs for all HMF reduction products is also less than 100 % (Figure 4). Besides humin production, the major reaction that is responsible for the FEs not adding up to 100 % is the HER. The HER occurs more vigorously at more negative overpotentials. As a result, the combined FEs for HMF reduction decrease as a more negative potential is applied (Figure S1).
Finally, we confirmed that the pH‐dependence of the hydrogenation and hydrogenolysis of HMF is not unique to the nanocrystalline Cu foam electrode used but rather is general. When Cu and other metal (Ni, Ag, In) foil electrodes with 2D flat surfaces were used, lowering pH had the general effect of promoting hydrogenolysis over hydrogenation of HMF (Figure S4), though the absolute selectivities for hydrogenolysis and hydrogenation varied by the electrode type.
Reaction pathways to DMF and their pH dependence
Figure 1 shows three different pathways for the conversion of HMF to DMF. The first is to have BHMF and MFA as the intermediates, the second is to have only MFA as an intermediate, and the third is to have only 5‐methylfurfural (MF) as an intermediate. To narrow down feasible pathways to produce DMF in acidic media, we conducted a series of reduction reactions using BHMF, MFA, and MF as the starting molecule and examined which reactions resulted in the production of DMF. The reduction reactions were performed under conditions identical to those used for HMF reduction; Cu foam electrodes were employed in a pH 4.5 solution containing 20 mm of a starting molecule at −0.6 V vs. RHE. We chose pH 4.5 instead of pH 2 to study the reduction pathways in acidic media because the chemical instability of BHMF, MFA, and DMF in strong acidic conditions (Figure S3) can distort the measurement of the product yields and starting molecule conversion, leading to incorrect mechanistic understanding.
The conversion of the starting molecule and the FE towards DMF and MFA are listed in Table 1, along with FE towards other products. When starting with HMF, 40 % of the initial HMF is converted to DMF with a FE of 12 %. In contrast, starting from BHMF and MFA leads to negligible conversions and less than 1 % FE for DMF production. These results mean that when BHMF and MFA are formed by HMF reduction, they should be considered terminal products that cannot be further reduced to DMF. We also note that when BHMF is used as the starting molecule, the MFA yield was below the detection limit. This means that when MFA is formed by HMF reduction, BHMF is not an intermediate. Conversely, when MF is the starting molecule, 36 % of the initial MF is converted, forming DMF with a FE of over 50 % and MFA with a FE of about 8 %. As MFA is a terminal product, the production of DMF from MF can occur only through direct hydrogenolysis of the aldehyde bond.
Table 1.
Conversion of 20 mm solutions of various starting molecules and the FEs towards MFA, DMF, and other minor products on a Cu foam electrode at −0.6 V vs. RHE in a pH 4.5 buffer solution after passing charge equivalent to 2e − per starting molecule.
|
Starting molecule |
Conv. [%] |
FE [%] |
||||
|---|---|---|---|---|---|---|
|
MFA |
DMF |
BHMF |
MF |
HD |
||
|
HMF |
40 |
25 |
12 |
11 |
<1 |
2 |
|
BHMF |
2 |
<1 |
<0.1 |
N.A. |
N.A. |
<0.1 |
|
MFA |
4 |
N.A. |
<1 |
N.A. |
N.A. |
<1 |
|
MF |
36 |
8 |
51 |
N.A. |
N.A. |
1 |
The results shown in Table 1 offer three major findings. First, among BHMF, MFA, and MF, only MF can produce a meaningful amount of DMF, meaning that MF is the major intermediate for DMF production. Second, the fact that MFA is a terminal product but MF is not suggests that hydrogenolysis of the alcohol group is much more difficult than hydrogenolysis of the aldehyde group. Third, since the production of MF from HMF must involve the hydrogenolysis of the alcohol group, the hydrogenolysis of the alcohol group in HMF must be easier than the hydrogenolysis of the alcohol groups in BHMF and MFA. In other words, the other substituent of the furan ring (i.e., an aldehyde group for HMF, a hydroxymethyl group for BHMF, and a methyl group for MFA) affects how easily the hydrogenolysis of the alcohol group occurs. In fact, while the hydrogenolysis of the alcohol group in HMF is easier than the hydrogenolysis of the alcohol group in BHMF and MFA, we believe the formation of MF from HMF is still difficult and is the rate determining step for DMF production. This claim is supported by the negligible yield and accumulation of MF during HMF reduction, meaning as soon as MF is produced, it is immediately consumed to form MFA or DMF.
We believe that the enhanced DMF yield when lowering the pH arises from two contributing factors. Firstly, our results for the reduction of MF in various pH conditions show that the conversion of MF to DMF via the hydrogenolysis of the aldehyde group is promoted in acidic media (Figure S5). Secondly, we observed that the impact of a lower pH on the conversion of HMF to DMF is much greater than that of MF to DMF, meaning that the conversion of HMF to MF via the hydrogenolysis of the alcohol group is also improved by lowering the pH. This agrees well with another observation of ours that, unlike in basic and near neutral conditions, MF is detected in pH 4.5 and accumulates to an even greater extent in pH 2. Overall, our results suggest that the necessity of forming MF first to produce DMF in acidic media is the same as that in near neutral media (Figure 1), [12] meaning lowering the pH does not create new pathways to produce DMF. Instead, the enhanced DMF yield in acidic media is due to the acidic media promoting both the conversion of HMF to MF via alcohol hydrogenolysis and MF to DMF via aldehyde hydrogenolysis.
Reaction pathways to MFA and their pH dependence
Figure 1 shows three different pathways for the conversion of HMF to MFA: the first is the hydrogenolysis of an alcohol group after BHMF is formed, the second is through hydrogenolysis of the alcohol group (i.e., formation of MF) followed by the hydrogenation of the aldehyde group, and the third is through hydrogenolysis of the aldehyde group of HMF. The results and discussion provided for the effect of pH on reaction pathways to DMF can also be used to determine which pathway to MFA is facilitated when the pH is lowered. The first pathway can be eliminated due to the negligible conversion of BHMF though further reduction that has been discussed above. We do not think lowering the pH can significantly promote the second pathway (i.e., hydrogenolysis of the alcohol group followed by the hydrogenation of the aldehyde group) because while lowering the pH can promote the hydrogenolysis of the alcohol group, it makes hydrogenation of the aldehyde group less likely to occur. On the other hand, the promotion of the third pathway (i.e., hydrogenolysis of the aldehyde group) at lower pH is supported by the hydrogenolysis results of MF discussed above (Figure S5). A similar pH dependence for the hydrogenolysis of the aldehyde group has also been reported in furfural reduction studies.[ 21 , 22 ] Thus, we believe that the third pathway is mainly reponsible for the enhanced MFA yield when the pH is lowered.
Computational investigations
In order to gain insight into the reasons why hydrogenolysis of alcohol and aldehyde groups are promoted at low pH, plausible pathways and intermediates to form BHMF, MF, MFA, and DMF were examined (Figure 5), and the free energies of intermediates were calculated using the computational hydrogen electrode method (CHE) [27] at −0.6 V vs. RHE on Cu (111) which was chosen as a representative model surface for Cu (Figure 6). Cu(111) is the most stable facet of Cu and has been frequently used for computational investigations of Cu electrocatalysts.[ 28 , 29 ] We assumed that a Cu (111) surface at −0.6 V vs. RHE has a 50 % monolayer coverage (0.5 ML) of adsorbed hydrogen atom (Hads or H*). Our justification for using this level of surface hydrogen atom coverage is provided in the additional computational methods section in the Supporting Information (Figure S6 and Table S2).
Figure 5.

Proposed pathways to BHMF, MF, MFA, and DMF. One Hads is shown explicitly to illustrate the consumption of Hads by HAT; however, the actual surface would have many more Hads equivalent to a 0.5 ML coverage.
Figure 6.

The free energy diagrams for reduction of (a) HMF and (b) MF at −0.6 V vs. RHE using the CHE method. One H* is shown explicitly to represent the reaction of intermediates involving H*. Column (i) in (a) starts with 4 (H+/e−) pairs to convert HMF to MFA while Column (i) in (b) starts with 4 (H+/e−) pairs to convert MF to DMF. As the reduction proceeds, a pair of (H+/e−) is consumed for the reduction of the organic species or for the regeneration of H*, and the remaining number of the (H+/e−) pairs decreases by one each time the column number increases.
We considered four different adsorption geometries of HMF on Cu (111): vertical configurations adsorbing on the surface through the aldehyde group (Vertical‐ald) or the alcohol group (Vertical‐alc) and flat configurations adsorbing on the surface through the aldehyde group (Flat‐ald) or through the alcohol group (Flat‐alc) (Figure S7). Under both vacuum conditions and in the presence of an implicit solvation model, we found that the two flat configurations are significantly more favorable than the two vertical ones (Table S3). Therefore, we considered only the two flat configurations.
Before discussing the results shown in Figures 5 and 6, we must first explain the notation used and give some background information regarding the reduction mechanisms. We use the notation HMF‐HO and HMF‐HC in Figures 5 and 6 to represent intermediates formed by the addition of H to the O and the C of the aldehyde group of HMF, respectively. In the same manner, MF‐HO and MF‐HC represent the intermediates formed by the addition of H to the O and the C of the aldehyde group of MF, respectively. The notation dehyHMF represents an intermediate formed by the addition of hydrogen to the O of the alcohol group of HMF followed by dehydration, resulting in cleavage of the alcohol C−O bond (Figure 5, Pathway 2–1).
The addition of a hydrogen atom to HMF or its intermediates (referred to as organic species hereafter) can occur either via a direct proton coupled electron transfer (PCET) that transfers one proton from solution and one electron from the electrode to the organic species or through a hydrogen atom transfer (HAT) that transfers a surface adsorbed hydrogen atom (Hads) to the organic species. As mentioned above, we started with Cu(111) that already contains 0.5 monolayers of Hads, which represents our best estimate of the coverage under the experimental conditions. Thus, when HAT occurs to the organic species, the system (surface+organic species) as a whole does not gain a pair of H+ and e−, meaning no reduction current is generated. This is different from PCET where the system does gain a pair of H+ and e−. For HAT, the reduction of the system occurs when the surface site that lost Hads regenerates Hads by the reduction of a proton from the solution. Thus, when the free energies of different intermediates formed by PCET and HAT are compared, the comparison must be made after the Hads consumed by HAT is reformed on the surface to compare free energies at the same degree of reduction. This concept is demonstrated in Scheme 1. In Figure 6, the intermediates with the same degree of reduction are those aligned vertically at the same position along the x‐axis, reaction coordinate.
Scheme 1.

Comparison of PCET and HAT showing the necessity of reforming H* after HAT to fairly compare free energies of the intermediates formed by PCET and HAT at the same degree of system reduction. Henceforth, the system is defined as the combination of the organic species and the H‐covered surface. One Hads is shown explicitly to illustrate the reaction and regeneration of Hads; however, the actual surface would have many more Hads equivalent to 0.5 ML monolayers.
We note that while all hydrogenated intermediates can form via PCET, a few can also form by HAT. As HAT requires the transfer of Hads, the kinetic feasibility of HAT is determined in part by the distance between the electrode surface and the atom of the organic species that will gain Hads. With the configuration of Flat‐ald, the distance between the O atom of the aldehyde and the electrode surface is 1.7 Å (Figure S8a). This distance is between the center of the O atom and the tip of the closest Cu atom in the electrode surface (using 1.3 Å as the radius of metallic Cu), which is the most relevant distance to consider for HAT. This suggests that facile transfer of Hads on the Cu surface to the O atom via HAT to form HMF‐HO is likely. To validate this assumption, we searched the associated minimum energy path for Hads transfer (forming HMF‐HO) via the climbing image nudged elastic band method (CI‐NEB) [30] and the dimer method [31] to refine the transition states. For simplicity, the solvation effect is not included. CI‐NEB calculations along with the dimer method show that the pathway for HMF‐HO gives a moderate reaction barrier of 0.47 eV, while the competing pathway for HMF‐HC gives a barrier of 0.62 eV. The latter barrier is larger than typical PCET barriers computed via similar methods. [32] Similarly, the pathway for MF‐HO gives a barrier of 0.49 eV, while that for MF‐HC gives a barrier of 0.65 eV. Thus, HMF‐HC and MF‐HC are expected for form primarily through PCET rather than HAT. We note that while HMF‐HO and MF‐HO can form through HAT, they can also form via PCET as we have no reason to exclude this possibility.
We next consider how pH affects the HAT and PCET mechanisms. When a fixed potential vs. RHE is applied, we expect the kinetics of the PCET pathway should have a much greater pH dependence than do the kinetics of the HAT pathway. This is because, for PCET, the proton concentration directly affects the kinetics since it is a direct reactant. In contrast, the coverage of the Hads required for the HAT pathway remains approximately constant because the RHE scale compensates for differences in solution proton concentration, meaning the equilibrium coverage will remain the same regardless of the pH as long as the same potential is applied vs. RHE. The actual coverage of Hads may vary with pH if pH has different effects on the kinetics of the production of Hads through the Volmer step and the kinetics of the consumption of Hads through Tafel/Heyrovsky steps and reaction with the organic species. This difference in coverage, however, will be drastically smaller than the difference of several orders of magnitude in proton concentration achieved by varying pH by a few units. Accordingly, the kinetics of PCET, which depend strongly upon proton concentration, should change much more with pH than do the kinetics of HAT, which depends upon Hads coverage. This means that at high pH the adsorbed HMF has a higher chance to react with Hads via HAT while at low pH its chance decreases due to the enhanced kinetics of PCET. We note that at high pH, PCET may occur with H2O as the dominant proton donor. However, the kinetics of this process are typically much slower and thus less likely to compete effectively with HAT. [33] The pH dependence of PCET and HAT can change the dominant reduction pathway and the major surface‐adsorbed intermediates formed, and therefore can have major impacts on the selectivity for the various products. With this understanding, we discuss below the pathways to form BHMF, MFA, MF, and DMF and how pH can affect their selectivity.
Computational investigations on the pathways for BHMF
There are two pathways to form BHMF (Figure 5). Pathway 1–1 involves the formation of HMF‐HO via either HAT or PCET. The conversion of the resulting HMF‐HO to BHMF is likely to occur by PCET in acidic media due to the high proton concentration. In near neutral media, however, it may still occur through HAT as PCET would be less competitive. We note, though, that whether this second step occurs via PCET or HAT is not important as it does not affect the product selectivity. Pathway 1–2 involves the formation of HMF‐HC via PCET with the resulting HMF‐HC being converted to BHMF via either HAT or PCET. Figure 6 shows that HMF‐HC is thermodynamically more stable than HMF‐HO. Therefore, at low pH where the formation of HMF‐HC by PCET is not kinetically hindered, HMF‐HC might be expected to form dominantly. We note that HMF‐HC can result in both BHMF and MFA as shown in Pathway 1–2 and Pathway 3–1 (Figure 5). At high pH, HAT is kinetically favored over PCET, meaning only HMF‐HO will form to a considerable extent and, unlike HMF‐HC, it can only be converted to BHMF. Thus, the use of a high pH will result in a higher selectivity for BHMF when compared to the use of a low pH. These theoretical predictions correlate well with the results shown in Figure 4a.
We note that in Pathway 1–1, we drew a bond between the aldehyde O of HMF‐HC* and the surface while we did not draw a bond between the aldehyde C of HMF‐HO* and the surface. This is because the distance between the O of HMF‐HC* and the center of the closest surface Cu atom is 2.03 Å (Figure S8), which allows for the formation of a conventional covalent bond. On the other hand, the distance between the C of HMF‐HO* and the center of the closest surface Cu atom is 3.25 Å, which is too far to form a covalent bond (Figure S8). In addition, we also find that HMF‐HO* contains an unusually short C−O bond, suggesting that some residual double bond character remains even after addition of H to the aldehyde O. This unexpected bonding picture is explained via natural bond orbital (NBO) analysis [34] of gas phase HMF‐HO (Figure S9). The analysis results show that the natural bond orders between the aldehyde C and aldehyde O and between the aldehyde C and adjacent furan C in HMF‐HO* are 1.28 and 1.44, respectively, suggesting that both of them have partial double bond character. This means that the unpaired electron on the aldehyde C is highly delocalized. These factors combine to prevent a strong directional covalent bond between the C and the surface Cu atom. More information about the structure of HMF‐HO* is available in Figure S9.
Computational investigations on the pathways for MF
For MF production, hydrogenolysis of the alcohol is required. Alcohol hydrogenolysis of HMF proceeds through the Flat‐alc configuration and occurs in two steps as summarized in Pathway 2–1 (Figure 5). The first step is the addition of H to the O of the alcohol group, followed by loss of H2O and the formation of a C−Cu bond on the electrode surface. This leaves dehyHMF* as the surface intermediate. Considering only the distance between the O of the alcohol group and Hads, we would expect the addition of H to O to occur via HAT as well as PCET. However, our CI‐NEB calculations show that HAT to the O of the alcohol is kinetically infeasible, with a barrier of 0.78 eV. This means that the production of dehyHMF* will occur primarily via PCET and therefore will need acidic media. The second step in MF formation is addition of another H to the alcohol C of dehyHMF*. This C is very close to the surface (1.1 Å). Therefore, the conversion of dehyHMF* to MF can likely be completed via either HAT or PCET to this C. We note, however, that because dehyHMF* can only be converted to MF, this second step does not have an important effect on selectivity. Instead, it is how readily the first step occurs that is critical for determining how much MF will be produced. As this first step requires PCET, it will be promoted only at low pH, resulting in MF production (as well as other products that can result from the reduction of MF, such as MFA and DMF) being favored at low pH. This explains why we detect more MF, MFA, and DMF at low pH.
Computational investigations on the pathways for MFA
There are three possible pathways to form MFA (Figure 5). First, the C−O bond in HMF‐Hc can be cleaved by a concerted hydride and proton transfer (CHPT) to form MFA* and OH* (Pathway 3–1). OH* will be further reduced to H2O by HAT or PCET in a subsequent step. Here, we invoke CHPT because simple PCET or HAT to O would yield BHMF (which is inert to C−O bond cleavage) and the abundance of both Hads and protons can make CHPT favorable. CHPT has previously been postulated in other studies,[ 35 , 36 , 37 ] including those involving hydrogenolysis. We also considered PCET to the C of HMF‐HC, which would lead to the formation of MFA* and O*; however, the formation of MFA*+O* is thermodynamically very unfavorable compared to other intermediates as shown in Column (iii) in Figure 6a. Thus, PCET alone to the C of HMF‐HC was not considered a viable mechanistic step. Pathway 3–1 will contribute to MFA production only at low pH because PCET and CHPT are kinetically facilitated only at low pH. In the second pathway, MF‐HO is first formed from MF via HAT or PCET and is converted to MFA (Pathway 3–2). Finally, in a third potential pathway, MF‐HC is first formed from MF via PCET and then converted to MFA by either PCET or HAT (Pathway 3–3). Since both Pathways 3–2 and 3–3 require MF, which forms more readily at low pH (Pathway 2–1), production of MFA via Pathways 3–2 and 3–3 will also increase at low pH. In summary, MFA production via all three plausible pathways will be promoted at low pH. Experimentally, we indeed observed a higher production of MFA at low pH.
Computational investigations on the pathways for DMF
MF‐Hc produced by PCET to MF can be further converted to DMF* and OH* by CHPT (Pathway 4–1), in a process similar to that of Pathway 3–1 (Figure 5). The OH* produced in Pathway 4–1 will then be further reduced to H2O by either HAT or PCET. As both PCET and CHPT occur readily only at low pH, DMF production will also only occur to a considerable extent at low pH. This agrees well with our experimental results showing enhanced DMF production under acidic conditions.
All the reaction pathways to BHMF, MF, MFA and DMF discussed above and their pH dependencies are summarized in Figure 7. From HMF, three intermediates (HMF‐HC, HMF‐HO, and dehyHMF) can form. Energetically, HMF‐HO is the least favorable [Figure 6a, column (ii)]. However, as HMF‐HO is the only species that can form by HAT, at high pH the production of HMF‐HO and its corresponding product BHMF is dominant. At low pH where the kinetics of PCET improves, formation of the thermodynamically more stable HMF‐HC and dehyHMF becomes competitive with formation of HMF‐HO. HMF‐HC can be converted to BHMF via PCET or HAT or converted to MFA via CHPT in acidic media; however, MFA production is thermodynamically more favorable [Figure 6a, column (iii)]. Thus, the increase in HMF‐HC formation in acidic media where PCET is not kinetically limited results in increased MFA production. Similarly, the enhanced formation of dehyHMF in acidic media results in an increase in MF production because the thermodynamically very favorable conversion of dehyHMF to MF through CHPT [Figure 6a, column (iii)] is also kinetically competitive in acidic media. Also, MF is the only product that can result from dehyHMF.
Figure 7.

A diagram showing HMF reduction pathways to BHMF, MF, MFA, and DMF with intermediates. The pathways highlighted in yellow are those promoted in acidic media.
From MF, two intermediates (MF‐HC, MF‐HO) can form. Energetically, MF‐HO is less stable [Figure 6b, column (ii)] but, as MF‐HC can only form via PCET while MF‐HO can form though either HAT or PCET, at high pH where HAT dominates MF‐HO will be the predominant intermediate, resulting in MFA. At low pH, where PCET is kinetically competitive, the more thermodynamically stable MF‐HC is expected to form to a considerable extent. This MF‐HC can then be further reduced to form DMF via a CHPT step that is also kinetically enhanced in acidic media. MF‐HC can also be converted to MFA via PCET or HAT but MFA production is thermodynamically less favorable than DMF production [Figure 6b, column (iii)]. The examination of plausible reaction pathways, the pH dependence of PCET, HAT, and CHPT, and the energetic consideration of all the intermediates involved provide us with new insights into the pH dependence of the hydrogenation and hydrogenolysis reactions and therefore the pH dependence of the product selectivity. A more quantitative analysis, including the steady‐state hydrogen coverage in the presence of HMF, requires detailed microkinetic modeling, which is beyond the scope of this work.
We note that a few studies have previously investigated electrochemical hydrogenation and hydrogenolysis mechanisms of simpler aldehydes like furfural and benzaldehyde.[ 21 , 23 , 38 , 39 ] However, no studies suggested the possibility that the hydrogenation and hydrogenolysis intermediates may require different hydrogenation (HAT vs. PCET) mechanisms. Our study for the first time shows that hydrogenation and hydrogenolysis involve the formation of different intermediates via different mechanisms (HAT vs. PCET), which makes it possible to explain why low pH can promote hydrogenolysis over hydrogenation.
Conclusions
By combining experimental and computational investigations using Cu electrodes, we have demonstrated the impact pH has on the selectivity for aldehyde hydrogenation, aldehyde hydrogenolysis, and alcohol hydrogenolysis of 5‐hydroxymethylfurfural (HMF). At pH 7–9, aldehyde hydrogenation is dominant and 2,5‐bis(hydroxymethyl)furan (BHMF) is obtained as the major product. However, as pH is lowered, both aldehyde hydrogenolysis and alcohol hydrogenolysis are promoted, enhancing the production of 2,5‐dimethylfuran (DMF). We discovered that in order to convert HMF to DMF in acidic media, the formation of 5‐methylfurfural (MF) through initial alcohol hydrogenolysis of HMF is required. When BHMF and 5‐methylfurfuryl alcohol (MFA) form first, their alcohol groups cannot readily undergo further hydrogenolysis, making them terminal products with negligible reduction reactivity. The necessity of forming MF first to produce DMF in acidic media is the same as that in near neutral media. [12] This means that the enhanced DMF production in acidic media is not because lowering the pH enables new pathways to produce DMF but rather because lowering the pH promotes both the conversion of HMF to MF via alcohol hydrogenolysis and MF to DMF by aldehyde hydrogenolysis. Our computational results also suggest that the formation of key surface‐adsorbed intermediates for the conversion of HMF to MF and MF to DMF via alcohol and aldehyde hydrogenolysis requires proton coupled electron transfers (PCETs) that are kinetically feasible only when the proton concentration in solution is sufficiently high. On the other hand, the formation of key surface‐bound intermediates for the conversion of HMF to BHMF or MF to MFA via hydrogenation of aldehyde groups can occur through hydrogen atom transfer (HAT) as well as PCET. Because the Hads coverage on the electrode surface is not affected as drastically as proton concentration in solution by pH when the same potential against the reversible hydrogen electrode is applied, the hydrogenation reactions that can occur through HAT become dominant at high pH where PCET is not kinetically competitive. This study provides us with new insights into the critical mechanistic differences between hydrogenation and hydrogenolysis, which is crucial to explaining the pH‐dependent selectivities for hydrogenation and hydrogenolysis reactions of HMF and its reduction products.
Experimental Section
Materials
HMF (>99 %, AVA Biochem), MFA (>95 %, AmBeed), MF (99 %, Sigma‐Aldrich), BHMF (97 %, Apollo Scientific), DMF (99 %, Sigma‐Aldrich), cyclohexane (>99.7 %, Sigma‐Aldrich), toluene (99.8 %, Sigma‐Aldrich), Na2SO4 (ACS grade, Dot Scientific Inc.), sodium acetate (≥99.0 %, Sigma‐Aldrich), KH2PO4 (99 %, EMS), H3BO3 (≥99.5 %, Sigma‐Aldrich), KOH (≥85 %, Sigma‐Aldrich), HCl (37 %, Sigma‐Aldrich), H2SO4 (95–98 %, Sigma‐Aldrich), CuSO4 (≥98.0 %, Sigma‐Aldrich), Cu foil (99.9 %, Nimrod Copper Co.), Ni foil (99.5 %, Alfa Aesar), In foil (99.99 %, Alfa Aesar). All chemicals were used without further purification after purchase. Deionized water (Barnstead E‐pure water purification system, resistivity >18 MΩ cm) was used to prepare all solutions.
Cu foam electrodes
The Cu foam electrodes were prepared by a previously reported electrodeposition method. [24] An aqueous solution containing 0.16 m CuSO4 ⋅ H2O and 0.6 m H2SO4 was used as the electroplating solution. A two‐electrode setup composed of Cu foil as the working electrode and Cu foil as the counter electrode was used in an undivided cell. The size of the electrodes immersed in the electrolyte were 1.95 cm2 for the working electrode and around 4 cm2 for the counter electrode. The distance between the working electrode and the counter electrode was 3 cm, and the solution was magnetically stirred at 600 rpm. Prior to electrodeposition, the Cu foil substrate was immersed in 10 wt % H2SO4 solution for about 10 s to remove the surface oxide layer. Nanocrystalline Cu foam electrodes were electrodeposited galvanostatically at a current density of −2 A cm−2 for 5 s. After deposition, the electrode was rinsed with deionized water followed by drying with a N2 flow. The surface of the Cu‐foam electrodes can be oxidized in the air. Thus, prior to any electrochemical experiment, the surface oxide layer of the Cu foam electrodes was also removed by immersion in 10 wt % H2SO4 solution for about 10 s followed by a rinse with deionized water (Barnstead 18 MΩ) and drying with a N2 flow. The repetitive LSVs of the Cu foam electrodes obtained in various pH solutions used in this study (Figure S10) and their SEM images before and after the electrolysis of HMF in a pH 2 solution (Figure S11) confirmed that there is no noticeable stability issue for these electrodes for experiments conducted in this study.
Cu, Ag, In, and Ni foil electrodes
In order to examine whether the pH‐dependence of hydrogenation and hydrogenolysis of HMF obtained using a nanocrystalline Cu foam electrode is general or unique to the nanocrystalline Cu foam electrode, we performed HMF reduction at various pH conditions using metal foil electrodes of Cu, Ni Ag, and In. The lateral dimensions of the metal foil electrodes exposed to the electrolyte were 1.3 cm×1.3 cm for Cu, Ag, and Ni and 0.5 cm×1.3 cm for In. Prior to any electrochemical experiments, the surface oxide layers on these foil electrodes were removed via acid etching: Cu, Ag, and In foil electrodes were immersed in 10 wt % H2SO4 solution while Ni foil was immersed in 37 % HCl solution. This was followed by a rinse with deionized water (Barnstead 18 MΩ) and drying with a N2 flow.
Electrochemical experiments
HMF reduction experiments were performed in various pH solutions; pH 2 (0.5 m Na2SO4‐NaHSO4 buffer), pH 4.5 (0.5 m CH3COONa‐CH3COOH buffer), pH 7 (0.5 m KH2PO4‐K2HPO4 buffer), and pH 9 (0.5 m K[B(OH)4]‐H3BO3 buffer). The pH 4.5 and pH 9 solutions additionally contained 0.5 m Na2SO4 to have a comparable ionic strength and conductivity to those of pH 2 and pH 7 solutions. LSVs were performed in an undivided three‐electrode cell without stirring. The aforementioned buffer solutions with and without 20 mm HMF were used. The working electrodes were masked with Teflon tape to expose a 1 cm2 surface area. Ag/AgCl (4 m KCl) was used as the reference electrode, while Pt counter electrodes were prepared by sputter coating a 20 nm Ti adhesion layer followed by 100 nm of Pt on precleaned glass slides. All LSVs were performed by sweeping from the open‐circuit potential in the negative direction with a scan rate of 10 mV s−1. All LSVs results are shown without a correction for uncompensated resistance.
The constant potential reduction of HMF (or other starting molecules such as MF, MFA, and BHMF when necessary) was performed in an H‐type cell divided by a glass frit while stirring. The cathode compartment contained 10 mL of the buffer solution containing 20 mm HMF (or other starting molecules) while the anode compartment contained only the same amount of the buffer solution. All constant potential reductions of HMF were performed while stirring until the stoichiometric amount of charge to convert HMF to BHMF (or 2e− per starting molecule) was passed. The conversion [%], selectivity [%], and FE [%] were calculated using Equations (1)–3:
| (1) |
| (2) |
| (3) |
Product analysis
Aqueous products were detected and quantified via 1H NMR spectroscopy using a Bruker Avance III 400 MHz NMR spectroscope. NMR samples were prepared by adding 0.450 mL of the electrolysis solution and 0.050 mL of D2O with 12.5 mm of a dimethyl sulfone internal standard to an NMR tube. NMR analyses were conducted with a relaxation delay of 30 s and using a WATERGATE method with excitation sculpting to remove the background signal due to the water solvent. Product quantification was performed by comparing the product integrations in the post electrolysis solutions to those in a standard of known concentration. DMF cannot be detected in the aqueous phase because of its low water solubility and high volatility. For DMF collection, a 5 mL cyclohexane extraction layer with 1 μL of toluene as an internal standard was added to extract the DMF produced during the electrolysis. After the electrolysis, the electrolyte was kept stirring for 1 h to ensure the extraction reached equilibrium. DMF collected in the extraction layer was analyzed using a Shimadzu GCMS‐QP2010 equipped with a ZB‐5ms capillary column (30 m×0.25 mm i.d., with 0.25 μm film thickness). An injection quantity of 1 μL was used (split ratio 20 : 1), and the injector temperature was maintained at 250 °C (constant). Pure helium gas (99.999 %) was used as the carrier gas at a constant flow rate of 1.50 mL min−1. The column oven temperature was set at 40 °C for 4.5 min, raised at 20 °C per min up to 150 °C, and held at 150 °C for 1 min. DMF quantification was achieved through an internal standard method with toluene as the internal standard. Calibration curves were generated from a series of solutions of known concentration. The extraction efficiency of DMF was tested to be over 95 % using the above electrolysis setup. More details and the advantages of our DMF detection procedure are discussed below. All electrolysis results obtained in this study are summarized in Table S1.
Comparison of DMF quantification methods
As we mentioned in the Introduction section, accurate quantification of DMF is challenging but critical for investigating electrochemical reduction of HMF to DMF in aqueous media. Thus, we discuss here DMF quantification methods used in previous studies and compare them with our method used in this study.
Quantification of DMF present in an aqueous medium: DMF is volatile and has a low solubility in aqueous media. [13] Thus, quantification of DMF present only in the aqueous solution used for HMF reduction without considering the loss via evaporation may result in a considerable underestimation of the DMF yield. Surprisingly, a recent study reporting the highest FE and selectivity toward electrochemically produced DMF to date (88 % FE and 91 % selectivity) obtained their DMF yield only from the aqueous electrolyte solution using GC for quantification without any special setup to minimize the loss of DMF. [40] A careful analysis of the quantification procedure/results in the Supporting Information, however, raised several concerns related to their DMF quantification. The reference GC chromatograms of DMF and MFA used in their study showed identical retention times. However, we note that DMF and MFA have different polarities and boiling points, and therefore should have different retention times when passed through the non‐polar column (SHRIX‐5MS) employed in their study. In order to demonstrate this point, our own GC‐MS data collected with a similar non‐polar column (ZB‐5MS) in which DMF and MFA have very different retention times are shown in Figure S12. Thus, the identical retention time (8.3 min at oven temperature≈90 °C) for DMF and MFA in their study must mean at least one of these reference chromatograms is incorrect. Later, in their product analysis, only a single peak is observed at this retention time and the authors appear to have assigned it solely to DMF, leaving it unclear which peak was used for the quantification of MFA. Moreover, the characteristics of their product peak appear to match MFA more than DMF according to our own chromatograms considering the measured retention time and elution temperature for DMF (2.8 min, 40 °C) and MFA (7.6 min, 100 °C). Furthermore, even if both their calibration curves and their assignment of the ambiguous peak as DMF were correct, we note that the products yields and amount of HMF consumed in their electrolysis results table do not match with the relative peak sizes reported in their experimental GC spectra. Additionally, and more generally, the fact that a DMF selectivity approaching 100 % was reported in their study using a method that should seriously underestimate the amount of DMF produced raises a concern; their DMF selectivity would be significantly more than 100 % if the loss of DMF to the gas phase were considered, further suggesting there was an inaccurate assignment and/or quantification of the GC peaks. Based on all of the aforementioned reasons, we do not think the FE and selectivity toward DMF reported in their study [33] are credible. We recommend that the method and reference chromatograms used in this study not be used for future electrochemical DMF production studies.
Quantification of DMF in the headspace of a gas‐tight cell: Since DMF is highly volatile and only slightly soluble in aqueous media, if a gas‐tight cell is used for electrochemical HMF reduction, gas phase DMF in the headspace can be quantified using GC‐MS. [12] This method can work well if the amount of produced DMF is low compared with the available headspace to keep the partial pressure of DMF low. However, when the DMF partial pressure in the headspace increases considerably and the concentration of dissolved DMF becomes no longer negligible, quantification of only the DMF present in the headspace will underestimate the amount of DMF produced. Additionally, we note a gas‐tight cell composed of organic materials (e.g., rubber septum for sealing) where DMF can adsorb strongly can also provide a source of error that leads to underestimating the DMF produced.
Using purging gas and a cold trap: Another method that has been employed is using a gas‐tight electrolysis cell with a gas inlet and outlet to allow an inert gas such as N2 to be purged though the aqueous solution to more efficiently expel the volatile DMF. [19] The output gas first goes through a reflux condenser to condense any water and then is passed through an acetonitrile solution cooled to −15 °C to trap DMF vapor. The DMF collected in the acetonitrile solution is then analyzed using GC‐MS. Since DMF has a relatively high boiling point (b.p. 93 °C), the complete separation of DMF from the aqueous solution requires a thorough purging. Thus, the optimal purging rate and duration must be identified for complete DMF separation. The fact that the purging rate affects the pressure within the cell and that prolonged purging may increase chances to lose gas‐phase DMF through a leak if the cell is not perfectly gas‐tight also needs to be considered when achieving thorough DMF separation from the reaction solution. A careful design of the cold trap may also be necessary to effectively trap DMF vapor (e.g., sufficient contact area and time between the trap solution and gas bubbles).
Separation by an organic blanket layer: In the current study, we placed a cyclohexane layer containing a small amount of toluene as an internal standard above the aqueous electrolyte used for HMF reduction. Since DMF is highly soluble in cyclohexane, the cyclohexane layer can serve as an effective extraction layer for DMF. Due to its high hydrophilicity, HMF is not soluble in the nonpolar cyclohexane. Therefore, the addition of the cyclohexane layer does not affect the HMF concentration during electrolysis. The use of cyclohexane to extract and quantify DMF was first demonstrated by Yu et al. [41] In their study, since a flow cell is used for HMF reduction, the electrolysis cell was separated from the extraction chamber and cyclohexane was present only in the extraction chamber. The electrolyte was cycled between the electrolysis cell and extraction chamber. In the current study, however, we used a static batch‐type cell. Therefore, the cyclohexane extraction layer was added directly on top of the electrolysis solution, allowing any DMF produced in the aqueous electrolyte to immediately be extracted to the cyclohexane layer, minimizing its retention time in the aqueous media. The electrolyte was stirred during the electrolysis to facilitate convection and extraction. After the electrolysis, the aqueous solution was stirred for an additional hour to ensure a thorough extraction, after which the extraction layer was analyzed using GC‐MS. Compared to the aforementioned two methods involving volatilization of DMF, this liquid‐liquid extraction has the advantage of more rapidly reaching equilibrium when efficient convection is offered through stirring. This advantage is particularly beneficial in reducing the loss of DMF through decomposition when DMF is unstable in the aqueous electrolyte being used (i.e., acidic media). Although the use of a gas‐tight cell is recommended, our method also does not necessarily require a strictly gas‐tight cell. Because of the large solubility of DMF in cyclohexane, the DMF dissolved in cyclohexane is considerably less volatile. Furthermore, since the cyclohexane layer on top of the aqueous solution serves as a blanket layer, preventing direct contact between the aqueous solution and air, the direct escape of DMF from the aqueous solution to air is not possible. We note that cyclohexane itself can be volatile, which is why we also added a small amount of toluene as an internal standard. With this addition, even if there is some cyclohexane loss, as long as the container is sealed enough to prevent the loss from being dramatic (e.g., covering the cell with parafilm), an accurate DMF quantification can be achieved by comparing the DMF:toluene ratio in the sample to those from the calibration curve. This significantly increases the reliability and reproducibility of DMF detection.
Computational methods
The Vienna Ab initio Simulation Package (VASP),[ 42 , 43 , 44 ] interfaced with the Atomic Simulation environment (ASE), [45] was used to calculate energetics and geometries for all species. Projector augmented wave (PAW) pseudopotentials [46] were employed to describe the core electrons and the Perdew–Burke–Ernzerhof (PBE) functional [47] was used to treat exchange and correlation, in conjunction with a D3(ABC) dispersion correction. [48] Energies of surface bound species were determined on a 4×4 supercell of a 4‐layer slab with the bottom 2 layers fixed. The Brillouin zone was sampled using a 5×5×1 Γ‐centered Monkhorst–Pack mesh. [49] Solvation effects were treated using the implicit solvation model, VASPsol.[ 50 , 51 ] The cutoff energy for geometry optimization was 500 eV and was then increased to 700 eV for the VASPsol calculations. Each surface calculation employed a vacuum gap of at least 15 Å and was allowed to relax until forces converged below 0.02 eV Å−1. The climbing image nudged elastic band and the dimer methods were employed to obtain the reaction pathways and transition states for the HAT steps. For solution‐phase species, Gaussian 16 [52] with the PBE−D3(ABC) method using the aug‐cc‐pVTZ basis set [53] and the SMD continuum solvation model [54] was used.
The energetics of intermediates under the influence of an applied potential were calculated using the computational hydrogen electrode (CHE) approach. [27] Under the CHE approximate, the electrochemical potential of proton‐electron pairs ( ) are calculated via equilibrium with gas phase molecular hydrogen at the reversible potential, URHE, using Equation 4:
| (4) |
where the electrochemical potential, , includes the effect of the external electric potential on the chemical potential, , where z is the charge of the particle, e is the elementary electric charge, and U is the electrode potential.
As such, the free energy change for a representative PCET step (involving reduction of an adsorbed species A*) shown in Equation 5:
| (5) |
can be calculated using Equation 6:
| (6) |
where the associated free energies, G, are estimated from the zero‐point corrected density functional theory energies including the thermal correction and entropies estimated under the harmonic approximation.
Conflict of interest
The authors declare no conflict of interest.
1.
Supporting information
As a service to our authors and readers, this journal provides supporting information supplied by the authors. Such materials are peer reviewed and may be re‐organized for online delivery, but are not copy‐edited or typeset. Technical support issues arising from supporting information (other than missing files) should be addressed to the authors.
Supporting Information
Acknowledgements
This work was supported by the U.S. Department of Energy, Office of Science, Office of Basic Energy Sciences, Catalysis Science, under Award DE‐SC0020983.
X. Yuan, K. Lee, M. T. Bender, J. R. Schmidt, K.-S. Choi, ChemSusChem 2022, 15, e202200952.
Contributor Information
Prof. J. R. Schmidt, Email: schmidt@chem.wisc.edu.
Prof. Kyoung‐Shin Choi, Email: kschoi@chem.wisc.edu.
Data Availability Statement
The data that support the findings of this study are available from the corresponding author upon reasonable request.
References
- 1. Serrano-Ruiz J. C., West R. M., Dumesic J. A., Annu. Rev. Chem. Biomol. Eng. 2010, 1, 79–100. [DOI] [PubMed] [Google Scholar]
- 2. Alonso D. M., Bond J. Q., Dumesic J. A., Green Chem. 2010, 12, 1493–1513. [Google Scholar]
- 3. Tuck C. O., Pérez E., Horváth I. T., Sheldon R. A., Poliakoff M., Science 2012, 337, 695–699. [DOI] [PubMed] [Google Scholar]
- 4. Climent M. J., Corma A., Iborra S., Green Chem. 2014, 16, 516–547. [Google Scholar]
- 5. Van Putten R. J., Van Der Waal J. C., De Jong E., Rasrendra C. B., Heeres H. J., De Vries J. G., Chem. Rev. 2013, 113, 1499–1597. [DOI] [PubMed] [Google Scholar]
- 6. Chen S., Wojcieszak R., Dumeignil F., Marceau E., Royer S., Chem. Rev. 2018, 118, 11023–11117. [DOI] [PubMed] [Google Scholar]
- 7. Hu L., Lin L., Wu Z., Zhou S., Liu S., Renewable Sustainable Energy Rev. 2017, 74, 230–257. [Google Scholar]
- 8. Cha H. G., Choi K.-S., Nat. Chem. 2015, 7, 328–333. [DOI] [PubMed] [Google Scholar]
- 9. Shi X., Siahrostami S., Li G.-L., Zhang Y., Chakthranont P., Studt F., Jaramillo T. F., Zheng X., Nørskov J. K., Nat. Commun. 2017, 8, 701. [DOI] [PMC free article] [PubMed] [Google Scholar]
- 10. Kwon Y., Birdja Y., Spanos I., Rodriguez P., Koper M. T. M., ACS Catal. 2012, 2, 759–764. [Google Scholar]
- 11. Chadderdon X. H., Chadderdon D. J., Pfennig T., Shanks B. H., Li W., Green Chem. 2019, 21, 6210–6219. [Google Scholar]
- 12. Lee D. K., Kubota S. R., Janes A. N., Bender M. T., Woo J., Schmidt J. R., Choi K., ChemSusChem 2021, 14, 4563–4572. [DOI] [PubMed] [Google Scholar]
- 13. Kwon Y., Birdja Y. Y., Raoufmoghaddam S., Koper M. T. M., ChemSusChem 2015, 8, 1745–1751. [DOI] [PubMed] [Google Scholar]
- 14. Kwon Y., Schouten K. J. P., Van Der Waal J. C., De Jong E., Koper M. T. M., ACS Catal. 2016, 6, 6704–6717. [Google Scholar]
- 15. Kwon Y., De Jong E., Raoufmoghaddam S., Koper M. T. M., ChemSusChem 2013, 6, 1659–1667. [DOI] [PubMed] [Google Scholar]
- 16. Roylance J. J., Kim T. W., Choi K.-S., ACS Catal. 2016, 6, 1840–1847. [Google Scholar]
- 17. Moreau C., Belgacem M. N., Gandini A., Top. Catal. 2004, 27, 11–30. [Google Scholar]
- 18. Binder J. B., Raines R. T., J. Am. Chem. Soc. 2009, 131, 1979–1985. [DOI] [PubMed] [Google Scholar]
- 19. Nilges P., Schröder U., Energy Environ. Sci. 2013, 6, 2925–2931. [Google Scholar]
- 20. Sanghez de Luna G., Ho P. H., Sacco A., Hernández S., Velasco-Vélez J.-J., Ospitali F., Paglianti A., Albonetti S., Fornasari G., Benito P., ACS Appl. Mater. Interfaces 2021, 13, 23675–23688 . [DOI] [PMC free article] [PubMed] [Google Scholar]
- 21. Chadderdon X. H., Chadderdon D. J., Matthiesen J. E., Qiu Y., Carraher J. M., Tessonnier J.-P., Li W., J. Am. Chem. Soc. 2017, 139, 14120–14128. [DOI] [PubMed] [Google Scholar]
- 22. Jung S., Biddinger E. J., ACS Sustainable Chem. Eng. 2016, 4, 6500–6508. [Google Scholar]
- 23. May A. S., Watt S. M., Biddinger E. J., React. Chem. Eng. 2021, 6, 2075–2086. [Google Scholar]
- 24. Nam D. H., Taitt B. J., Choi K. S., ACS Catal. 2018, 8, 1197–1206. [Google Scholar]
- 25. Roylance J. J., Choi K. S., Green Chem. 2016, 18, 2956–2960. [Google Scholar]
- 26. Tsilomelekis G., Orella M. J., Lin Z., Cheng Z., Zheng W., Nikolakis V., Vlachos D. G., Green Chem. 2016, 18, 1983–1993. [Google Scholar]
- 27. Nørskov J. K., Rossmeisl J., Logadottir A., Lindqvist L., Kitchin J. R., Bligaard T., Jonsson H., J. Phys. Chem. B 2004, 108, 17886–17892. [Google Scholar]
- 28. Álvarez-Falcón L., Viñes F., Notario-Estévez A., Illas F., Surf. Sci. 2016, 646, 221–229. [Google Scholar]
- 29. Han Y., Lai K. C., Lii-Rosales A., Tringides M. C., Evans J. W., Thiel P. A., Surf. Sci. 2019, 685, 48–58. [Google Scholar]
- 30. Henkelman G., Uberuaga B. P., Jónsson H., J. Chem. Phys. 2000, 113, 9901–9904. [Google Scholar]
- 31. Henkelman G., Jónsson H., J. Chem. Phys. 1999, 111, 7010–7022. [Google Scholar]
- 32. Chan K., Nørskov J. K., J. Phys. Chem. Lett. 2015, 6, 2663–2668. [DOI] [PubMed] [Google Scholar]
- 33. Lamoureux P. S., Singh A. R., Chan K., ACS Catal. 2019, 9, 6194–6201. [Google Scholar]
- 34.NBO 7.0. E. D. Glendening, J. K. Badenhoop, J. E. Carpenter, J. A. Bohmann, C. M. Morales, P. Karafiloglou, C. R. Landis, F. Weinhold, Theoretical Chemistry Institute, University of Wisconsin, Madison, 2018, https://nbo7.chem.wisc.edu/.
- 35. Casey C. P., Singer S. W., Powell D. R., Hayashi R. K., Kavana M., J. Am. Chem. Soc. 2001, 123, 1090–1100. [DOI] [PubMed] [Google Scholar]
- 36. Kieboom A. P. G., De Kreuk J. F., Van Bekkum H., J. Catal. 1971, 20, 58–66. [Google Scholar]
- 37. Wilkie J., Williams I. H., J. Chem. Soc. Perkin Trans. 2 1995, 7, 1559–1567. [Google Scholar]
- 38. Lopez-Ruiz J. A., Sanyal U., Egbert J., Gutiérrez O. Y., Holladay J., ACS Sustainable Chem. Eng. 2018, 6, 16073–16085. [Google Scholar]
- 39. Li J., Kornienko N., Chem. Commun. 2021, 57, 5127–5130. [DOI] [PubMed] [Google Scholar]
- 40. Zhang Y.-R., Wang B.-X., Qin L., Li Q., Fan Y.-M., Green Chem. 2019, 21, 1108–1113. [Google Scholar]
- 41. Yu X., Wen Y., Yuan T., Li G., ChemistrySelect 2017, 2, 1237–1240. [Google Scholar]
- 42. Kresse G., Hafner J., Phys. Rev. B 1993, 47, 558–561. [DOI] [PubMed] [Google Scholar]
- 43. Kresse G., Furthmüller J., Comput. Mater. Sci. 1996, 6, 15–50. [Google Scholar]
- 44. Kresse G., Furthmüller J., Phys. Rev. B 1996, 54, 11169–11186. [DOI] [PubMed] [Google Scholar]
- 45. Bahn S. R., Jacobsen K. W., Comput. Sci. Eng. 2002, 4, 56–66. [Google Scholar]
- 46. Kresse G., Joubert D., Phys. Rev. B 1999, 59, 1758–1775. [Google Scholar]
- 47. Perdew J. P., Burke K., Ernzerhof M., Phys. Rev. Lett. 1996, 77, 3865–3868. [DOI] [PubMed] [Google Scholar]
- 48. Grimme S., Antony J., Ehrlich S., Krieg H., J. Chem. Phys. 2010, 132, 154104. [DOI] [PubMed] [Google Scholar]
- 49. Monkhorst H. J., Pack J. D., Phys. Rev. B 1976, 13, 5188–5192. [Google Scholar]
- 50. Mathew K., Sundararaman R., Letchworth-Weaver K., Arias T. A., Hennig R. G., J. Chem. Phys. 2014, 140, 84106. [DOI] [PubMed] [Google Scholar]
- 51. Mathew K., Kolluru V. S. C., Mula S., Steinmann S. N., Hennig R. G., J. Chem. Phys. 2019, 151, 234101. [DOI] [PubMed] [Google Scholar]
- 52.Gaussian 16, Revision C.01, M. J. Frisch, G. W. Trucks, H. B. Schlegel, G. E. Scuseria, M. A. Robb, J. R. Cheeseman, G. Scalmani, V. Barone, G. A. Petersson, H. Nakatsuji, X. Li, M. Caricato, A. V. Marenich, J. Bloino, B. G. Janesko, R. Gomperts, B. Mennucci, H. P. Hratchian, J. V. Ortiz, A. F. Izmaylov, J. L. Sonnenberg, D. Williams-Young, F. Ding, F. Lipparini, F. Egidi, J. Goings, B. Peng, A. Petrone, T. Henderson, D. Ranasinghe, V. G. Zakrzewski, J. Gao, N. Rega, G. Zheng, W. Liang, M. Hada, M. Ehara, K. Toyota, R. Fukuda, J. Hasegawa, M. Ishida, T. Nakajima, Y. Honda, O. Kitao, H. Nakai, T. Vreven, K. Throssell, J. A. Montgomery, Jr., J. E. Peralta, F. Ogliaro, M. J. Bearpark, J. J. Heyd, E. N. Brothers, K. N. Kudin, V. N. Staroverov, T. A. Keith, R. Kobayashi, J. Normand, K. Raghavachari, A. P. Rendell, J. C. Burant, S. S. Iyengar, J. Tomasi, M. Cossi, J. M. Millam, M. Klene, C. Adamo, R. Cammi, J. W. Ochterski, R. L. Martin, K. Morokuma, O. Farkas, J. B. Foresman, and D. J. Fox, Gaussian, Inc., Wallingford CT, 2016..
- 53. Dunning T. H. Jr, J. Chem. Phys. 1989, 90, 1007–1023. [Google Scholar]
- 54. Marenich A. V., Cramer C. J., Truhlar D. G., J. Phys. Chem. B 2009, 113, 6378–6396. [DOI] [PubMed] [Google Scholar]
Associated Data
This section collects any data citations, data availability statements, or supplementary materials included in this article.
Supplementary Materials
As a service to our authors and readers, this journal provides supporting information supplied by the authors. Such materials are peer reviewed and may be re‐organized for online delivery, but are not copy‐edited or typeset. Technical support issues arising from supporting information (other than missing files) should be addressed to the authors.
Supporting Information
Data Availability Statement
The data that support the findings of this study are available from the corresponding author upon reasonable request.