

ABSTRACT
Mutations in the mitochondrial genome (mtDNA) are ubiquitous in humans and can lead to a broad spectrum of disorders. However, due to the presence of multiple mtDNA molecules in the cell, co-existence of mutant and wild-type mtDNAs (termed heteroplasmy) can mask disease phenotype unless a threshold of mutant molecules is reached. Importantly, the mutant mtDNA level can change across lifespan as mtDNA segregates in an allele- and cell-specific fashion, potentially leading to disease. Segregation of mtDNA is mainly evident in hepatic cells, resulting in an age-dependent increase of mtDNA variants, including non-synonymous potentially deleterious mutations. Here we modeled mtDNA segregation using a well-established heteroplasmic mouse line with mtDNA of NZB/BINJ and C57BL/6N origin on a C57BL/6N nuclear background. This mouse line showed a pronounced age-dependent NZB mtDNA accumulation in the liver, thus leading to enhanced respiration capacity per mtDNA molecule. Remarkably, liver-specific atg7 (autophagy related 7) knockout abolished NZB mtDNA accumulat ion, resulting in close-to-neutral mtDNA segregation through development into adulthood. prkn (parkin RBR E3 ubiquitin protein ligase) knockout also partially prevented NZB mtDNA accumulation in the liver, but to a lesser extent. Hence, we propose that age-related liver mtDNA segregation is a consequence of macroautophagic clearance of the less-fit mtDNA. Considering that NZB/BINJ and C57BL/6N mtDNAs have a level of divergence comparable to that between human Eurasian and African mtDNAs, these findings have potential implications for humans, including the safe use of mitochondrial replacement therapy.Abbreviations: Apob: apolipoprotein B; Atg1: autophagy-related 1; Atg7: autophagy related 7; Atp5a1: ATP synthase, H+ transporting, mitochondrial F1 complex, alpha subunit 1; BL6: C57BL/6N mouse strain; BNIP3: BCL2/adenovirus E1B interacting protein 3; FCCP: carbonyl cyanide 4-(trifluoromethoxy)phenylhydrazone; GAPDH: glyceraldehyde-3-phosphate dehydrogenase; MAP1LC3A: microtubule-associated protein 1 light chain 3 alpha; MAP1LC3B: microtubule-associated protein 1 light chain 3 beta; mt-Atp8: mitochondrially encoded ATP synthase 8; MT-CO1: mitochondrially encoded cytochrome c oxidase I; MT-CO2: mitochondrially encoded cytochrome c oxidase II; mt-Co3: mitochondrially encoded cytochrome c oxidase III; mt-Cytb: mitochondrially encoded cytochrome b; mtDNA: mitochondrial DNA; MUL1: mitochondrial ubiquitin ligase activator of NFKB 1; nDNA: nuclear DNA; Ndufa9: NADH:ubiquinone oxireductase subunit A9; NDUFB8: NADH:ubiquinone oxireductase subunit B8; Nnt: nicotinamide nucleotide transhydrogenase; NZB: NZB/BINJ mouse strain; OXPHOS: oxidative phosphorylation; PINK1: PTEN induced putative kinase 1; Polg2: polymerase (DNA directed), gamma 2, accessory subunit; Ppara: peroxisome proliferator activated receptor alpha; Ppia: peptidylprolyl isomerase A; Prkn: parkin RBR E3 ubiquitin protein ligase; P10: post-natal day 10; P21: post-natal day 21; P100: post-natal day 100; qPCR: quantitative polymerase chain reaction; Rpl19: ribosomal protein L19; Rps18: ribosomal protein S18; SD: standard deviation; SEM: standard error of the mean; SDHB: succinate dehydrogenase complex, subunit B, iron sulfur (Ip); SQSTM1: sequestosome 1; Ssbp1: single-stranded DNA binding protein 1; TFAM: transcription factor A, mitochondrial; Tfb1m: transcription factor B1, mitochondrial; Tfb2m: transcription factor B2, mitochondrial; TOMM20: translocase of outer mitochondrial membrane 20; UQCRC2: ubiquinol cytochrome c reductase core protein 2; WT: wild-type.
KEYWORDS: Atg7, heteroplasmy, mitochondria, mitophagy, NZB, parkin
Introduction
A broad spectrum of mitochondrial disorders can originate from over hundreds of different point mutations or deletions of the 16.6-Kb mitochondrial genome (mtDNA) that encodes proteins required for the oxidative phosphorylation (OXPHOS) system [1,2]. Apart from causing primary mtDNA-linked diseases in humans (e.g., affecting ~1 in 5,000 people), mtDNA mutations can associate with late-onset degenerative diseases such as diabetes, Parkinson disease, Alzheimer disease, and cancers [3,4]. Mutations in mtDNA can be maternally inherited or arise from a de novo mutation during early development [1,4]. Remarkably, low level mutations in mtDNA are ubiquitous in humans, including healthy individuals [5–7]. This is explained by the presence of a high mtDNA copy number, allowing for the co-existence in the cell of mutant and wild-type molecules (termed heteroplasmy) [8]. Thus, deleterious (e.g., non-synonymous) mutations in mtDNA have no biochemical defect or clinical phenotype unless the mutation level reaches a threshold that is cell- and mutation-specific [2,4].
In the germline, heteroplasmic mtDNA variants segregate rapidly due to a genetic bottleneck, while a purifying filter limits the inheritance of high-level deleterious mutations [6,9–11]. In contrast, relaxation of selective constraints in certain somatic tissues can lead to substantial increases in the levels of heteroplasmic variants [12]. Such event occurs across lifespan and has been shown to be allele- and cell-specific [13–19]. Despite most common for mutations in the non-coding control region of mtDNA [16,20–23], mutations in coding genes can also accumulate with aging [17,24]. Remarkably, the liver preferentially accumulates non-synonymous potentially deleterious mtDNA mutations [17], which has led to the assumption that impaired mitochondrial function can somehow be advantageous to the tissue [17,25].
The rate of mtDNA segregation is a function of mtDNA copy number and turnover [26]. Thus, mutations that offer a replicative advantage (e.g., in the control region) can provide the basis for selfish mtDNA replication, even in cases of cell-specific segregation [12,23,27]. Nonetheless, what could be the underlying mechanism accounting for the preferential accumulation of other mtDNA mutations in the liver? Previously, mtDNA replication and cell proliferation have been excluded as driving forces of mtDNA segregation in the liver [19,28]. Thus, a candidate mechanism is mtDNA degradation through mitophagy, a pathway responsible for mitochondrial turnover and quality control [29]. Mitophagy is extrinsically linked with mitochondrial dynamics [30,31] and has been implicated in the clearance of deleterious mtDNA mutations and lesions [29,32–36].
Here, by conditionally impairing macroautophagy/autophagy in the liver, we addressed the hypothesis of selective mtDNA clearance drives liver mtDNA segregation. To model liver-specific mtDNA segregation, we used a well-established heteroplasmic mouse line [14,18,19,28,37–39] containing mtDNA of NZB/BINJ (NZB) and C57BL/6 N (BL6) origin on a BL6 nuclear background [40]. In agreement with previous reports [14,18,19,28,37,38], this mouse line showed a pronounced age-dependent liver mtDNA segregation, consequently leading to increased NZB mtDNA levels and enhanced respiration capacity per mtDNA molecule. Remarkably, liver-specific atg7 (autophagy related 7) knockout abolished NZB mtDNA accumulation. Although to a lesser extent, prkn (parkin RBR E3 ubiquitin protein ligase) knockout confirmed this finding, thus implicating autophagic mtDNA clearance as the driving force underpinning mtDNA segregation.
Results
Liver mtDNA segregation was disrupted following atg7 deletion
In agreement with previous reports [14,18,19,28,37], our re-analysis of published data (Figure 6 in Ref [40]) revealed a strong accumulation of NZB mtDNA in the liver of heteroplasmic mice aged four months (mean NZB shift = 27.7, mean transformed NZB shift = 1.44; NZB levels in the liver were normalized based on contemporaneous tail NZB as described previously [13,41] – for more information see Material and Methods) compared to tissues showing neutral segregation such as heart (2.7, 0.11, respectively) and brain (2.9, 0.13). To investigate a possible role for autophagy in this hepatic phenotype, we conditionally deleted atg7 by crossing heteroplasmic females [40] to Atg7-floxed [42] and Alb-Cre [43] males. Atg7, an autophagy-essential gene, is required for autophagosome formation and its hepatic deficiency results in the accumulation of abnormal organelles (e.g., mitochondria) and ubiquitinated proteins [29,42,44,45]. Thus, heteroplasmic mice with liver-specific disruption of atg7 (hereafter termed atg7−/−) were used in the following experiments, while age-matched wild-type (WT) littermates with the Alb-Cre transgene, but lacking Atg7-floxed alleles, were used as controls (Figures S1A and B). Impaired autophagy was confirmed in atg7−/− livers, in comparison with the WT control, by increased levels of MAP1LC3A (microtubule-associated protein 1 light chain 3 alpha)-I/MAP1LC3B (microtubule-associated protein 1 light chain 3 beta)-I and SQSTM1 (sequestosome 1), along with lack of MAP1LC3A/B-II formation (Figures S1C-F) [42,46–48]. Despite this autophagic block, the respiration capacity of mitochondria isolated from atg7−/− livers was found similar, or even enhanced, in comparison with those from the WT control (Figures S1G and H).
The impact of impaired autophagy on liver mtDNA segregation was determined by comparing NZB mtDNA level in the liver at post-natal day 21 (P21) against that of the tail at P10 and P21 (Figure 1A). As a result, NZB values were lower in the liver of atg7−/− mice compared to the WT control (33.3% vs. 43.8%, respectively; P = 0.01), but not in the tail either at P10 (31.4% vs. 34.8%; P = 0.41) or P21 (31.7% vs. 33.9%; P = 0.57). However, to avoid bias due to the initial NZB value, tail NZB was used as a baseline for correction of liver NZB levels (Figures 1B, 1C and S2A-D) [13,41]. Both the NZB shift (1.7% vs. 9.9%, respectively atg7−/− and WT; Figure 1B) and the transformed NZB shift (0.08 vs. 0.44; Figure 1C) confirmed our above observation, indicating that NZB mtDNA accumulation in WT livers relied on autophagy. Importantly, deficient mitochondrial degradation, as indicated by increased total mtDNA copy number (Figure 1D) and greater TOMM20 (translocase of outer mitochondrial membrane 20) levels (Figure 1E), led to increased BL6 mtDNA copy number in atg7−/− livers (Figure 1F), implicating the autophagic clearance of BL6 mtDNA in liver NZB mtDNA accumulation. Of note, mtDNA segregation in tail remained neutral both in WT and atg7−/− mice (Figures S2B and D).
Figure 1.
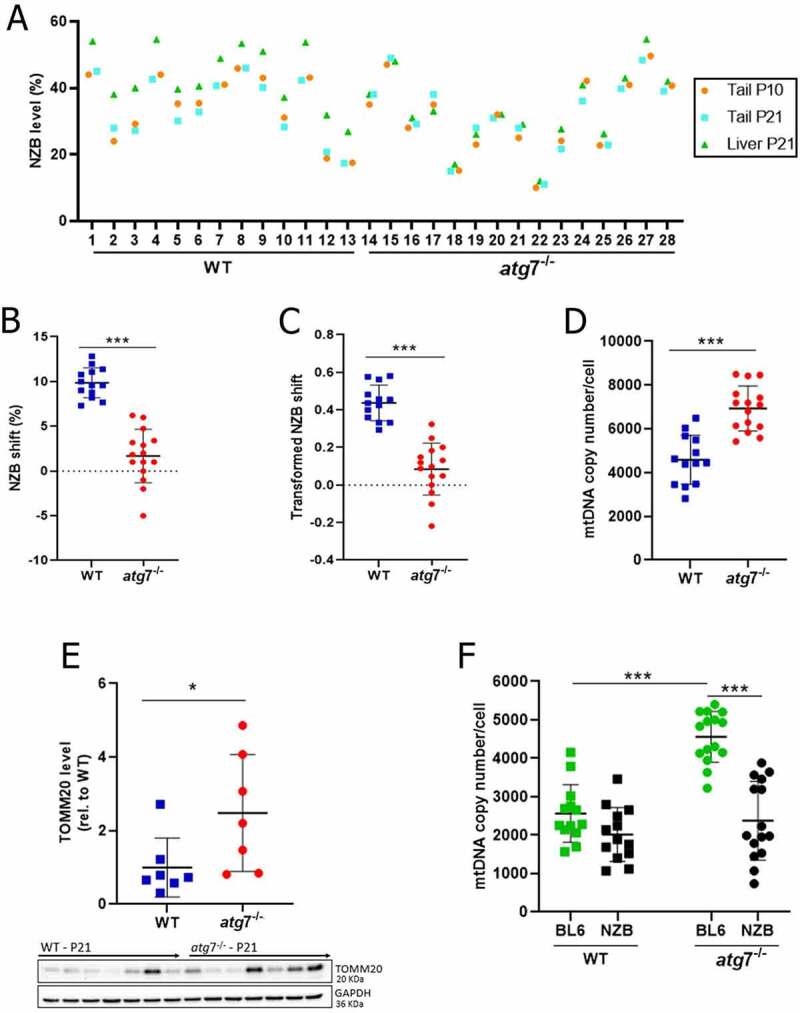
Liver mtDNA segregation relied on Atg7. (A) NZB mtDNA level in the liver (P21) and tail (P10 and P21) for WT (n = 13) and atg7−/− (n = 15). (B) Difference in NZB mtDNA level (NZB shift), within mouse, between liver (P21) and tail (P21) for WT (n = 13) and atg7−/− (n = 15). (C) Transformed NZB shift = ln(h(h0-1)/h0(h-1)). h, liver NZB level (proportion) at P21. h0 = tail NZB level (proportion) at P21 for WT (n = 13) and atg7−/− (n = 15). (D) Liver total mtDNA copy number/cell at P21 for WT (n = 13) and atg7−/− (n = 15). (E) Protein levels of TOMM20 in the liver at P21 for WT (n = 13) and Atg7−/− (n = 15), normalized by GAPDH amount. TOMM20 levels are shown in relation to the WT control. Western blotting membranes of target proteins in the liver are presented in the bottom. (F) Copies of NZB and BL6 mtDNA/cell in the liver at P21 for WT (n = 13) and atg7−/− (n = 15). Data information: In (A), dots are indicative of individual values in the liver (P21) and tail (P10 and P21) of each mouse. In (B-F), dots are indicative of individual values of each mouse, while solid horizontal lines and whiskers represent the mean ± SD. Horizontal lines above dots in (B-F) refer to statistical comparisons of the mean values, where *P < 0.05 and ***P < 0.0001. See also Figure S2.
Impaired autophagy abolished liver NZB mtDNA segregation during development into adulthood
Provided that liver mtDNA segregation is age-related [14,18,19,28,37,38], we next sought to investigate whether the above phenotype changed through development into adulthood. Based on an independent set of mice, we first confirmed that atg7 disruption in the liver did not impact NZB mtDNA level in the heart (P100) and tail (P100) in comparison with that of a tail biopsy taken at P10 (Figures 2A and S2E-J). In turn, autophagy was confirmed to be required for accumulation of NZB mtDNA in the liver (Figures 2A-C and S2E-J). Remarkably, while the transformed NZB shift increased in WT livers from 0.4 (P21) to 1.0 (P100; Figure 2D), it remained stable and close to zero during the same period in atg7−/− livers (Figure 2E). In contrast to mitochondrial accumulation at P21 (Figures 1D,E), total mtDNA copy number was lower in atg7−/− than WT livers at P100 (4,491 vs. 5,801 copies of mtDNA, respectively; Figure 2F). This result was explained by an increase in total mtDNA copy number in WT livers (Figure 2G), due to higher NZB mtDNA copy number (WT at P100, Figure 2H), while total mtDNA copy number decreased in the atg7−/− from P21 to P100 (Figure 2I). Altogether, these results provided further evidence that NZB accumulation in the liver relied on autophagy, leading to close-to-neutral mtDNA segregation through adulthood.
Figure 2.
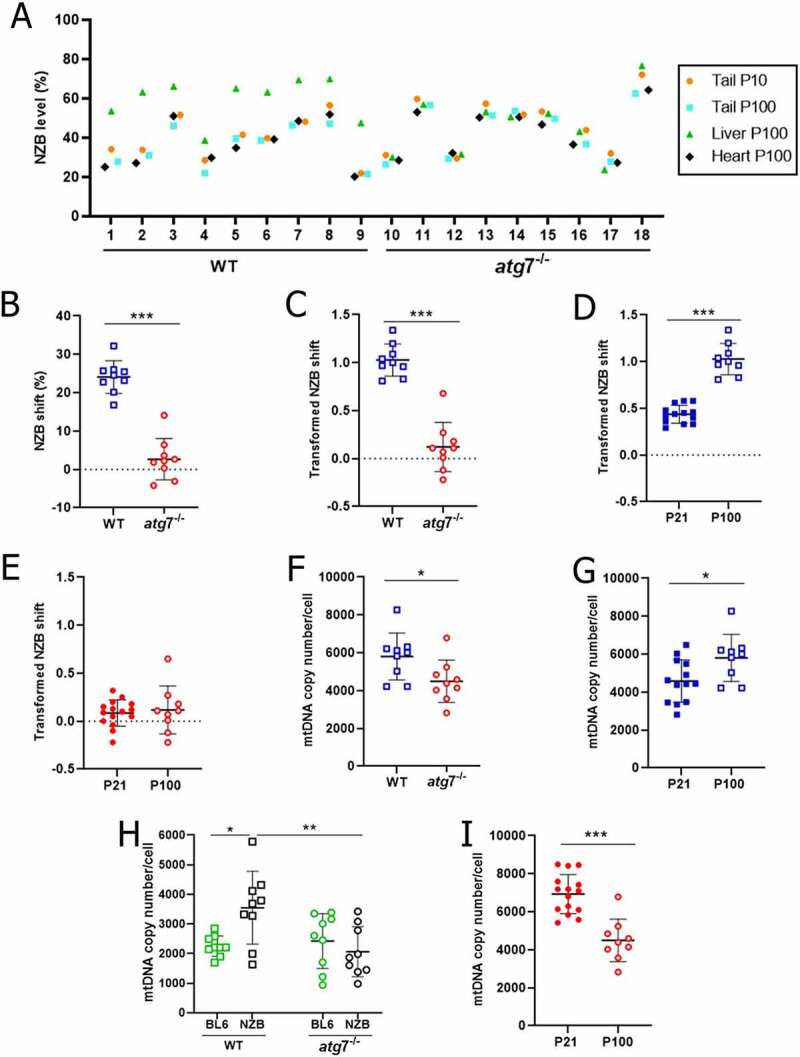
Impaired autophagy abolished liver NZB mtDNA segregation during development into adulthood. (A) NZB mtDNA level in the liver (P100), heart (P100) and tail (P10 and P100) for WT (n = 9) and atg7−/− (n = 9). (B) Difference in NZB mtDNA level (NZB shift), within mouse, between liver (P100) and tail (P100) for WT (n = 9) and atg7−/− (n = 9). (C) Transformed NZB shift = ln(h(h0-1)/h0(h-1)). h, liver NZB level (proportion) at P100. h0 = tail NZB level (proportion) at P100 for WT (n = 9) and atg7−/− (n = 9). (D-E) Transformed NZB shift in WT (D) and atg7−/− (E) livers at P21 (WT, n = 13; atg7−/−, n = 15) and P100 (WT, n = 9; atg7−/−, n = 9). P21 data correspond to Figure 1C. (F) Liver mtDNA copy number/cell at P100 for WT (n = 9) and atg7−/− (n = 9). (G) Liver total mtDNA copy number/cell in WT at P21 (n = 13) and P100 (n = 9). P21 data correspond to Figure 1D. (H) Copies of NZB and BL6 mtDNA/cell in the liver at P100 for WT (n = 9) and atg7−/− (n = 9). (I) Liver total mtDNA copy number/cell in atg7−/− (H) mice at P21 (n = 15) and P100 (n = 9); P21 data correspond to Figure 1D. Data information: in (A), dots are indicative of individual values in the liver (P100), heart (P100) and tail (P10 and P100) of each mouse. In (B-I), dots are indicative of individual values of each mouse, while solid horizontal lines and whiskers represent the mean ± SD. Horizontal lines above dots in (B-I) refer to statistical comparisons of the mean values, where *P < 0.05, **P < 0.01 and ***P < 0.0001. See also Figure S2.
Autophagy-deficient liver with close-to-neutral NZB segregation showed downregulation of mtDNA replication and transcription factors
Given the interesting observation that the number of NZB, but not BL6, mtDNA copies increased in WT livers through adulthood, we turned our attention to a possible role for mtDNA replication in NZB accumulation. Firstly, several nuclear DNA (nDNA)-encoded factors required for mtDNA replication and transcription (Ppara [peroxisome proliferator activated receptor alpha], Ssbp1 [single-stranded DNA binding protein 1], Tfb1m [transcription factor B1, mitochondrial], Tfb2m [transcription factor B2, mitochondrial] and TFAM [transcription factor A, mitochondrial]) were found to increase in WT livers from P21 to P100 (Figures 3A-F). Such factors, however, remained stable during the same period in atg7−/− livers, resulting in lower levels of Ppara, Polg2 (polymerase (DNA directed), gamma 2, accessory subunit), Ssbp1, Tfb1m, Tfb2m and TFAM at P100 when compared to the WT control (Figures 3A-F). Accordingly, nDNA (Ndufa9 [NADH:ubiquinone oxireductase subunit A9] and Atp5a1 [ATP synthase, H+ transporting, mitochondrial F1 complex, alpha subunit 1])- and mtDNA (mt-Cytb [mitochondrially encoded cytochrome b], mt-Co3 [mitochondrially encoded cytochrome c oxidase III] and mt-Atp8 [mitochondrially encoded ATP synthase 8])-encoded transcripts of OXPHOS subunits were found downregulated in atg7−/− than WT livers at P100 (Figures 3G-I and S3A-B); at the protein level, only nDNA-encoded OXPHOS subunits (NDUFB8 [NADH:ubiquinone oxireductase subunit B8], SDHB [succinate dehydrogenase complex, subunit B, iron sulfur (Ip)], UQCRC2 [ubiquinol cytochrome c reductase core protein 2] and ATP5A1) were downregulated (Figure S3C-J). Therefore, these findings indicated that autophagy arrest was followed in adult (P100), but not young (P21), mice by downregulation of mtDNA replication and transcription factors in atg7−/− livers, which might have affected NZB accumulation.
Figure 3.
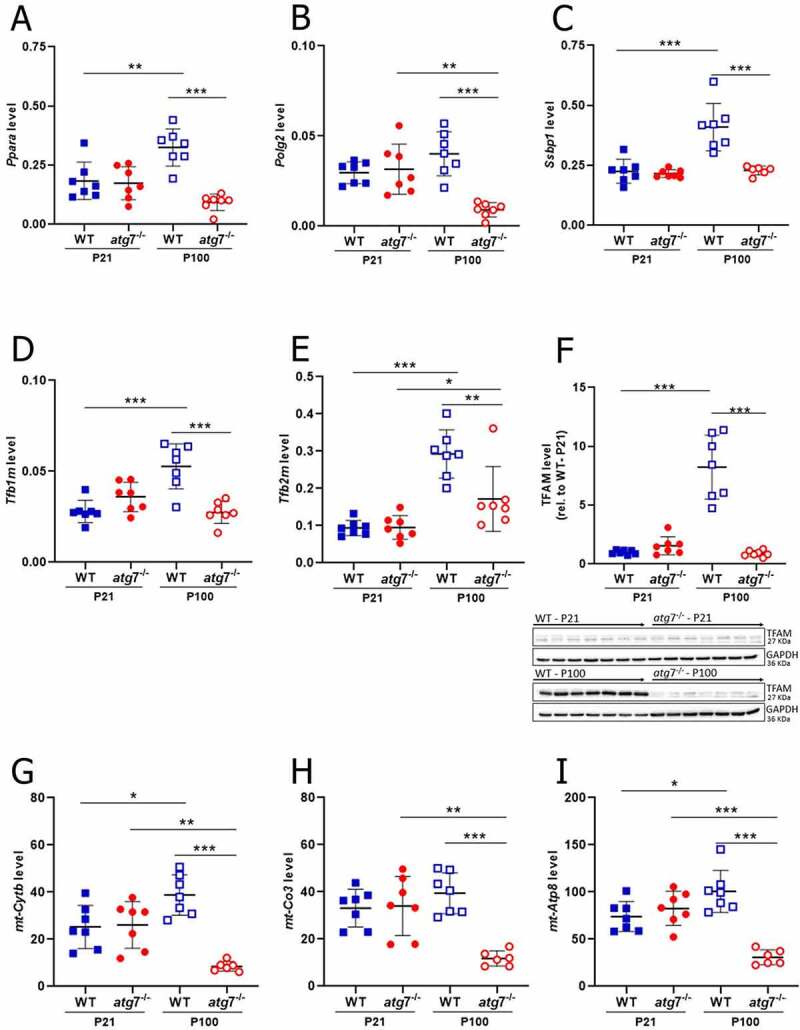
Autophagy arrest downregulated in the liver of adult mice factors required for mtDNA replication and transcription, resulting in lower mtDNA-encoded OXPHOS transcripts. (A-H) Transcript levels of Ppara (A), Polg2 (B), Ssbp1 (C), Tfb1m (D) and Tfb2m (E) in the liver at P21 (WT, n = 7; atg7−/−, n = 7) and P100 (WT, n = 7; atg7−/−, n = 7), normalized by Rps18 transcript levels. (F) Protein levels of TFAM in the liver at P21 (WT, n = 7; atg7−/−, n = 7) and P100 (WT, n = 7; atg7−/−, n = 7), normalized by GAPDH amount. TFAM levels are shown in relation to the WT control at P21. Western blotting membranes of target proteins in the liver are presented in the bottom. Transcript levels of mt-Cytb (G), mt-Co3 (H) and mt-Atp8 (I) in the liver at P21 (WT, n = 7; atg7−/−, n = 7) and P100 (WT, n = 7; atg7−/−, n = 7), normalized by the geometric mean of Rpl19 and Ppia transcript levels. Data information: Dots are indicative of individual values of each mouse, while solid horizontal lines and whiskers represent the mean ± SD. Horizontal lines above dots refer to statistical comparisons of the mean values, where *P < 0.05, **P < 0.01 and ***P < 0.0001. See also Figure S3.
NZB accumulation in the liver had a minor contribution of Prkn and associated with enhanced respiration capacity per mtDNA molecule
To gain further insight on the mechanism underpinning liver mtDNA segregation, we assessed NZB levels in heteroplasmic prkn-null mice [49] (hereafter termed prkn−/−). Prkn codes for a cytosolic E3 ubiquitin ligase that, following translocation to mitochondrial surface, acts with PINK1 (PTEN induced putative kinase 1) to recruit autophagy receptors and induce phagophore engulfment of dysfunctional mitochondria [29]. In line with a role for autophagy in mtDNA segregation, P100 livers from prkn−/− mice accumulated lower NZB levels than those from the wild-type control (referred to as Prkn+/+; Figures 4A-D). This finding suggested a contribution of Prkn in the preferential elimination of BL6 mtDNA in the liver, corroborating the poorer respiration capacity per mtDNA molecule of BL6-enriched mitochondria (Figures 4E and S4A-C).
Figure 4.
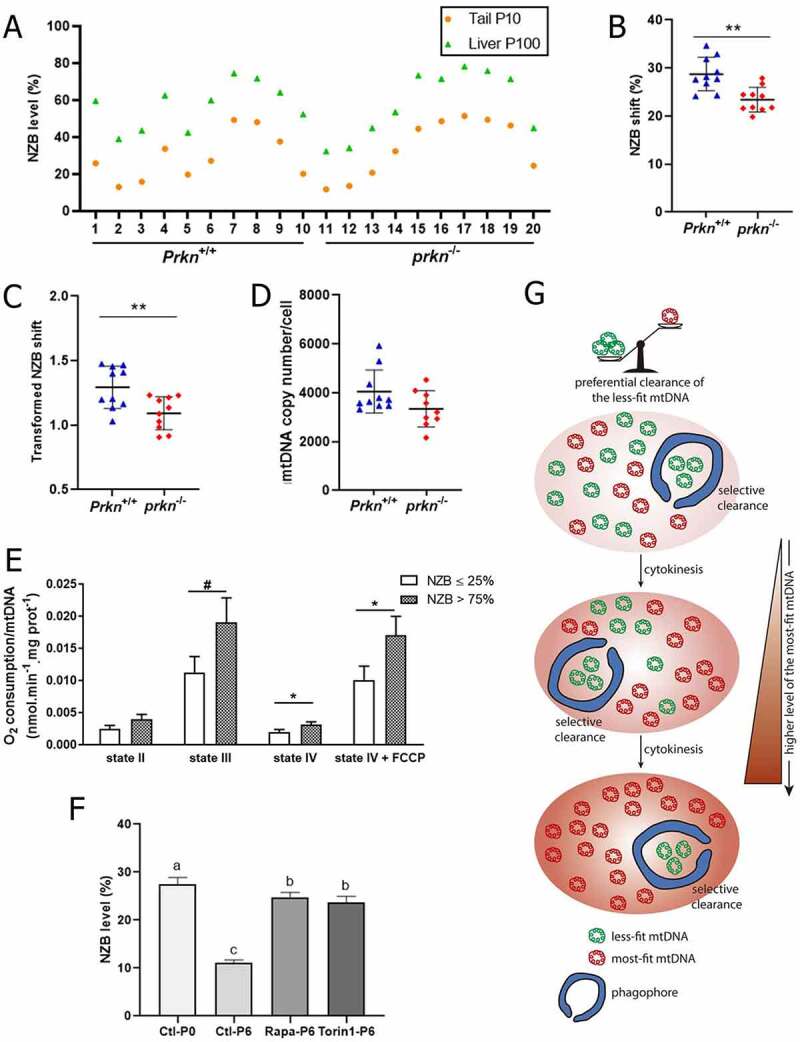
NZB accumulation in the liver had a minor contribution of Prkn and associated with enhanced respiration capacity per mtDNA molecule. (A) NZB mtDNA level in the liver (P100) and tail (P10) for Prkn+/+ (n = 10) and prkn−/− (n = 10). (B) Difference in NZB mtDNA level (NZB shift), within mouse, between liver (P100) and tail (P10) for Prkn+/+ (n = 10) and prkn−/− (n = 10). (C) Transformed NZB shift = ln(h(h0-1)/h0(h-1)). h = liver NZB level (proportion) at P100. h0 = tail NZB level (proportion) at P10 for Prkn+/+ (n = 10) and prkn−/− (n = 10). (D) Liver mtDNA copy number/cell at P100 for Prkn+/+ (n = 10) and prkn−/− (n = 10). (E) O2 consumption per mtDNA molecule assessed in liver isolated mitochondria under states II, III (ADP), IV (oligomycin) and IV + FCCP. Isolated mitochondria contained ≤ 25% (ranging from 5% to 25%; n = 6) or > 75% (ranging from 76% to 87%; n = 6) NZB mtDNA. (F) Level of NZB mtDNA assessed in cultured fibroblasts at passage 0 (P0) and 6 (P6). Fibroblasts were treated from P0 to P6 with either 1 μM rapamycin (Rapa, n = 3) or 1 μM torin 1 (n = 3); control (Ctl, n = 3). (G) Hypothetical model explaining liver mtDNA segregation. Liver mitochondrial segregation is a consequence of autophagic clearance of the less-fit mtDNA variant. As a result, this mechanism drives a rapid age-dependent accumulation of the most-fit mtDNA, potentially leading to variant fixation. Data information: In (A), dots are indicative of individual values in the liver (P100) and tail (P10) of each mouse. In (B-D), dots are indicative of individual values of each mouse, while solid horizontal lines and whiskers represent the mean ± SD. In (E-F), bars and whiskers represent the mean ± SEM. Horizontal lines above dots or bars in (B-E) refer to statistical comparisons of the mean values, where *P < 0.05, **P < 0.01 and #P = 0.0656. Different letters above bars in (F) indicate significant statistical difference (P < 0.05). See also Figure S4.
The role of autophagy in mtDNA segregation extended to cultured fibroblasts
Finally, seeking to determine whether the role of autophagy in mtDNA segregation extends to other cell types, we established an in vitro culture of heteroplasmic fibroblasts containing 27.5% NZB mtDNA. Culture of these cells for six passages led to a drop in NZB levels (Figure 4F), indicating that NZB mtDNA is purged from the mitochondrial population in fibroblasts. However, treatment with autophagy agonists rapamycin and torin 1 [50] almost completely reversed NZB elimination (Figure 4F), indicating that the role of autophagy in mtDNA segregation extended to fibroblasts.
Discussion
NZB mtDNA is a natural occurring genome differing from BL6 mtDNA by 91 single nucleotide polymorphisms, including 12 missense mutations, 4 transfer RNA mutations, 8 ribosomal RNA mutations, and 10 non-coding region mutations [51]. Although this level of divergence is comparable to that between human Eurasian and African mtDNAs, homoplasmic NZB mtDNA can be less compatible with the BL6 nuclear background under certain contexts [19,39,51,52]. Moreover, NZB mtDNA displays cell-specific segregation in heteroplasmic mice that is mostly evident in the liver and closely resembles the segregation pattern of mtDNA variants in mice and humans [13–24,28,37,38]. Curiously, NZB mtDNA accumulates in the liver of heteroplasmic mice under a BL6 nuclear background [14,18,19,28,37,38], suggesting it fits liver metabolism better than BL6 mtDNA. In agreement with this, here we provided evidence that autophagy determined age-dependent mtDNA segregation in the liver, consequently resulting in NZB-enriched mitochondria with better respiration capacity per mtDNA molecule.
The rate of mtDNA segregation in a given tissue is thought to be a function of mtDNA replication and degradation as well as cell proliferation [26]. Previous reports have excluded mtDNA replication and cell proliferation as driving forces of NZB mtDNA accumulation in the liver [19,28]. In turn, we showed that deficient autophagy abolished NZB mtDNA segregation through development into adulthood: the transformed NZB shift in the liver was >8-fold lower in atg7−/− than WT mice aged 100 days. Strikingly, NZB mtDNA segregation in atg7−/− livers (both at P21 and P100) was close to neutral. Accordingly, BL6-enriched mitochondria accumulated in the liver of atg7−/− young mice (P21), providing evidence that liver NZB mtDNA accumulation was a consequence of the preferential autophagic degradation of BL6 mtDNA. Furthermore, the treatment of heteroplasmic fibroblasts with rapamycin and torin 1 partially reversed mtDNA segregation, lending additional support to a role for autophagy in mtDNA segregation.
In keeping with the above findings, NZB accumulation was partially disrupted in the liver of prkn-null mice, pointing to a possible role for Prkn-dependent mitophagy in liver mtDNA segregation. Nonetheless, the effect of prkn deficiency was minimal compared to that of atg7 deletion, which might be due to the upregulation of compensatory pathways given the use of a constitutive prkn knockout model or the additional contribution of a Prkn-independent mechanism [29,53]. In fact, others E3 ubiquitin ligases such as MUL1 (mitochondrial ubiquitin ligase activator of NFKB 1) have been shown to act in parallel to PRKN in mitophagy [54,55]. Elimination of paternal mitochondria in early mouse embryos, for instance, requires both Prkn and Mul1 [54]. Moreover, we cannot rule out an unspecific effect of atg7 knockout, not resulting from the block in mitophagy, on mtDNA segregation [56–58].
In flies, a link between mtDNA turnover and replication has been shown to underpin mtDNA segregation in the germline [59–61], leading to lower levels of wild-type mtDNA when either Atg1 (autophagy-related 1) or BNIP3 (BCL2/adenovirus E1B interacting protein 3) are deleted in heteroplasmic cells harboring a deleterious mtDNA [59]. On contrary, deletion of atg7 here led to higher BL6 mtDNA copy number in P21 livers, arguing against a similar action of replication in liver NZB mtDNA accumulation. Moreover, although mtDNA replication and transcription factors were downregulated in the liver of adult (P100) atg7−/− mice, which might suggest a link between autophagy and mtDNA replication, we think that decreased mitochondrial biogenesis likely counterbalanced autophagy arrest. Indeed, the lack of NZB segregation was already evident in the liver of young (P21) atg7−/− mice, when factors regulating mtDNA replication and transcription were unchanged compared to the WT control. Therefore, our findings were not suggestive of a concerted action between autophagy and mtDNA replication in determining liver mtDNA segregation.
Our present findings linked autophagy with liver mtDNA segregation. This is of great importance given that mtDNA segregation can lead to drastic shifts in somatic tissue heteroplasmy, potentially resulting in mitochondrial disease [1,2,12,16,17,20–23]. Previous reports with worms, flies, mice, cybrid cells and humans have implicated mitophagy in the elimination of deleterious mtDNA mutations and lesions [29,32–36,62-64]. Likewise, Lechuga-Vieco et al. [19] have found evidence that non-random NZB/BL6 mtDNA segregation in heteroplasmic mice is an intracellular process determined by organelle selection. Taking into account that in heteroplasmic cells the most-fit mtDNA relies on the interaction of each mtDNA variant with cell-specific metabolic program [19], the mitochondrial quality control might potentially act to selectively remove the less-fit mtDNA [29,31]. Accordingly, NZB-enriched mitochondria presented a better respiration capacity per mtDNA molecule, indicating that the BL6 mtDNA did not fit well liver metabolism, consequently leading to its autophagic elimination. Although previous reports have linked NZB mtDNA with a poorer bioenergetic performance than BL6 mtDNA when in a BL6 nuclear background [19,39,51,52], this discrepancy is likely explained by the use of homoplasmic versus heteroplasmic cells. Heteroplasmy has been shown to produce adverse effects [18], negatively impacting the respiration capacity when compared with homoplasmic cells harboring either BL6 or NZB mtDNA in a BL6 nuclear background [19,39]. Hence, we propose that under heteroplasmy NZB mtDNA fits better liver metabolic program, outcompeting less-fit BL6 mtDNA that is eliminated by autophagy (Figure 4G). This mechanism had a minor contribution of Prkn and seemed to extend to other cell types, but future experiments are required to determine how BL6 mtDNAs are targeted for destruction as this may rely on mitochondrial dynamics [31,59,65,66] and involve elimination of either part or all of the organelle [29,31,67-72]267-72].
In conclusion, we provided evidence of a role for autophagy in liver mtDNA segregation, which might have implications for humans, including the safe use of mitochondrial replacement therapy [73]. Taking into account that NZB and BL6 mtDNAs are non-pathological haplotypes, it remains to be verified whether this mechanism applies to variants such as potentially deleterious mtDNA mutations that accumulate in somatic tissues during human aging [17].
Material and methods
Mouse husbandry and genotyping
All experiments were performed in compliance with the regulations and policies of the National Council for Control of Animal Experimentation (CONCEA, Brazil) and were approved by the Animal Care and Use Committee at Universidade Federal de São Carlos (UFSCar – protocol # 6923040220, 2629090919, 7788150318). Unless otherwise stated, reagents were supplied by Sigma-Aldrich.
To obtain atg7−/− (Alb-Cretg/tg:Atg7fl/fl) and WT (Alb-Cretg/tg:Atg7+/+) heteroplasmic mice, Alb-Cretg/tg males were crossed with either BL6 heteroplasmic or Atg7fl/+ females, followed by their litter crossing. Heteroplasmic Alb-Cretg/tg:Atg7fl/+ females were then crossed with Alb-Cretg/tg:Atg7fl/+ males to obtain atg7−/− and WT for use in the experiments. Alternatively, prkn−/− mice were crossed with heteroplasmic BL6 females, followed by brother-sister mating to obtain Prkn+/+ and prkn−/− heteroplasmic mice. BL6 heteroplasmic [40], Atg7-floxed (Atg7fl/fl) [42], Alb-Cre (Alb-Cretg/tg; Jackson Laboratories, 003574) [43], and prkn−/− (Jackson Laboratories, 006582) [49] mice were all described previously.
Genotyping was performed from tail biopsy at P10, as previously described [40,42,43,74]. During early crossings, a spontaneous Nnt (nicotinamide nucleotide transhydrogenase) mutation in C57BL/6J (present in Alb-Cre and prkn−/− strains) was eliminated based on genotyping [75]. P21 and P100 mice were sacrificed for liver, heart and tail sampling.
Analysis of mtDNA heteroplasmy and copy number
For genomic DNA extraction, samples were incubated overnight at 55°C in 500 μl of a solution containing 0.4 mM NaCl, 0.02 M Tris-Cl, pH 8.0, 5 mM EDTA, pH 8.0, 1% SDS and 0.4 mg/ml proteinase K (ThermoFisher Scientific, 25530049). Protein was extracted using 25:24:1 phenol:chloroform:isoamyl alcohol, followed by 24:1 chloroform:isoamyl alcohol. DNA precipitation was achieved in 100% isopropyl alcohol, followed by washing in 70% ethanol and elution in ultrapure water [40]. UV photometry was used for evaluation of DNA concentration (260 nm) and quality (260:280 nm and 260:230 nm).
NZB mtDNA level was determined by quantitative polymerase chain reaction (qPCR) based on allelic refractory mutation detection system, as previously described [40]. Briefly, NZB (5’-TGGCACTCCCGCTGTAAAAA-3’ and 5’-TTATCCACGCTTCCGTTACGTC) and BL6 (5’-CTCCGTGCTACCTAAACACCTTATC-3’ and 5’-CCTAAGAAGATTGTGAAGTAGATGATGTC-3’) mtDNAs were amplified in parallel using discriminative primers specific to each haplotype. Amplifications were performed in the 7500 Fast Real-Time PCR System (ThermoFisher Scientific, Waltham, MA, USA) using 2.5 ng DNA, 200 nM of each primer and the following cycling conditions: 95°C for 20 min followed by 40 cycles consisting of 95°C for 3 s and 62°C for 30 s. NZB level was determined as the percentage of NZB mtDNA in relation to the sum of NZB and BL6 mtDNAs. As reported previously [40], this qPCR assay is sensitive (<0.1%, detection limit of either NZB or BL6 mtDNA) and consistent (<5%, intra- and inter-run coefficient of variation) for quantification of NZB and BL6 mtDNAs.
Total mtDNA copy number per cell was determined by qPCR parallel amplification of a fragment of mtDNA (part of mt-Nd1 [mitochondrially encoded NADH dehydrogenase 1]; 5’-TCCGAGCATCTTATCCACGC-3’
and 5’-GTATGGTGGTACTCCCGCTG-3’) and of a single-copy nDNA gene (Apob [apolipoprotein B]; 5’-CACGTGGGCTCCAGCATT-3’ and 5’-TCACCAGTCATTTCTGCCTTTG-3’), based on our previous report [40].
Analysis of gene expression
Gene transcripts were determined as previously reported [76], with few modifications. In brief, liver samples were macerated in liquid nitrogen and the RNA extracted using the RNeasy Mini Kit (Qiagen, 74,104). RNA was treated with RNase-free DNase Set (Qiagen, 79,254), had its concentration estimated through UV photometry and was reversed transcribed into cDNA using the High-Capacity cDNA Reverse Transcription Kit (ThermoFisher Scientific, 4,368,814). Amplifications using the 7500 Fast Real-Time PCR System were performed as described above, with exception of the use of transcript-specific primers (Table S1). All transcripts for a specific sample were run in duplicate in the same plate. Pilot experiments were performed to setup amplification conditions and primer specificity was determined based on melt-curve analysis and electrophoresis of the qPCR product on 2% (w:v) agarose gel. Final expression values were obtained using the 2−ΔCt method [77], using Rpl19 (ribosomal protein L19), Rps18 (ribosomal protein S18) and Ppia (peptidylprolyl isomerase A) as reference genes.
Western blotting
Proteins from liver total lysate were size separated based on SDS-PAGE using polyacrylamide gels (15%). Following electrophoresis, proteins were electrotransferred to PVDF transfer membranes (Thermo Scientific, 88,518). Ponceau S staining was used to monitor gel loading and transfer yielding. Blotted membranes were blocked for 2 h at room temperature with 5% nonfat dry milk in TBST (10 mM Tris-Cl, pH 7.6, 150 mM NaCl, and 0.1% Tween 20 [Sigma-Aldrich, P9416]). Membranes were then incubated overnight at 4°C with primary antibodies against either MAP1LC3A/B (Cell Signaling Technology, 4108S), SQSTM1 (Cell Signaling Technology, 5114S), TOMM20 (Santa Cruz Biotechnology, sc-11,415), TFAM (Sigma-Aldrich, SAB1401383), MT-CO2 (ThermoFisher Scientific, A-6404), Total OXPHOS (Abcam, ab110413) or GAPDH (glyceraldehyde-3-phosphate dehydrogenase; Advanced Immunochemical, 2-RGM2). After several washes with TBST, membranes were incubated for 2 h at room temperature with peroxidase-conjugated secondary antibodies (against rabbit, mouse or goat, depending on the source of the primary antibody). Finally, membranes were revealed using enhanced chemiluminescence (Santa Cruz Biotechnology, SC2048) and the Chemidoc XRS (Bio-Rad, Hercules, CA, USA). Protein levels were determined using ImageJ (National Institute of Health, Bethesda, MD, USA), normalized by GAPDH and expressed in relation to WT at P21.
Evaluation of isolated liver mitochondria
Liver mitochondria were isolated and assessed as for O2 consumption employing the methods reported previously [78], with few modifications. In brief, liver samples were homogenized in isolation buffer containing 300 mM sucrose (Amresco, 0335), 10 mM HEPES, 2 mM EGTA, kept at 4°C and with pH 7.2. The homogenate was centrifuged at 700 x g for 5 min (4°C), followed by centrifugation of the supernatant at 10.000 x g for 10 min (4°C). The resulting pellet was then washed with isolation buffer, centrifuged again (at 9.500 x g for 10 min, 4°C) and resuspended in isolation buffer. Total protein was quantified through the Bradford method. A mitochondrial sample was taken for measuring NZB levels (see above), while the remaining was used for assessing O2 consumption.
Basal O2 consumption (State II) was determined using a high-resolution oxygraphy (Oroboros Instruments, Innsbruck, Austria) and 125 μg/ml mitochondria in isolation buffer (see above) supplemented with 2 mM succinate (Sigma-Aldrich, S3674) and 2 mM glutamate (Sigma-Aldrich, G1251). State-III O2 consumption was determined following addition of 1 mM ADP (Amresco, 0160), state IV was assessed following the addition of 1 μg/ml oligomycin (Sigma-Aldrich, O4876), and the maximal respiration (state IV + FCCP) was assessed through successive additions of 0.5 μM carbonyl cyanide 4-(trifluoromethoxy)phenylhydrazone (FCCP; Enzo Life Sciences, BML-CM120) until maximal O2 consumption. The respiratory control ratio was calculated as state III:state IV.
In vitro culture of heteroplasmic fibroblasts
Ear fibroblasts derived from heteroplasmic mice [40,79] were kept at 37°C under maximal humidity in MEM α (ThermoFisher Scientific, 12,000,022) supplemented with 5% fetal bovine serum (ThermoFisher Scientific, 12,657,029), 1x penicillin-streptomycin (ThermoFisher Scientific, 15,140,122) and 0.25 μg/ml amphotericin B (ThermoFisher Scientific, 15,290,026). The medium was replaced every third day and cells were passaged when at ~80% confluency. Treatments were performed in triplicate by culturing the cells with either 1 μM rapamycin (Sigma-Aldrich, R8781) or 1 μM torin 1 (Cayman, 10,997). As control, cells were incubated with the corresponding volume of dimethyl sulfoxide (Sigma-Aldrich, 34,943) used in the treatments (1:2,640). Cells, sampled at passage 0 and 6, were lysed through incubation for 3 h at 55°C in 5 μl of 50 mM KCl, 10 mM Tris-Cl, pH 8.3, 2 mM MgCl2, 0.1 mg/ml gelatin (Sigma-Aldrich, G2500), 0.45% (v:v) Igepal CA-630 (Sigma-Aldrich, I8896), 0.45% (v:v) Tween 20 and 125 μg/ml proteinase K [40]. Following, lysed cells were incubated at 95°C for 10 min, centrifuged at 10,000 x g for 5 min, and the supernatant diluted 1:40 with H2O prior to be used for assessing NZB mtDNA levels, as described above.
Statistical analysis
NZB shift was calculated as the difference in NZB levels between two tissues (e.g., liver vs. tail) [18]. Provided that NZB values in tail remain roughly stable into adulthood [14,18,19,37], tail NZB (measured at P10 or contemporaneously to liver biopsy) was used as a baseline to correct for differences in NZB level among mice. Heart NZB level, which is known to remain stable across aging [14,18,19,37], was assessed at P100 for comparison. In addition, we calculated the transformed NZB shift [41] as follows:
where h is the NZB value (proportion) in a given tissue (e.g., liver) and time point (e.g. P21 or P100), while h0 is the initial NZB value (proportion) estimated based on tail (e.g., P10). The transformed NZB shift allows for the comparison of mice with different initial NZB values. When h’ is positive (negative) it indicates higher (lower) values of h in relation to h0.
Statistical analysis was performed using the SAS University Edition v. 9.4 (SAS Institute Inc, Cary, NC, USA). Data were tested for assumption of normal distribution and homogeneity of variances, and transformed when required. NZB value, NZB shift, transformed NZB shift, total mtDNA copy number, and O2 consumption were compared between groups using unpaired t-test. Transcript and protein levels were compared among groups and ages by two-way ANOVA, followed by Tukey post-hoc test. Likewise, mtDNA copy number was compared considering groups and mtDNA haplotype by two-way ANOVA, followed by Tukey post-hoc test. NZB level in fibroblasts was compared among groups by ANOVA, followed by Tukey post-hoc test. Differences with probabilities (P) < 0.05 were considered significant. Data are presented as mean ± standard deviation (SD) or mean ± standard error of the mean (SEM), as indicated.
Supplementary Material
Acknowledgments
The authors are grateful to Fabrícia H. C. Sugiyama, Universidade Federal de São Carlos, for invaluable assistance with animal handling and experiments. We also thank Professor Patrick F. Chinnery, University of Cambridge, and Dr. Marcos Túlio Oliveira, Universidade Estadual Paulista “Júlio de Mesquita Filho”, for critical reading of the manuscript and comments.
Funding Statement
This work was supported by the Fundação de Amparo à Pesquisa do Estado de São Paulo [2016/07868-4]; Fundação de Amparo à Pesquisa do Estado de São Paulo [2017/05899-2]; Fundação de Amparo à Pesquisa do Estado de São Paulo [2017/04372-0]; Fundação de Amparo à Pesquisa do Estado de São Paulo [2018/20028-0]; Coordenação de Aperfeiçoamento de Pessoal de Nível Superior [Finance Code 001]; National Heart, Lung, and Blood Institute [R01 HL144509]; National Heart, Lung, and Blood Institute [R01 HL132075]; Fundação de Amparo à Pesquisa do Estado de São Paulo [2020/15412-6]; Fundação de Amparo à Pesquisa do Estado de São Paulo [2019/25049-9]; Fundação de Amparo à Pesquisa do Estado de São Paulo [2012/50231-6];Conselho Nacional de Desenvolvimento Científico e Tecnológico;
Disclosure statement
No potential conflict of interest was reported by the author(s).
Supplementary material
Supplemental data for this article can be accessed here.
References
- [1].Craven L, Alston CL, Taylor RW, et al. Recent advances in mitochondrial disease. Annu Rev Genomics Hum Genet. 2017;18(1):257–275. [DOI] [PubMed] [Google Scholar]
- [2].Stewart JB, Chinnery PF.. Extreme heterogeneity of human mitochondrial DNA from organelles to populations. Nat Rev Genet. 2020;22(2):106–118. [DOI] [PubMed] [Google Scholar]
- [3].Gorman GS, Schaefer AM, Ng Y, et al. Prevalence of nuclear and mitochondrial DNA mutations related to adult mitochondrial disease. Ann Neurol. 2015;77(5):753–759. [DOI] [PMC free article] [PubMed] [Google Scholar]
- [4].Wallace DC. Mitochondrial genetic medicine. Nat Genet. 2018;50(12):1642–1649. [DOI] [PubMed] [Google Scholar]
- [5].Payne BAI, Wilson IJ, Yu-Wai-Man P, et al. Universal heteroplasmy of human mitochondrial DNA. Hum Mol Genet. 2013;22(2):384–390. [DOI] [PMC free article] [PubMed] [Google Scholar]
- [6].Wei W, Tuna S, Keogh MJ, et al. Germline selection shapes human mitochondrial DNA diversity. Science. 2019;364(6442):eaau6520. [DOI] [PubMed] [Google Scholar]
- [7].Ye K, Lu J, Ma F, et al. Extensive pathogenicity of mitochondrial heteroplasmy in healthy human individuals. Proc Natl Acad Sci U S A. 2014;111(29):10654–10659 [DOI] [PMC free article] [PubMed] [Google Scholar]
- [8].Jiang M, Kauppila TES, Motori E, et al. Increased total mtDNA copy number cures male infertility despite unaltered mtDNA mutation load. Cell Metab. 2017;26(2):429–436.e4. [DOI] [PubMed] [Google Scholar]
- [9].Burr SP, Pezet M, Chinnery PF. Mitochondrial DNA Heteroplasmy and purifying selection in the mammalian female germ line. Dev Growth Differ. 2018;60(1):21–32. [DOI] [PMC free article] [PubMed] [Google Scholar]
- [10].Stewart JB, Freyer C, Elson JL, et al. Strong purifying selection in transmission of mammalian mitochondrial DNA. PLoS Biol. 2008;6(1):e10. [DOI] [PMC free article] [PubMed] [Google Scholar]
- [11].Freyer C, Cree LM, Mourier A, et al. Variation in germline mtDNA heteroplasmy is determined prenatally but modified during subsequent transmission. Nat Genet. 2012;44(11):1282–1285. [DOI] [PMC free article] [PubMed] [Google Scholar]
- [12].van den Ameele J, Li AYZ, Ma H, et al. Mitochondrial heteroplasmy beyond the oocyte bottleneck. Semin Cell Dev Biol. 2020;97:156–166. [DOI] [PubMed] [Google Scholar]
- [13].Burgstaller JP, Johnston IG, Jones NS, et al. MtDNA segregation in Heteroplasmic tissues is common inVivo and modulated by haplotype differences and developmental stage. Cell Rep. 2014;7(6):2031–2041. [DOI] [PMC free article] [PubMed] [Google Scholar]
- [14].Jenuth J, Peterson A, Shoubridge E. Tissue-specific selection for different mtDNA genotypes in heteroplasmic mice. Nat Genet. 1997;16(1):93–95. [DOI] [PubMed] [Google Scholar]
- [15].Liu VWS, Zhang C, Nagley P. Mutations in mitochondrial DNA accumulate differentially in three different human tissues during ageing. Nucleic Acids Res. 1998;26(5):1268–1275. [DOI] [PMC free article] [PubMed] [Google Scholar]
- [16].Williams SL, Mash DC, Züchner S, et al. Somatic mtDNA mutation spectra in the aging human putamen. PLoS Genet. 2013;9(12):e1003990. [DOI] [PMC free article] [PubMed] [Google Scholar]
- [17].Li M, Schröder R, Ni S, et al. Extensive tissue-related and allele-related mtDNA heteroplasmy suggests positive selection for somatic mutations. Proc Natl Acad Sci. 2015;112(8):2491–2496. [DOI] [PMC free article] [PubMed] [Google Scholar]
- [18].Sharpley MS, Marciniak C, Eckel-Mahan K, et al. Heteroplasmy of mouse mtDNA is genetically unstable and results in altered behavior and cognition. Cell. 2012;151(2):333–343. [DOI] [PMC free article] [PubMed] [Google Scholar]
- [19].Lechuga-Vieco AV, Latorre-Pellicer A, Johnston IG, et al. Cell identity and nucleo-mitochondrial genetic context modulate OXPHOS performance and determine somatic heteroplasmy dynamics. Sci Adv. 2020;6(31):eaba5345. [DOI] [PMC free article] [PubMed] [Google Scholar]
- [20].Wang Y, Michikawa Y, Mallidis C, et al. Muscle-specific mutations accumulate with aging in critical human mtDNA control sites for replication. Proc Natl Acad Sci U S A. 2001;98(7):4022–4027. [DOI] [PMC free article] [PubMed] [Google Scholar]
- [21].Michikawa Y, Mazzucchelli F, Bresolin N, et al. Aging-dependent large accumulation of point mutations in the human mtDNA control region for replication. Science. 1999;286(5440):774–779. [DOI] [PubMed] [Google Scholar]
- [22].Naue J, Hörer S, Sänger T, et al. Evidence for frequent and tissue-specific sequence heteroplasmy in human mitochondrial DNA. Mitochondrion. 2015;20:82–94. [DOI] [PubMed] [Google Scholar]
- [23].Samuels DC, Li C, Li B, et al. Recurrent tissue-specific mtDNA mutations are common in humans. PLoS Genet. 2013;9(11):e1003929. [DOI] [PMC free article] [PubMed] [Google Scholar]
- [24].Li M, Schönberg A, Schaefer M, et al. Detecting heteroplasmy from high-throughput sequencing of complete human mitochondrial DNA genomes. Am J Hum Genet. 2010;87(2):237–249. [DOI] [PMC free article] [PubMed] [Google Scholar]
- [25].De Grey ADNJ. A proposed refinement of the mitochondrial free radical theory of aging. BioEssays. 1997;19(2):161–166. [DOI] [PubMed] [Google Scholar]
- [26].Wallace DC, Chalkia D. Mitochondrial DNA genetics and the heteroplasmy conundrum in evolution and disease. Cold Spring Harb Perspect Biol. 2013;5(11):a021220. [DOI] [PMC free article] [PubMed] [Google Scholar]
- [27].Røyrvik EC, Johnston IG. Mtdna sequence features associated with ‘selfish genomes’ predict tissue-specific segregation and reversion. Nucleic Acids Res. 2020;48(15):8290–8301. [DOI] [PMC free article] [PubMed] [Google Scholar]
- [28].Battersby BJ, Shoubridge EA. Selection of a mtDNA sequence variant in hepatocytes of heteroplasmic mice is not due to differences in respiratory chain function or efficiency of replication. Hum Mol Genet. 2001;10(22):2469–2479. [DOI] [PubMed] [Google Scholar]
- [29].Pickles S, Vigié P, Youle RJ. Mitophagy and quality control mechanisms in mitochondrial maintenance. Curr Biol. 2018;28(4):R170–85. [DOI] [PMC free article] [PubMed] [Google Scholar]
- [30].Chan DC. Mitochondrial dynamics and its involvement in disease. Annu Rev Pathol. 2020;15(1):235–259. [DOI] [PubMed] [Google Scholar]
- [31].Twig G, Elorza A, Molina AJA, et al. Fission and selective fusion govern mitochondrial segregation and elimination by autophagy. EMBO J. 2008;27(2):433–446. [DOI] [PMC free article] [PubMed] [Google Scholar]
- [32].Dai Y, Zheng K, Clark J, et al. Rapamycin drives selection against a pathogenic heteroplasmic mitochondrial DNA mutation. Hum Mol Genet. 2014;23(3):637–647. [DOI] [PMC free article] [PubMed] [Google Scholar]
- [33].Suen D-F, Narendra DP, Tanaka A, et al. Parkin overexpression selects against a deleterious mtDNA mutation in heteroplasmic cybrid cells. Proc Natl Acade Sci U S A. 2010;107(26):11835–11840. [DOI] [PMC free article] [PubMed] [Google Scholar]
- [34].Kandul NP, Zhang T, Hay BA, et al. Selective removal of deletion-bearing mitochondrial DNA in heteroplasmic Drosophila. Nat Commun. 2016;7(1):13100. [DOI] [PMC free article] [PubMed] [Google Scholar]
- [35].Pickrell AM, Huang CH, Kennedy SR, et al. Endogenous parkin preserves dopaminergic substantia nigral neurons following mitochondrial DNA mutagenic stress. Neuron. 2015;87(2):371–381. [DOI] [PMC free article] [PubMed] [Google Scholar]
- [36].Bess AS, Crocker TL, Ryde IT, et al. Mitochondrial dynamics and autophagy aid in removal of persistent mitochondrial DNA damage in Caenorhabditis elegans. Nucleic Acids Res. 2012;40(16):7916–7931. [DOI] [PMC free article] [PubMed] [Google Scholar]
- [37].Battersby BJ, Loredo-Osti JC, Shoubridge EA. Nuclear genetic control of mitochondrial DNA segregation. Nat Genet. 2003;33(2):183–186. [DOI] [PubMed] [Google Scholar]
- [38].Jokinen R, Marttinen P, Stewart JB, et al. Tissue-specific modulation of mitochondrial DNA segregation by a defect in mitochondrial division. Hum Mol Genet. 2015;25(4):706–714. [DOI] [PubMed] [Google Scholar]
- [39].Latorre-Pellicer A, Lechuga-Vieco AV, Johnston IG, et al. Regulation of mother-to-offspring transmission of mtDNA heteroplasmy. Cell Metab. 2019;30(6):1120–1130.e5. [DOI] [PMC free article] [PubMed] [Google Scholar]
- [40].Machado TS, Macabelli CH, Sangalli JR, et al. Real-time PCR quantification of heteroplasmy in a mouse model with mitochondrial DNA of C57BL/6 and NZB/BINJ strains. Plos One. 2015;10(8):e0133650. [DOI] [PMC free article] [PubMed] [Google Scholar]
- [41].Johnston IG, Jones NS. Evolution of cell-to-cell variability in stochastic, controlled, Heteroplasmic mtDNA populations. Am J Hum Genet. 2016;99(5):1150–1162. [DOI] [PMC free article] [PubMed] [Google Scholar]
- [42].Komatsu M, Waguri S, Ueno T, et al. Impairment of starvation-induced and constitutive autophagy in Atg7-deficient mice. J Cell Biol. 2005;169(3):425–434. [DOI] [PMC free article] [PubMed] [Google Scholar]
- [43].Postic C, Shiota M, Niswender KD, et al. Dual roles for glucokinase in glucose homeostasis as determined by liver and pancreatic β cell-specific gene knock-outs using Cre recombinase. J Biol Chem. 1999;274(1):305–315. [DOI] [PubMed] [Google Scholar]
- [44].Tanida I, Tanida-Miyake E, Ueno T, et al. The human homolog of Saccharomyces cerevisiae Apg7p is a protein-activating enzyme for multiple substrates including human Apg12p, GATE-16, GABARAP, and MAP-LC3. J Biol Chem. 2001;276(3):1701–1706. [DOI] [PubMed] [Google Scholar]
- [45].Kabeya Y, Mizushima N, Yamamoto A, et al. LC3, GABARAP and GATE16 localize to autophagosomal membrane depending on form-II formation. J Cell Sci. 2004;117(Pt 13):2805–2812. [DOI] [PubMed] [Google Scholar]
- [46].Narendra DP, Kane LA, Hauser DN, et al. p62/SQSTM1 is required for Parkin-induced mitochondrial clustering but not mitophagy; VDAC1 is dispensable for both. Autophagy. 2010;6(8):1090–1106. [DOI] [PMC free article] [PubMed] [Google Scholar]
- [47].Geisler S, Holmström KM, Skujat D, et al. PINK1/Parkin-mediated mitophagy is dependent on VDAC1 and p62/SQSTM1. Nat Cell Biol. 2010;12(2):119–131. [DOI] [PubMed] [Google Scholar]
- [48].Matsumoto G, Shimogori T, Hattori N, et al. TBK1 controls autophagosomal engulfment of polyubiquitinated mitochondria through p62/SQSTM1 phosphorylation. Hum Mol Genet. 2015;24(15):4429–4442. [DOI] [PubMed] [Google Scholar]
- [49].Goldberg MS, Fleming SM, Palacino JJ, et al. Parkin-deficient mice exhibit nigrostriatal deficits but not loss of dopaminergic neurons. J Biol Chemi. 2003;278(4):43628–43635. [DOI] [PubMed] [Google Scholar]
- [50].Zhao J, Zhai B, Gygi SP, et al. MTOR inhibition activates overall protein degradation by the ubiquitin proteasome system as well as by autophagy. Proc Natl Acad Sci U S A. 2015;112(52):15790–15797. [DOI] [PMC free article] [PubMed] [Google Scholar]
- [51].Latorre-Pellicer A, Moreno-Loshuertos R, Lechuga-Vieco AV, et al. Mitochondrial and nuclear DNA matching shapes metabolism and healthy ageing. Nature. 2016;535(7613):561–565. [DOI] [PubMed] [Google Scholar]
- [52].Moreno-Loshuertos R, Acín-Pérez R, Fernández-Silva P, et al. Differences in reactive oxygen species production explain the phenotypes associated with common mouse mitochondrial DNA variants. Nat Genet. 2006;38(11):1261–1268. [DOI] [PubMed] [Google Scholar]
- [53].Rossi A, Kontarakis Z, Gerri C, et al. Genetic compensation induced by deleterious mutations but not gene knockdowns. Nature. 2015;524(7564):230–233. [DOI] [PubMed] [Google Scholar]
- [54].Rojansky R, Cha M-Y, Chan DC. Elimination of paternal mitochondria in mouse embryos occurs through autophagic degradation dependent on PARKIN and MUL1. ELife. 2016;5:e17896. [DOI] [PMC free article] [PubMed] [Google Scholar]
- [55].Yun J, Puri R, Yang H, et al. MUL1 acts in parallel to the PINK1/parkin pathway in regulating mitofusin and compensates for loss of PINK1/parkin. ELife. 2014;3:e01958. [DOI] [PMC free article] [PubMed] [Google Scholar]
- [56].Komatsu M, Kurokawa H, Waguri S, et al. The selective autophagy substrate p62 activates the stress responsive transcription factor Nrf2 through inactivation of Keap1. Nat Cell Biol. 2010;12(3):213–223. [DOI] [PubMed] [Google Scholar]
- [57].Komatsu M, Waguri S, Koike M, et al. Homeostatic levels of p62 control cytoplasmic inclusion body formation in autophagy-deficient mice. Cell. 2007;131(6):1149–1163. [DOI] [PubMed] [Google Scholar]
- [58].Matsumoto N, Ezaki J, Komatsu M, et al. Comprehensive proteomics analysis of autophagy-deficient mouse liver. Biochem Biophys Res Commun. 2008;368(3):643–649. [DOI] [PubMed] [Google Scholar]
- [59].Lieber T, Jeedigunta SP, Palozzi JM, et al. Mitochondrial fragmentation drives selective removal of deleterious mtDNA in the germline. Nature. 2019;570(7761):380–384. [DOI] [PMC free article] [PubMed] [Google Scholar]
- [60].Zhang Y, Wang ZH, Liu Y, et al. PINK1 inhibits local protein synthesis to limit transmission of deleterious mitochondrial DNA mutations. Mol Cell. 2019;73(6):1127–1137.e5. [DOI] [PMC free article] [PubMed] [Google Scholar]
- [61].Zhang Y, Chen Y, Gucek M, et al. The mitochondrial outer membrane protein MDI promotes local protein synthesis and mt DNA replication. EMBO J. 2016;35(10):1045–1057. [DOI] [PMC free article] [PubMed] [Google Scholar]
- [62].Bender A, Krishnan KJ, Morris CM, et al. High levels of mitochondrial DNA deletions in substantia nigra neurons in aging and Parkinson disease. Nat Genet. 2006;38(5):515–517. [DOI] [PubMed] [Google Scholar]
- [63].Kraytsberg Y, Kudryavtseva E, McKee AC, et al. Mitochondrial DNA deletions are abundant and cause functional impairment in aged human substantia nigra neurons. Nat Genet. 2006;38(5):518–520. [DOI] [PubMed] [Google Scholar]
- [64].Valenci I, Yonai L, Bar-Yaacov D, et al. Parkin modulates heteroplasmy of truncated mtDNA in Caenorhabditis elegans. Mitochondrion. 2015;20:64–70. [DOI] [PubMed] [Google Scholar]
- [65].Lewis SC, Uchiyama LF, Nunnari J. ER-mitochondria contacts couple mtDNA synthesis with mitochondrial division in human cells. Science. 2016;353(6296):aaf5549. [DOI] [PMC free article] [PubMed] [Google Scholar]
- [66].Kleele T, Rey T, Winter J, et al. Distinct fission signatures predict mitochondrial degradation or biogenesis. Nature. 2021;593(7859):435–439. [DOI] [PubMed] [Google Scholar]
- [67].Yang JY, Yang WY. Bit-by-bit autophagic removal of parkin-labelled mitochondria. Nat Commun. 2013;4(1):2428. [DOI] [PubMed] [Google Scholar]
- [68].Soubannier V, McLelland GL, Zunino R, et al. A vesicular transport pathway shuttles cargo from mitochondria to lysosomes. Curr Biol. 2012;22(2):135–141. [DOI] [PubMed] [Google Scholar]
- [69].Narendra D, Tanaka A, Suen D-F, et al. Parkin is recruited selectively to impaired mitochondria and promotes their autophagy. J Cell Biol. 2008;183(5):795–803. [DOI] [PMC free article] [PubMed] [Google Scholar]
- [70].McLelland GL, Soubannier V, Chen CX, et al. Parkin and PINK1 function in a vesicular trafficking pathway regulating mitochondrial quality control. EMBO J. 2014;33(4):282–295. [DOI] [PMC free article] [PubMed] [Google Scholar]
- [71].Wang W, Li J, Tan J, et al. Endonuclease G promotes autophagy by suppressing mTOR signaling and activating the DNA damage response. Nat Commun. 2021;12(1):476. [DOI] [PMC free article] [PubMed] [Google Scholar]
- [72].Zhou Q, Li H, Li H, et al. Mitochondrial endonuclease G mediates breakdown of paternal mitochondria upon fertilization. Science. 2016;353(6297):394–399. [DOI] [PMC free article] [PubMed] [Google Scholar]
- [73].Russell OM, Gorman GS, Lightowlers RN, et al. Mitochondrial diseases: hope for the future. Cell. 2020;181(1):168–188. [DOI] [PubMed] [Google Scholar]
- [74].Carvalho KF, Machado TS, Garcia BM, et al. Mitofusin 1 is required for oocyte growth and communication with follicular somatic cells. FASEB J. 2020;34(6):7644–7660. [DOI] [PubMed] [Google Scholar]
- [75].Ronchi JA, Figueira TR, Ravagnani FG, et al. A spontaneous mutation in the nicotinamide nucleotide transhydrogenase gene of C57BL/6J mice results in mitochondrial redox abnormalities. Free Radic Biol Med. 2013;63:446–456. [DOI] [PubMed] [Google Scholar]
- [76].Macabelli CH, Ferreira RM, Gimenes LU, et al. Reference gene selection for gene expression analysis of oocytes collected from dairy cattle and buffaloes during winter and summer. Plos One. 2014;9(3):e93287. [DOI] [PMC free article] [PubMed] [Google Scholar]
- [77].Livak KJ, Schmittgen TD. Analysis of relative gene expression data using real-time quantitative PCR and the 2(-delta delta C(T)) method. Methods. 2001;25(4):402–408. [DOI] [PubMed] [Google Scholar]
- [78].Garcia BM, Machado TS, Carvalho KF, et al. Mice born to females with oocyte-specific deletion of mitofusin 2 have increased weight gain and impaired glucose homeostasis. Mol Hum Reprod. 2020;26(12):938–952. [DOI] [PubMed] [Google Scholar]
- [79].Khan M, Gasser S. Generating primary fibroblast cultures from mouse ear and tail tissues. J Vis Exp. 2016;2016(107):53565. [DOI] [PMC free article] [PubMed] [Google Scholar]
Associated Data
This section collects any data citations, data availability statements, or supplementary materials included in this article.