

Abstract
To maintain a continuous and coherent percept over time, the brain makes use of past sensory information to anticipate forthcoming stimuli. We recently showed that auditory experience of the immediate past is propagated through ear‐specific reverberations, manifested as rhythmic fluctuations of decision bias at alpha frequencies. Here, we apply the same time‐resolved behavioural method to investigate how perceptual performance changes over time under conditions of stimulus expectation and to examine the effect of unexpected events on behaviour. As in our previous study, participants were required to discriminate the ear‐of‐origin of a brief monaural pure tone embedded in uncorrelated dichotic white noise. We manipulated stimulus expectation by increasing the target probability in one ear to 80%. Consistent with our earlier findings, performance did not remain constant across trials, but varied rhythmically with delay from noise onset. Specifically, decision bias showed a similar oscillation at ~9 Hz, which depended on ear congruency between successive targets. This suggests rhythmic communication of auditory perceptual history occurs early and is not readily influenced by top‐down expectations. In addition, we report a novel observation specific to infrequent, unexpected stimuli that gave rise to oscillations in accuracy at ~7.6 Hz one trial after the target occurred in the non‐anticipated ear. This new behavioural oscillation may reflect a mechanism for updating the sensory representation once a prediction error has been detected.
Keywords: alpha and theta rhythms, auditory perception, behavioural oscillations, perceptual prior, prediction error
We asked participants to discriminate the ear‐of‐origin of a brief pure tone embedded in dichotic white noise and manipulated stimulus expectation by presenting the target with unequal probability to the two ears (80% vs. 20%). Our results show that even under high stimulus expectation, auditory perceptual priors are propagated via ear‐specific reverberations, manifested as rhythmic fluctuations of decision bias at alpha frequencies (~9 Hz).

1. INTRODUCTION
When observers make perceptual judgements on a sequence of images, their decisions are typically biased towards the immediately preceding stimulus. Serial dependence, as this sequential effect is known, has been demonstrated for a variety of stimuli, including orientation (Fischer & Whitney, 2014), numerosity (Cicchini et al., 2014), facial identity (Liberman et al., 2014) and gender (Taubert et al., 2016), and even beauty (Xia et al., 2016). Similar influences of stimulus history have been shown in audition for pitch discrimination (Arzounian et al., 2017; Chambers et al., 2017; Chambers & Pressnitzer, 2014). Although these biases can introduce perceptual errors, they lead to more efficient perception in the long run (Burr & Cicchini, 2014). As the world tends to remain constant over time, it can be advantageous to assume that the current sensory environment is similar to the one encountered moments before. Serial dependence provides a fascinating window into the predictive mechanisms that the brain engages to overcome the noise and ambiguity inherent in sensory signals.
Many models of predictive perception, often termed ‘predictive coding’ (Friston, 2005; Lee & Mumford, 2003; Rao & Ballard, 1999), assume that predictions, or priors, are generated in higher cortices and fed back to early sensory areas where incoming information is matched to the expectation. However, the mechanisms by which prior sensory information is communicated are still poorly understood. We (Ho et al., 2019) recently tested the hypothesis that recursive propagation and updating of stored prior experience are related to low‐frequency neural oscillations (Arnal & Giraud, 2012; Engel et al., 2001; Friston et al., 2015). Using a novel, time‐resolved behavioural method (Landau & Fries, 2012), we showed that auditory stimulus history biased perceptual decisions rhythmically through alpha oscillations at ~9 Hz (Ho et al., 2019). Here, we combine the same behavioural technique with an oddball paradigm (Figure 1b) to investigate how sensory expectations are updated following a prediction error.
FIGURE 1.
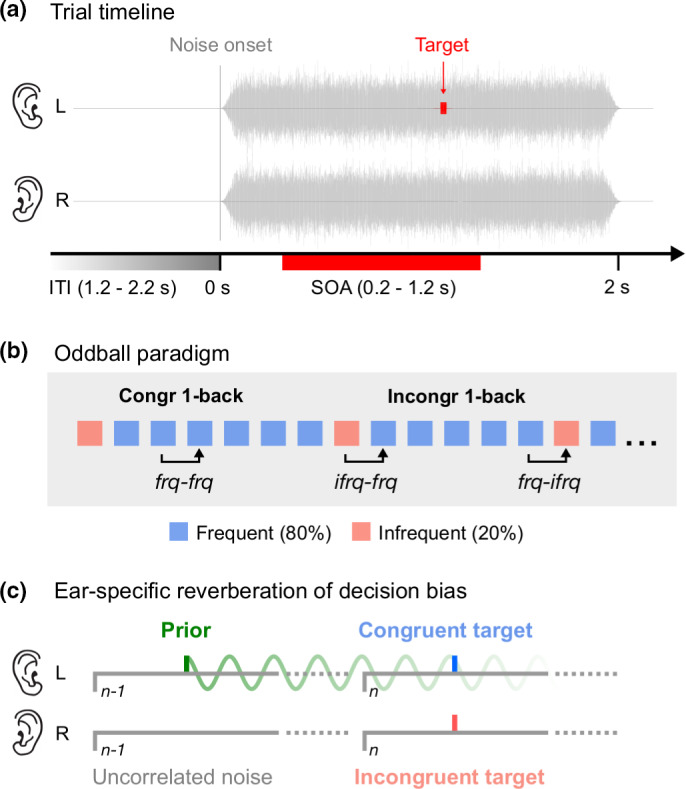
Experimental paradigm. (a) Trial timeline. Participants were required to identify the ear‐of‐origin of a brief (10 ms) monaural pure‐tone (1 kHz) target embedded in dichotic, uncorrelated white noise that lasted for 2 s. The target occurred with a variable delay from noise onset, randomly drawn from a uniform distribution of stimulus‐onset asynchronies (SOA) of 0.2–1.2 s. Each trial was followed by a silent intertrial interval (ITI) of 1.2–2.2 s. (b) Oddball paradigm. The experiment consisted of short blocks of 75 trials. We modulated attention by presenting the target to one ear for 80% of the trials within each block. The order of L80 and R80 blocks (i.e., where the target occurred in the left and right ear for 80% of trials, respectively) were completely random. Participants were not informed about the manipulation at any point of the experiment. To test whether any rhythmic modulation of response bias was contingent on the ear congruency of successive targets, we separated the trials into three subgroups (i.e., frq‐frq, ifrq‐frq, frq‐ifrq) depending on whether a frequent (frq) or infrequent target (ifrq) was presented on the previous (t‐1) and current trial (t). (c) Ear‐specific reverberation of decision bias. Oscillations of bias are observed when targets occur in the same ear (in this example, left ear) on consecutive trials (congruent, blue) but not when targets switch ears (incongruent, red). One possible explanation is that the previous target acts as a prior (green), biasing perceptual decisions on subsequent trials. Prior information is communicated rhythmically at alpha frequency
Oscillations of perceptual performance (such as reaction times and accuracy) have been demonstrated with various visual tasks (Benedetto et al., ,2016, 2018; Fiebelkorn et al., 2011, 2013; Landau & Fries, 2012; Re et al., 2019; Tomassini et al., 2015). These rhythmic fluctuations are thought to arise from an attentional sampling mechanism involving slow‐frequency brain rhythms in the theta (4–8 Hz) and alpha (8–12 Hz) frequency ranges (Fiebelkorn & Kastner, 2019; Landau, 2018; VanRullen, 2016). In an earlier study (Ho et al., 2017), we showed that auditory attention also samples information in a cyclic manner, switching between the two potential target locations (i.e., left and right ear) in a rhythmic fashion similar to vision (Fiebelkorn et al., 2013; Landau & Fries, 2012). Crucially, we used signal detection theory (Green & Swets, 1966; Macmillan & Creelman, 2005) to separate sensitivity and decision bias and found that in addition to the sensitivity oscillations at ~5–6 Hz, decision bias also oscillated but at higher frequencies, ~8–9 Hz. Furthermore, the oscillations in sensitivity exhibited an antiphase relationship between the ears while bias oscillations did not, suggesting that rhythmic fluctuations of sensitivity and decision bias over time arise from separate mechanisms.
A number of EEG studies in vision have reported modulations of decision bias by alpha rhythm (Iemi et al., 2017; Limbach & Corballis, 2016; Samaha et al., 2017) linked to stimulus expectation (Sherman et al., 2016) and perceptual choice history (Lange et al., 2013). Our finding in auditory behaviour that past perceptual information is propagated via alpha oscillations (Ho et al., 2019) is consistent with these results. Specifically, we showed that rhythmic modulations of decision bias at ~9.4 Hz were contingent on the previous target occurring in the same ear as the current one. At the same time, we observed a long‐lasting serial dependence in decision bias that was clearly linked to the oscillation. These fluctuations in bias could be related to the ‘perceptual echo’, a long‐lasting (up to 1 s) reverberatory response shown to be involved in short‐term memory processes (Chang et al., 2017; VanRullen & Macdonald, 2012). Interestingly, Lozano‐Soldevilla and VanRullen (2019) recently presented evidence that perceptual echoes are travelling waves, behaving like ‘radar beams’ that ‘scan’ areas of the brain, from posterior to frontal, in cycles of ~100 ms. The perceptual system may exploit these characteristics to exchange information across brain regions.
Several studies have tried but failed to find evidence for similar echo responses in audition (İlhan & VanRullen, 2012; Zoefel & Heil, 2013). However, these null findings do not necessarily mean that the auditory system samples sensory information differently from vision (VanRullen et al., 2014) and could instead be attributed to the general difficulty of recording alpha oscillations in audition with non‐invasive EEG (Weisz et al., 2011). In support of auditory alpha oscillations, intracranial recordings point to the existence of auditory alpha with similar properties as vision (Gomez‐Ramirez et al., 2011; Lehtelä et al., 1997; Sedley et al., 2015); and our own studies (Ho et al., ,2017, 2019) show that alpha oscillations can be readily demonstrated in audition behaviourally.
In the current study, we applied the same time‐resolved behavioural method (Ho et al., ,2017, 2019) to examine how alpha oscillations are engaged in predictive processes under high‐stimulus expectation. To keep the current experiment comparable to our previous study (Ho et al., 2019), we employed the same task, which required participants to identify the ear‐of‐origin of a brief monaural pure‐tone target masked by uncorrelated dichotic white noise. To bias listeners’ expectation (and attention) towards one ear, we used an oddball paradigm where the target occurred with 80% probability in one ear and 20% in the other. Importantly, this paradigm also allowed us to examine the effect of unexpected stimulus events on auditory perceptual performance over time.
Abrupt perceptual changes rarely occur in the real world. Nevertheless, the sensory system must be prepared to revise its predictions in the face of an error. A great amount of EEG research has been devoted to understanding the neural mechanisms underlying regularity formation and violations thereof. One electrophysiological response that is typically evoked by infrequent, unexpected auditory and visual events is the Mismatch Negativity (MMN) (Näätänen et al., ,2001, 2007). Extensive research on this event‐related potential (ERP) response suggests that the MMN is elicited by a mechanism responsible for detecting violations of perceptual regularities and updating sensory predictions (Garrido et al., 2009; Stefanics et al., 2014; Wacongne et al., 2012; Winkler, 2007; Winkler et al., 2009). More recently, a number of findings suggest that generation of the MMN depends on oscillatory activity in the theta frequency band (Choi et al., 2013; Fuentemilla et al., 2008; Garrido et al., 2008; Hsiao et al., 2009; Ko et al., 2012). Here, we explore the possibility of an oscillatory correlate of the MMN in behaviour.
2. MATERIALS AND METHODS
2.1. Participants
Seventeen healthy adults (5 male and 2 left‐handed) with normal hearing took part in the experiment. The mean age was 24 ± 7 years. All participants provided written, informed consent. The study was approved by the Human Research Ethics Committees of the University of Sydney.
2.2. Experimental procedure
Participants sat in a dark room and listened to auditory stimuli via in‐ear tube‐phones (ER‐2, Etymotic Research, Elk Grove, Illinois) with earmuffs (3 M Peltor 30 dBA) to isolate external noise. They kept their eyes open, and the computer screen was completely black throughout the testing. On each trial, 2 s of binaural broadband white‐noise (randomly generated each trial and uncorrelated between the two ears) were presented together with the monaural target tone. The noise burst served to reset potential oscillations, similar to a visual or auditory cue (Fiebelkorn et al., 2011, 2013; Landau & Fries, 2012; Re et al., 2019) and action or saccadic execution (Benedetto et al., ,2016, 2018; Benedetto & Morrone, 2017; Tomassini et al., ,2015, 2017). During the 2‐s noise burst, within 0.2–1.2 s from noise onset, the target (1,000 Hz, 10 ms) was delivered randomly with a probability of 80% to one ear and 20% to the other ear. For each ear, the target intensity was kept near individual thresholds (75% accuracy), using an accelerated stochastic approximation staircase procedure (Faes et al., 2007; García‐Pérez, 2011). Participants reported the ear‐of‐origin of the tone via button press (ResponsePixx, Vpixx Technologies, Saint‐Bruno, Quebec). The next trial started after a silent inter‐trial interval (ITI) of random duration ranging from 1.2 to 2.2 s. Participants completed 4,200 trials in total, divided into 60 blocks of 70 trials each. On half of the blocks, the target occurred with 80% probability in the left ear (henceforth, L80) and for the remainder of the blocks, 80% in the right ear (R80). Participants were not informed about the experimental manipulation at any stage of the experiment. They completed a practice block of 20 trials with feedback at the start of the experiment, but no feedback was given during the actual testing. Stimuli were presented using the software PsychToolbox (Brainard, 1997) in conjunction with DataPixx (Vpixx Technologies) in MATLAB (Mathworks, Natick, Massachusetts). Trials were excluded if the response occurred before the target onset or after the noise offset, or if the reaction time (RT) exceeded the 99% confidence interval of that individuals’ RT distribution (fitted with a gamma function).
2.3. General linear model (GLM)
To examine the individual data for oscillations and evaluate their coherence across subjects, we used an approach based on single trials (Benedetto et al., 2018; Tomassini et al., 2017). We have applied the same method in our previous study (Ho et al., 2019). The response y i (i = 1, 2… n, where n is the total number of trials) to a target at time t i (i.e., the interval from noise onset to target onset in seconds) is modelled by the linear combination of harmonics at each tested frequency (f) as follows:
| (1) |
where Ŷn represents the predicted responses, Sn is the stimulus, which takes the value –1 or + 1 for left and right target, respectively, and β0, β1, β2 and β3 are fixed‐effect regression parameters, estimated using the linear least‐squares method of MATLAB (fitlm function from the Statistics and Machine Learning toolbox). The fit was performed for each frequency f in the range from 4 to 20 Hz with 0.1 Hz steps. Each trial's accuracy and response were coded as follows: y i = 1 for correct and y i = −1 for incorrect responses, and for response bias, y i = 1 for a ‘right’ response and −1 for ‘left’. As non‐linear transformation of Ŷn made no difference in our study (for further discussion, see Knoblauch & Maloney, 2008), we did not model our binary responses with a logit or probit link function. With linear transformation and without the Sn regressor, the method is mathematically equivalent to fitting the discrete binary data with a sinewave function. Hence, it provides a good approximation of the Fourier spectra of the time series.
2.4. Statistical methods
The significance of the model fit in Equation (1) was evaluated using a two‐dimensional (2D) permutation test: we shuffled the SOAs of each individual's trials to create 1,000 surrogate datasets per subject and fitted each dataset with the same model described in Equation (1). As with the original data, the resulting β 1 and β 2 were averaged across subjects for every frequency tested. This yielded a joined distribution of 1,000 surrogate means for each frequency from 4 to 12 Hz in 0.1‐Hz steps. To correct for multiple comparisons, we determined the maximal vector across all tested frequencies for every permutation. This resulted in a joint distribution of 1,000 maximal vectors, against which we compared the original group mean.
In cases where we wanted to test a specific frequency post‐hoc, we applied the one‐sample and paired‐samples Hotelling's T2 test which are multivariate equivalents of the one‐sample and paired‐samples t‐tests (Benedetto et al., 2018; Tomassini et al., 2017):
| (2) |
where n denotes the sample size, and . is the inverse of the covariance matrix. In the one‐sample test, the sample mean, and in the paired‐samples test is the mean sample difference. For small samples (i.e., n < 50), Hotelling's T2 is transformed as follows:
| (3) |
with p and n‐p degrees of freedom (Hotelling, 1951).
The error in amplitude and phase across participants was estimated by computing the average 2D scatter of the individual data points using:
| (4) |
where N is the number of individual vectors. We obtained the amplitude SEM by projecting the SD values along the average vector ( ) and divided them by the . A similar procedure was applied to calculate the phase SEM using propagation of errors.
3. RESULTS
3.1. Rhythmic modulations of response bias but not of accuracy
Participants identified the ear‐of‐origin of a brief monaural target embedded within dichotic white noise (Figure 1a). To bias expectation towards one target location, we presented the target with 80% probability to one ear and 20% to the other (Figure 1b). First, we verified that our manipulation of target probability shifted expectation towards the more probable target location. Using signal detection theory (Green & Swets, 1966; Macmillan & Creelman, 2005), we determined the sensitivity and decision bias (measured by d‐prime, d’, and the decision criterion, c, respectively) for each participant in each probability condition, L80 (target occurred with 80% in the left and 20% in the right ear) and R80 (target in right ear on 80% of the trials and on 20% in left ear). On average, decision criteria showed clear shifts towards the more probably locations, c = 0.035 in L80 and c = −0.32 in R80 (see also Figure 3a and 3b). A paired‐sample t‐test confirmed that the difference between L80 and R80 was significant, t(16) = 2.37, p =.031. No such difference was observed in sensitivity, d’ = 1.22 in L80 and d’ = 1.23 in R80, t(16) = −0.35, p =.73.
FIGURE 3.
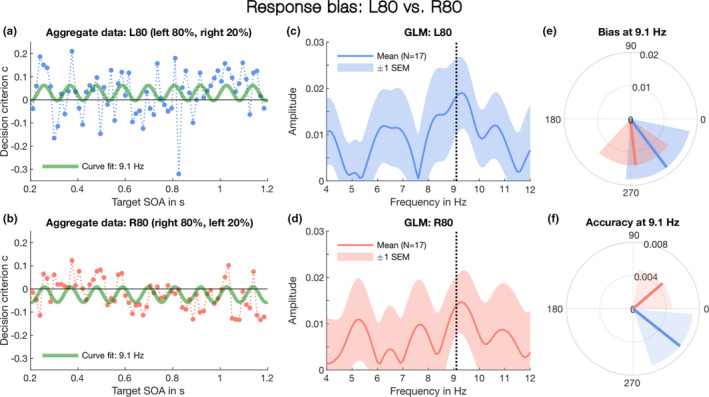
Response bias separated for L80 and R80. As in Figure 2, this analysis includes all trials on which a frequent or infrequent target was presented. (a) Time course of decision criterion in the L80 condition: responses were pooled over all participants (N = 17), sorted according to target SOA from noise onset, and grouped into non‐overlapping 15‐ms bins. A sine curve with fixed frequency, 9.1 Hz (see Figure 2c and 2d), but free constant (i.e., DC offset), amplitude and phase angle was fitted to the criterion data to reveal the linear shift towards the more likely target location (here the left ear). (b) As in (a) for the R80 condition. (c) Amplitude spectrum for the L80 condition: The blue line represents the mean vector length across subjects at each tested frequency. The shaded area around the blue line reflects the dispersion of individual vectors measured in ±1 SEM. The dotted line indicates 9.1 Hz, the peak frequency identified in Figure 2c. (d) Amplitude spectrum for the Right‐80 condition. As in (a), the shaded area surrounding the red line represents ±1 SEM, and the dotted line indicates the peak frequency, 9.1 Hz. (e) The vector means for at 9.1 Hz in the L80 (blue line) and R80 conditions (red line) for response bias. The shaded areas in blue and red indicate ±1 SEM and clearly overlap. (f) The vector means for accuracy at 9.1 Hz. As in (c), the red and blue lines represent the L80 and R80 conditions. Note, in contrast to bias, the shaded areas representing ±1 SEM do not overlap
Next, we tested for rhythmic modulations of response bias and accuracy by low‐frequency oscillations within the theta (~4–8 Hz) or alpha range (~8–12 Hz) using all trials (trials on which a frequent or infrequent target was presented, irrespective of whether the target appeared more frequently in the left or right ear). For this analysis, we used the same general linear model (GLM) as in our previous studies (Benedetto et al., 2018; Ho et al., 2019; Tomassini et al., 2017), as this method yields equivalent results to the curve‐fitting method that can also be applied to test for rhythmic fluctuations in behavioural data (Benedetto et al., 2016; Ho et al., 2017). The advantage of the GLM method is that it does not require grouping of individual responses into arbitrarily defined time bins but fits a linear model (Equation 2 in Methods) to the individual responses to estimate the sine and cosine parameters for each participant and tested frequency (see Methods for more details). The results of the GLM are shown in Figure 2.
FIGURE 2.

GLM results for response bias and accuracy. (a) Amplitude spectrum of accuracy: The amplitudes were computed with the beta coefficients obtained from the GLM which was fitted to the responses collapsed across the two target‐probability conditions, L80 and R80. This analysis includes all trials on which a frequent or infrequent target was presented. The orange line shows the mean vector length of the individual subject vectors (N = 17) at every frequency from 4 to 12 in 0.1‐Hz steps. The orange‐shaded area around the line indicates the dispersion of the individual subject vectors for the same frequencies and shows ±1 standard error of the mean (SEM). (b) Results of 2D permutation test for accuracy: The orange solid line shows the p‐values yielded by the 2D permutation test, corrected for multiple comparisons (see Methods). The uncorrected p‐values are shown by the orange dotted line. The red line indicates α = 0.05. No frequency survived the strict multiple comparison correction we applied. (c) Amplitude spectrum of response bias: As in (a), we collapsed responses across the L80 and R80 conditions. The green line shows the mean vector length of the individual response bias vectors with the shaded area around indicating the vectors’ dispersion in ±1 SEM. There is a one clear peak in the amplitude spectrum around 9.1 Hz. (d) Results of the 2D permutation test for response bias. Only the frequencies around 9.1 Hz remain significant after the correction. (e) Response bias vectors at 9.1 Hz for individual subjects. (f) Illustration of the 2D permutation test, corrected for multiple comparisons. Each green dot represents the maximal mean vector across all tested frequencies (frequency changes for the individual dots), obtained by permuting the individual response data. The red dot indicates the maximal mean vector of the original group data at 9.1 Hz. The p‐value reflects the proportion of permuted vectors equal or exceeding the original mean vector (i.e., all the green dots that fall outside the red circle)
The amplitude spectra for accuracy and response bias in Figure 2a and 2c were obtained by computing the vector mean (orange and green lines) of the individual subject vectors (plotted in Figure 2e for response bias at 9.1 Hz) for each tested frequency (4–12 Hz in 0.1‐Hz steps). The shaded areas around the lines indicate ±1 SEM. The bias spectrum in Figure 2c shows a clear peak around 9.1 Hz with an amplitude of A = 0.015 ± 0.006. Using a permutation test (see Figure 2f), shuffling the individual response 1,000 times and fitting the same linear model to the surrogate data, we confirmed that the peak at 9.1 Hz was statistically significant, p =.031. As shown in Figure 2d, at no other frequency did the p‐values corrected for multiple comparisons (green solid line) approach significance (red line). Figure 2f illustrates how we computed the corrected p‐values. Each green dot represents the maximal mean vector across all tested frequencies determined after each shuffling. The red dot represents the maximal mean vector length of the original individual data (i.e., the mean vector at 9.1 Hz) computed by averaging the individual subject vectors shown in Figure 2e. The p‐value reflects the proportion of maximal permutation vectors that exceeds the original data. In practice, this means all the green dots that fall outside the red circle in Figure 2f. Note in Figure 2e how coherently the individual subjects cluster around a mean‐phase angle of φ = 294° ± 9° SEM. Using the one‐sample Hotelling T2 test (a multivariate equivalent of the one‐sample t‐test that takes subject variance into account), we confirmed that the group mean vector at 9.1 Hz was significantly larger, T2 = 16.62, F2, 15 = 7.79, p =.005 (uncorrected).
The amplitude spectrum for accuracy is shown in Figure 2a. In contrast to response bias (Figure 2c), there are several large peaks in the accuracy spectrum. However, none of the peaks survived the significance test with multiple comparison correction, as shown in Figure 2b by the orange solid line corresponding to the corrected p‐values. The absence of a significant oscillation frequency for accuracy is consistent with our previous study (Ho et al., 2019), and it is possibly due to the antiphase relationship between the left‐ and right‐ear sensitivity observed in our earlier study (Ho et al., 2017). We tested whether the accuracy data in the L80 and R80 conditions have different phases in a post‐hoc analysis reported below (Figure 3d).
3.2. Similar alpha oscillations of bias whether attention sustained at left or right ear
Having shown that response bias fluctuates at alpha rhythm (Figure 2c and 2d), we verified post‐hoc that this 9.1‐Hz oscillation was present in both target‐probability conditions, i.e., L80 and R80. To do so, we separated the responses according to the two conditions and applied the same GLM method to each dataset, testing specifically the peak frequency, 9.1 Hz (Figure 2c–2f). As in the previous analysis, we included all trials on which a frequent or infrequent target was presented. Figure 3c shows the amplitude spectrum for response bias in the L80 condition. The amplitude reaches maximum at 9.3 Hz. At 9.1 Hz, the amplitude measures 0.018 ± 0.008, with a mean phase of φ = 306° ± 10°. In the R80 condition (Figure 3d), the amplitude peaks also at 9.3 Hz. At 9.1 Hz, A = 0.014 ± 0.006 and φ = 276° ± 11° SEM. Using the paired‐sample Hotelling T2 test, a multivariate equivalent of the univariate t‐test, we verified that the amplitude of the response bias oscillation in the L80 and R80 conditions was not significantly different at 9.1 Hz, T2 = 3.30, F2, 31 = 1.23, p =.32 (Figure 3e). In addition, we applied the one‐sample Hotelling T2 test and confirmed that the response bias amplitude in both the L80 and R80 was significantly different from zero at 9.1 Hz, T2 = 10.95, F2,15 = 5.13, p =.02 and T2 = 11.08, F2, 15 = 5.19, p =.019, respectively. Taken together, the results suggest that bias fluctuated at the same alpha frequency and phase, irrespective of whether the target occurred more often in the left (L80) or right ear (R80). However, the unequal target probability did have an overall effect on the 9‐Hz oscillations in both L80 and R80 condition: the fluctuations in decision bias (measured by the decision criterion, Green & Swets, 1966; Macmillan & Creelman, 2005) shifted linearly towards the more probable ear. This was revealed by grouping the response data (pooled across all participants) into non‐overlapping 15‐ms bins and fitting a 9.1‐Hz sine curve with free amplitude, phase angle and constant (i.e., DC offset or mean amplitude displacement from zero) to the bias temporal profile (Figure 3a and 3b).
For comparison, we also examined the individual accuracy vectors in the L80 and R80 vectors at 9.1 Hz and found that the vectors in the two conditions pulled away from each other, with L80 showing a mean‐phase angle of 322° ± 8° and R80 showing a mean‐phase angle of 40° ± 10° (Figure 3d). Again, using the paired‐sample Hotelling T2 test, we tested the difference between the L80 and R80 accuracy at 9.1 Hz. The result approached significance with T2 = 7.66, F2, 31 = 3.59, p =.053. No significant oscillation of accuracy in either the L80 or R80 condition was observed outside the 9–10 Hz frequency range.
3.3. Rhythmic fluctuation of bias is contingent on the previous stimulus
Our previous study (Ho et al., 2019) showed that rhythmic fluctuations in response bias were contingent on the target of the previous trial occurring in the same ear as the current target (illustrated in Figure 1c). To test whether the oscillation of bias observed in the present study was similarly contingent on ear congruency between successive targets, we ran a one‐back analysis on the response data. As illustrated in Figure 1b, we divided the trials into three subsets, depending on whether the stimulus on the current trial (t) and previous trial (t‐1) was a frequent (frq) or infrequent target (ifrq). Because infrequent targets very rarely occurred successively, we did not analyse those trials but focused on the remaining three conditions: (a) frequent preceding frequent (frq‐frq), (b) infrequent preceding frequent (ifrq‐frq) and (c) frequent preceding infrequent (frq‐ifrq). We expected that response bias should oscillate at around 9 Hz in the frq‐frq data where the trials contained congruent targets but not in the frq‐ifrq data where the targets switched ears on consecutive trials. Because further findings from our previous (Ho et al., 2019) work suggested that reverberations of response bias last at least two trials, we anticipated a 9‐Hz oscillation in the ifrq‐frq data, as these trials are most likely preceded by a frequent target two trials back.
Figure 4a and 4c show the response bias amplitude spectra for frq‐frq and ifrq‐frq trials. Both spectra contain a clear peak near 9 Hz. For the frq‐frq data (Figure 4a), the amplitude is maximal at around 9.4 Hz, A = 0.015 ± 0.007 SEM, and for the ifrq‐frq data around 8.8 Hz, A = 0.03 ± 0.017 SEM. We show the whole spectrum (i.e., 4–12 Hz) for completeness; however, our hypothesis that oscillations of response bias depend on ear congruency was specific to frequencies near 9 Hz. Figure 4g summarises the statistical results obtained by the same 2D permutation test as in Figure 2b and 2d (dotted lines, not corrected for multiple comparisons). The red line indicates α = 0.05. There is one significant frequency common to both 1‐back conditions, frq‐frq (dark‐green solid line) and ifrq‐frq (green dotted line), and that is 9.2 Hz, p = .041 and p = .044, respectively. The individual vectors for frq‐frq and ifrq‐frq at 9.2 Hz are plotted in Figure 4b and 4d. Although, the vector dispersions in the frq‐frq and ifrq‐frq conditions are greater than in Figure 2e, the vectors cluster around a mean phase close to that in Figure 2e, with frq‐frq showing a mean direction of 264° ± 11° and ifrq‐frq 283° ± 13°. The one‐sample Hotelling T2 test confirmed the significant oscillation at 9.2 Hz on frq‐frq trials, T2 = 10.58, F2, 15 = 4.96, p =.022 but not on ifrq‐frq trials, T2 = 4.23, F2, 15 = 1.98, p =.172.
FIGURE 4.

One‐back analysis of response bias. (a) Amplitude spectrum of response bias for trials where frequent targets occur on consecutive trials: The dark‐green line shows the mean vector length across individual subjects at the tested frequencies and the shaded area indicates ±1 SEM (N = 17). Although in this analysis we are only interested in the frequencies around 9 Hz, we show the whole spectrum, i.e., 4–12 Hz, for completeness. The mean number of trials in the frq‐frq condition was 1,141 ± 78. (b) Vectors for individual subjects at 9.2 Hz, colour coded as in Figure 2e. (c) Amplitude spectrum for trials where a frequent target is preceded by an infrequent target. As in (a), the green line represents the mean vector length and the shaded area around ±1 SEM. The mean number of trials in the ifrq‐frq condition was 376 ± 25. (d) The individual vectors at 9.2 Hz, colour coded as in (B). (e‐f) Amplitude spectrum and individual vectors at 9.2 Hz for trials where an infrequent target are preceded by a frequent target. The mean number of trials in the frq‐ifrq condition was 378 ± 26. (g) P‐values yielded by the 2D permutation test, not corrected for multiple comparisons. Again, the whole spectrum is shown for completeness, however, our one‐back analysis focused specifically on the frequencies near the peak frequency, 9.1 Hz in Figure 2c
Finally, Figure 4e and 4f show the amplitude spectrum and individual vectors at 9.2 Hz for the frq‐ifrq condition. Supporting our hypothesis, there was no significant oscillation in the frq‐ifrq data (light‐green dashed line in Figure 4g). The amplitude at 9.2 Hz is 0.022 ± 0.014, and the vectors in Figure 4f show a mean‐phase angle of 277° ± 7°. As the number of trials in frq‐ifrq (Figure 4e, n = 378 ± 26 trials) and ifrq‐frq (Figure 4c, n = 376 ± 25 trials) conditions were very similar (~20% of the trials), it is unlikely that the absence of significant oscillations in the frq‐ifrq data was due to a lack of power.
The results of the one‐back analysis align with our previous findings (Ho et al., 2019) that alpha oscillation (~9 Hz) of response bias is largely present on trials where the target occurs in the same ear as the previous target (frq‐frq). Bias also oscillated at a similar frequency when a frequent target followed an infrequent target. Given that infrequent targets very rarely occurred on consecutive trials, the presence of a bias oscillation in the ifrq‐frq data implies that it is likely linked to the frequent target two trials back. We verified this by pooling together the ifrq‐frq and frq‐frq trials. The GLM analysis revealed a clear oscillation in bias around 9 Hz with similar amplitude and phase angle as in the ifrq‐frq and frq‐frq data. Taken together, the results suggests that the ear‐specific alpha oscillation of bias lasts at least two trials, which is consistent with our earlier findings (Ho et al., 2019).
Why did we fail to observe an oscillation in the frq‐ifrq data? As infrequent targets were rarely preceded by an infrequent target two trials back (i.e., ifrq‐frq‐ifrq), the frq‐ifrq data contained largely trials on which the target switched ears, i.e., from 1‐back frequent to current infrequent but rarely from 2‐back infrequent back to the same ear in the current trial (see Figure 1c).
3.4. Rhythmic modulation of accuracy following an infrequent target
Although we failed to find any rhythmic modulation of accuracy when we collapsed across frequent and infrequent targets (Figure 2a and 2b), there could be oscillatory effects associated specifically with infrequent (oddball) targets, which typically elicit an ERP difference wave, termed a Mismatch Negativity (MMN), associated with prediction error (Garrido et al., 2009; Stefanics et al., 2014; Wacongne et al., 2012; Winkler, 2007; Winkler et al., 2009). We applied the same one‐back analysis to the accuracy data as we did to the response data. As shown in Figure 5c, there was a robust oscillation of accuracy around 7.6 Hz, p = .02 (corrected for multiple comparisons), in the ifrq‐frq condition, with an amplitude of 0.017 ± 0.006. The significant oscillation at 7.6 Hz was further confirmed with the one‐sample Hotelling T2 test, T2 = 15.29, F2, 15 = 7.17, p =.007. Neither the frq‐frq (Figure 5a) nor the frq‐ifrq data (Figure 5e) showed a similar peak in the amplitude spectrum. Correspondingly, no other significant frequency was found by the 2D permutation test shown in Figure 5g (same as in Figure 2f). Figure 5d shows the vectors of individual subjects at 7.6 Hz in the ifrq‐frq condition, which cluster coherently around a mean‐phase angle of 306° ± 12°. In comparison, the vectors at 7.6 Hz in the frq‐frq (Figure 5b) and frq‐ifrq condition (Figure 5f) are more uniformly distributed are more uniformly distributed, with vectors in all quadrants.
FIGURE 5.

One‐back analysis of accuracy. (a) Amplitude spectrum of accuracy for trials where frequent targets occur on consecutive trials: The orange line reflects the mean vector length across individual subjects at the tested frequencies, and the shaded area indicates ±1 SEM (N = 17). (b) Vectors for individual subjects at 7.6 Hz, colour coded as in Figure 2e. (c) Amplitude spectrum for trials where a frequent target is preceded by an infrequent target. As in (a), the red line represents the mean vector length and the shaded area ±1 SEM. There is a clear peak in the spectrum around 7.6 Hz. (d) The individual vectors at 7.6 Hz, colour coded as in (b). (e‐f) Amplitude spectrum and individual vectors at 7.6 Hz for trials where an infrequent target are preceded by a frequent target. (g) P‐values yielded by the 2D permutation test, corrected for multiple comparisons using the same procedure as illustrated in Figure 2f. The horizontal black line indicates α = 0.05. The mean number of trials in each condition was the same as in the analysis of response bias (Figure 4)
The accuracy oscillation at 7.6 Hz shows several interesting characteristics. First, it appears to be specific to the oddball paradigm, as we have not encountered it in our previous study where we used the same task but presented the target with equal probability (50%) to each ear (Ho et al., 2019). Moreover, we only found the oscillation when we separated the trials that were preceded an infrequent target from the trials preceded by a frequent target. This suggests that the oscillation in accuracy arises only after the occurrence of an infrequent target. Given the strong association of the oddball with prediction errors (Garrido et al., 2009; Stefanics et al., 2014; Wacongne et al., 2012; Winkler, 2007; Winkler et al., 2009), the 7‐Hz oscillation we observe here could reflect the rhythmic behavioural modulation of predictive mechanisms over time.
4. DISCUSSION
4.1. Propagation of auditory perceptual priors via alpha oscillations
Perception is a proactive process in which the brain uses past sensory information to generate predictions about the world. We have previously presented evidence that auditory perceptual history is propagated via a reverberatory mechanism oscillating at an alpha rhythm of 9–10 Hz (Ho et al., 2019). The present study extends our earlier findings by showing that this predictive oscillatory process functions in the same manner under conditions of high‐stimulus expectation. As in our previous study, participants were asked to identify the ear‐of‐origin of a monaural pure‐tone target masked by uncorrelated, dichotic white noise. Stimulus expectation in each block was manipulated by increasing the target probability in one ear to 80% of the trials. Decision bias was not constant across time but fluctuated rhythmically at ~9.1 Hz from noise onset, irrespective of whether the target occurred more frequently in the left (L80) or right ear (R80). Importantly, this cyclic modulation of bias at alpha rhythm was dependent on stimulus history, as in our earlier study (Ho et al., 2019). The bias oscillation was largely observed for successive frequent trials (frq‐frq), in which the target occurred in the same ear in immediate succession. Although we define stimulus congruency in terms of ear, stimuli confined to one ear are perceived as originating from that side of space. Therefore, the interaction between consecutive stimuli may be mediated by the neuronal circuitry‐defining acoustic space, rather than within the monaural circuitry (King & Middlebrooks, 2011).
The ear or location specificity of the rhythmic modulation of bias suggests that no oscillation should be observed when the target switches ears. This was confirmed on trials where a frequent target was followed by an infrequent target (frq‐ifrq). However, when an infrequent target was followed by a frequent target (ifrq‐frq), decision bias oscillated at ~8.8 Hz, only slightly slower than the 9.2 Hz observed for bias on the frq‐frq trials. How do we explain that even though the target switched ears on the ifrq‐frq trials decision bias still oscillated? The ifrq‐frq condition mostly contains two‐back trials that are congruent (i.e., frq‐ifrq‐frq), as infrequent targets rarely occurred on successive trials. In our previous study (Ho et al., 2019), the oscillation of bias was still detectable on two‐back congruent trials, suggesting that the rhythmic communication of perceptual priors can last at least two trials. Therefore, the oscillation at ~8.8 Hz likely reflects the rhythmic influence of stimulus information (of a frequent target) two trials back, although there are too few infrequent trials to test this hypothesis directly.
The present results for decision bias align completely with our earlier findings (Ho et al., 2019), despite the unequal target probability between the ears (80% vs. 20%) in the current study, which induced stronger stimulus expectation in one ear (within a block of trials). This suggests that the auditory system relies on past sensory information to maintain perceptual continuity even under conditions of high‐stimulus expectation. The ear or location specificity of the bias oscillations here and in our previous study (Ho et al., 2019) is consistent with findings showing that the influence of stimulus history is spatially tuned (Cicchini et al., 2017; Fischer & Whitney, 2014; St. John‐Saaltink et al., 2016). Though still controversial (Fritsche et al., 2017), the conditions under which serial dependence arises imply that perceptual experience and sensory input interact on perceptual rather than decisional processes (Cicchini et al., 2017; Fornaciai & Park, 2018). In line with this view, our results suggest that the propagation of prior information occurs early within the sensory circuit (either the ear circuitry or that defining spatial location).
Several possible mechanisms may generate the oscillation of bias. Findings by VanRullen and MacDonald (2012) show that brief visual events elicit long‐lasting reverberatory responses at alpha rhythm, termed ‘perceptual echoes’, which are involved in short‐term memory processes (Chang et al., 2017; Huang et al., 2018). As in vision, auditory events could elicit similar memory traces that reverberate at alpha rhythm for at least two trials within the sensory circuit in which they were elicited (Figure 1c). On this view, the phase of each trace could be reset at the start of every trial by the noise bursts in both ears, and the oscillation in decision bias could arise from the interaction between the incoming auditory input and the prior in the congruent ear. Alternatively, the binaural noise bursts may elicit a loop of reverberating signals between top‐down memory representation and bottom‐up sensory information, with the delay of the reverberation generating an excitatory/inhibitory modulation of the sensory response.
The working memory literature is divided on whether information can be stored in early sensory areas (Gayet et al., 2018; Scimeca et al., 2018; Xu, 2018). Pasternak and Greenlee (2005) discuss evidence showing that the regions of the brain involved in sensory processing of a given perceptual attribute are modulated by working memory specific for that attribute. In match‐to‐sample tasks, the interactions between working memory and stimuli are highly sensory specific (Pasternak & Greenlee, 2005). In particular, Gottlieb et al. (1989) showed that neural response to a specific tone in the monkey auditory cortex was enhanced after presenting a sample of matched frequency, which might change the synaptic neural efficacy transiently, increasing the response to the test tone. A similar mechanism could underlie the rhythmic modulation of decision bias. The previous tone could alter the synaptic efficiency in specific circuits, so a target to the same ear (or location) becomes amplified while a target to the other ear remains unaffected.
However, sustained spiking activity, thought to be the mechanism for maintaining information in working memory (Arnsten, 2013), is rare in sensory cortices and more common and robust in association areas of parietal, frontal and temporal lobes (Leavitt et al., 2017). Therefore, the function of sensory areas in working memory tasks may be to encode incoming information, while its storage and control take place at higher levels, in particular, the prefrontal and posterior parietal cortex (Xu, 2017). Oscillations could play a crucial role in supporting the information flow between these regions (Fries, 2005, 2015; Salinas & Sejnowski, 2001; Varela et al., 2001), with different rhythms serving separate functions at various levels of processing. Jia et al. (2017) recently showed that echo responses at ~10 Hz to visual objects presented concurrently in left and right hemifields were modulated by a low‐frequency oscillation in the delta to theta range (2–4 Hz), causing cyclic inhibitions of alpha, depending on which hemifield or object the observer attended to. Thus, alpha responses appear to be specific to the processing of sensory information at each target location, while the low‐frequency modulation may reflect a higher‐order mechanism responsible for shifting attention between the two potential target locations.
Similar functional divisions between different oscillations could underlie sensory predictions. Recent intracranial findings by Sedley et al. (2015) suggest that alpha oscillations may encode the precision of auditory predictions, while faster rhythms (>30 Hz) encode prediction errors. Later, we discuss additional results from the current study that suggest theta oscillations operate at a higher processing level, possibly across brain areas, to ensure that predictions remain up to date.
4.2. Stimulus probability and stimulus history modulate decision bias differently
While the propagation of perceptual information from the immediate past appears to be supported by a rhythmic mechanism that causes oscillatory fluctuations in auditory behaviour over time, the processing of probabilistic stimulus information may be supported by a different non‐rhythmic mechanism that leads to a linear shift of the entire bias oscillation towards the more probable target location, as in Figure 3a and 3b. Although there remains some controversy (Balakrishnan, 1999), stimulus expectation as induced by target or cue probability has been shown to influence decisional (measured by the criterion c) rather than sensory (measured by d’) processes (Bang & Rahnev, 2017; Rungratsameetaweemana et al., 2018). Furthermore, the effects of stimulus probability can be dissociated from that of perceptual history in terms of behaviour and brain activation, suggesting that the underlying processes may be distinct (Kaneko & Sakai, 2015).
Could the linear shift in decision bias we observe here be related to repetition suppression, which has been proposed to reflect a mechanism whereby prediction errors are minimised (Auksztulewicz & Friston, 2016)? In the present study, the target was presented repeatedly to one of the two ears on 80% of trials. Such repetitive stimulus presentation typically leads to a decrease in neural response. A recent study by Jia et al. (2017) seems to suggest that changing the probability of cue validity from 50% to 75% weakens the theta‐modulated alternation in alpha‐inhibition and rebounce. It is a limitation of our study that we cannot clarify whether the oscillation in decision bias we observe here is weaker than in our previous study where the target occurred with equal probability in either ear (Ho et al., 2019). Future studies may be able to answer this question using similar behavioural methods we employ here combined with EEG.
Although Sherman et al.'s (2016) EEG findings also showed that alpha neural oscillations modulated decision bias rhythmically, whether a visual target was highly probable or not, it should be noted their manipulation of stimulus expectation had a different effect on oscillations than our study. It flipped the relationship between the phase of alpha and decision criterion, such that the same phases that predicted biases towards a ‘no’ response in the condition where the absence of a visual target is highly expected predicted biases towards a ‘yes’ response in the condition where the presence of a visual target is highly expected. The difference between our and Sherman et al.'s study could be due to various factors, including tasks (discrimination vs. detection), modalities (auditory vs. visual) and instructions (we did not inform participants about target probability manipulation).
4.3. Updating auditory perceptual priors via theta oscillations
When listeners’ expectation was violated, accuracy on the next trial was modulated in a rhythmic manner which has not been reported before. This oscillation was not observable when we pooled across the frequent and infrequent targets (Figure 2), but once we separated the trials depending on whether the previous and current target was frequent or infrequent (same one‐back analysis as applied to decision bias), the oscillation could be detected robustly at ~7.6 Hz. This rhythmic modulation of accuracy appears to be specific to infrequent targets and emerging only after the occurrence of an unexpected stimulus (on ifrq‐frq trials) but not at the time of occurrence (frq‐ifrq). Given these characteristics, it seems unlike any other oscillation of accuracy observed before (Fiebelkorn et al., 2013; Landau & Fries, 2012). Therefore, the 7.6‐Hz modulation may reflect a process unrelated to the rhythmic attentional sampling mechanism that is thought to underlie oscillations of sensitivity, typically measured by accuracy (Fiebelkorn & Kastner, 2019; Landau, 2018; VanRullen, 2016).
Rhythmic fluctuations of sensitivity are often observed at 4–8 Hz (Benedetto et al., 2016; Fiebelkorn et al., 2013; Landau & Fries, 2012; Re et al., 2019; Tomassini et al., ,2015, 2017) and are thought to arise from an attentional mechanism by which incoming sensory information is sampled in a cyclic manner, akin to a ‘blinking spotlight’ (VanRullen, 2016). Compelling EEG evidence from visual studies suggests that this rhythmic sampling mechanism involves ongoing brain oscillations in the 7–10 Hz frequency range, typically referred to as alpha (Busch et al., 2009; Busch & VanRullen, 2010; Mathewson et al., 2009). Several studies point to a similar oscillatory process in audition, albeit at slightly slower frequencies (Hickok et al., 2015; Ng et al., 2012). In a recent study, we showed that when participants had to discriminate the pitch of a brief monaural pure‐tone target masked by uncorrelated, dichotic white noise, sensitivity in each ear oscillated at ~5–6 Hz but in antiphase (~180º). This is consistent with visual evidence of similar antiphase oscillations in accuracy between two potential target locations in left and right visual hemifield (Fiebelkorn et al., 2013; Landau & Fries, 2012).
The 7.6‐Hz oscillation in accuracy that we observe in this study does not show this antiphase relationship between the two ears, otherwise the oscillations in left and right ear would have cancelled each other out. We showed this in our previous study (Ho et al., 2019) where we separated the trials depending on the target's ear of origin and found that the vectors in the two conditions exhibited a tendency to pull in opposite directions. This explained the absence of accuracy oscillations when we pooled all trials together. Therefore, the 7.6‐Hz accuracy oscillation we observe in the present study must have the same phase whether the target occurred in the left or right ear. This and the fact that the oscillation emerged specifically after an infrequent target dissociate it from the rhythmic sampling mechanism.
What process could the 7.6‐Hz oscillation reflect instead? It may be related to the Mismatch Negativity (MMN), which is a brain response elicited by violations of perceptual regularity in the auditory (Näätänen et al., ,2001, 2007) and visual modality (Stefanics et al., 2014). More specifically, the MMN is a negative deflection ~150–250 ms in the difference wave between the ERP to an infrequent target, also called a deviant, and that of a frequent target, or standard (Näätänen et al., 2001, 2007; Stefanics et al., 2014). Initially, it was considered an electrophysiological correlate of memory mismatch but is increasingly interpreted as a signal of prediction error that compels the perceptual system to update its predictions (Garrido et al., 2009; Wacongne et al., 2012; Winkler, 2007; Winkler et al., 2009). As updating predictions involves modifying sensory representations, this should affect perceptual sensitivity on subsequent trials (Alink et al., 2010; St. John‐Saaltink et al., 2016; Summerfield et al., 2008; Todorovic et al., 2011; Wacongne et al., 2011). Thus, we observe the effect of this modification only after the unexpected event, that is, on infreq‐freq trials. We propose that just as priors are propagated via alpha oscillations, their update could be communicated through high theta (or low alpha) rhythm, giving rise to cyclic modulations of accuracy following unexpected stimulus events (signalled by the MMN).
Several studies show that MMN elicitation is associated with increases in theta power and phase coherence in frontal and temporal areas (Fuentemilla et al., 2008; Hsiao et al., 2009; Ko et al., 2012). Connectivity analyses suggest that fronto–temporal interactions and reciprocal changes are essential to MMN generation (Garrido et al., 2008), with theta oscillations playing a possible role in synchronising activity between frontal and temporal regions (Choi et al., 2013). The significance of theta rhythm in cortical coherence is corroborated by clinical findings, linking MMN deficits in Schizophrenia to decreased theta band activity (for a review, see Javitt et al., 2018). Schizophrenia is a well‐known mental disorder that is characterised by episodes of psychosis. Theories of Schizophrenia range from dopamine and glutamate dysfunctions to structural and functional abnormalities (Insel, 2010). More recently, Bayesian approaches to Schizophrenia emphasise impairments related to probabilistic learning and prediction error and suggest that the hallucinations and delusions experienced by patients are due to deficient inference mechanisms that fail to integrate new evidence, resulting in false predictions (Fletcher & Frith, 2009; Griffin & Fletcher, 2017). Abnormal theta activity in Schizophrenia could contribute to this deficit.
Our finding is consistent with the idea that theta is involved in regulating the information flow between brain regions during the update of perceptual priors. Unlike the bias modulation, the accuracy oscillation we observe at ~7.6 Hz is not ear or location specific but results from a surprising switch of ears or locations. The MMN can also be elicited by a change in sound location, pointing to a higher‐order change‐detection process (Deouell et al., 2006; Paavilainen et al., 1989; Schröger & Wolff, 1996). Taken together, the findings suggest that the accuracy oscillation observed here could arise from the same mechanism (i.e., of detecting perceptual irregularities and updating sensory predictions) that underlies the generation of the MMN.
Although we assume that the alpha and theta rhythms reported here in both decision bias and accuracy arise from corresponding oscillatory modulations at the neural level, this still needs to be confirmed, possibly with M/EEG, despite the reported difficulties in recording auditory alpha with non‐invasive scalp electrodes. In addition, the fact that oscillations in accuracy between the two ears tend to be out of phase may pose problems for detecting auditory theta. Future studies will need to take these concerns into consideration.
5. CONCLUSION
We have identified two separate oscillatory mechanisms that operate concurrently to ensure auditory perception remains smooth and stable over time. They show that the auditory system engages in sensory prediction and relies on past perceptual experience to anticipate forthcoming sensory input, even under high‐stimulus expectation. The propagation of prior information involves alpha oscillations at ~9 Hz, which causes decision bias to fluctuate rhythmically. When a surprising event violates a prediction (eliciting a MMN), the perceptual system updates its expectations via high theta (or low alpha) oscillations at ~7 Hz, which leads to rhythmic modulations of accuracy on succeeding trials. Furthermore, alpha and theta rhythms operate at different levels of processing, with alpha modulating early processes at the sensory level, while theta oscillations mediate the information flow across sensory circuits at a higher level. In sum, oscillations play a crucial role in sensory predictions, with different rhythms serving distinct functions in the processing hierarchy.
6. COMPETING INTERESTS
The authors declare no competing interests.
AUTHOR CONTRIBUTIONS
H.T.H. conducted the experiment, and M.C.M., D.C.B., D.A. and H.T.H. designed the experiment, defined and validated data analysis methods, and wrote the paper.
PEER REVIEW
The peer review history for this article is available at https://publons.com/publon/10.1111/ejn.15141.
ACKNOWLEDGEMENTS
The research was supported by the Australian Research Council Discovery Project (DP150101731) and the European Research Council (H2020) 832813 ‘GenPercept' and MIUR PRIN 2017.
Ho HT, Burr DC, Alais D, Morrone MC. Propagation and update of auditory perceptual priors through alpha and theta rhythms. Eur J Neurosci. 2022;55(11–12): 3083–3099. 10.1111/ejn.15141
DATA AVAILABILITY STATEMENT
The source data files for Figures 2, 3, 4, 5 are available at https://doi.org/10.17605/OSF.IO/XWDN6.
REFERENCES
- Alink, A. , Schwiedrzik, C. M. , Kohler, A. , Singer, W. , & Muckli, L. (2010). Stimulus predictability reduces responses in primary visual cortex. Journal of Neuroscience, 30(8), 2960–2966. 10.1523/JNEUROSCI.3730-10.2010 [DOI] [PMC free article] [PubMed] [Google Scholar]
- Arnal, L. H. , & Giraud, A.‐L. (2012). Cortical oscillations and sensory predictions. Trends in Cognitive Sciences, 16(7), 390–398. 10.1016/j.tics.2012.05.003 [DOI] [PubMed] [Google Scholar]
- Arnsten, A. F. T. (2013). The neurobiology of thought: The groundbreaking discoveries of patricia Goldman‐Rakic 1937–2003. Cerebral Cortex, 23(10), 2269–2281. 10.1093/cercor/bht195 [DOI] [PMC free article] [PubMed] [Google Scholar]
- Arzounian, D. , de Kerangal, M. , & de Cheveigné, A. (2017). Sequential dependencies in pitch judgments. The Journal of the Acoustical Society of America, 142(5), 3047–3057. 10.1121/1.5009938 [DOI] [PubMed] [Google Scholar]
- Auksztulewicz, R. , & Friston, K. (2016). Repetition suppression and its contextual determinants in predictive coding. Cortex, 80, 125–140. 10.1016/j.cortex.2015.11.024 [DOI] [PMC free article] [PubMed] [Google Scholar]
- Balakrishnan, J. D. (1999). Decision processes in discrimination: Fundamental misrepresentations of signal detection theory. Journal of Experimental Psychology: Human Perception and Performance, 25(5), 1189–1206. 10.1037/0096-1523.25.5.1189. [DOI] [PubMed] [Google Scholar]
- Bang, J. W. , & Rahnev, D. (2017). Stimulus expectation alters decision criterion but not sensory signal in perceptual decision making. Scientific Reports, 7(1), 17072. 10.1038/s41598-017-16885-2 [DOI] [PMC free article] [PubMed] [Google Scholar]
- Benedetto, A. , Burr, D. C. , & Morrone, M. C. (2018). Perceptual oscillation of audiovisual time simultaneity. Eneuro, 5(3), 10.1523/ENEURO.0047-18.2018 [DOI] [PMC free article] [PubMed] [Google Scholar]
- Benedetto, A. , & Morrone, M. C. (2017). Saccadic suppression is embedded within extended oscillatory modulation of sensitivity. The Journal of Neuroscience, 37(13), 3661–3670. 10.1523/JNEUROSCI.2390-16.2016 [DOI] [PMC free article] [PubMed] [Google Scholar]
- Benedetto, A. , Spinelli, D. , & Morrone, M. C. (2016). Rhythmic modulation of visual contrast discrimination triggered by action. Proceedings of the Royal Society B: Biological Sciences, 283(1831), 20160692. 10.1098/rspb.2016.0692 [DOI] [PMC free article] [PubMed] [Google Scholar]
- Brainard, D. H. (1997). The psychophysics toolbox. Spatial Vision, 10(4), 433–436. 10.1163/156856897X00357 [DOI] [PubMed] [Google Scholar]
- Burr, D. , & Cicchini, G. M. (2014). Vision: Efficient adaptive coding. Current Biology, 24(22), R1096–R1098. 10.1016/j.cub.2014.10.002 [DOI] [PMC free article] [PubMed] [Google Scholar]
- Busch, N. A. , Dubois, J. , & VanRullen, R. (2009). The phase of ongoing EEG oscillations predicts visual perception. Journal of Neuroscience, 29(24), 7869–7876. 10.1523/JNEUROSCI.0113-09.2009 [DOI] [PMC free article] [PubMed] [Google Scholar]
- Busch, N. A. , & VanRullen, R. (2010). Spontaneous EEG oscillations reveal periodic sampling of visual attention. Proceedings of the National Academy of Sciences, 107(37), 16048–16053. 10.1073/pnas.1004801107 [DOI] [PMC free article] [PubMed] [Google Scholar]
- Chambers, C. , Akram, S. , Adam, V. , Pelofi, C. , Sahani, M. , Shamma, S. , & Pressnitzer, D. (2017). Prior context in audition informs binding and shapes simple features. Nature Communications, 8(1), 15027. 10.1038/ncomms15027 [DOI] [PMC free article] [PubMed] [Google Scholar]
- Chambers, C. , & Pressnitzer, D. (2014). Perceptual hysteresis in the judgment of auditory pitch shift. Attention, Perception, & Psychophysics, 76(5), 1271–1279. 10.3758/s13414-014-0676-5 [DOI] [PubMed] [Google Scholar]
- Chang, A.‐ Y.‐C. , Schwartzman, D. J. , VanRullen, R. , Kanai, R. , & Seth, A. K. (2017). Visual perceptual echo reflects learning of regularities in rapid luminance sequences. The Journal of Neuroscience, 37(35), 8486–8497. 10.1523/JNEUROSCI.3714-16.2017 [DOI] [PMC free article] [PubMed] [Google Scholar]
- Choi, J. W. , Lee, J. K. , Ko, D. , Lee, G.‐T. , Jung, K.‐Y. , & Kim, K. H. (2013). Fronto‐temporal interactions in the theta‐band during auditory deviant processing. Neuroscience Letters, 548, 120–125. 10.1016/j.neulet.2013.05.079 [DOI] [PubMed] [Google Scholar]
- Cicchini, G. M. , Anobile, G. , & Burr, D. C. (2014). Compressive mapping of number to space reflects dynamic encoding mechanisms, not static logarithmic transform. Proceedings of the National Academy of Sciences, 111(21), 7867–7872. 10.1073/pnas.1402785111 [DOI] [PMC free article] [PubMed] [Google Scholar]
- Cicchini, G. M. , Mikellidou, K. , & Burr, D. (2017). Serial dependencies act directly on perception. Journal of Vision, 17(14), 6. 10.1167/17.14.6 [DOI] [PubMed] [Google Scholar]
- de Lange, F. P. , Rahnev, D. A. , Donner, T. H. , & Lau, H. (2013). Prestimulus oscillatory activity over motor cortex reflects perceptual expectations. Journal of Neuroscience, 33(4), 1400–1410. 10.1523/JNEUROSCI.1094-12.2013 [DOI] [PMC free article] [PubMed] [Google Scholar]
- Deouell, L. Y. , Parnes, A. , Pickard, N. , & Knight, R. T. (2006). Spatial location is accurately tracked by human auditory sensory memory: Evidence from the mismatch negativity. European Journal of Neuroscience, 24(5), 1488–1494. 10.1111/j.1460-9568.2006.05025.x [DOI] [PubMed] [Google Scholar]
- Engel, A. K. , Fries, P. , & Singer, W. (2001). Dynamic predictions: Oscillations and synchrony in top–down processing. Nature Reviews Neuroscience, 2(10), 704–716. 10.1038/35094565 [DOI] [PubMed] [Google Scholar]
- Faes, L. , Nollo, G. , Ravelli, F. , Ricci, L. , Vescovi, M. , Turatto, M. , Pavani, F. , & Antolini, R. (2007). Small‐sample characterization of stochastic approximation staircases in forced‐choice adaptive threshold estimation. Perception & Psychophysics, 69(2), 254–262. 10.3758/BF03193747 [DOI] [PubMed] [Google Scholar]
- Fiebelkorn, I. C. , Foxe, J. J. , Butler, J. S. , Mercier, M. R. , Snyder, A. C. , & Molholm, S. (2011). Ready, set, reset: Stimulus‐Locked periodicity in behavioral performance demonstrates the consequences of cross‐sensory phase reset. Journal of Neuroscience, 31(27), 9971–9981. 10.1523/JNEUROSCI.1338-11.2011 [DOI] [PMC free article] [PubMed] [Google Scholar]
- Fiebelkorn, I. C. , & Kastner, S. (2019). A rhythmic theory of attention. Trends in Cognitive Sciences, 23(2), 87–101. 10.1016/j.tics.2018.11.009 [DOI] [PMC free article] [PubMed] [Google Scholar]
- Fiebelkorn, I. C. , Saalmann, Y. B. , & Kastner, S. (2013). Rhythmic sampling within and between objects despite sustained attention at a cued location. Current Biology, 23(24), 2553–2558. 10.1016/j.cub.2013.10.063 [DOI] [PMC free article] [PubMed] [Google Scholar]
- Fischer, J. , & Whitney, D. (2014). Serial dependence in visual perception. Nature Neuroscience, 17(5), 738–743. 10.1038/nn.3689 [DOI] [PMC free article] [PubMed] [Google Scholar]
- Fletcher, P. C. , & Frith, C. D. (2009). Perceiving is believing: A Bayesian approach to explaining the positive symptoms of schizophrenia. Nature Reviews Neuroscience, 10(1), 48–58. 10.1038/nrn2536 [DOI] [PubMed] [Google Scholar]
- Fornaciai, M. , & Park, J. (2018). Attractive serial dependence in the absence of an explicit task. Psychological Science, 29(3), 437–446. 10.1177/0956797617737385 [DOI] [PubMed] [Google Scholar]
- Fries, P. (2005). A mechanism for cognitive dynamics: Neuronal communication through neuronal coherence. Trends in Cognitive Sciences, 9(10), 474–480. 10.1016/j.tics.2005.08.011 [DOI] [PubMed] [Google Scholar]
- Fries, P. (2015). Rhythms for cognition: Communication through coherence. Neuron, 88(1), 220–235. 10.1016/j.neuron.2015.09.034 [DOI] [PMC free article] [PubMed] [Google Scholar]
- Friston, K. (2005). A theory of cortical responses. Philosophical Transactions of the Royal Society B: Biological Sciences, 360(1456), 815–836. 10.1098/rstb.2005.1622 [DOI] [PMC free article] [PubMed] [Google Scholar]
- Friston, K. J. , Bastos, A. M. , Pinotsis, D. , & Litvak, V. (2015). LFP and oscillations—What do they tell us? Current Opinion in Neurobiology, 31, 1–6. 10.1016/j.conb.2014.05.004 [DOI] [PMC free article] [PubMed] [Google Scholar]
- Fritsche, M. , Mostert, P. , & de Lange, F. P. (2017). Opposite effects of recent history on perception and decision. Current Biology, 27(4), 590–595. 10.1016/j.cub.2017.01.006 [DOI] [PubMed] [Google Scholar]
- Fuentemilla, L. L. , Marco‐Pallarés, J. , Münte, T. F. , & Grau, C. (2008). Theta EEG oscillatory activity and auditory change detection. Brain Research, 1220, 93–101. 10.1016/j.brainres.2007.07.079 [DOI] [PubMed] [Google Scholar]
- García‐Pérez, M. A. (2011). A cautionary note on the use of the adaptive up–down method. The Journal of the Acoustical Society of America, 130(4), 2098–2107. 10.1121/1.3628334 [DOI] [PubMed] [Google Scholar]
- Garrido, M. I. , Friston, K. J. , Kiebel, S. J. , Stephan, K. E. , Baldeweg, T. , & Kilner, J. M. (2008). The functional anatomy of the MMN: A DCM study of the roving paradigm. NeuroImage, 42(2), 936–944. 10.1016/j.neuroimage.2008.05.018 [DOI] [PMC free article] [PubMed] [Google Scholar]
- Garrido, M. I. , Kilner, J. M. , Stephan, K. E. , & Friston, K. J. (2009). The mismatch negativity: A review of underlying mechanisms. Clinical Neurophysiology, 120(3), 453–463. 10.1016/j.clinph.2008.11.029 [DOI] [PMC free article] [PubMed] [Google Scholar]
- Gayet, S. , Paffen, C. L. E. , & Van der Stigchel, S. (2018). Visual working memory storage recruits sensory processing areas. Trends in Cognitive Sciences, 22(3), 189–190. 10.1016/j.tics.2017.09.011 [DOI] [PubMed] [Google Scholar]
- Gomez‐Ramirez, M. , Kelly, S. P. , Molholm, S. , Sehatpour, P. , Schwartz, T. H. , & Foxe, J. J. (2011). Oscillatory sensory selection mechanisms during intersensory attention to rhythmic auditory and visual inputs. A Human Electrocorticographic Investigation., 12, 18556–18567. 10.1523/JNEUROSCI.2164-11.2011. [DOI] [PMC free article] [PubMed] [Google Scholar]
- Gottlieb, Y. , Vaadia, E. , & Abeles, M. (1989). Single unit activity in the auditory cortex of a monkey performing a short term memory task. Experimental Brain Research, 74(1), 139–148. 10.1007/BF00248287 [DOI] [PubMed] [Google Scholar]
- Green, D. M. , & Swets, J. A. (1966). Signal detection theory and psychophysics, Vol. 1. Wiley. [Google Scholar]
- Griffin, J. D. , & Fletcher, P. C. (2017). Predictive processing, source monitoring, and psychosis. Annual Review of Clinical Psychology, 13(1), 265–289. 10.1146/annurev-clinpsy-032816-045145 [DOI] [PMC free article] [PubMed] [Google Scholar]
- Hickok, G. , Farahbod, H. , & Saberi, K. (2015). The rhythm of perception: Entrainment to acoustic rhythms induces subsequent perceptual oscillation. Psychological Science, 26(7), 1006–1013. 10.1177/0956797615576533 [DOI] [PMC free article] [PubMed] [Google Scholar]
- Ho, H. T. , Burr, D. C. , Alais, D. , & Morrone, M. C. (2019). Auditory perceptual history is propagated through alpha oscillations. Current Biology, 29(24), 4208.e3–4217.e3. 10.1016/j.cub.2019.10.041 [DOI] [PMC free article] [PubMed] [Google Scholar]
- Ho, H. T. , Leung, J. , Burr, D. C. , Alais, D. , & Morrone, M. C. (2017). Auditory sensitivity and decision criteria oscillate at different frequencies separately for the two ears. Current Biology, 27(23), 3643–3649.e3. 10.1016/j.cub.2017.10.017 [DOI] [PubMed] [Google Scholar]
- Hotelling, H. (1951). A generalized T test and measure of multivariate dispersion. In: Neyman J. (Ed.), Proceedings of the Second Berkeley Symposium on Mathematical Statistics and Probability (pp. 23–41) University of California Press. [Google Scholar]
- Hsiao, F.‐J. , Wu, Z.‐A. , Ho, L.‐T. , & Lin, Y.‐Y. (2009). Theta oscillation during auditory change detection: An MEG study. Biological Psychology, 81(1), 58–66. 10.1016/j.biopsycho.2009.01.007 [DOI] [PubMed] [Google Scholar]
- Huang, Q. , Jia, J. , Han, Q. , & Luo, H. (2018). Fast‐backward replay of sequentially memorized items in humans. Elife, 7, e35164. 10.7554/eLife.35164 [DOI] [PMC free article] [PubMed] [Google Scholar]
- Iemi, L. , Chaumon, M. , Crouzet, S. M. , & Busch, N. A. (2017). Spontaneous neural oscillations bias perception by modulating baseline excitability. Journal of Neuroscience, 37(4), 807–819. 10.1523/JNEUROSCI.1432-16.2016 [DOI] [PMC free article] [PubMed] [Google Scholar]
- İlhan, B. , & VanRullen, R. (2012). No counterpart of visual perceptual echoes in the auditory system. PLoS One, 7(11), e49287. 10.1371/journal.pone.0049287 [DOI] [PMC free article] [PubMed] [Google Scholar]
- Insel, T. R. (2010). Rethinking schizophrenia. Nature, 468(7321), 187–193. 10.1038/nature09552 [DOI] [PubMed] [Google Scholar]
- Javitt, D. C. , Lee, M. , Kantrowitz, J. T. , & Martinez, A. (2018). Mismatch negativity as a biomarker of theta band oscillatory dysfunction in schizophrenia. Schizophrenia Research, 191, 51–60. 10.1016/j.schres.2017.06.023 [DOI] [PubMed] [Google Scholar]
- Jia, J. , Liu, L. , Fang, F. , & Luo, H. (2017). Sequential sampling of visual objects during sustained attention. PLOS Biology, 15(6), e2001903. 10.1371/journal.pbio.2001903 [DOI] [PMC free article] [PubMed] [Google Scholar]
- Kaneko, Y. , & Sakai, K. (2015). Dissociation in decision bias mechanism between probabilistic information and previous decision. Frontiers in Human Neuroscience, 9, 10.3389/fnhum.2015.00261 [DOI] [PMC free article] [PubMed] [Google Scholar]
- King, A. J. , & Middlebrooks, J. C. (2011). Cortical representation of auditory space. In Winer J. A., & Schreiner C. E. (Eds.), The auditory cortex (pp. 329–341). Springer US. [Google Scholar]
- Knoblauch, K. , & Maloney, L. T. (2008). Estimating classification images with generalized linear and additive models. Journal of Vision, 8(16), 10. 10.1167/8.16.10 [DOI] [PMC free article] [PubMed] [Google Scholar]
- Ko, D. , Kwon, S. , Lee, G.‐T. , Im, C. H. , Kim, K. H. , & Jung, K.‐Y. (2012). Theta oscillation related to the auditory discrimination process in mismatch negativity: Oddball versus control paradigm. Journal of Clinical Neurology, 8(1), 35. 10.3988/jcn.2012.8.1.35 [DOI] [PMC free article] [PubMed] [Google Scholar]
- Landau, A. N. (2018). Neuroscience: A mechanism for rhythmic sampling in vision. Current Biology, 28(15), R830–R832. 10.1016/j.cub.2018.05.081 [DOI] [PubMed] [Google Scholar]
- Landau, A. N. , & Fries, P. (2012). Attention samples stimuli rhythmically. Current Biology, 22(11), 1000–1004. 10.1016/j.cub.2012.03.054 [DOI] [PubMed] [Google Scholar]
- Leavitt, M. L. , Mendoza‐Halliday, D. , & Martinez‐Trujillo, J. C. (2017). Sustained Activity encoding working memories: Not fully distributed. Trends in Neurosciences, 40(6), 328–346. 10.1016/j.tins.2017.04.004 [DOI] [PubMed] [Google Scholar]
- Lee, T. S. , & Mumford, D. (2003). Hierarchical Bayesian inference in the visual cortex. Journal of the Optical Society of America A, 20(7), 1434. 10.1364/JOSAA.20.001434 [DOI] [PubMed] [Google Scholar]
- Lehtelä, L. , Salmelin, R. , & Hari, R. (1997). Evidence for reactive magnetic 10‐Hz rhythm in the human auditory cortex. Neuroscience Letters, 222(2), 111–114. 10.1016/S0304-3940(97)13361-4 [DOI] [PubMed] [Google Scholar]
- Liberman, A. , Fischer, J. , & Whitney, D. (2014). Serial dependence in the perception of faces. Current Biology, 24(21), 2569–2574. 10.1016/j.cub.2014.09.025 [DOI] [PMC free article] [PubMed] [Google Scholar]
- Limbach, K. , & Corballis, P. M. (2016). Prestimulus alpha power influences response criterion in a detection task. Psychophysiology, 53(8), 1154–1164. 10.1111/psyp.12666 [DOI] [PubMed] [Google Scholar]
- Lozano‐Soldevilla, D. , & VanRullen, R. (2019). The hidden spatial dimension of alpha: 10‐Hz perceptual echoes propagate as periodic traveling waves in the human brain. Cell Reports, 26(2), 374.e4–380.e4. 10.1016/j.celrep.2018.12.058 [DOI] [PMC free article] [PubMed] [Google Scholar]
- Macmillan, N. A. , & Creelman, C. D. (2005). Detection theory: A user’s guide (2nd ed.). New York: Psychological Press. [Google Scholar]
- Mathewson, K. E. , Gratton, G. , Fabiani, M. , Beck, D. M. , & Ro, T. (2009). To see or not to see: Prestimulus phase predicts visual awareness. Journal of Neuroscience, 29(9), 2725–2732. 10.1523/JNEUROSCI.3963-08.2009 [DOI] [PMC free article] [PubMed] [Google Scholar]
- Näätänen, R. , Paavilainen, P. , Rinne, T. , & Alho, K. (2007). The mismatch negativity (MMN) in basic research of central auditory processing: A review. Clinical Neurophysiology, 118(12), 2544–2590. 10.1016/j.clinph.2007.04.026 [DOI] [PubMed] [Google Scholar]
- Näätänen, R. , Tervaniemi, M. , Sussman, E. , Paavilainen, P. , & Winkler, I. (2001). ‘Primitive intelligence’ in the auditory cortex. Trends in Neurosciences, 24(5), 283–288. 10.1016/S0166-2236(00)01790-2 [DOI] [PubMed] [Google Scholar]
- Ng, B. S. W. , Schroeder, T. , & Kayser, C. (2012). A precluding but not ensuring role of entrained low‐frequency oscillations for auditory perception. Journal of Neuroscience, 32(35), 12268–12276. 10.1523/JNEUROSCI.1877-12.2012 [DOI] [PMC free article] [PubMed] [Google Scholar]
- Paavilainen, P. , Karlsson, M.‐L. , Reinikainen, K. , & Näätänen, R. (1989). Mismatch negativity to change in spatial location of an auditory stimulus. Electroencephalography and Clinical Neurophysiology, 73(2), 129–141. 10.1016/0013-4694(89)90192-2 [DOI] [PubMed] [Google Scholar]
- Pasternak, T. , & Greenlee, M. W. (2005). Working memory in primate sensory systems. Nature Reviews Neuroscience, 6(2), 97–107. 10.1038/nrn1603 [DOI] [PubMed] [Google Scholar]
- Rao, R. P. N. , & Ballard, D. H. (1999). Predictive coding in the visual cortex: A functional interpretation of some extra‐classical receptive‐field effects. Nature Neuroscience, 2(1), 79–87. 10.1038/4580 [DOI] [PubMed] [Google Scholar]
- Re, D. , Inbar, M. , Richter, C. G. , & Landau, A. N. (2019). Feature‐based attention samples stimuli rhythmically. Current Biology, 29(4), 693–699.e4. 10.1016/j.cub.2019.01.010 [DOI] [PubMed] [Google Scholar]
- Rungratsameetaweemana, N. , Itthipuripat, S. , Salazar, A. , & Serences, J. T. (2018). Expectations do not alter early sensory processing during perceptual decision‐making. The Journal of Neuroscience, 38(24), 5632–5648. 10.1523/JNEUROSCI.3638-17.2018 [DOI] [PMC free article] [PubMed] [Google Scholar]
- Salinas, E. , & Sejnowski, T. J. (2001). Correlated neuronal activity and the flow of neural information. Nature Reviews Neuroscience, 2(8), 539–550. 10.1038/35086012 [DOI] [PMC free article] [PubMed] [Google Scholar]
- Samaha, J. , Iemi, L. , & Postle, B. R. (2017). Prestimulus alpha‐band power biases visual discrimination confidence, but not accuracy. Consciousness and Cognition, 54, 47–55. 10.1016/j.concog.2017.02.005 [DOI] [PMC free article] [PubMed] [Google Scholar]
- Schröger, E. , & Wolff, C. (1996). Mismatch response of the human brain to changes in sound location. NeuroReport, 7(18), 3005–3008. 10.1097/00001756-199611250-00041 [DOI] [PubMed] [Google Scholar]
- Scimeca, J. M. , Kiyonaga, A. , & D’Esposito, M. (2018). Reaffirming the sensory recruitment account of working memory. Trends in Cognitive Sciences, 22(3), 190–192. 10.1016/j.tics.2017.12.007 [DOI] [PubMed] [Google Scholar]
- Sedley, W. , Gander, P. E. , Kumar, S. , Oya, H. , Kovach, C. K. , Nourski, K. V. , Kawasaki, H. , Howard, M. A. , & Griffiths, T. D. (2015). Intracranial mapping of a cortical tinnitus system using residual inhibition. Current Biology, 25(9), 1208–1214. 10.1016/j.cub.2015.02.075 [DOI] [PMC free article] [PubMed] [Google Scholar]
- Sherman, M. T. , Kanai, R. , Seth, A. K. , & VanRullen, R. (2016). Rhythmic influence of top‐down perceptual priors in the phase of prestimulus occipital alpha oscillations. Journal of Cognitive Neuroscience, 28(9), 1318–1330. 10.1162/jocn_a_00973 [DOI] [PubMed] [Google Scholar]
- St. John‐Saaltink, E. , Kok, P. , Lau, H. C. , & de Lange, F. P. (2016). Serial dependence in perceptual decisions is reflected in activity patterns in primary visual cortex. The Journal of Neuroscience, 36(23), 6186–6192. 10.1523/JNEUROSCI.4390-15.2016 [DOI] [PMC free article] [PubMed] [Google Scholar]
- Stefanics, G. , Kremláček, J. , & Czigler, I. (2014). Visual mismatch negativity: A predictive coding view. Frontiers in Human Neuroscience, 8, 10.3389/fnhum.2014.00666 [DOI] [PMC free article] [PubMed] [Google Scholar]
- Summerfield, C. , Trittschuh, E. H. , Monti, J. M. , Mesulam, M.‐M. , & Egner, T. (2008). Neural repetition suppression reflects fulfilled perceptual expectations. Nature Neuroscience, 11(9), 1004–1006. 10.1038/nn.2163 [DOI] [PMC free article] [PubMed] [Google Scholar]
- Taubert, J. , Alais, D. , & Burr, D. (2016). Different coding strategies for the perception of stable and changeable facial attributes. Scientific Reports, 6(1), 32239. 10.1038/srep32239 [DOI] [PMC free article] [PubMed] [Google Scholar]
- Todorovic, A. , van Ede, F. , Maris, E. , & de Lange, F. P. (2011). Prior expectation mediates neural adaptation to repeated sounds in the auditory cortex: An MEG study. Journal of Neuroscience, 31(25), 9118–9123. 10.1523/JNEUROSCI.1425-11.2011 [DOI] [PMC free article] [PubMed] [Google Scholar]
- Tomassini, A. , Ambrogioni, L. , Medendorp, W. P. , & Maris, E. (2017). Theta oscillations locked to intended actions rhythmically modulate perception. Elife, 6, e25618. 10.7554/eLife.25618 [DOI] [PMC free article] [PubMed] [Google Scholar]
- Tomassini, A. , Spinelli, D. , Jacono, M. , Sandini, G. , & Morrone, M. C. (2015). Rhythmic oscillations of visual contrast sensitivity synchronized with action. Journal of Neuroscience, 35(18), 7019–7029. 10.1523/JNEUROSCI.4568-14.2015 [DOI] [PMC free article] [PubMed] [Google Scholar]
- VanRullen, R. (2016). Perceptual cycles. Trends in Cognitive Sciences, 20(10), 723–735. 10.1016/j.tics.2016.07.006 [DOI] [PubMed] [Google Scholar]
- VanRullen, R. , & Macdonald, J. S. P. (2012). Perceptual echoes at 10 Hz in the human brain. Current Biology, 22(11), 995–999. 10.1016/j.cub.2012.03.050 [DOI] [PubMed] [Google Scholar]
- VanRullen, R. , Zoefel, B. , & Ilhan, B. (2014). On the cyclic nature of perception in vision versus audition. Philosophical Transactions of the Royal Society B: Biological Sciences, 369(1641), 20130214. 10.1098/rstb.2013.0214 [DOI] [PMC free article] [PubMed] [Google Scholar]
- Varela, F. , Lachaux, J.‐P. , Rodriguez, E. , & Martinerie, J. (2001). The brainweb: Phase synchronization and large‐scale integration. Nature Reviews Neuroscience, 2(4), 229–239. 10.1038/35067550 [DOI] [PubMed] [Google Scholar]
- Wacongne, C. , Changeux, J.‐P. , & Dehaene, S. (2012). A neuronal model of predictive coding accounting for the mismatch negativity. Journal of Neuroscience, 32(11), 3665–3678. 10.1523/JNEUROSCI.5003-11.2012 [DOI] [PMC free article] [PubMed] [Google Scholar]
- Wacongne, C. , Labyt, E. , van Wassenhove, V. , Bekinschtein, T. , Naccache, L. , & Dehaene, S. (2011). Evidence for a hierarchy of predictions and prediction errors in human cortex. Proceedings of the National Academy of Sciences, 108(51), 20754–20759. 10.1073/pnas.1117807108 [DOI] [PMC free article] [PubMed] [Google Scholar]
- Weisz, N. , Hartmann, T. , Müller, N. , Lorenz, I. , & Obleser, J. (2011). Alpha rhythms in audition: Cognitive and clinical perspectives. Frontiers in Psychology, 2, 10.3389/fpsyg.2011.00073 [DOI] [PMC free article] [PubMed] [Google Scholar]
- Winkler, I. (2007). Interpreting the mismatch negativity. Journal of Psychophysiology, 21(3–4), 147–163. 10.1027/0269-8803.21.34.147 [DOI] [Google Scholar]
- Winkler, I. , Denham, S. L. , & Nelken, I. (2009). Modeling the auditory scene: Predictive regularity representations and perceptual objects. Trends in Cognitive Sciences, 13(12), 532–540. 10.1016/j.tics.2009.09.003 [DOI] [PubMed] [Google Scholar]
- Xia, Y. , Leib, A. Y. , & Whitney, D. (2016). Serial dependence in the perception of attractiveness. Journal of Vision, 16(15), 28. 10.1167/16.15.28 [DOI] [PMC free article] [PubMed] [Google Scholar]
- Xu, Y. (2017). Reevaluating the sensory account of visual working memory storage. Trends in Cognitive Sciences, 21(10), 794–815. 10.1016/j.tics.2017.06.013 [DOI] [PubMed] [Google Scholar]
- Xu, Y. (2018). Sensory cortex is nonessential in working memory storage. Trends in Cognitive Sciences, 22(3), 192–193. 10.1016/j.tics.2017.12.008 [DOI] [PubMed] [Google Scholar]
- Zoefel, B. , & Heil, P. (2013). Detection of near‐threshold sounds is independent of EEG phase in common frequency bands. Frontiers in Psychology, 4, 262. 10.3389/fpsyg.2013.00262 [DOI] [PMC free article] [PubMed] [Google Scholar]
Associated Data
This section collects any data citations, data availability statements, or supplementary materials included in this article.
Data Availability Statement
The source data files for Figures 2, 3, 4, 5 are available at https://doi.org/10.17605/OSF.IO/XWDN6.