

Abstract
Background and Aims
No effective treatments are available for liver fibrosis. Angiogenesis is deeply involved in liver fibrogenesis. However, current controversial results suggest it is difficult to treat liver fibrosis through vascular targeting. There are three different microvessels in liver: portal vessels, liver sinusoids, and central vessels. The changes and roles for each of the three different vessels during liver fibrogenesis are unclear. We propose that they play different roles during liver fibrogenesis, and a single vascular endothelial cell (EC) regulator is not enough to fully regulate these three vessels to treat liver fibrosis. Therefore, a combined regulation of multiple different EC regulatory signaling pathway may provide new strategies for the liver fibrosis therapy. Herein, we present a proof‐of‐concept strategy by combining the regulation of leukocyte cell‐derived chemotaxin 2 (LECT2)/tyrosine kinase with immunoglobulin‐like and epidermal growth factor–like domains 1 signaling with that of vascular endothelial growth factor (VEGF)/recombinant VEGF (rVEGF) signaling.
Approach and Results
The CCl4‐induced mouse liver fibrosis model and NASH model were both used. During fibrogenesis, vascular changes occurred at very early stage, and different liver vessels showed different changes and played different roles: decreased portal vessels, increased sinusoid capillarization and the increased central vessels the increase of portal vessels alleviates liver fibrosis, the increase of central vessels aggravates liver fibrosis, and the increase of sinusoid capillarization aggravates liver fibrosis. The combinational treatment of adeno‐associated viral vector serotype 9 (AAV9)–LECT2–short hairpin RNA (shRNA) and rVEGF showed improved therapeutic effects, but it led to serious side effects. The combination of AAV9‐LECT2‐shRNA and bevacizumab showed both improved therapeutic effects and decreased side effects.
Conclusions
Liver vascular changes occurred at very early stage of fibrogenesis. Different vessels play different roles in liver fibrosis. The combinational treatment of AAV9‐LECT2‐shRNA and bevacizumab could significantly improve the therapeutic effects on liver fibrosis.

Abbreviations
- AAV9
adeno‐associated viral vector serotype 9
- Alb
serum levels of albumin
- ALT
alanine aminotransferase
- AST
aspartate aminotransferase
- EC
endothelial cell
- FGF
fibroblast growth factor
- GAPDH
glyceraldehyde 3‐phosphate dehydrogenase
- HIF
hypoxia‐inducible factor
- LECT2
leukocyte cell–derived chemotaxin 2
- LSEC
liver sinusoid endothelial cell
- LYVE1
lymphatic endothelial receptor‐1
- ns
not significant
- PDGF
platelet‐derived growth factor
- rVEGF
recombinant vascular endothelial growth factor
- shRNA
short hairpin RNA
- TB
total bilirubin
- Tie1
tyrosine kinase with immunoglobulin‐like and epidermal growth factor–like domains 1
- TP
total protein
- VEGF
vascular endothelial growth factor
- α‐SMA
α‐smooth muscle actin
INTRODUCTION
Liver fibrosis is a complication of chronic liver diseases (CLDs) associated with repeated hepatocyte death caused by chronic viral hepatitis, alcohol abuse, obesity‐associated NASH, or autoimmune hepatitis.[ 1 , 2 , 3 ] Without effective intervention, liver fibrosis would eventually turn into liver cirrhosis, one of the most common causes of death worldwide.[ 4 ] For decades, various mechanisms leading to liver fibrogenesis have been reported, and several potential treatment strategies have also been proposed. However, there is still no effective strategy approved by the Food and Drug Administration for the treatment of liver fibrosis yet.
Recent studies reported that pathological angiogenesis and capillarization of the sinusoids are strongly correlated with progression of CLDs and may act as initiators of liver fibrogenesis.[ 5 , 6 , 7 ] During liver fibrogenesis, a variety of pro‐angiogenic factors are abnormally expressed, including vascular endothelial growth factors (VEGFs), hypoxia‐inducible factors (HIFs), fibroblast growth factors (FGFs), angiopoietins (Angs), and platelet‐derived growth factors (PDGFs).[ 5 , 6 , 7 , 8 , 9 ] Therefore, anti‐angiogenic therapy appears to provide a promising strategy for blocking or slowing down liver fibrosis. However, although there is some experimental evidence that inhibiting angiogenesis ameliorates the development of liver fibrosis in animal models,[ 10 , 11 , 12 ] so far, no anti‐angiogenic agents have been clinically applied for liver fibrosis therapy. Moreover, differential roles of angiogenesis in the induction of fibrogenesis and the resolution of fibrosis in liver are observed. For example, neutralizing VEGF alleviates liver fibrosis,[ 13 , 14 , 15 ] whereas administrating VEGF promotes liver fibrosis resolution.[ 16 , 17 , 18 , 19 ]
Liver consists of repeating anatomical units called lobules. In each hepatic lobule, blood flows from the portal vein and hepatic artery through the liver sinusoid toward the central vein, forming gradients of oxygen, nutrition, and hormones. Consistent with these graded microenvironments, liver zonation with different metabolic pathways is formed along the lobular axis.[ 20 , 21 ] The structures of each liver microvessel is different: The portal vessels and central vessels are lined by a continuous endothelial cells (ECs) lying on a basement membrane, and liver sinusoids are lined by fenestrated and discontinuous ECs. Although the capillarization of the sinusoids are reported to be strongly correlated with liver fibrogenesis,[ 5 , 6 , 7 ] the roles of portal vessels and central vessels in liver fibrogenesis are still unclear. Recently, we identified the leukocyte cell–derived chemotaxin 2 (LECT2)/tyrosine kinase with immunoglobulin‐like and epidermal growth factor–like domains 1 (Tie1) signaling pathway. It regulates portal angiogenesis and sinusoid capillarization, plays an important role in liver fibrogenesis, and is a potential target for the therapy of liver fibrosis.[ 22 ] We further revealed that portal angiogenesis, central angiogenesis, and sinusoidal capillarization play different roles in liver fibrogenesis. Considering that a single vascular EC regulator is not enough to fully regulate these three different vessels for liver fibrosis treatment, we propose that a combinational regulation of multiple different EC signaling pathways may achieve a better therapeutic effect on liver fibrosis.
In this study, we observed the changes of three different liver blood vessels during fibrogenesis by continuously monitoring the CCl4‐induced mouse liver fibrosis samples. We further performed a proof‐of‐concept experiment by simultaneously regulating two signaling pathways of LECT2/Tie1 and VEGF/VEGFR. The adeno‐associated viral vector serotype 9 (AAV9) with a short hairpin RNA (shRNA) of LECT2 (AAV9‐LECT2‐shRNA, targeting mouse LECT2 to inhibit LECT2/Tie1 signaling) combined with recombinant VEGF (rVEGF, VEGF/VEGFR signaling activator) or bevacizumab (VEGF neutralizing antibody, VEGF/VEGFR signaling inhibitor) was tested to explore a strategy of vascular‐targeted therapy for liver fibrosis.
MATERIALS AND METHODS
Animal studies
All animal studies were performed in male mice unless otherwise indicated. Mice were kept in a standard 12‐h light–dark cycle under the specific‐pathogen–free conditions and allowed for free access to water and food. Animal‐related research protocols are consistent with the US Public Health Service Policy on Use of Laboratory Animals and were approved by the Ethics Committee on Use and Care of Animals of Southern Medical University (code: 2020072).
The CCl4‐induced mice fibrosis model was performed as we previously reported.[ 22 , 23 ] To induce chronic liver fibrosis, 6–8‐week‐old male C57BL/6J mice received an i.p. injection of CCl4 (2 ml/kg, in olive oil at a ratio of 1:4, twice a week for 6 weeks; Sigma‐Aldrich). Three weeks after the first CCl4 injection, mice were treated with AAV9‐LECT2 shRNA (1 × 10¹¹ vg/mouse, i.v.; 46081404, Hanbio Tech, Shanghai, China), rVEGF (0.25 mg/kg, i.p., twice a week for 3 weeks; 50159‐MNAB, Sino Biological Inc.), bevacizumab (2 mg/kg, i.p., twice a week for 3 weeks; A2006, Selleck), the combination of AAV9‐LECT2‐shRNA and rVEGF, or the combination of AAV9‐LECT2‐shRNA and bevacizumab, respectively. The serum samples and the liver tissues were harvested at different time points for subsequent analyses.
To induce NASH, 9‐week‐old male mice were fed a choline‐deficient, L‐amino acid–defined, high‐fat diet (CDAA HFD; A06071302, Research Diets) for 12 weeks. The chow diet group was fed normal diet as control. The liver tissues were harvested at different time points for subsequent analyses.
For sirius red staining, the 3.5‐µm paraffin sections were baked, dewaxed, and hydrated. Then, the sections were stained with sirius red (DC0041, LEAGENE) for 1 h and rinsed with running water to remove the staining solution on the surface of sections. The nuclei were stained with hematoxylin staining solution (Mayer type) for 5 min and rinsed with water for 10 min. After routine dehydration and transparency, the sections were sealed with neutral gum and observed under the microscope. The staining results were quantified using Nikon Elements software. Eight random fields from each section were analyzed under the magnification of ×40. Five random sections from each mouse were analyzed, and data from 4–10 mice per group were used in the comparison among different treatment groups.
Immunofluorescence
Immunofluorescent staining of mouse liver tissues was performed as we reported.[ 22 , 23 ] Briefly, mouse liver tissues were fixed with 10% neutral buffered formalin, cut into sections of 3.5‐µm thickness, incubated with ethylene diamine tetraacetic acid (50× Key GENE BioTECH KGIHC002) for 15 min at 100% power at 120ºC. After the nonspecific binding sites were blocked with goat serum for 1 h at 37ºC, the sections were incubated with appropriate primary antibodies at 4ºC overnight, washed extensively in PBS, and incubated with Alexa 488/594 conjugated secondary antibodies (Cytoskeleton Inc.) for 1 h. Sections were then counterstained with DAPI, washed, and mounted for observation under a scanning confocal microscope (Fluoview FV1000, Olympus). The following primary antibodies were used for immunofluorescence: anti‐CD31 antibody (1:50; 77699s, CST) and anti–glutamine synthetase (GS) antibody (1:50; ab125724, Abcam).
CD31+ portal vessels (excluding diameters ≤30 µm) and CD31+ central veins were manually counted based on staining of CD31 and GS. Six to eight randomly chosen fields from each section were analyzed.
Immunohistochemistry
Mouse liver tissues were fixed in 10% neutral buffered formalin, dehydrated, and embedded in paraffin, as we previously reported.[ 22 , 23 ] Sections of 3.5‐µm thickness were incubated in citrate buffer (pH 6.0, BOSTER AR0024) for 15 min at 120ºC, and the endogenous peroxidase was blocked by 3% H2O2 for 10 min. The slides were incubated with 10% bovine serum albumin in PBS for 30 min at 37ºC to block the nonspecific binding sites, followed by incubation with appropriate primary antibodies for overnight at 4ºC, and then with horseradish peroxidase anti‐rabbit IgG or anti‐mouse IgG antibodies for 30 min. Color was then developed by incubation with DAB Substrate kit (ORIGENE ZLI‐9019). After washing in PBS, tissue sections were counterstained with hematoxylin and viewed under a microscope. Major primary antibodies used in the study include anti‐CD31 antibody (1:100; 77699s, CST), anti‐GS antibody (1:2000; ab49873, Abcam),[ 24 , 25 , 26 , 27 ] anti–lymphatic endothelial receptor‐1 (LYVE1) antibody (1:4000; ab281587, Abcam), and anti–α‐smooth muscle actin (α‐SMA) antibody (1:800; A2547, Sigma).
CD31+ portal vessels (excluding diameters ≤30 µm) and CD31+ central veins were manually counted based on staining of CD31 and GS. Six to eight randomly chosen fields from each section were analyzed.
Liver biochemistry tests
Serum albumin (Alb), total protein (TP), alanine aminotransferase (ALT), and aspartate aminotransferase (AST) were analyzed on an Automatic Biochemical Analyser (BS‐240VET, Mindray).
Quantitative real‐time PCR
Total RNA from mouse livers were extracted using the Trizol reagent, and reverse‐transcribed using EvoM‐MLV RT Premix for qPCR (AG11706, Accurate Biotechnology, Hunan). The resulting cDNAs were used for PCR using the SYBR Green Premix Pro Taq HS qPCR Kit (AG11701, Accurate Biotechnology, Hunan). All PCR reactions were conducted in the 500 Fast qPCR System (4351106, Applied Biosystems) in triplicates. All data were normalized against endogenous glyceraldehyde 3‐phosphate dehydrogenase (GAPDH) controls of each sample. The relative quantitation value for each target gene compared with the calibrator for that target is expressed as 2−(Ct–Cc) (where Ct and Cc are the mean threshold cycle differences after normalizing to GAPDH). Relative gene expression (normalized to endogenous control GAPDH) was calculated using the comparative Ct method formula 2−ΔΔCt. Primers for quantitative PCR were designed using NCBI Primer‐BLAST. The following primer sequences (all 5′ to 3′) were used for quantitative real‐time PCR from mouse livers: GAPDH: Forward: 5′‐AGAAGGTGGTGAAGCAGGCATC‐3′, Reverse: 5′‐CGAAGGTGGAAGAGTGGGAGTTG‐3′; LECT2: Forward: 5′‐GGACGTGTGACAGCTATGGC‐3′, Reverse: 5′‐TCCCAGTGAATGGTGCATACA‐3′; Tie1: Forward: 5′‐AATGCCGCGTATCGACTTCT‐3′, Reverse: 5′‐GACCACAAGCTGACGGCTCT‐3′; VEGFA: Forward: 5′‐GCAGCTTGAGTTAAACGAACG‐3′, Reverse: 5′‐GGTTCCCGAAACCCTGAG‐3′; VEGFR2: Forward: 5′‐CC CCAAATTCCATTATGACAAC‐3′, Reverse: 5′‐CTGGGA TCACTTTTACTTCTGGTT‐3′; ACTA2: Forward: 5′‐GAG CATCCGACACTGCTGAC‐3′, Reverse: 5′‐GCACAGCCT GAATAGCCACA‐3′; TGFβ1: Forward: 5′‐GCGGCAGCTG TACATTGACT‐3′, Reverse:5′‐GCTGTACTGTGTGTCCA GGC‐3; COL4: Forward:5′‐GAAAAAGGCGAACAAGG TCTTC‐3′, Reverse: 5′‐CAGGAGGCCCTCTATCACCA‐3′; FN1: Forward: 5′‐ATGTGGACCCCTCCTGATAGT‐3′, Reverse: 5′‐GCCCAGTGATTTCAGCAAAGG‐3′. COL1A1: Forward: 5′‐GAAACCCGAGGTATGCTTGA‐3′, Reverse: 5′‐GGGTCCCTCGACTCCTACAT‐3′; CD34: Forward: 5′‐CCGAGCCATATGCTTACACA‐3′, Reverse: 5′‐ACCTCACTTCTCGGATTCCA‐3′.
Scanning electron microscopy
The scanning electron microscopy was performed as reported.[ 22 ] Perfusion fixation of the mouse liver was performed with the mice under general anesthesia with 0.6% pentobarbital sodium (10 ml/kg). Images were obtained using Hitachi S‐3000N scanning electron microscope. The average fenestration diameter, porosity (%), and fenestration frequency of the liver sinusoids were calculated in four random fields from each section at approximately ×10,000 magnification using Image J software. Average fenestration diameter was calculated as the average of all fenestration diameters (excluding gaps if ≥250 nm). Porosity was calculated by the following equation: porosity (%) = ∑ (πr2)/(total area analyzed – ∑ [area of gaps, µm2]) × 100. Fenestration frequency was calculated by the following formula: fenestration frequency = total number of fenestrations/(total area analyzed – ∑ [area of gaps, µm2]).
Statistics
The experimental data were statistically analyzed by Student t test or paired t‐test. All data are presented as mean ± SEM. A p < 0.05 was considered statistically significant. In all cases, data from at least three independent experiments were used. All calculations were performed using SPSS software package. No randomization was used. No blinding was done. Power calculations were not done to predetermine sample sizes.
RESULTS
Changes of portal vessels, central vessels, and sinusoid during CCl4‐induced liver fibrogenesis
We first treated mice with CCl4 for 6 weeks, and by the end, liver fibrosis had been completely established. GS staining was used to distinguish the pericentral areas from the periportal areas,[ 24 , 25 , 26 , 27 ] and CD31 staining was used to indicate the blood vessels (Figure 1A). As reported, during liver fibrogenesis, central‐to‐central bridging is formed.[ 28 ] The number of CD31‐positive vessels in periportal area (GS‐negative area) and pericentral area (GS‐positive area) were counted, respectively. Surprisingly, the number of periportal vessels in CCl4‐treated liver tissues were significantly decreased, whereas the number of pericentral vessels in CCl4‐treated liver tissues were significantly increased (Figure 1B,C) when compared with their corresponding control samples in the oil‐treated liver tissues.
FIGURE 1.
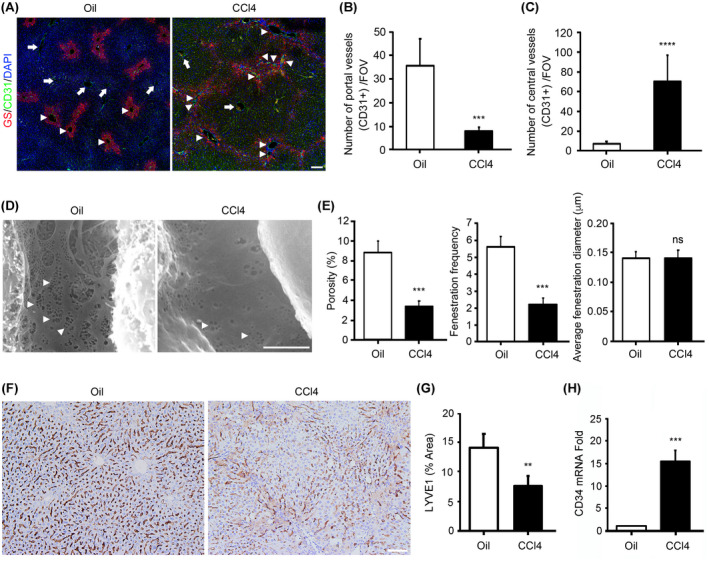
Changes of portal vessels, central vessels, and sinusoid during CCl4‐induced liver fibrogenesis. (A) C57BL/6J mice were injected with CCl4 for 6 weeks to induce fibrosis. Harvested liver tissues were processed for immunofluorescence staining for glutamine synthetase (GS; pericentral area marker) and CD31 (endothelial marker). Slides were counterstained with DAPI. Arrows, portal vessels; arrowheads, central vessels. Scale bar, 100 μm. (B) The number of CD31‐positive vessels in the periportal area was measured. (C) The number of CD31‐positive vessels in the pericentral area was measured. (D) Scanning electron micrographs show the hepatic sinusoids in the liver tissues from C57BL/6 mice treated with oil (Oil) and C57BL/6 mice treated with CCl4. Arrowheads, liver sinusoid endothelial cell (LSEC) fenestrae. Scale bar, 2.5 mm. (E) Porosity, fenestration frequency, and average fenestration diameter were analyzed by ImageJ. (F) C57BL/6J mice were injected with CCl4 for 6 weeks to induce fibrosis. Harvested liver tissues were processed for immunohistochemistry staining for lymphatic endothelial receptor‐1 (LYVE1; LSEC marker). Scale bar, 100 μm. (G) LYVE1‐positive area was analyzed by ImageJ. (H) Quantitative real‐time PCR was used to analyze the mRNA levels of CD34. n = 5/group. Mean ± SEM. **p < 0.01, ***p < 0.001, ****p < 0.0001. FOV, field of view; ns, not significant
As capillarization of the sinusoids results in a distorted structure of hepatic sinusoids and loss of specific endothelial fenestration, we examined the level of fenestration in the mouse livers of CCl4‐induced liver fibrosis models using scanning electron microscopy. Liver sinusoid endothelial cells (LSECs) from CCl4‐treated mice lost their fenestration, indicating increased sinusoid capillarization (Figure 1D,E). Decreased expression of LYVE1 and increased expression of CD34 have also been used as the characteristics of capillarization.[ 21 ] Our data showed that LYVE1 staining was significantly decreased in the mouse livers of CCl4‐induced liver fibrosis models (Figure 1F,G), and the mRNA expression of CD34 was significantly increased in the mouse livers of CCl4‐induced liver fibrosis models (Figure 1H).
These results show that during liver fibrogenesis, portal vessels were decreased, central vessels were increased, and sinusoid capillarization was increased.
Liver vascular changes occur at very early stage of fibrogenesis
Next, we studied when these vascular changes began to appear. Livers were harvested on Day 0, 1, 1.5, 2, 2.5, 4, 8, 11, 15, 22, 36, and 42 after the first CCl4 treatment, respectively (Figure S1A). These continuously collected samples allowed us to trace changes in hepatic lobule structure and blood vessels.
Because GS is a widely accepted marker of pericentral areas,[ 24 , 25 , 26 , 27 ] we used GS staining to indicate the changes of pericentral areas. Surprisingly, GS‐positive areas expanded on Day 1; on Day 1.5 and Day 2, a large number of scattered GS cells appeared between adjacent GS‐positive areas; on Day 4, the adjacent GS‐positive areas were connected together, indicating the formation of central‐to‐central bridging; after Day 4, the adjacent GS positive areas remained connected throughout the process of liver fibrosis (Figure S1B).
Accordingly, the number of CD31‐positive vessels in periportal areas (i.e., GS‐negative areas) and pericentral areas (i.e., GS‐positive areas) were counted at different time points. The number of periportal vessels decreased significantly from Day 4 after CCl4 treatment and reached the lowest point on Day 22 (Figure 2A,B), whereas the number of pericentral vessels increased significantly from Day 1 after CCl4 treatment and reached the highest point on Day 4 (Figure 2A,C). LYVE1 staining decreased significantly from Day 1 after CCl4 treatment and reached the lowest point on Day 4 (Figure 2D,E). The mRNA expression of CD34 increased significantly from Day 2 after CCl4 treatment and reached the highest point on Day 22 (Figure 2F).
FIGURE 2.

Changes of portal vessels, central vessels, and sinusoid at different time points during liver fibrogenesis. (A) C57BL/6J mice were injected with CCl4 to induce fibrosis. Harvested liver tissues at different time points were processed for immunofluorescence staining for GS (pericentral area marker) and CD31 (endothelial marker). Slides were counterstained with DAPI. Arrows, portal vessels; arrowheads, central vessels. Scale bar, 100 μm. (B) The number of CD31‐positive vessels in the periportal area was measured. (C) The number of CD31‐positive vessels in the pericentral area was measured. (D) C57BL/6J mice were injected with CCl4 to induce fibrosis. Harvested liver tissues at different time points were processed for immunohistochemistry staining for LYVE1 (LSEC marker). Scale bar, 100 μm. (E) LYVE1‐positive area was analyzed by ImageJ. (F) Quantitative real‐time PCR was used to analyze the mRNA levels of CD34. (G) C57BL/6J mice were injected with CCl4 to induce fibrosis. Harvested liver tissues at different time points were stained using sirius red for fibrosis analysis. Scale bar, 200 μm. (H) Sirius red–positive area was analyzed by ImageJ. n = 5/group. Mean ± SEM. *p < 0.05, **p < 0.01, ***p < 0.001, ****p < 0.0001
Sirius red staining showed that fibrosis deposition was significantly increased from Day 4 after CCl4 treatment and reached the highest point on Day 22 (Figure 2G,H).
These results showed that pericentral areas expanded, and pericentral angiogenesis and sinusoid capillarization occurred at very early stage (Day 1 after CCl4 treatment), followed by the formation of central‐to‐central bridging, decrease of periportal vessels, and fibrosis deposition (Day 4 after CCl4 treatment).
Changes of portal vessels, central vessels, and sinusoid in NASH model
Mice were fed a choline‐deficient, L‐amino acid–defined, high‐fat diet to induce NASH, and livers were harvested at Week 3, 6, 9, and 12. Due to the poor resolution of co‐staining GS and CD31 by immunofluorescence in NASH sample sections, we stained GS and CD31 by immunohistochemistry in serial sections. The number of CD31‐positive vessels in periportal areas and pericentral areas were counted at different time points. At Week 3, the adjacent pericentral areas had been connected together (Figure 3A). The number of periportal vessels decreased significantly at Week 3 and reached the lowest point at Week 12 (Figure 3A,B), whereas the number of central vessels increased significantly at Week 3 and reached the highest point at Week 12 (Figure 3A,C). LYVE1 staining decreased significantly at Week 3 and remained at this level thereafter (Figure 3D,E). The mRNA expression of CD34 increased significantly at Week 3 and reached the highest point at Week 12 (Figure 3F). Sirius red staining showed that fibrosis deposition was significantly increased at Week 3 and reached the highest point at Week 9 (Figure 3G,H).
FIGURE 3.

Changes of portal vessels, central vessels, and sinusoid in NASH model. (A) C57BL/6J mice were fed a choline‐deficient, L‐amino acid–defined, high‐fat diet for 12 weeks to induce NASH. Serial sections of harvested liver tissues at different time points were processed for immunohistochemistry staining for GS (pericentral area marker, upper) and CD31 (endothelial marker, lower). The red dotted line in lower image indicates GS‐positive area according to GS staining in upper image. Arrows, portal vessels; arrowheads, central vessels. Scale bar, 100 μm. (B) The number of CD31‐positive vessels in the periportal area was measured. (C) The number of CD31‐positive vessels in the pericentral area was measured. (D) Harvested liver tissues from NASH model at different time points were processed for immunohistochemistry staining for LYVE1 (LSEC marker). Scale bar, 100 μm. (E) LYVE1‐positive area was analyzed by ImageJ. (F) Quantitative real‐time PCR was used to analyze the mRNA levels of CD34. (G) Harvested liver tissues from NASH model at different time points were stained using sirius red for fibrosis analysis. Scale bar, 200 μm. (H) Sirius red–positive area was analyzed by ImageJ. n = 5/group. Mean ± SEM. *p < 0.05, **p < 0.01, ***p < 0.001, ****p < 0.0001
Effects of AAV9‐LECT2‐shRNA, bevacizumab, and rVEGF on liver fibrosis induced by CCl4 in mice
As reported previously,[ 13 , 14 , 22 ] hepatic expressions of LECT2, Tie1, VEGF, and VEGFR2 significantly increased during liver fibrosis development after CCl4 treatment (Figure S2). We next assessed the effects of AAV9‐LECT2‐shRNA, bevacizumab, and rVEGF in a mouse model of CCl4‐induced liver fibrosis (Figure 4A). Knockdown of LECT2 was confirmed in AAV9‐LECT2‐shRNA infected mice liver (Figure S3A). Decreased expression of Tie1 was found in mice liver treated with the combination of AAV9‐LECT2‐shRNA and bevacizumab (Figure S3B). Increased expression of VEGF was found in mice liver treated with AAV9‐LECT2‐shRNA, bevacizumab, and the combination of AAV9‐LECT2‐shRNA and VEGF (Figure S3C). Increased expression of VEGFR2 was found in mice liver treated with AAV9‐LECT2‐shRNA, bevacizumab, the combination of AAV9‐LECT2‐shRNA and bevacizumab, and the combination of AAV9‐LECT2‐shRNA and VEGF (Figure S3D). Sirius red staining showed that, compared with that in the control group, fibrosis deposition was significantly reduced in the AAV9‐LECT2‐shRNA, bevacizumab, and rVEGF treatment group, respectively (Figure 4B,C). Furthermore, the combination treatment of AAV9‐LECT2‐shRNA and bevacizumab, and that of AAV9‐LECT2‐shRNA and rVEGF, showed a more potent therapeutic effect on CCl4‐induced liver fibrosis than individual treatment, respectively (Figure 4B,C). Liver fibrogenesis was further evaluated by α‐SMA staining and quantitative real‐time PCR for the common fibrotic factors, including ACTA2, TGFB1, FN1, and COL1A1. Compared with that in the control group, α‐SMA staining was significantly reduced in the AAV9‐LECT2‐shRNA, bevacizumab, and rVEGF treatment groups, respectively (Figure 4D,E). Furthermore, the combinational treatment of AAV9‐LECT2‐shRNA and bevacizumab showed a more potent effect on reduction of α‐SMA staining than individual treatment (Figure 4D,E). Quantitative real‐time PCR analysis of the expression levels of fibrotic factors ACTA2, TGFB1, FN1, and COL1A1 showed that the combinational treatment of AAV9‐LECT2‐shRNA and bevacizumab showed a more potent effect on reducing the expression of fibrotic factors than the individual treatments of AAV9‐LECT2‐shRNA, bevacizumab or rVEGF, as well as the combination of AAV9‐LECT2‐shRNA and rVEGF (Figure 4F).
FIGURE 4.

Effects of adeno‐associated viral vector serotype 9 (AAV9)– leukocyte cell–derived chemotaxin 2 (LECT2)–short hairpin RNA (shRNA), recombinant vascular endothelial growth factor (rVEGF), and bevacizumab on liver fibrogenesis. (A) Schematic overview of experimental design for (B) to (F). The liver tissues were harvested from CCl4‐treated control C57BL/6J mice (Control, n = 5–8), CCl4‐treated and AAV9‐LECT2‐shRNA‐infected C57BL/6J mice (AAV9‐LECT2‐shRNA, n = 5–7), CCl4‐treated and bevacizumab‐injected C57BL/6J mice (bevacizumab, n = 5), CCl4‐treated and rVEGF‐injected C57BL/6J mice (rVEGF, n = 5), CCl4‐treated C57BL/6J mice with the combination treatment of AAV9‐LECT2‐shRNA and bevacizumab (AAV9‐LECT2‐shRNA + bevacizumab, n = 5), and CCl4‐treated C57BL/6J mice with the combination treatment of AAV9‐LECT2‐shRNA and rVEGF (AAV9‐LECT2‐shRNA + rVEGF, n = 4) and stained using sirius red (B) and α‐smooth muscle actin (α‐SMA) (D) for fibrosis analysis. Scale bar, 200 μm. (C) Sirius red–positive area was analyzed by ImageJ. (E) α‐SMA‐positive area was analyzed by ImageJ. (F) Quantitative real‐time PCR was used to analyze the mRNA levels of ACTA2, TGFB1, FN1, and COL1A1 in livers harvested from each group. Mean ± SEM. *p < 0.05, **p < 0.01, ***p < 0.001, ****p < 0.0001
Effects of different treatments on portal vessels, central vessels, and liver sinusoids
Next, we examined the changes of portal vessels, central vessels, and liver sinusoids during the treatment of liver fibrosis. Compared with the control group, increased portal vessels and decreased central vessels were observed in AAV9‐LECT2‐shRNA‐infected mice (Figure 5A‐C). Bevacizumab treatment significantly reduced the number of central vessels (Figure 5A‐C). Meanwhile, rVEGF treatment significantly increased the numbers of portal vessels and central vessels, respectively (Figure 5A‐C). Furthermore, compared with bevacizumab treatment, the combinational treatment of AAV9‐LECT2‐shRNA and bevacizumab increased the number of portal vessels and decreased the number of central vessels (Figure 5A‐C). Compared with rVEGF treatment, the combinational treatment of AAV9‐LECT2‐shRNA and rVEGF decreased the number of central vessels (Figure 5A‐C). These results and the results in Figure 4 suggest that the increase of portal vessels alleviated liver fibrosis, whereas the increase of central vessels aggravated liver fibrosis.
FIGURE 5.

Effects of AAV9‐LECT2‐shRNA, rVEGF, and bevacizumab on liver portal vessels and central vessels. (A) C57BL/6J mice were injected with CCl4 to induce liver fibrosis and treated with AAV9‐LECT2‐shRNA, rVEGF, and bevacizumab, as shown in Figure 4A. Harvested liver tissues were processed for immunofluorescence staining for GS (pericentral area marker) and CD31 (endothelial marker). Slides were counterstained with DAPI. Arrows, portal vessels; arrowheads, central vessels. Scale bar, 100 μm. (B) The number of CD31‐positive vessels in the periportal area was measured. (C) The number of CD31‐positive vessels in the pericentral area was measured. Mean ± SEM. *p < 0.05, **p < 0.01, ***p < 0.001
Scanning electron microscopy analysis, LYVE1 staining, and CD34 mRNA measurement showed that compared with that in the control group, decreased sinusoid capillarization was observed in AAV9‐LECT2‐shRNA‐infected mice. Bevacizumab treatment significantly decreased sinusoid capillarization and rVEGF treatment significantly increased sinusoid capillarization, respectively. Compared with the bevacizumab treatment alone, the combinational treatment of AAV9‐LECT2‐shRNA and bevacizumab further decreased sinusoid capillarization. Compared with the rVEGF treatment alone, the combinational treatment of AAV9‐LECT2‐shRNA and rVEGF also further decreased sinusoid capillarization (Figure 6A‐E; Figure S4). These results and the results in Figure 4 suggest that the decrease of sinusoid capillarization alleviated liver fibrosis.
FIGURE 6.

Effects of AAV9‐LECT2‐shRNA, rVEGF, and bevacizumab on liver sinusoid capillarization. (A) Scanning electron micrographs show the hepatic sinusoids in the liver tissues from mice in each group, as shown in Figure 4A. Arrowheads, LSEC fenestrae. Scale bar, 2.5 μm. (B) Porosity, fenestration frequency, and average fenestration diameter were analyzed by ImageJ. (C) Harvested liver tissues from each group were processed for immunohistochemistry staining for LYVE1 (LSEC marker). Scale bar, 100 μm. (D) LYVE1‐positive area was analyzed by ImageJ. (E) Quantitative real‐time PCR was used to analyze the mRNA levels of CD34. Mean ± SEM. *p < 0.05, **p < 0.01, ***p < 0.001
Evaluation of liver function and body weight in mice
Serum levels of Alb, TP, ALT, and AST were measured to indicate the functional and injury conditions of liver. As shown in Figure 7, the combinational treatment of AAV9‐LECT2‐shRNA and rVEGF, but not the combinational treatment of AAV9‐LECT2‐shRNA and bevacizumab, significantly decreased Alb level and TP level (Figure 7A,B). The combinational treatment of AAV9‐LECT2‐shRNA and bevacizumab, but not the combinational treatment of AAV9‐LECT2‐shRNA and rVEGF, significantly decreased ALT level and AST level (Figure 7C,D). Furthermore, the combinational treatment of AAV9‐LECT2‐shRNA and rVEGF, but not the combinational treatment of AAV9‐LECT2‐shRNA and bevacizumab, significantly reduced the body weight of mice (Figure 7E). These results suggest that the combinational treatment of AAV9‐LECT2‐shRNA and rVEGF lead to serious side effects, and the combinational treatment of AAV9‐LECT2‐shRNA and bevacizumab might be a better therapeutic strategy for liver fibrosis.
FIGURE 7.

Effects of AAV9‐LECT2‐shRNA, rVEGF, and bevacizumab on liver function and body weight in mice. C57BL/6J mice were injected with CCl4 to induce liver fibrosis and treated with AAV9‐LECT2‐shRNA, rVEGF, and bevacizumab, as shown in Figure 4A. Serum levels of albumin (Alb) (A), total protein (TP) (B), alanine aminotransferase (ALT) (C) and aspartate aminotransferase (AST) (D) were measured. (E) The mice body weight was measured at the indicated time. Mean ± SEM. *p < 0.05, **p < 0.01, ***p < 0.001, ****p < 0.0001
DISCUSSION
In the current study, we report that during CCl4‐induced liver fibrogenesis, liver vascular changes occurred at very early stage. Portal vessels decreased, sinusoid capillarization increased, and central vessels increased. We propose that the combined regulation of multiple different EC regulatory signaling pathways would provide potent treatment strategies for liver fibrosis. We conducted a proof‐of‐concept trial by combining the regulation of LECT2/Tie1 signaling with the regulation of VEGF/VEGFR signaling. The results show that the combinational treatment of AAV9‐LECT2‐shRNA and bevacizumab significantly improved the therapeutic effects on liver fibrosis (Figure 8).
FIGURE 8.

Schematic illustration of our proposed model. During liver fibrogenesis, portal vessels decrease, sinusoid capillarization increases, and central vessels increase. The increase of portal vessels alleviates liver fibrosis; the increase of central vessels aggravates liver fibrosis; and the increase of sinusoid capillarization aggravates liver fibrosis. LECT2/tyrosine kinase with immunoglobulin‐like and epidermal growth factor–like domains 1 (Tie1) signaling decreases portal vessels, increases sinusoid capillarization, and increase central vessels. VEGF/VEGFR signaling increases portal vessels, increases sinusoid capillarization, and increases central vessels. The combination treatment of AAV9‐LECT2‐shRNA and bevacizumab significantly improved the therapeutic effects on liver fibrosis. CV, central vein; PV, portal vein
Fibrotic liver injury is a worldwide disease that results in loss of liver function, and yet no effective treatments are available. Cumulative evidence clearly demonstrates that liver fibrogenesis is accompanied by abnormal angioarchitecture of the liver, which is closely associated with liver fibrosis processing. Various pro‐angiogenic factors, including VEGFs, HIFs, FGFs, Angs and PDGFs, are found to be abnormally expressed and significantly regulate liver fibrogenesis.[ 5 , 6 , 7 , 8 , 9 ] However, the effect of current antiangiogenic therapy on liver fibrosis is not satisfactory. Different blood vessels are located in different areas of hepatic lobules. In each hepatic lobule, blood flows from the portal vein and hepatic artery through the liver sinusoid toward the central vein. Although liver angiogenesis and liver sinusoid capillarization have been observed in many studies of liver fibrosis, few studies have noticed the different changes of blood vessels in three different lobule areas, nor the different roles of these three different blood vessels in liver fibrogenesis. In addition to the sinusoid capillarization reported to promote liver fibrosis previously, our current study has findings in portal and central vessels: Their changes and roles during liver fibrogenesis are apparently opposite. During liver fibrogenesis, portal vessels are decreased, whereas central vessels are increased; increased portal vessels inhibit liver fibrosis, while increased central vessels promote liver fibrosis. This finding makes it very complicated to treat liver fibrosis by targeting blood vessels. Therefore, it must be considered to promote portal vessels, inhibit central vessels, and inhibit sinusoid capillarization at the same time. In this regard, it is difficult for a single vascular regulatory pathway to meet all of these requirements. Combining multiple different vascular regulatory pathways to achieve favorable regulation of different vessels would improve the therapeutic effects on liver fibrosis.
The VEGF/VEGFR signaling is suggested to play pivotal roles in angiogenesis and vascular remodeling by the regulation of EC survival and proliferation. Lots of evidence show that VEGF overexpression accelerates fibrosis by increasing hepatic collagen deposition, and inhibition of VEGF/VEGFR has been tested to treat liver fibrosis.[ 5 , 9 , 10 , 11 , 12 , 13 , 14 , 15 ] On the other hand, it is also reported that VEGF promotes liver fibrosis resolution, and inhibition of VEGF/VEGFR inhibits liver fibrosis resolution.[ 16 , 17 , 18 , 19 ] These controversial results make it difficult to treat liver fibrosis by targeting VEGF/VEGFR signaling simply and directly. In this study, we found that both rVEGF treatment and bevacizumab (VEGF neutralizing antibody) treatment have significant therapeutic effects on CCl4‐induced liver fibrosis. rVEGF treatment led to increased portal vessels, increased central vessels, and increased sinusoid capillarization, whereas bevacizumab treatment showed decreased central vessels and decreased sinusoid capillarization. We speculate from these results that portal angiogenesis inhibits fibrosis, central angiogenesis promotes fibrosis, and sinusoid capillarization also promotes liver fibrosis. This may help explain the contradictory effects of rVEGF and bevacizumab on the treatment of liver fibrosis. On the one hand, they are conducive to the treatment, whereas on the other hand, they are unfavorable in certain conditions. The combination of rVEGF and bevacizumab is obviously ineffective. It is necessary to combine with additional vascular regulators to enhance the effects of rVEGF or bevacizumab, respectively.
LECT2‐Tie1 is a signaling pathway that regulates the function of vascular endothelial cells and plays an important role in liver fibrosis.[ 22 ] Secreting protein LECT2 was initially identified as a chemoattractant of neutrophils, stimulating the growth of chondrocytes and osteoblasts[ 29 , 30 ] and participating in many pathological conditions, such as sepsis,[ 31 ] diabetes,[ 32 ] systemic amyloidosis,[ 33 , 34 ] liver cancer,[ 35 ] NAFLD,[ 36 ] and hematopoietic stem cell homeostasis.[ 37 ] EC‐specific receptor Tie1 is essentially required for normal vascular development and function, and had been an orphan receptor for a long time.[ 38 , 39 , 40 ] Recently, we reported that LECT2 binds to Tie1 directly to inhibit portal angiogenesis, induce sinusoid capillarization, and promote liver fibrogenesis. Knockdown of LECT2 by AAV9‐LECT2‐shRNA inhibits sinusoid capillarization, induces portal angiogenesis, and attenuates liver fibrosis.( 22 ) Therefore, AAV9‐LECT2‐shRNA might have an advantage in further improving the therapeutic effects on liver fibrosis when applied in combination with rVEGF or bevacizumab. As expected, the combinational treatment of AAV9‐LECT2‐shRNA and rVEGF decreased sinusoid capillarization, and the combinational treatment of AAV9‐LECT2‐shRNA and bevacizumab increased portal angiogenesis. Surprisingly, AAV9‐LECT2‐shRNA also inhibited central angiogenesis, and the combinational treatment of AAV9‐LECT2‐shRNA and rVEGF decreased central angiogenesis accordingly. In this way, AAV9‐LECT2‐shRNA makes up for the defects of rVEGF and bevacizumab in targeting liver blood vessels for liver fibrosis treatment, and strengthens their advantages, respectively. Consistently, the combinational treatment of AAV9‐LECT2‐shRNA and rVEGF and that of AAV9‐LECT2‐shRNA and bevacizumab showed a more potent therapeutic effect on CCl4‐induced liver fibrosis. However, the combinational treatment of AAV9‐LECT2‐shRNA and rVEGF induced body weight loss and liver function decline, indicating serious side effects. The combination of AAV9‐LECT2‐shRNA and bevacizumab showed both improved therapeutic effects and less side effects, which is a therapeutic strategy worthy of further exploring the clinical effect. Interestingly, AAV9‐LECT2‐shRNA promoted portal angiogenesis, inhibited central angiogenesis, and inhibited sinusoid capillarization at the same time. Further study is needed to uncover the mechanism of the different regulatory effects of LECT2 signaling on these different vessels.
In conclusion, liver vascular changes occur at very early stage of fibrogenesis. Different liver blood vessels change differently and play different roles during liver fibrogenesis, which indicates that ECs may be essential in the initiation of liver fibrogenesis. The underlying mechanism needs to be further explored. Combining the regulation of multiple vascular regulatory pathways to promote portal angiogenesis, inhibit central angiogenesis, and inhibit sinusoid capillarization will improve the therapeutic effects of liver fibrosis. By combining the regulation of LECT2/Tie1 signaling with that of VEGF/VEGFR signaling, we find that the joint treatment of AAV9‐LECT2‐shRNA and bevacizumab significantly improved the therapeutic effect on liver fibrosis. Several other signaling pathways are reported to regulate angiogenesis or vascular remodeling, including HIFs, FGFs, Angs, and PDGFs. Next, it is worth further studying the combined regulation of various vascular regulatory pathways to provide more strategies for the treatment of liver fibrosis.
CONFLICT OF INTEREST
Nothing to report.
AUTHOR CONTRIBUTIONS
Conceptualization: Wei‐Jie Zhou and Yuan Lin. Methodology: Yuan Lin, Meng‐Qi Dong, Zhi‐Min Liu, Meng Xu, Zhi‐Hao Huang, Hong‐Juan Liu, Yi Gao, and Wei‐Jie Zhou. Validation: Yuan Lin, Meng‐Qi Dong, Zhi‐Min Liu, Meng Xu, Zhi‐Hao Huang, Hong‐Juan Liu, Yi Gao, and Wei‐Jie Zhou. Formal analysis: Yuan Lin, Meng‐Qi Dong, and Zhi‐Min Liu Investigation: Yuan Lin, Meng‐Qi Dong, Zhi‐Min Liu, and Wei‐Jie Zhou. Resources: Yi Gao and Wei‐Jie Zhou. Data curation: Yuan Lin and Wei‐Jie Zhou. Manuscript draft: Yuan Lin and Wei‐Jie Zhou. Manuscript review and editing: All authors. Visualization: Yuan Lin, Meng‐Qi Dong, Zhi‐Min Liu, and Wei‐Jie Zhou. Supervision: Yuan Lin and Wei‐Jie Zhou. Project administration: Yuan Lin and Wei‐Jie Zhou. Funding acquisition: Yuan Lin and Wei‐Jie Zhou.
Supporting information
Fig S1‐4
ACKNOWLEDGMENT
The authors thank the Central Laboratory, Southern Medical University, for providing facilities and technical support.
Lin Y, Dong M‐Q, Liu Z‐M, Xu M, Huang Z‐H, Liu H‐J, et al. A strategy of vascular‐targeted therapy for liver fibrosis. Hepatology. 2022;76:660–675. 10.1002/hep.32299
Yuan Lin, Meng‐Qi Dong, Zhi‐Min Liu, and Meng Xu contributed equally to this work.
Funding information
The National Natural Science Foundation of China (92068206 and 32000607), Key‐Area Research and Development Program of Guangdong Province (2019B020234003), Guangdong Basic and Applied Basic Research Foundation (2019A1515110145), China Postdoctoral Science Foundation (2019M660205), Guangdong Provincial Key Laboratory of Precision Medicine for Gastrointestinal Cancer (2020B121201004), Frontier Research Program of Bioland Laboratory (Guangzhou Regenerative Medicine and Health Guangdong Laboratory; 2018GZR110105002), Clinical Innovation Research Program of Bioland Laboratory (Guangzhou Regenerative Medicine and Health Guangdong Laboratory; 2018GZR0201003), and Outstanding Scholar Program of Bioland Laboratory (Guangzhou Regenerative Medicine and Health Guangdong Laboratory; 2018GZR110102004)
SEE editorial ON PAGE 558
REFERENCES
- 1. Tsochatzis EA, Bosch J, Burroughs AK. Liver cirrhosis. Lancet. 2014;383:1749–61. [DOI] [PubMed] [Google Scholar]
- 2. Pinzani M, Rosselli M, Zuckermann M. Liver cirrhosis. Best Pract Res Clin Gastroenterol. 2011;25:281–90. [DOI] [PubMed] [Google Scholar]
- 3. Bataller R, Brenner DA. Liver fibrosis. J Clin Invest. 2005;115:209–18. [DOI] [PMC free article] [PubMed] [Google Scholar]
- 4. Lim YS, Kim WR. The global impact of hepatic fibrosis and end‐stage liver disease. Clin Liver Dis. 2008;12:733–46. [DOI] [PubMed] [Google Scholar]
- 5. Coulon S, Heindryckx F, Geerts A, Van Steenkiste C, Colle I, Van Vlierberghe H. Angiogenesis in chronic liver disease and its complications. Liver Int. 2011;31:146–62. [DOI] [PubMed] [Google Scholar]
- 6. Xie G, Wang X, Wang L, Wang L, Atkinson RD, Kanel GC, et al. Role of differentiation of liver sinusoidal endothelial cells in progression and regression of hepatic fibrosis in rats. Gastroenterology. 2012;142:918–27. [DOI] [PMC free article] [PubMed] [Google Scholar]
- 7. Lafoz E, Ruart M, Anton A, Oncins A, Hernandez‐Gea V. The endothelium as a driver of liver fibrosis and regeneration. Cells Basel. 2020;9:929. [DOI] [PMC free article] [PubMed] [Google Scholar]
- 8. Pauta M, Ribera J, Melgar‐Lesmes P, Casals G, Rodríguez‐Vita J, Reichenbach V, et al. Overexpression of angiopoietin‐2 in rats and patients with liver fibrosis. Therapeutic consequences of its inhibition. Liver Int. 2015;35:1383–92. [DOI] [PubMed] [Google Scholar]
- 9. Corpechot C, Barbu V, Wendum D, Kinnman N, Rey C, Poupon R, et al. Hypoxia‐induced VEGF and collagen I expressions are associated with angiogenesis and fibrogenesis in experimental cirrhosis. Hepatology. 2002;35:1010–21. [DOI] [PubMed] [Google Scholar]
- 10. Thabut D, Routray C, Lomberk G, Shergill U, Glaser K, Huebert R, et al. Complementary vascular and matrix regulatory pathways underlie the beneficial mechanism of action of sorafenib in liver fibrosis. Hepatology. 2011;54:573–85. [DOI] [PMC free article] [PubMed] [Google Scholar]
- 11. Elpek GO. Angiogenesis and liver fibrosis. World J Hepatol. 2015;7:377–91. [DOI] [PMC free article] [PubMed] [Google Scholar]
- 12. Nakamura I, Zakharia K, Banini BA, Mikhail DS, Kim TH, Yang JD, et al. Brivanib attenuates hepatic fibrosis in vivo and stellate cell activation in vitro by inhibition of FGF, VEGF and PDGF signaling. PLoS One. 2014;9:e92273. [DOI] [PMC free article] [PubMed] [Google Scholar]
- 13. Yoshiji H, Kuriyama S, Yoshii J, Ikenaka Y, Noguchi R, Hicklin DJ, et al. Vascular endothelial growth factor and receptor interaction is a prerequisite for murine hepatic fibrogenesis. Gut. 2003;52:1347–54. [DOI] [PMC free article] [PubMed] [Google Scholar]
- 14. Sahin H, Borkham‐Kamphorst E, Kuppe C, Zaldivar MM, Grouls C, Al‐samman M, et al. Chemokine Cxcl9 attenuates liver fibrosis‐associated angiogenesis in mice. Hepatology. 2012;55:1610–9. [DOI] [PubMed] [Google Scholar]
- 15. Huang Y, Feng H, Kan T, Huang B, Zhang M, Li Y, et al. Bevacizumab attenuates hepatic fibrosis in rats by inhibiting activation of hepatic stellate cells. PLoS One. 2013;8:e73492. [DOI] [PMC free article] [PubMed] [Google Scholar]
- 16. Yang L, Kwon J, Popov Y, Gajdos GB, Ordog T, Brekken RA, et al. Vascular endothelial growth factor promotes fibrosis resolution and repair in mice. Gastroenterology. 2014;146:1339–50. [DOI] [PMC free article] [PubMed] [Google Scholar]
- 17. Kantari‐Mimoun C, Castells M, Klose R, Meinecke A‐K, Lemberger UJ, Rautou P‐E, et al. Resolution of liver fibrosis requires myeloid cell‐driven sinusoidal angiogenesis. Hepatology. 2015;61:2042–55. [DOI] [PubMed] [Google Scholar]
- 18. Wu K, Huang R, Wu H, Liu Y, Yang C, Cao S, et al. Collagen‐binding vascular endothelial growth factor attenuates CCl4‐induced liver fibrosis in mice. Mol Med Rep. 2016;14:4680–6. [DOI] [PMC free article] [PubMed] [Google Scholar]
- 19. Park S, Kim JW, Kim JH, Lim CW, Kim B. Differential roles of angiogenesis in the induction of fibrogenesis and the resolution of fibrosis in liver. Biol Pharm Bull. 2015;38:980–5. [DOI] [PubMed] [Google Scholar]
- 20. Halpern KB, Shenhav R, Matcovitch‐Natan O, Toth B, Lemze D, Golan M, et al. Single‐cell spatial reconstruction reveals global division of labour in the mammalian liver. Nature. 2017;542:352–6. [DOI] [PMC free article] [PubMed] [Google Scholar]
- 21. Su T, Yang Y, Lai S, Jeong J, Jung Y, McConnell M, et al. Single‐cell transcriptomics reveals zone‐specific alterations of liver sinusoidal endothelial cells in cirrhosis. Cell Mol Gastroenterol Hepatol. 2021;11:1139–61. [DOI] [PMC free article] [PubMed] [Google Scholar]
- 22. Xu M, Xu H‐H, Lin Y, Sun X, Wang L‐J, Fang Z‐P, et al. LECT2, a ligand for Tie1, plays a crucial role in liver fibrogenesis. Cell. 2019;178:1478–92. [DOI] [PubMed] [Google Scholar]
- 23. Lin Y, Fang Z‐P, Liu H‐J, Wang L‐J, Cheng Z, Tang NA, et al. HGF/R‐spondin1 rescues liver dysfunction through the induction of Lgr5+ liver stem cells. Nature Commun. 2017;8:1175. [DOI] [PMC free article] [PubMed] [Google Scholar]
- 24. Chen F, Jimenez RJ, Sharma K, Luu HY, Hsu BY, Ravindranathan A, et al. Broad distribution of hepatocyte proliferation in liver homeostasis and regeneration. Cell Stem Cell. 2020;26:27–33.e4. [DOI] [PMC free article] [PubMed] [Google Scholar]
- 25. Matsumoto T, Wakefield L, Tarlow BD, Grompe M. In vivo lineage tracing of polyploid hepatocytes reveals extensive proliferation during liver regeneration. Cell Stem Cell. 2020;26:34–47.e3. [DOI] [PMC free article] [PubMed] [Google Scholar]
- 26. Planas‐Paz L, Sun T, Pikiolek M, Cochran NR, Bergling S, Orsini V, et al. YAP, but not RSPO‐LGR4/5, signaling in biliary epithelial cells promotes a ductular reaction in response to liver injury. Cell Stem Cell. 2019;25:39–53.e10. [DOI] [PubMed] [Google Scholar]
- 27. Ma R, Martínez‐Ramírez AS, Borders TL, Gao F, Sosa‐Pineda B. Metabolic and non‐metabolic liver zonation is established non‐synchronously and requires sinusoidal Wnts. Elife. 2020;9:e46206. [DOI] [PMC free article] [PubMed] [Google Scholar]
- 28. Ghallab A, Myllys M, Holland CH, Zaza A, Murad W, Hassan R, et al. Influence of liver fibrosis on lobular zonation. Cells. 2019;8:1556. [DOI] [PMC free article] [PubMed] [Google Scholar]
- 29. Ito M, Nagata K, Kato Y, Oda Y, Yamagoe S, Suzuki K, et al. Expression, oxidative refolding, and characterization of six‐histidine‐tagged recombinant human LECT2, a 16‐kDa chemotactic protein with three disulfide bonds. Protein Expr Purif. 2003;27:272–8. [DOI] [PubMed] [Google Scholar]
- 30. Yamagoe S, Yamakawa Y, Matsuo Y, Minowada J, Mizuno S, Suzuki K. Purification and primary amino acid sequence of a novel neutrophil chemotactic factor LECT2. Immunol Lett. 1996;52:9–13. [DOI] [PubMed] [Google Scholar]
- 31. Lu X‐J, Chen J, Yu C‐H, Shi Y‐H, He Y‐Q, Zhang R‐C, et al. LECT2 protects mice against bacterial sepsis by activating macrophages via the CD209a receptor. J Exp Med. 2013;210:5–13. [DOI] [PMC free article] [PubMed] [Google Scholar]
- 32. Lan F, Misu H, Chikamoto K, Takayama H, Kikuchi A, Mohri K, et al. LECT2 functions as a hepatokine that links obesity to skeletal muscle insulin resistance. Diabetes. 2014;63:1649–64. [DOI] [PubMed] [Google Scholar]
- 33. Comenzo RL. LECT2 makes the amyloid list. Blood. 2014;123:1436–7. [DOI] [PubMed] [Google Scholar]
- 34. Said SM, Sethi S, Valeri AM, Chang A, Nast CC, Krahl L, et al. Characterization and outcomes of renal leukocyte chemotactic factor 2‐associated amyloidosis. Kidney Int. 2014;86:370–7. [DOI] [PubMed] [Google Scholar]
- 35. Ong HT, Tan PK, Wang SM, Hian LD, Ooi LL, Hui KM. The tumor suppressor function of LECT2 in human hepatocellular carcinoma makes it a potential therapeutic target. Cancer Gene Ther. 2011;18:399–406. [DOI] [PubMed] [Google Scholar]
- 36. Yoo HJ, Hwang SY, Choi J‐H, Lee HJ, Chung HS, Seo J‐A, et al. Association of leukocyte cell‐derived chemotaxin 2 (LECT2) with NAFLD, metabolic syndrome, and atherosclerosis. PLoS One. 2017;12:e174717. [DOI] [PMC free article] [PubMed] [Google Scholar]
- 37. Lu X‐J, Chen Q, Rong Y‐J, Yang G‐J, Li C‐H, Xu N‐Y, et al. LECT2 drives haematopoietic stem cell expansion and mobilization via regulating the macrophages and osteolineage cells. Nat Commun. 2016;7:12719. [DOI] [PMC free article] [PubMed] [Google Scholar]
- 38. Puri MC, Rossant J, Alitalo K, Bernstein A, Partanen J. The receptor tyrosine kinase TIE is required for integrity and survival of vascular endothelial cells. Embo J. 1995;14:5884–91. [DOI] [PMC free article] [PubMed] [Google Scholar]
- 39. Qu X, Tompkins K, Batts LE, Puri M, Baldwin HS. Abnormal embryonic lymphatic vessel development in Tie1 hypomorphic mice. Development. 2010;137:1285–95. [DOI] [PMC free article] [PubMed] [Google Scholar]
- 40. Sato TN, Tozawa Y, Deutsch U, Wolburg‐Buchholz K, Fujiwara Y, Gendron‐Maguire M, et al. Distinct roles of the receptor tyrosine kinases Tie‐1 and Tie‐2 in blood vessel formation. Nature. 1995;376:70–4. [DOI] [PubMed] [Google Scholar]
Associated Data
This section collects any data citations, data availability statements, or supplementary materials included in this article.
Supplementary Materials
Fig S1‐4