

Abstract
Developing accurate subcortical volumetric quantification tools is crucial for neurodevelopmental studies, as they could reduce the need for challenging and time‐consuming manual segmentation. In this study, the accuracy of two automated segmentation tools, FSL‐FIRST (with three different boundary correction settings) and FreeSurfer, were compared against manual segmentation of the hippocampus and subcortical nuclei, including the amygdala, thalamus, putamen, globus pallidus, caudate and nucleus accumbens, using volumetric and correlation analyses in 80 5‐year‐olds.
Both FSL‐FIRST and FreeSurfer overestimated the volume on all structures except the caudate, and the accuracy varied depending on the structure. Small structures such as the amygdala and nucleus accumbens, which are visually difficult to distinguish, produced significant overestimations and weaker correlations with all automated methods. Larger and more readily distinguishable structures such as the caudate and putamen produced notably lower overestimations and stronger correlations. Overall, the segmentations performed by FSL‐FIRST's default pipeline were the most accurate, whereas FreeSurfer's results were weaker across the structures.
In line with prior studies, the accuracy of automated segmentation tools was imperfect with respect to manually defined structures. However, apart from amygdala and nucleus accumbens, FSL‐FIRST's agreement could be considered satisfactory (Pearson correlation > 0.74, intraclass correlation coefficient (ICC) > 0.68 and Dice score coefficient (DSC) > 0.87) with highest values for the striatal structures (putamen, globus pallidus, caudate) (Pearson correlation > 0.77, ICC > 0.87 and DSC > 0.88, respectively). Overall, automated segmentation tools do not always provide satisfactory results, and careful visual inspection of the automated segmentations is strongly advised.
Keywords: brain, brain (growth and development), child, neuroimaging
The accuracy of FSL‐FIRST an FreeSurfer was compared against manual segmentation for the hippocampus and subcortical structures in 5‐year‐olds. Both automated segmentation tools overestimated most structures and the accuracy varied depending on the structure.
Abbreviations
- AAM
active appearance model
- ADHD
attention deficit hyperactivity disorder
- DSC
Dice score coefficient
- DTI
diffusion tensor imaging
- FOV
field of view
- GP
globus pallidus
- GRAPPA
generalised autocalibrating partially parallel acquisition
- ICC
intraclass correlation coefficient
- MR
magnetic resonance
- MRI
magnetic resonance image
- PAT
parallel acquisition technique
- PCC
Pearson correlation coefficient
- PTSD
post‐traumatic stress disorder
- SD
standard deviation
- TE
time to echo
- TI
inversion time
- TR
repetition time
- TSE
turbo spin echo
1. INTRODUCTION
The hippocampus and subcortical structures (henceforth collectively referred to as subcortical structures) of the brain are responsible for numerous important functions. The hippocampus and the amygdala, located in the medial temporal lobe, form an important part of the limbic system. The hippocampus has a significant role in the memory forming process (Mcdonald & Mott, 2017; Sawangjit et al., 2018) and has been linked to many psychopathologies such as post‐traumatic stress disorder (PTSD) and Alzheimer's disease (Fitzgerald et al., 2019; Jaroudi et al., 2017). The amygdala has an important role in emotional responses, especially fear (Krabbe et al., 2018). It has also been associated with anxiety disorders and depression (Ferri et al., 2018; Toazza et al., 2016; Tye et al., 2011). The thalamus, also a part of the limbic system, relays sensory and motor signals to the cerebral cortex and regulates sleep, consciousness and alertness, among other functions. Structural changes of the thalamus have been associated with many neurological diseases such as Alzheimer's disease (Braak & Braak, 1991) and schizophrenia (Parnaudeau et al., 2018). Parts of the basal ganglia, including the putamen, the globus pallidus (GP), the caudate nucleus and the nucleus accumbens, have an important role in the extrapyramidal motor system and are associated with many motor neurodegenerative pathologies such as Huntington's and Parkinson's disease (Manes et al., 2018; Singh‐bains et al., 2016). In addition, they are involved in motivational, emotional and cognitive functions (Herrero & Barcia, 2002). The development of these subcortical structures can be affected by early‐life environments and experiences (Lee et al., 2019; Pulli et al., 2019). Taken together, the subcortical areas are relevant to multiple brain functions and pathologies. Therefore, it is also crucial to gather accurate information about them in magnetic resonance imaging (MRI) studies conducted in paediatric populations.
Accurate segmentation of paediatric MR images is challenging, partly due to the variation in pre‐processing and segmentation protocols (Hashempour et al., 2019; Schoemaker et al., 2016). Several segmentation protocols have been developed for adult brains, but they cannot be directly applied in segmenting child brain images because children's MR images have different contrast and comparatively lower resolution than adults' images (Gousias et al., 2012; Moore et al., 2014; Morey et al., 2009). Manual segmentation is currently considered the gold standard in volumetric segmentation. Although it is considered the most accurate method, it is highly time consuming and requires expertise for adequate results. Furthermore, a major downside is the subjective approach in estimating the shapes and sizes of the structures, which may cause reproducibility issues that may be even more pronounced in larger samples.
Several software have been developed for automated segmentation of the brain. In this study, we focused on two mainstream analysis pipelines. One is FSL‐FIRST from the FMRIB Software Library (Patenaude et al., 2011). FSL‐FIRST is a segmentation tool that uses the template based on manually segmented images to construct the shape of the automated segmentation models. It utilises the active appearance model (AAM) combined with a Bayesian framework, which allows probabilistic relationships between voxel intensity and the shapes of different structures (Patenaude et al., 2011). The other is FreeSurfer (https://surfer.nmr.mgh.harvard.edu/), which is an open‐source software suite for processing and analysing MR images. FreeSurfer uses a five‐stage volume‐based stream for segmenting subcortical structures. Final segmentation is based on a subject‐independent probabilistic atlas and subject specific values. Both FSL‐FIRST and FreeSurfer use a training dataset for the basis of segmentation and utilise probabilistic computing to determine the final shape and volume of each structure. Although both FSL‐FIRST and FreeSurfer were originally developed mainly for adult brain image analyses, both software have also been used in paediatric neuroimaging. There are multiple recent studies using both FSL‐FIRST (Sandman et al., 2014; Wang et al., 2022) and FreeSurfer (Barch, Harms, et al., 2019; Barch, Tillman, et al., 2019; Grohs et al., 2021; Roediger et al., 2021) as a tool for paediatric volumetric subcortical brain segmentation. Majority of these studies did not use manual segmentation as a control for segmentation accuracy.
Consistent overestimation of subcortical volumes regarding both FreeSurfer and FSL‐FIRST (Cherbuin et al., 2009; Doring et al., 2011) has been a common finding in previous studies. This result has been documented in paediatric populations on the hippocampus and amygdala (Mulder et al., 2014; Schoemaker et al., 2016). The study by Schoemaker et al. also found that the consistency between manual segmentation and FreeSurfer was better than between manual segmentation and FSL‐FIRST in children aged between 6 and 11 years (Schoemaker et al., 2016). Although the reliability of these segmentation methods has been assessed in multiple studies in the medial temporal lobe structures, there has been little research including the striatal structures.
The aim of this study was to compare the accuracy of FSL‐FIRST and FreeSurfer against the gold standard manually corrected segmentation on subcortical structures, including the hippocampus, amygdala, thalamus, putamen, GP, caudate and nucleus accumbens, in paediatric populations. Therefore, we compared the volumes of all the structures extracted from each segmentation method. Furthermore, we analysed the shape of the segmentation models to determine the areas where the automated segmentation tools overestimated or underestimated the size of the structures and their borders. This was a feasibility study that critically assessed the extent to which adult delineation software can be used to segment child brain images that have nearly adult‐like contrast pattern in T1‐weighted images and are close in size to adult brain.
2. MATERIAL AND METHODS
This study was conducted in accordance with the Declaration of Helsinki, and it was approved by the Joint Ethics Committee of the University of Turku and the Hospital District of Southwest Finland (07.08.2018) §330, ETMK: 31/180/2011.
2.1. Subjects
MRI scans were acquired in children as part of the FinnBrain Birth Cohort Study (www.finnbrain.fi), which was started in 2011. The main goal of the cohort is to study the effects of genes and environment on the development and mental health of children (Karlsson et al., 2018). Initial recruitment of FinnBrain Birth Cohort Study was performed systematically in routine ultrasound examinations during the 12th week of gestation. At 5 years of age, 203 subjects attended neuroimaging visits. For the purposes of this study, we selected the first 80 participants that were visually confirmed to have high enough quality T1 image for manual segmentation of the subcortical structures. For the 5‐year neuroimaging visit, we primarily recruited participants that had a prior visit to neuropsychological measurements at ∼5 years of age (n = 76). This sample also includes four other subjects: Three subjects were included without a neuropsychological visit, as they had an exposure to maternal prenatal synthetic glucocorticoid treatment (recruited separately for a nested case–control sub‐study). The data additionally included one subject that was enrolled for a pilot scan at the beginning of the studies. The total sample size for this study was 80. The exclusion criteria for this study were (1) born before gestational week 35 (born before gestational week 32 in the synthetic glucocorticoid treatment group); (2) developmental anomaly or abnormalities in senses or communication (e.g. congenital heart disease, blindness and deafness); (3) known long‐term medical diagnosis (e.g. epilepsy, autism and attention deficit hyperactivity disorder [ADHD]); (4) ongoing medical examinations or clinical follow‐up in a hospital (meaning there has been a referral from primary care setting to experts); (5) child use of continuous, daily medication (including per oral medications, topical creams and inhalants. One exception to this was desmopressin [®Minirin] medication, which was allowed); (6) history of head trauma (defined as concussion necessitating clinical follow‐up in a healthcare setting or worse); and (7) metallic ear tubes (to assure good‐quality scans) and routine MRI contraindications.
In this study, we used a representative subsample of 80 T1‐weighted brain images, which were all visually inspected by a single expert rater (Kristian Lidauer). The sample included 34 girls and 46 boys aged between 5 and 5.5 years (mean age 5.34 years, SD = 0.06). Participant demographics and maternal medical history variables are presented in detail in Table 1.
TABLE 1.
Participant demographics and maternal medical history variables (N = 80)
| Continuous variables | Mean | SD | Min | Max |
|---|---|---|---|---|
| Age at scan (years) | 5.34 | 0.06 | 5.08 | 5.52 |
| Gestational age at birth (weeks) | 39.5 | 1.7 | 33.9 | 42.3 |
| Birth weight (grams) | 3437 | 557 | 1790 | 4980 |
| Maternal age at term (years) | 31.4 | 4.4 | 20.2 | 42.0 |
| Maternal BMI before pregnancy | 23.8 | 3.9 | 18.1 | 34.7 |
| Categorical variables | Number | Per cent | ||
|---|---|---|---|---|
| Sex | ||||
| Male | 46 | 57.5 | ||
| Female | 34 | 42.5 | ||
| Maternal education level | ||||
| Upper secondary school or vocational school or lower | 15 | 18.8 | ||
| University of applied sciences | 23 | 28.7 | ||
| University | 42 | 52.5 | ||
| Maternal monthly income, estimated after taxes (euros) | ||||
| ≤1500 | 20 | 25.0 | ||
| 1501–2500 | 49 | 61.3 | ||
| 2501–3500 | 7 | 8.8 | ||
| ≥3501 | 1 | 1.3 | ||
| Missing | 3 | 3.8 | ||
| Maternal background | ||||
| Finnish | 79 | 98.8 | ||
| Other | 1 | 1.3 | ||
| Alcohol use during pregnancy | ||||
| Yes, continued to some degree after learning about pregnancy | 8 | 10.0 | ||
| Yes, stopped after learning about the pregnancy | 16 | 28.0 | ||
| No | 51 | 63.8 | ||
| Missing | 5 | 6.3 | ||
| Tobacco smoking during pregnancy | ||||
| Yes, continued to some degree after learning about pregnancy | 2 | 2.5 | ||
| Yes, stopped after learning about the pregnancy | 3 | 3.8 | ||
| No | 71 | 88.8 | ||
| Missing | 4 | 5.0 | ||
| Illicit drug use during pregnancy | ||||
| No | 75 | 93.8 | ||
| Missing | 5 | 6.3 | ||
| Maternal history of disease, yes (N = 77, 3 missing) | ||||
| Allergies | 32 | 41.6 | ||
| Depression | 11 | 14.3 | ||
| Asthma | 9 | 11.7 | ||
| Eating disorder | 9 | 11.7 | ||
| Chronic urinary tract infection | 8 | 10.4 | ||
| Anxiety disorder | 7 | 9.1 | ||
| Autoimmune disorder | 5 | 6.5 | ||
| Hypertension | 3 | 3.9 | ||
| Hypercholesterolaemia | 2 | 2.6 | ||
| Coeliac disease | 2 | 2.6 | ||
| Hypothyroidism | 2 | 2.6 | ||
| Emphysema | 1 | 1.3 | ||
| Chronic bacterial or viral infection | 1 | 1.3 | ||
| Psychosis | 1 | 1.3 | ||
| Drug dependency | 1 | 1.3 | ||
| Migraine | 1 | 1.3 | ||
| Other chronic disease | 6 | 7.8 | ||
| Maternal medication at gestational week 14, yes (N = 72, 8 missing) | ||||
| Thyroxin | 6 | 8.3 | ||
| Corticosteroid | 4 | 5.6 | ||
| SSRI/SNRI | 3 | 4.2 | ||
| Hypertension medication | 2 | 2.8 | ||
| Other mood medication | 2 | 2.8 | ||
| Other medication affecting the CNS | 1 | 1.4 | ||
| Other medication | 6 | 8.3 | ||
| Maternal medication at gestational week 34, yes (N = 75, 5 missing) | ||||
| Thyroxin | 7 | 9.3 | ||
| Blood pressure medication | 5 | 6.7 | ||
| SSRI/SNRI | 4 | 5.3 | ||
| Corticosteroid | 4 | 5.3 | ||
| Other mood medication | 2 | 2.7 | ||
| Other medication affecting the CNS | 2 | 2.7 | ||
| Other medication | 14 | 18.7 | ||
Notes: Gestational age at birth was calculated using the difference between due date and actual date of birth. Maternal age at term was calculated as follows: The age as days at due date divided by 365.25. On the question about alcohol usage, three subjects answered that they did not use alcohol during pregnancy, but also answered that they stopped using alcohol when they learned about the pregnancy. These were classified as ‘yes, stopped when learning about pregnancy’. The data for monthly income estimate, alcohol use, tobacco use, drug use and diagnostic information are from questionnaires at gestational Week 14. Maternal education level was asked in questionnaires at gestational Week 14 and at 5 years of age, and the most recent available data was used. In addition to the diseases in the table, we asked for the following disorders, and none of the mothers suffered from them: myocardial infarction, cardiac dysfunction, angina pectoris, stroke, Type 1 diabetes, Type 2 diabetes, epilepsy, intellectual disability, alcohol dependency disorder, musculoskeletal disorder, cancer and attention deficit hyperactivity disorder. Sex, birth weight, and maternal BMI before pregnancy were retrieved from the National Institute for Health and Welfare (www.thl.fi).
Abbreviations: BMI, body mass index; CNS, central nervous system; N, number of participants; SD, standard deviation; SNRI, selective noradrenalin reuptake inhibitor; SSRI, selective serotonin reuptake inhibitor.
2.2. Study visit
The subjects were recruited for the neuroimaging visits via phone calls by a research staff member. On the first call, the families were given general information about the study, and the inclusion and exclusion criteria were checked. The follow‐up call was made to confirm the participation, and we gave instructions to practice for the MRI visit at home. A member of the research staff made a home visit before the scan to deliver earplugs and headphones, to give more detailed information about the visit and to answer any remaining questions. An added benefit of the home visit was the chance to meet the participating child and that way start the familiarisation with the research staff, which helped the preparations on the scanning day. A written consent was acquired from both parents before the MRI scan as well as verbal assent from the child.
Multiple methods were applied to reduce anxiety and make the visit feel as safe as possible (many of the methods have been described in earlier studies) (Greene et al., 2016). The visit was conducted in a child‐friendly manner with a flexible timetable in the preparation before the scan, and we did our best to accommodate in order to befit the child in cooperation with the family. The participants were scanned awake. During the structural imaging, the subjects were allowed to watch a cartoon or a movie of their choice. A parent and a research staff member were present in the scanner room throughout the scan. Everyone in the room had their hearing protected with earplugs and headphones. The maximum scan time was 60 min, and the subjects were allowed to stop the scan at any time. For a more detailed description of the study visits, see (Pulli et al., 2022) and (Copeland et al., 2021).
2.3. MRI acquisition
Participants were scanned using a Siemens Magnetom Skyra fit 3 T with a 20‐element head/neck matrix coil. We used generalised autocalibrating partially parallel acquisition (GRAPPA) technique to accelerate image acquisition [parallel acquisition technique (PAT) factor of 2 was used]. For the purposes of the current study, we acquired a high‐resolution three‐dimensional (3D) T1‐weighted magnetisation prepared rapid acquisition gradient‐echo sequence (MPRAGE) in sagittal plane with the following sequence parameters: TR = 1900 ms, TE = 3.26 ms, TI = 900 ms, flip angle = 9°, voxel size = 1.0 × 1.0 × 1.0 mm3, FOV = 256 mm. In addition, the max. 60‐min scanning protocol included a T2 turbo spin echo (TSE), a 7‐min resting state functional MRI and a DTI sequence. The T1 scans were planned as per recommendations of the FreeSurfer developers (https://surfer.nmr.mgh.harvard.edu/fswiki/FreeSurferWiki?action=AttachFile&do=get&target=FreeSurfer_Suggested_Morphometry_Protocols.pdf, at the time of writing).
2.4. Automated segmentation of the subcortical nuclei using FSL‐FIRST
The automated segmentation of the subcortical structures was performed using FSL‐FIRST 5.0.9 (Patenaude et al., 2011), a freely available automated segmentation tool provided by the FMRIB Software Library. FSL‐FIRST uses a training data‐based approach combined with a Bayesian probabilistic model to determine the most probable shape of the structure given the intensities of the T1 image. FSL‐FIRST makes use of the adult MNI152 template space, but the segmentation model has been trained structures using 336 manually labelled T1‐weighted MR images (age range 4.7–87 years) (Patenaude et al., 2011). More detailed information about the technical process can found in an article by Patenaude et al. (2011). In this study, we segmented the T1 images using FSL‐FIRST with three different boundary correction settings. The FSL Default method uses different options based on empirical observations for each different structure. The FSL Fast option uses an FSL‐FAST‐based tissue‐type classification to determine the final shape of the model. For the third boundary correction option, we chose FSL None, which does not use any boundary correction settings. After running the pipelines, a voxel count was performed to estimate the volumes produced by each different method.
2.5. Automated segmentation of the subcortical nuclei using FreeSurfer
The other automated segmentation software used in this study was FreeSurfer 6.0 (https://surfer.nmr.mgh.harvard.edu/), a freely available open software neuroimage analysis suite. We used the recon‐all pipeline with default settings consisting of several stages. In brief, the process includes motion correcting and averaging (Reuter et al., 2010) of multiple T1 images, which is proceeded by removal of non‐brain tissue using a watershed/surface deformation procedure (Segonne et al., 2004), after which the images are transferred into a Talairach space, where the white matter and subcortical grey matter are segmented by labelling each voxel based on the probabilities from a manually edited training dataset and the intensities of the T1 image. FreeSurfer segmentation labels via probabilistic information automatically estimated from expert segmentations of 40 adult brain images (Fischl et al., 2002) (https://surfer.nmr.mgh.harvard.edu/fswiki/FreeSurferMethodsCitation). FreeSurfer morphometric procedures have been demonstrated to show good test–retest reliability across scanner manufactures and across field strengths (Reuter et al., 2012). The technical details of the FreeSurfer process are described more in‐depth in prior publications (Fischl et al., 2002, 2004; Segonne et al., 2004). The volumes were extracted with ‘asegstats2table’ command.
2.6. Manual segmentation of the subcortical nuclei
Manual segmentation was done by editing the models produced by FSL None. We visually inspected the results of all three FSL‐FIRST pipelines and chose FSL None, because it required the least amount of editing. The subcortical structures were segmented by a single expert rater (Kristian Lidauer) using the software FslView (https://fsl.fmrib.ox.ac.uk/fsl/fslwiki/FslView). The rater was experienced in manual segmentation of infant brain MR images and templates (Acosta et al., 2020; Hashempour et al., 2019) across a period of 2 years before starting the current study (2018–2020).
The use of initial estimates from FSL‐FIRST significantly reduced the working time as compared with full manual segmentation. It also made the work easier as the main task for the investigators was correction of the borders. This process was guided by prior work for striatal structures (Perlaki et al., 2017) and the thalamus (Owens‐Walton et al., 2019; Power et al., 2015) as well as our prior work for amygdala and hippocampus segmentation, which is provided in our recent open‐access article (Hashempour et al., 2019).
The manual edits were performed on ‘initial estimates’ that saved time. The edits were documented on 40 randomly chosen subjects of the total 80 to highlight important areas for quality control. The anatomical delineations that we incorporated into locally adapted procedures are in line with prior work (de Macedo Rodrigues et al., 2015). Manual segmentations/edits were performed in a slice‐by‐slice manner to carefully trace the correct anatomical border and reviewed in axial, coronal and sagittal planes for a 3D consistency of the segmentations. Finally, all segmentations were checked for accuracy by senior scientist (Jetro J. Tuulari). The accuracy check was performed with fsleyes and entailed (1) selection of a reference segmentation with all structures accurately delineated, (2) opening three segmentations at a time and comparing them against the reference segmentation, (3) checking bilateral structures from each one by browsing the structure in all 3D planes and checking the borders with intermittent opening and closing the overlay to check the consistency of the borders. This process took about 15 min per three segmentation (∼7 h in the final round of quality control).
To assess any bias that might occur with FSL‐FIRST‐based initial estimates, we re‐segmented 20 randomly chosen subjects using automated FreeSurfer segmentations as the base for manual delineation. We also re‐segmented 10 randomly chosen subjects using FSL‐FIRST None initial estimates to assess intra‐rater accuracy.
A voxel count was then concluded with fslmaths to estimate the volumes of the manually segmented structures.
2.7. Statistical analysis
All statistical analyses and plotting of the results were performed using R tools v.4.0 (https://www.r-project.org/) and R‐Studio 1.3 (https://rstudio.com/). For the plots and following analyses, we used irr, ggplot2, gridExtra, grid and gtable libraries.
The volumetric difference between automated segmentation and manual segmentation was calculated as the percentage using the following equation (Schoemaker et al., 2016): %VD = [(Va − Vm)/Vm] × 100%, where Va is the automated volume and Vm is the manually segmented volume. A negative result indicates that the automated method underestimated the volume, whereas a positive value shows that the automated method overestimated the volume.
Pearson correlations were calculated to measure the strength of the association between manual segmentation and the different automated techniques for each individual structure. A strong correlation would indicate good consistency between methods. To estimate reproducibility between different techniques and estimation bias, we computed intraclass correlation coefficients (ICC). We used a two‐way mixed effect model with absolute agreement and average measures (ICC Type A, k) as specified by McGraw and Wong (1996), which is a model not defined in the commonly used Shrout and Fleiss (1979) convention. A high value would confirm a good reproducibility between two raters. There are no fixed guidelines on how to interpreter ICC values, but in previous studies, a coefficient of 0.70 has been considered as the minimum for establishing an adequate reliability between two raters (Terwee et al., 2007).
To determine the spatial overlap of the structures, we conducted Dice score coefficient (DSC) analysis between manual and automated segmentation methods. The value of DSC ranges from 0, indicating no spatial overlap between structures, to 1, indicating complete overlap (Zou et al., 2004).
The same correlations and DSC were also calculated for comparison between manual segmentation based on either FSL None or FreeSurfer automated segmentation and between intra‐rater segmentations.
To assess the adequacy of sample size, we performed a split‐half analysis, where we divided the whole sample (n = 80) into two randomly selected subsamples (n = 40). Then, we compared the volumetric differences and correlations of these subsamples to each other.
3. RESULTS
3.1. Volumetric differences between FSL‐FIRST pipelines
FSL None produced the highest volumes for the hippocampus, amygdala, caudate and nucleus accumbens and produced the same result as the FSL Default pipeline in the other three structures: the putamen, GP and the thalamus. The other pipelines, FSL Default and FSL Fast, had considerably lower volumes for the hippocampus and amygdala and yielded the exact same result for both structures. FSL Default and FSL Fast performed very similarly throughout and showed the exact same volumes also for the caudate and the nucleus accumbens.. The volumes for each pipeline and structure are presented in Table 2. The identical results in some of the structures are caused by utilising the same boundary correction options.
TABLE 2.
Comparison of mean (standard deviation) volumes and percentage of volume difference between techniques
| Manual | FSL‐FIRST | FreeSurfer | |||
|---|---|---|---|---|---|
| Default | Fast | None | |||
| Volume (SD) | |||||
| L‐hippocampus | 3019.89 (444.14) | 3412.41 (441.28) | 3412.41 (441.28) | 4244.95 (575.67) | 4076.74 (384.19) |
| R‐hippocampus | 3150.08 (425.61) | 3551.45 (415.35) | 3551.45 (415.35) | 4434.70 (531.64) | 4189.92 (393.52) |
| L‐amygdala | 892.89 (169.80) | 1096.85 (203.91) | 1096.85 (203.91) | 1377.63 (232.26) | 1540.28 (214.03) |
| R‐amygdala | 845.36 (174.28) | 1053.94 (194.49) | 1053.94 (194.49) | 1306.54 (228.94) | 1734.00 (193.02) |
| L‐thalamus | 7354.33 (723.20) | 8194.63 (665.97) | 6713.21 (547.86) | 8194.63 (665.97) | 7751.61 (565.98) |
| R‐thalamus | 7274.78 (691.27) | 8053.54 (653.88) | 6612.65 (528.49) | 8053.54 (653.88) | 7714.82 (577.31) |
| L‐putamen | 4899.50 (508.16) | 5152.74 (509.74) | 4695.56 (482.28) | 5152.74 (509.74) | 5178.54 (570.61) |
| R‐putamen | 4924.40 (530.36) | 5250.24 (541.97) | 4656.94 (501.47) | 5250.24 (541.97) | 5283.99 (580.31) |
| L‐GP | 1644.91 (159.43) | 1775.01 (152.92) | 1377.19 (150.87) | 1775.01 (152.92) | 2064.27 (241.91) |
| R‐GP | 1664.09 (171.18) | 1780.10 (165.80) | 1348.86 (153.55) | 1780.10 (165.80) | 1938.86 (188.74) |
| L‐caudate | 4018.88 (428.88) | 3870.68 (441.35) | 3870.68 (441.35) | 5014.68 (577.25) | 3931.77 (426.83) |
| R‐caudate | 4222.35 (464.31) | 4016.30 (511.14) | 4016.30 (511.14) | 5059.09 (643.09) | 4052.67 (419.55) |
| L‐accumbens | 523.96 (100.67) | 610.65 (128.79) | 610.65 (128.79) | 804.31 (136.64) | 568.37 (114.45) |
| R‐accumbens | 428.64 (86.09) | 534.33 (96.44) | 534.33 (96.44) | 675.84 (117.69) | 635.72 (97.09) |
| L‐cau + acc | 4542.85 (469.18) | 4481.33 (497.87) | 4481.33 (497.87) | 5818.99 (641.97) | 4500.13 (484.39) |
| R‐cau + acc | 4650.99 (480.17) | 4550.63 (531.08) | 4550.63 (531.08) | 5734.93 (659.63) | 4688.39 (472.09) |
| Combined mean | 3204.58 | 3453.78 | 3110.79 | 3794.57 | 3618.68 |
| % volume diff. (SD) | |||||
| L‐hippocampus | 13.61 (9.31) | 13.61 (9.31) | 41.15 (10.62) | 37.10 (20.12) | |
| R‐hippocampus | 13.45 (10.27) | 13.45 (10.27) | 41.58 (12.75) | 34.55 (16.01) | |
| L‐amygdala | 24.65 (21.68) | 24.65 (21.68) | 56.56 (23.88) | 77.02 (34.11) | |
| R‐amygdala | 27.02 (22.55) | 27.02 (22.55) | 57.75 (27.28) | 112.00 (40.58) | |
| L‐thalamus | 11.73 (5.75) | −8.49 (4.43) | 11.73 (5.75) | 5.96 (8.72) | |
| R‐thalamus | 10.93 (4.85) | −8.90 (4.06) | 10.93 (4.85) | 6.52 (8.08) | |
| L‐putamen | 5.24 (2.06) | −4.13 (2.38) | 5.24 (2.06) | 5.81 (6.76) | |
| R‐putamen | 6.69 (2.45) | −5.39 (2.80) | 6.69 (2.45) | 7.49 (6.98) | |
| L‐GP | 8.08 (3.89) | −16.28 (4.28) | 8.08 (3.89) | 26.00 (14.00) | |
| R‐GP | 7.16 (4.38) | −18.92 (4.58) | 7.16 (4.38) | 17.17 (12.02) | |
| L‐caudate | −3.50 (7.15) | −3.50 (7.15) | 25.14 (11.12) | −1.99 (6.12) | |
| R‐caudate | −4.89 (6.49) | −4.89 (6.49) | 19.91 (9.84) | −3.72 (7.00) | |
| L‐accumbens | 17.58 (18.59) | 17.58 (18.59) | 55.34 (20.97) | 10.79 (24.05) | |
| R‐accumbens | 26.13 (15.34) | 26.13 (15.34) | 60.02 (22.24) | 52.08 (27.03) | |
| L‐cau + acc | −1.17 (7.26) | −1.17 (7.26) | 28.44 (10.89) | −0.80 (6.06) | |
| R‐cau + acc | −2.12 (6.31) | −2.12 (6.31) | 23.47 (9.47) | 1.03 (6.60) | |
| Combined mean | 11.71 | 3.71 | 29.09 | 27.63 | |
Notes: The volumetric unit used is 1 voxel (= 1 mm3). Description of mean volumes obtained from each method as well as mean percentage of volume difference (% volume diff.) between manual segmentation, FreeSurfer and different FSL‐FIRST pipelines.
Abbreviations: Cau + acc, combined volume of the caudate and nucleus accumbens; Combined mean, mean of all structures combined; GP, globus pallidus; L, left; R, right; SD, standard deviation.
The volume difference between FSL‐FIRST and manual segmentation was highest with the FSL None pipeline. The highest volumetric differences were in the amygdala and nucleus accumbens. FSL Fast underestimated volumes for the putamen, GP, thalamus and caudate, whereas FSL Default underestimated the caudate volume. FSL None overestimated the volume for every structure. The percentage differences for each structure and each pipeline are presented in Table 2.
3.2. FSL‐FIRST volumetric correlation analysis
Pearson correlation coefficients between FSL‐FIRST and manual segmentation were generally good. Small structures such as the amygdala and nucleus accumbens produced slightly lower values than the rest of the structures. Differences between FSL‐FIRST's pipelines were minor. Values for Pearson correlation coefficient for all structures are presented in Table 3. A scatter plot illustration for all structures and methods is provided in Figures 1, 2, 3, 4, 5, 6, 7, 8.
TABLE 3.
Comparison of correlation analysis between manual and automated segmentation techniques (FSL‐FIRST, FreeSurfer)
| FSL‐FIRST | FreeSurfer | |||
|---|---|---|---|---|
| Default | Fast | None | ||
| PCC | ||||
| L‐hippocampus | 0.83 | 0.83 | 0.86 | 0.47 |
| R‐hippocampus | 0.74 | 0.74 | 0.75 | 0.54 |
| L‐amygdala | 0.61 | 0.61 | 0.67 | 0.34 |
| R‐amygdala | 0.66 | 0.66 | 0.67 | 0.47 |
| L‐thalamus | 0.86 | 0.87 | 0.86 | 0.60 |
| R‐thalamus | 0.89 | 0.88 | 0.89 | 0.61 |
| L‐putamen | 0.98 | 0.97 | 0.98 | 0.82 |
| R‐putamen | 0.98 | 0.96 | 0.98 | 0.84 |
| L‐GP | 0.94 | 0.89 | 0.94 | 0.49 |
| R‐GP | 0.92 | 0.87 | 0.92 | 0.52 |
| L‐caudate | 0.78 | 0.78 | 0.69 | 0.84 |
| R‐caudate | 0.87 | 0.87 | 0.80 | 0.80 |
| L‐accumbens | 0.69 | 0.69 | 0.77 | 0.44 |
| R‐accumbens | 0.81 | 0.81 | 0.76 | 0.56 |
| L‐cau + acc | 0.77 | 0.77 | 0.70 | 0.83 |
| R‐cau + acc | 0.85 | 0.85 | 0.78 | 0.81 |
| Combined mean | 0.83 | 0.82 | 0.82 | 0.60 |
| ICC (A, k) | ||||
| L‐hippocampus | 0.75 | 0.75 | 0.34 | 0.20 |
| R‐hippocampus | 0.68 | 0.68 | 0.28 | 0.23 |
| L‐amygdala | 0.55 | 0.55 | 0.29 | 0.09 |
| R‐amygdala | 0.58 | 0.58 | 0.31 | 0.07 |
| L‐thalamus | 0.66 | 0.72 | 0.66 | 0.66 |
| R‐thalamus | 0.69 | 0.70 | 0.69 | 0.66 |
| L‐putamen | 0.93 | 0.95 | 0.93 | 0.84 |
| R‐putamen | 0.90 | 0.92 | 0.90 | 0.82 |
| L‐GP | 0.82 | 0.53 | 0.82 | 0.26 |
| R‐GP | 0.85 | 0.46 | 0.85 | 0.39 |
| L‐caudate | 0.85 | 0.85 | 0.37 | 0.90 |
| R‐caudate | 0.89 | 0.89 | 0.53 | 0.85 |
| L‐accumbens | 0.69 | 0.69 | 0.33 | 0.58 |
| R‐accumbens | 0.65 | 0.65 | 0.31 | 0.27 |
| L‐cau + acc | 0.87 | 0.87 | 0.31 | 0.91 |
| R‐cau + acc | 0.91 | 0.91 | 0.43 | 0.90 |
| Combined mean | 0.75 | 0.71 | 0.54 | 0.49 |
Notes: Pearson correlation coefficients (PCC) and intraclass correlation coefficients (ICC) (A, k) computed between manual and automatic segmentation volumes. P‐values for PCC were on all structures p < 0.001.
Abbreviations: Cau + acc, combined volume of the caudate and nucleus accumbens; Combined mean, mean of all structures combined; GP, globus pallidus; L, left; R, right.
FIGURE 1.
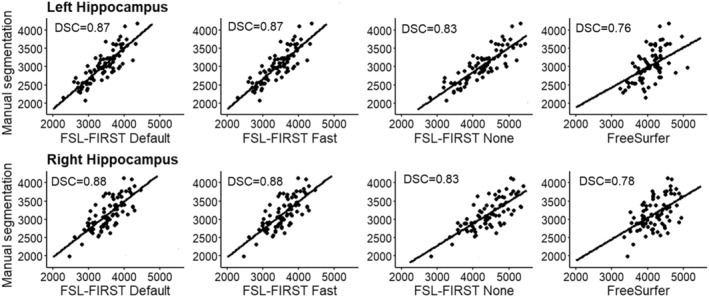
Scatter plots of automated segmentation methods against manual segmentation for the hippocampus. DSC, dice score coefficient
FIGURE 2.
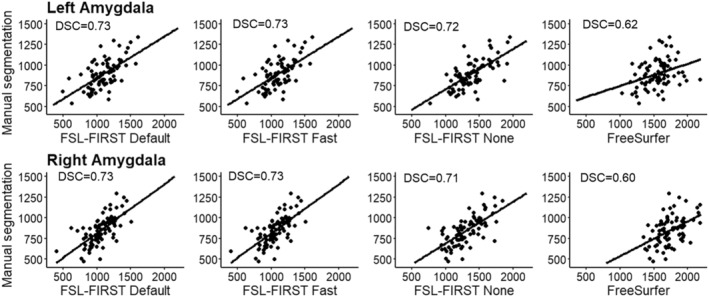
Scatter plots of automated segmentation methods against manual segmentation for the amygdala. DSC, dice score coefficient
FIGURE 3.
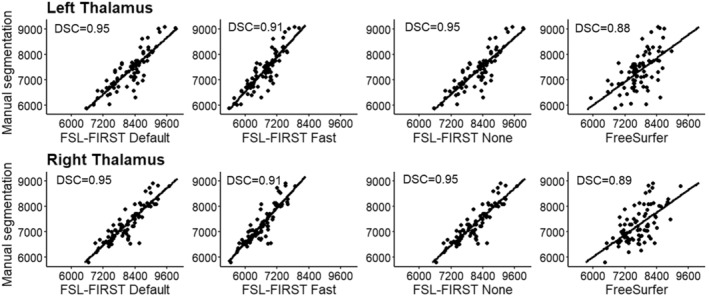
Scatter plots of automated segmentation methods against manual segmentation for the thalamus. DSC, dice score coefficient
FIGURE 4.
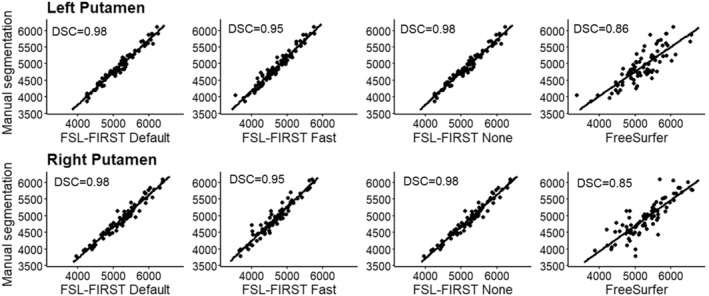
Scatter plots of automated segmentation methods against manual segmentation for the putamen. DSC, dice score coefficient
FIGURE 5.
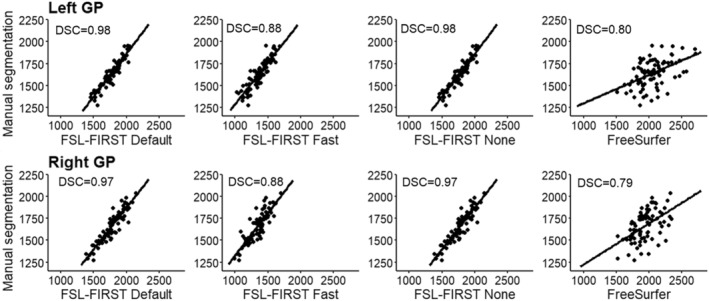
Scatter plots of automated segmentation methods against manual segmentation for the GP. DSC = dice score coefficient.
FIGURE 6.
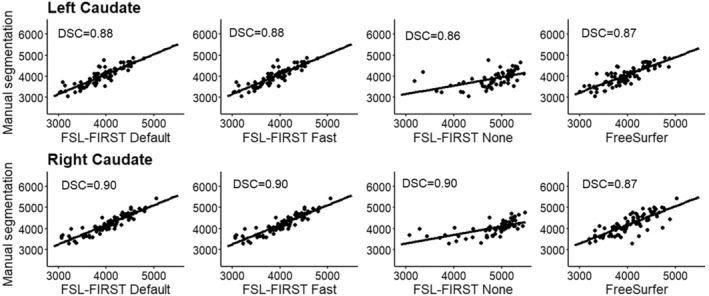
Scatter plots of automated segmentation methods against manual segmentation for the caudate. DSC, dice score coefficient
FIGURE 7.
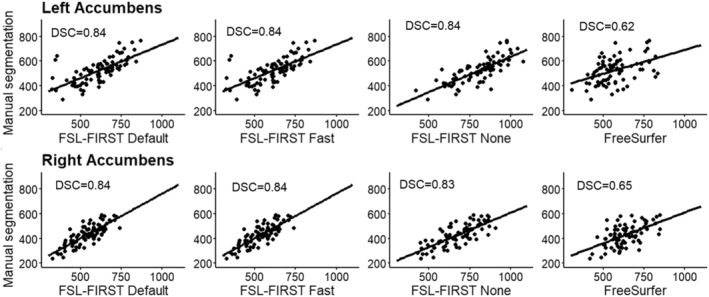
Scatter plots of automated segmentation methods against manual segmentation for the nucleus accumbens. DSC, dice score coefficient
FIGURE 8.
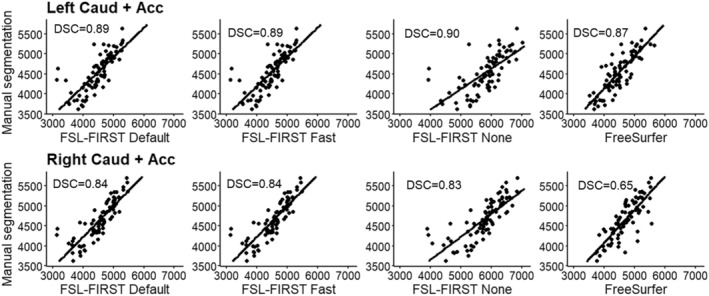
Scatter plots of automated segmentation methods against manual segmentation for the combined segmentations of caudate and nucleus accumbens. DSC, dice score coefficient
ICC (A, k) between FSL‐FIRST and manual segmentation were notably lower for FSL‐None compared with the other pipelines for the hippocampus, amygdala, caudate and nucleus accumbens. For the rest of the structures, the differences between pipelines were generally minor. Intraclass correlation values for each structure and pipeline are presented in Table 3.
3.3. FreeSurfer volumetric analysis
FreeSurfer produced higher volumes than any of the FSL‐FIRST pipelines in the amygdala, putamen and GP. Compared with manual segmentation, FreeSurfer had higher volumes in all structures except for the caudate. Mean volumes and percentage differences for all other structures are presented in Table 2.
3.4. FreeSurfer volumetric correlation analysis
Pearson correlation coefficients between FreeSurfer and manual segmentation were lower than any of the FSL‐FIRST pipelines in all structures except the caudate, where the values were similar. Results were also similar regarding the ICC, where FreeSurfer produced overall lower values compared with FSL‐FIRST except for the caudate, where its values were similar compared with FSL Default and FSL Fast pipelines. Pearson and ICC values for all structures are presented in Table 3.
3.5. DSC analysis
DSC values between manual segmentation and automated methods were good across the board. FSL‐FIRST provided overall slightly higher scores than FreeSurfer for all structures. All automated techniques produced lower results for the amygdala and nucleus accumbens. DSC values for all structures and methods are presented in Table 4.
TABLE 4.
Comparison of mean dice score coefficient values between manual and automated segmentation techniques
| FSL‐FIRST | FreeSurfer | |||
|---|---|---|---|---|
| Default | Fast | None | ||
| DSC (SD) | ||||
| L‐hippocampus | 0.87 (0.03) | 0.87 (0.03) | 0.83 (0.04) | 0.76 (0.05) |
| R‐hippocampus | 0.88 (0.03) | 0.88 (0.03) | 0.83 (0.04) | 0.78 (0.04) |
| L‐amygdala | 0.73 (0.05) | 0.73 (0.05) | 0.72 (0.05) | 0.62 (0.07) |
| R‐amygdala | 0.73 (0.06) | 0.73 (0.06) | 0.71 (0.06) | 0.60 (0.07) |
| L‐thalamus | 0.95 (0.02) | 0.91 (0.01) | 0.95 (0.02) | 0.88 (0.02) |
| R‐thalamus | 0.95 (0.02) | 0.91 (0.01) | 0.95 (0.02) | 0.89 (0.02) |
| L‐putamen | 0.98 (0.01) | 0.95 (0.01) | 0.98 (0.01) | 0.86 (0.02) |
| R‐putamen | 0.98 (0.01) | 0.95 (0.01) | 0.98 (0.01) | 0.85 (0.03) |
| L‐GP | 0.98 (0.01) | 0.88 (0.03) | 0.98 (0.01) | 0.80 (0.05) |
| R‐GP | 0.97 (0.02) | 0.87 (0.03) | 0.97 (0.02) | 0.79 (0.06) |
| L‐caudate | 0.88 (0.04) | 0.88 (0.04) | 0.86 (0.05) | 0.87 (0.03) |
| R‐caudate | 0.90 (0.03) | 0.89 (0.03) | 0.90 (0.04) | 0.87 (0.02) |
| L‐accumbens | 0.84 (0.05) | 0.84 (0.05) | 0.84 (0.05) | 0.62 (0.07) |
| R‐accumbens | 0.84 (0.03) | 0.84 (0.03) | 0.83 (0.04) | 0.65 (0.06) |
| L‐cau + acc | 0.89 (0.03) | 0.89 (0.03) | 0.90 (0.04) | 0.87 (0.02) |
| R‐cau + acc | 0.84 (0.03) | 0.84 (0.03) | 0.83 (0.04) | 0.65 (0.06) |
| Combined mean | 0.89 | 0.87 | 0.88 | 0.77 |
Note: Comparison of Dice score coefficient (DSC) mean values between manual and automated segmentation techniques.
Abbreviations: Cau + acc, score calculated with the combined area of the caudate and the nucleus accumbens; Combined mean, mean score of all structures; GP, globus pallidus; L, left; R, right; SD, standard deviation.
3.6. Intra‐rater data analysis
Volumetric differences between intra‐rater segmentations were minor across the board. The largest differences were observed in the hippocampus, amygdala and nucleus accumbens. Correlations were strong across the board. Volumes and volume differences for all structures are presented in Table 5. Correlations and DSC values for all structures are presented in Table 6.
TABLE 5.
Comparison of mean (standard deviation) volumes and percentage of volume difference in intra‐rater segmentations
| 1st segmentation | Re‐segmentation | Paired samples t‐test (p‐value) | |
|---|---|---|---|
| Volume (SD) | |||
| L‐hippocampus | 2890.1 (379.19) | 2798.1 (306.03) | 1.79 (0.10) |
| R‐hippocampus | 3106.2 (400.16) | 2911.4 (218.02) | 2.18 (0.06) |
| L‐amygdala | 868.8 (195.77) | 851.9 (110.08) | 0.42 (0.69) |
| R‐amygdala | 846.1 (205.69) | 861.3 (132.26) | −0.49 (0.63) |
| L‐thalamus | 7545.5 (886.07) | 7569.2 (737.32) | −0.12 (0.90) |
| R‐thalamus | 7532.2 (878.53) | 7629.0 (698.94) | −0.56 (0.59) |
| L‐putamen | 5241.7 (533.12) | 5198.0 (519.37) | 0.98 (0.35) |
| R‐putamen | 5131.8 (660.93) | 5119.1 (622.32) | 0.30 (0.77) |
| L‐GP | 1726.2 (167.95) | 1725.6 (177.97) | 0.05 (0.96) |
| R‐GP | 1709.9 (173.41) | 1713.97 (179.18) | −0.01 (0.92) |
| L‐caudate | 3951.6 (439.06) | 4030.8 (438.48) | 1.49 (0.17) |
| R‐caudate | 4146.2 (483.86) | 4268.3 (508.84) | −2.01 (0.07) |
| L‐accumbens | 522.4 (100,92) | 553.7 (70,17) | −1.49 (0.17) |
| R‐accumbens | 446.8 (108,12) | 472.1 (107,57) | −2.01 (0.07) |
| L‐cau + acc | 4474.0 (486.24) | 4584.5 (477.37) | −1.61 (0.14) |
| R‐cau + acc | 4593.0 (526.08) | 4740.4 (552.61) | −2.10 (0.06) |
| Combined mean | 3420.78 | 3439.21 | |
| % volume diff. (SD) | |||
| L‐hippocampus | −2.81 (5.27) | ||
| R‐hippocampus | −5.46 (8.33) | ||
| L‐amygdala | 0.48 (13.94) | ||
| R‐amygdala | 4.35 (12.76) | ||
| L‐thalamus | 0.82 (8.19) | ||
| R‐thalamus | 1.82 (7.94) | ||
| L‐putamen | −0.79 (2.62) | ||
| R‐putamen | −0.14 (2.67) | ||
| L‐GP | −0.06 (2.48) | ||
| R‐GP | 0.34 (6.29) | ||
| L‐caudate | 2.12 (4.51) | ||
| R‐caudate | 3.03 (4.65) | ||
| L‐accumbens | 8.33 (18,63) | ||
| R‐accumbens | 6.40 (10,41) | ||
| L‐cau + acc | 2.64 (5.13) | ||
| R‐cau + acc | 3.31 (4.74) | ||
| Combined mean | 1.52 | ||
Notes: The volumetric unit used is 1 voxel (= 1 mm3). Description of mean volumes and mean percentage of volume difference (% volume diff.) in intra‐rater segmentations.
Abbreviations: Cau + acc, combined volume of the caudate and nucleus accumbens;
Combined mean, mean of all structures combined; GP, globus pallidus; L, left; R, right; SD, standard deviation.
TABLE 6.
Comparison of correlation analysis between intra‐rater data
| PCC | ICC (A, k) | DSC (SD) | |
|---|---|---|---|
| L‐hippocampus | 0.91 | 0.93 | 0.91 (0.03) |
| R‐hippocampus | 0.73 | 0.70 | 0.90 (0.03) |
| L‐amygdala | 0.80 | 0.82 | 0.82 (0.11) |
| R‐amygdala | 0.92 | 0.92 | 0.86 (0.06) |
| L‐thalamus | 0.76 | 0.87 | 0.96 (0.03) |
| R‐thalamus | 0.78 | 0.87 | 0.96 (0.02) |
| L‐putamen | 0.96 | 0.98 | 0.98 (0.01) |
| R‐putamen | 0.98 | 0.99 | 0.98 (0.01) |
| L‐GP | 0.97 | 0.99 | 0.98 (0.01) |
| R‐GP | 0.81 | 0.91 | 0.97 (0.02) |
| L‐caudate | 0.93 | 0.96 | 0.94 (0.02) |
| R‐caudate | 0.93 | 0.95 | 0.95 (0.02) |
| L‐accumbens | 0.63 | 0.73 | 0.90 (0.06) |
| R‐accumbens | 0.91 | 0.94 | 0.91 (0.03) |
| L‐cau + acc | 0.90 | 0.94 | 0.94 (0.02) |
| R‐cau + acc | 0.92 | 0.94 | 0.95 (0.02) |
| Combined mean | 0.87 | 0.90 | 0.93 |
Notes: Pearson correlation coefficients (PCC), intraclass correlation coefficients (ICC) (A, k) and mean dice score correlation coefficient (DSC) computed between intra‐rater volumes. PCC p‐values were p < 0.05 for all structures.
Abbreviations: Cau + acc, combined volume of the caudate and nucleus accumbens; Combined mean, mean of all structures combined; GP, globus pallidus; L, left; R, right; SD, standard deviation.
3.7. Manual segmentations based on FSL‐FIRST none and FreeSurfer
The manual segmentation results based on FSL‐FIRST None and FreeSurfer were generally in good agreement. The largest volumetric differences were seen in amygdala (FreeSurfer 25.6% larger on the left, 40.7% larger on the right). All other differences were under 15%. Generally manual segmentation based on FreeSurfer produced slightly lower volumes. Mean volumes for both methods are presented in Table 7. Similarly, Pearson correlation coefficients, ICC (A, k) and DSC values were generally good, the lowest values being in bilateral amygdala and nucleus accumbens. The details are presented in Table 8.
TABLE 7.
Volumetric comparison of manual segmentations based on FSL‐FIRST none and FreeSurfer automated segmentations
| Manual segmentation (FIRST) | Manual segmentation (FreeSurfer) | |
|---|---|---|
| Volume (SD) | ||
| L‐hippocampus | 2999.95 (486.84) | 2784.80 (242.51) |
| R‐hippocampus | 3215.05 (511.68) | 2907.05 (309.86) |
| L‐amygdala | 916.15 (196.17) | 1112.95 (152.08) |
| R‐amygdala | 873.75 (207.16) | 1181.05 (152.78) |
| L‐thalamus | 7380.75 (861.55) | 6797.00 (605.05) |
| R‐thalamus | 7311.45 (800.43) | 6707.80 (619.48) |
| L‐putamen | 5006.70 (579.70) | 4894.85 (516.16) |
| R‐putamen | 4990.00 (589.59) | 4833.95 (546.43) |
| L‐GP | 1674.70 (150.39) | 1645.05 (246.21) |
| R‐GP | 1690.05 (181.08) | 1499.65 (164.35) |
| L‐caudate | 3999.00 (519.02) | 3636.2 (542.85) |
| R‐caudate | 4216.80 (539.52) | 3696.25 (533.02) |
| L‐accumbens | 520.90 (102.06) | 438.00 (98.98) |
| R‐accumbens | 429.20 (88.14) | 462.90 (100.68) |
| L‐cau + acc | 4519.90 (567.87) | 4074.20 (604.42) |
| R‐cau + acc | 4646.00 (566.61) | 4159.15 (596.60) |
| Combined mean | 3399.40 | 3176.93 |
| % volume diff. (SD) | ||
| L‐hippocampus | −5.39 (13.81) | |
| R‐hippocampus | −8.35 (10.40) | |
| L‐amygdala | 25.63 (26.91) | |
| R‐amygdala | 40.73 (28.44) | |
| L‐thalamus | −7.86 (8.59) | |
| R‐thalamus | −7.86 (7.27) | |
| L‐putamen | −1.95 (6.13) | |
| R‐putamen | −2.79 (7.23) | |
| L‐GP | −1.76 (11.52) | |
| R‐GP | −10.86 (8.56) | |
| L‐caudate | −9.07 (6.69) | |
| R‐caudate | −12.47 (3.95) | |
| L‐accumbens | −13.37 (24.10) | |
| R‐accumbens | 10.40 (26.05) | |
| L‐cau + acc | −9.34 (7.25) | |
| R‐cau + acc | −10.62 (4.71) | |
| Combined mean | −1.56 | |
Notes: The volumetric unit used is 1 voxel (= 1 mm3). Description of mean volumes obtained from manual segmentations based on FSL‐FIRST and FreeSurfer as well as mean percentage of volume difference (% volume diff.) between FSL‐FIRST and FreeSurfer based manual segmentation.
Abbreviations: Cau + acc, combined volume of the caudate and nucleus accumbens; Combined mean, mean of all structures combined; GP, globus pallidus; L, left; R, right; SD, standard deviation.
TABLE 8.
Comparison of correlation analysis between manual segmentation based on FSL‐FIRST none and FreeSurfer
| PCC | ICC (A, k) | DSC | |
|---|---|---|---|
| L‐hippocampus | 0.63 | 0.62 | 0.85 (0.03) |
| R‐hippocampus | 0.75 | 0.70 | 0.86 (0.03) |
| L‐amygdala | 0.36 | 0.36 | 0.76 (0.05) |
| R‐amygdala | 0.64 | 0.41 | 0.76 (0.07) |
| L‐thalamus | 0.65 | 0.64 | 0.91 (0.02) |
| R‐thalamus | 0.72 | 0.68 | 0.92 (0.02) |
| L‐putamen | 0.84 | 0.91 | 0.91 (0.01) |
| R‐putamen | 0.79 | 0.87 | 0.91 (0.02) |
| L‐GP | 0.62 | 0.72 | 0.86 (0.03) |
| R‐GP | 0.65 | 0.58 | 0.83 (0.04) |
| L‐caudate | 0.87 | 0.83 | 0.90 (0.03) |
| R‐caudate | 0.96 | 0.79 | 0.90 (0.02) |
| L‐accumbens | 0.17 | 0.23 | 0.72 (0.08) |
| R‐accumbens | 0.47 | 0.62 | 0.75 (0.07) |
| L‐cau + acc | 0.83 | 0.79 | 0.90 (0.03) |
| R‐cau + acc | 0.94 | 0.82 | 0.90 (0.02) |
| Combined mean | 0.68 | 0.66 | 0.85 |
Notes: Pearson correlation coefficients (PCC), intraclass correlation coefficients (ICC) (A, k) and mean Dice score coefficients (DSC) computed between manual segmentations based on FSL‐FIRST and FreeSurfer. P values for PCC were p < 0.01 for all structures.
Abbreviations: Cau + acc, combined volume of the caudate and nucleus accumbens; Combined mean, mean of all structures combined; GP, globus pallidus; L, left; R, right; SD, standard deviation.
3.8. Analysis of edits that were performed during manual segmentation
The edits were documented on 40 randomly chosen subjects of the total 80 to describe the workflow and also to highlight important areas for quality control. The hippocampus and amygdala consistently required the most edits. The hippocampus had two typical errors that required major manual corrections in most subjects: The lateral anterior superior border was overestimated in 35 and 36 subjects in the left and right hippocampus, respectively, and the inferior posterior area was too large in 30 and 32 subjects in the left and right hippocampus, respectively. The amygdala needed major edits on all subjects. The lateral superior border was overestimated in all subjects, and the anterior side was underestimated in 33 and 35 subjects for the left and right amygdala, respectively. The lateral inferior edge was too large in 21 on the left side and 18 on the right side. The thalami were overall slightly too big and needed minor edits throughout the structure, most notably on the medial posterior inferior edge, which was overestimated in 21 subjects for the left and in 19 for the right thalamus. The caudate received most edits on the lateral posterior inferior area, where the FSL None pipeline overestimated the border in 30 subjects for the left and in 26 for the right caudate. Notably, the superior medial area of the right caudate was too large in 17 subjects, whereas on the left it was only overestimated in three subjects. All common edits are listed in Table 9. The putamen, GP and nucleus accumbens were more accurately segmented by FSL‐FIRST than by FreeSurfer and only received minor and sporadic edits.
TABLE 9.
Most common major edits to structures and areas using the FSL‐none segmentations out of 40 randomly chosen images
| Edited areas | Number of subjects edited | |
|---|---|---|
| Hippocampus | Left | Right |
| Lateral anterior superior area overestimated | 35 | 36 |
| Inferior posterior area overestimated | 30 | 32 |
| Uneven anterior end | 12 | 13 |
| Amygdala | ||
| Lateral superior posterior area overestimated | 39 | 40 |
| Anterior side underestimated | 33 | 35 |
| Lateral inferior edge overestimated | 21 | 18 |
| Thalamus | ||
| Medial posterior inferior edge overestimated | 21 | 19 |
| Anterior end overestimated | 5 | 5 |
| Posterior inferior edge overestimated | 3 | 2 |
| Caudate | ||
| Lateral posterior inferior area overestimated | 30 | 26 |
| Superior medial area overestimated | 3 | 17 |
| Superior medial anterior edge underestimated | 8 | 7 |
| Superior medial inferior edge underestimated | 5 | 2 |
3.9. Split‐half analysis
The volumetric differences in the split‐half analysis were small between the halves. The volumetric differences between the halves ranged from 0 percentage points to 5 percentage points, with most structures the difference was between 1 and 2 percentage points. The correlation value differences between halves were generally slightly larger than the volumetric differences. Most of the structures yielded similar correlations for both halves; FreeSurfer produced slightly larger differences in correlations compared with FSL‐FIRST's pipelines. Detailed results of the split‐half analysis are presented in the Supporting Information.
4. DISCUSSION
In this study, we compared two automated segmentation tools, FSL‐FIRST and FreeSurfer, against manual segmentation on subcortical areas in a paediatric population. We included in the comparisons, FSL‐FIRST's three different pipelines—FSL Default, FSL Fast and FSL None—each of which uses different boundary correction settings to determine the exact anatomical borders of structures. Our goal was to compare the accuracy of these automated segmentation methods with manual segmentation, which is currently considered the gold standard (Hashempour et al., 2019; Morey et al., 2009) and has been validated as such in previous articles in paediatric as well as adult populations (Makowski et al., 2018; Schoemaker et al., 2016). In our results, FSL Default and FSL Fast pipelines performed overall more accurately than FSL None or FreeSurfer. We observed that automated methods tend to overestimate volumes in most structures, as was expected based on previous studies (Grimm et al., 2015; Hashempour et al., 2019; Nugent et al., 2013; Pipitone et al., 2014). The overestimation was overall most prominent with FreeSurfer and FSL None, although there were some notable exceptions in specific structures, such as the caudate, where FreeSurfer slightly underestimated volumes. Excluding the FSL None pipeline, FSL‐FIRST produced generally better agreement across the structures than FreeSurfer.
4.1. Hippocampus and amygdala
Both hippocampus and amygdala were overestimated by all automated segmentation methods in our study. Most accurate were FSL Default and FSL Fast pipelines with a moderate overestimation. FSL None and FreeSurfer overestimated both structures greatly. With all methods, the overestimation was more prominent in the amygdala than the hippocampus, which has also been documented in previous articles in adults as well as paediatric populations (Akudjedu et al., 2018; Doring et al., 2011; Pipitone et al., 2014; Schoemaker et al., 2016).
FSL Default and FSL Fast had overall better correlations with manual segmentation than FSL None or FreeSurfer. For the hippocampus, all of FSL‐FIRST's pipelines exceeded the threshold coefficient of r > 0.70, which has previously been suggested as the minimum for defining reliability between measures (Terwee et al., 2007). The Pearson correlation coefficients for the amygdala were lower, ranging from r = 0.61 to r = 0.67 with FSL‐FIRST's pipelines. FreeSurfer's correlations were significantly weaker than FSL‐FIRST's for both hippocampus and amygdala, with amygdala having the lowest values. FSL Default and FSL Fast produced identical intraclass correlation (A, k) values, whereas FSL None and FreeSurfer showed very low to no correlation, indicating a large estimation bias. Automated segmentation of the hippocampus tends to have better consistency and reproducibility than the amygdala, which has been shown in multiple previous studies (Morey et al., 2009; Nugent et al., 2013; Pardoe et al., 2009; Schoemaker et al., 2016) that reported Pearson correlation coefficients ranging from r = 0.47 to r = 0.67 for the hippocampus and r = 0.24 to r = 0.35 for the amygdala using FSL‐FIRST and r = 0.67 to r = 0.82 and r = 0.45 to r = 0.61 for the hippocampus and amygdala, respectively, using FreeSurfer. Similar results were shown regarding the DSC with every automated method producing higher mean values for the hippocampus (DSC > 0.76) than the amygdala (DSC > 0.60) in our results. The studies conducted by Morey et al. and Pardoe et al. also included DSC analysis showing results of the hippocampus producing higher spatial overlap than the amygdala with both FSL‐FIRST and FreeSurfer, which is in line with our findings.
We found that FreeSurfer performed poorer than FSL‐FIRST overall. This was an unexpected finding, as FreeSurfer has previously been reported to be overall more accurate and consistent than FSL‐FIRST for both the hippocampus and amygdala for paediatric and adult populations (Morey et al., 2009; Schoemaker et al., 2016). Inter‐rater variability may have contributed to these differences, as it is one of the key challenges with manual segmentation. The differences can be more pronounced in structures such as the amygdala, where the border around the structure may be difficult to distinguish visually. In these instances, the rater must rely on general anatomical knowledge instead of the intensities of the MR image to determine the exact shape of the structure. This is even more significant in paediatric MR images, because they have different contrast and comparatively lower resolution than adult images (Gousias et al., 2012). Example segmentations of the hippocampus and amygdala are presented in Figure 9.
FIGURE 9.
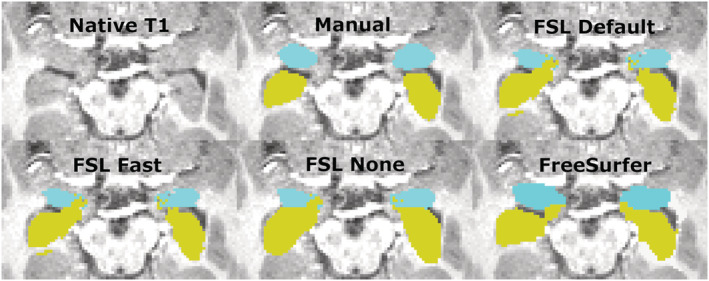
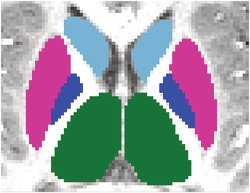
Transversal view of the segmentations of the hippocampus and amygdala. Yellow, hippocampus; turquoise, amygdala
4.2. Thalamus
The thalamus was most accurately segmented by FreeSurfer with only a slight overestimation. FSL Default and FSL None pipelines produced a larger overestimation, whereas Fast underestimated the volume. Previous studies have shown results of FreeSurfer producing larger or similar volumes compared to FSL‐FIRST (Hannoun et al., 2019; Makowski et al., 2018; Næss‐Schmidt et al., 2016). The discrepancy in results might be partly caused by inter‐rater variability between the researchers in different studies. Despite having the most accurate mean volume, FreeSurfer's Pearson correlation coefficient was significantly worse, r = 0.60, than any of FSL‐FIRST's pipelines, ranging from r = 0.86 to r = 0.89, indicating a larger volumetric variation in individual segmentations. Intraclass correlation (A, k) was on similar levels with coefficients ranging from ICC = 0.66 to ICC = 0.72, with all methods, suggesting a low to moderate reproducibility rate with manual segmentation. One previous study (Makowski et al., 2018) also showed weaker Pearson correlations for both FreeSurfer and FSL‐FIRST than our results, ranging from r = 0.37 to r = 0.44, but included a significantly smaller sample size of 30 adults and that may explain some of the differences. The DSC values were great for all methods in our study, DSC > 0.91 for FSL‐FIRST and DSC > 0.88 for FreeSurfer. A previous study done by Hannoun et al. (2019), including subjects aged between 1 and 18 years, showed similar results with DSC = 0.86 for FSL‐FIRST and DSC = 0.84 for FreeSurfer. Segmentations of the thalamus are presented in Figures 10 and 11.
FIGURE 10.
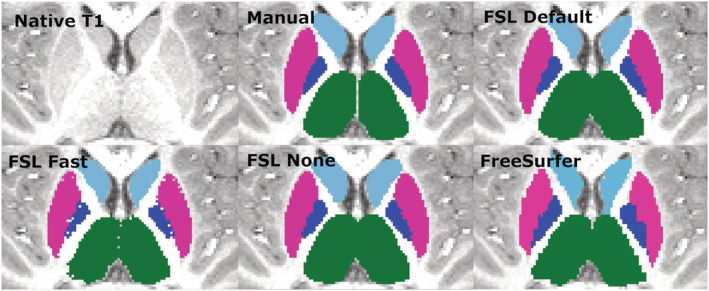
Transversal view of segmentations of the putamen, globus pallidus (GP), thalamus and caudate. Putamen, pink; GP, blue; thalamus, green; caudate, light blue
FIGURE 11.
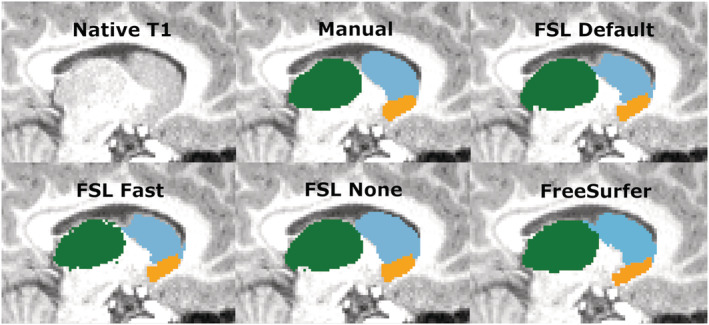
Sagittal view of the thalamus, caudate and nucleus accumbens. Thalamus, green; caudate, light blue; nucleus accumbens, orange
4.3. Putamen and GB
The putamen was segmented more accurately than the GP by all methods in this study. FSL Default and FSL None as well as FreeSurfer overestimated the putamen slightly, whereas Fast produced an underestimation of a similar volume. Similar results were observed with the GP, but with a greater magnitude. A previous study yielded similar results with FreeSurfer producing a higher overestimations than FIRST and GP having a greater relative volume difference than the putamen (Velasco‐Annis et al., 2017). FSL‐FIRST had excellent correlations for both putamen and GP, ranging from r = 0.86 to r = 0.98 across all pipelines. FreeSurfer also had a strong correlation for the putamen but performed significantly weaker for the GP with coefficients of r = 0.49 and r = 0.52 for the left and right GP. ICC (A, k) were high across the board, with all methods yielding a coefficient of ICC > 0.80 for the putamen. For the GP, intraclass correlations were significantly lower for FSL Fast and FreeSurfer, whereas FSL Default and FSL None had great values of ICC > 0.80 for both structures, indicating a small estimation bias and good reproducibility with manual segmentation. A 2017 published study showed FreeSurfer having slightly better segmentation reproducibility for both the putamen and GP (Velasco‐Annis et al., 2017). Another study published in 2018 showed the opposite and indicated that for FSL‐FIRST has better consistency for the GP segmentation (Makowski et al., 2018). Direct comparison of these results is not ideal because both studies were done on an adult population and included a sample size of 30 or less. The DSC results in our study were great across the board with FSL‐FIRST producing excellent results of DSC > 0.90 for both the putamen and GP with all techniques. FreeSurfer's results were lower, but still satisfactory, DSC > 0.79. A previous study showed similar results with FSL‐FIRST (DSC > 0.90), producing slightly higher DSC values than FreeSurfer (DSC > 0.80) for the putamen (Perlaki et al., 2017). However, the age of the subjects was not specified, so the results may not be adequately comparable with our findings. To our knowledge, this is the first automated segmentation method validation study done on a paediatric population including the putamen and GP. Segmentations of the putamen and GP are presented in Figure 10.
4.4. Caudate and nucleus accumbens
The caudate was overall segmented accurately, whereas the nucleus accumbens was overestimated by all methods in our study. The caudate was segmented accurately by all methods excluding FSL None, which overestimated both the caudate and the nucleus accumbens significantly. FreeSurfer and FSL‐FIRST's other pipelines produced an accurate volume for the caudate with only a minor underestimation. The nucleus accumbens was overestimated by all methods, with FSL None and FreeSurfer yielding the highest volumes. Notable is also the more prominent overestimation of the right nucleus accumbens, compared with the left, which was present in all four automated methods. Previous research indicates a moderate overestimation of both the caudate and nucleus accumbens with both FSL‐FIRST and FreeSurfer (Perlaki et al., 2017; Velasco‐Annis et al., 2017) with similar volumetric values compared with our results.
Pearson correlations coefficients were strong across all methods for the caudate, ranging from r = 0.69 to r = 0.84, showing a strong relationship between manual segmentation and the automated methods. The nucleus accumbens has similar coefficient values regarding FSL‐FIRST, but FreeSurfer produced significantly weaker correlations. The ICC (A, k) showed that FSL Default and FSL Fast had superior reproducibility compared with FSL None and FreeSurfer for the nucleus accumbens. The results are similar for the caudate with the exception of FreeSurfer performing just as good as FSL Default and FSL Fast, with ICC values ranging from ICC = 0.85 to ICC = 0.90, whereas FSL None's coefficients were significantly lower at ICC = 0.37 and ICC = 0.53 for the left and right caudate, respectively. The consistency and reproducibility of the caudate and nucleus accumbens have been documented in previous studies with slightly different results compared with our study (Perlaki et al., 2017; Velasco‐Annis et al., 2017). The article by Velasco‐Annis et al. suggested great reproducibility rates for the caudate with both FreeSurfer and FSL‐FIRST, with ICC values ranging from ICC = 0.86 to ICC = 0.93, producing similar values for each method. The other study conducted by Perlaki et al. showed a slightly better reproducibility with FreeSurfer regarding the caudate and nucleus accumbens. The study by Perlaki et al. (2017) also showed results similar to ours regarding the DSC values with FSL‐FIRST producing better slightly better values than FreeSurfer for the caudate.
Overall, these variations in results may be explained with the difficult determination of the border between the caudate and nucleus accumbens. The intensities of the MR image are visually indistinguishable for these two structures, which may lead to inaccuracy in volumetric quantification. To assess this problem, we combined the volumes of both structures to eliminate possible errors caused by the similarity of intensities. Considering the relatively small volume of the nucleus accumbens, the results for combined volume were similar to the results derived from the caudate volumes. Segmentations of the caudate and nucleus accumbens are presented in Figure 11.
4.5. Limitations
Our study presents a few limitations. Firstly, the sample size is limited due to the time‐consuming manual segmentation process but likely sufficient for building study‐specific templates, which is a potential goal for applied studies (Lee et al., 2019). Secondly, all manual segmentations were performed by a single rater, which might lead to some systematic biases in delineation of anatomical borders in MR images. However, the expert review provides some safeguard for this. On a related note, the manual segmentation was done by editing models produced by FSL None, which might potentially cause the manual segmentations to have a bias towards FSL‐FIRST. However, this was explored by segmenting a subsample based on FreeSurfer automated segmentation. Generally, the results were similar. There were some differences in structures that are smaller and harder to delineate, such as the amygdala and the nucleus accumbens. Additionally, some minor differences are to be expected simply to technical challenges when performing the manual segmentation using two different editing tools. Most importantly, automated FreeSurfer segmentation vastly overestimated amygdalar volumes even when compared with the manual segmentation based on it. Therefore, using FreeSurfer segmentation as the basis would not have changed the conclusion that visual inspection for certain structures is strongly advised.
5. CONCLUSIONS
In this feasibility study, we determined the accuracy of two automated segmentation tools for T1‐weighted MR images, FSL‐FIRST with three different boundary correction settings and FreeSurfer against manual segmentation in a paediatric 5‐year‐old population (N = 80). Overall, the automated tools show promising accuracies, but the performance of all automated tools changed vastly based on the structure. Small structures such as the amygdala and nucleus accumbens were inaccurately segmented by all automated methods. On the other hand, the segmentation of the putamen and the caudate were performed accurately with most of the automated methods and yielded relatively good consistency and reproducibility with manual segmentation. The use of these automated segmentation tools in neuroimaging studies still presents challenges, and careful visual inspection of the automated segmentations is still strongly advised, because there are many factors such as the quality of the used MR images that might impact the accuracy of the segmentations. Future research should investigate the benefits of using custom subcortical atlases to improve the accuracy and reliability of automated segmentation methods especially for the amygdala and hippocampus (Lee et al., 2019).
CONFLICT OF INTEREST
The authors declare no conflict of interest.
PEER REVIEW
The peer review history for this article is available at https://publons.com/publon/10.1111/ejn.15761.
Supporting information
Table S1. Comparison of mean (standard deviation) volumes and percentage of volume difference between techniques in randomly chosen half (n = 40) of the subjects. The volumetric unit used is 1 voxel (= 1 mm3)
Table S2. Comparison of mean (standard deviation) volumes and percentage of volume difference between techniques in randomly chosen half (n = 40) of the subjects. The volumetric unit used is 1 voxel (= 1 mm3)
Table S3. Comparison of correlation analysis between manual and automated segmentation techniques (FSL‐FIRST, FreeSurfer) in randomly chosen half of the subjects (n = 40)
Table S4. Comparison of correlation analysis between manual and automated segmentation techniques (FSL‐FIRST, FreeSurfer) in randomly chosen half of the subjects (n = 40)
ACKNOWLEDGEMENTS
EPP was supported by the Päivikki and Sakari Sohlberg Foundation. ESi was supported by Juho Vainio Foundation, Finnish Brain Foundation, Turunmaan Duodecim‐seura. VK was supported by Finnish Cultural Foundation and Lastenlinnan säätiö. NH was supported by the Orion Research Foundation, the University of Turku Graduate School and the Hospital District of Southwest Finland State Research Grants. LK was supported by Brain and Behavior Research Foundation, National Alliance for Research on Schizophrenia and Depression (NARSAD) (YI Grant No. 1956), State Grants for Clinical Research (ERVA) and the Academy of Finland (Profi 5, No. 325292). SN was supported by the State Grants for Clinical Research. JJT was supported by the Hospital District of Southwest Finland, Turku University Foundation, State Grants for Clinical Research and Emil Aaltonen Foundation and Alfred Kordelin Foundation (data collection and data analysis) as well as Sigrid Jusélius Foundation (interpretation of the data and writing the manuscript).
Lidauer, K. , Pulli, E. P. , Copeland, A. , Silver, E. , Kumpulainen, V. , Hashempour, N. , Merisaari, H. , Saunavaara, J. , Parkkola, R. , Lähdesmäki, T. , Saukko, E. , Nolvi, S. , Kataja, E.‐L. , Karlsson, L. , Karlsson, H. , & Tuulari, J. J. (2022). Subcortical and hippocampal brain segmentation in 5‐year‐old children: Validation of FSL‐FIRST and FreeSurfer against manual segmentation. European Journal of Neuroscience, 56(5), 4619–4641. 10.1111/ejn.15761
Kristian Lidauer and Elmo P. Pulli shared contribution.
Edited by: John Foxe
Funding information National Alliance for Research on Schizophrenia and Depression, Grant/Award Number: 1956; Suomen Aivosäätiö; Sigrid Jusélius Foundation; Alfred Kordelin Foundation; Emil Aaltonen Foundation; State Grants for Clinical Research; Turku University Foundation; Hospital District of Southwest Finland; State Grants for Clinical Research; Academy of Finland, Grant/Award Number: 325292; State Grants for Clinical Research (ERVA); Brain and Behavior Research Foundation; Hospital District of Southwest Finland; University of Turku Graduate School; Orion Research Foundation; Lastenlinnan säätiö; Finnish Cultural Foundation; Turunmaan Duodecim‐seura; Finnish Brain Foundation; Juho Vainio Foundation; Päivikki and Sakari Sohlberg Foundation
DATA AVAILABILITY STATEMENT
Research data are not shared. The ethics committee decision and local legislation do not allow the open sharing of neuroimaging data.
REFERENCES
- Acosta, H. , Kantojärvi, K. , Hashempour, N. , Pelto, J. , Scheinin, N. M. , Lehtola, S. J. , Lewis, J. D. , Fonov, V. S. , Collins, D. L. , Evans, A. , Parkkola, R. , Lähdesmäki, T. , Saunavaara, J. , Karlsson, L. , Merisaari, H. , Paunio, T. , Karlsson, H. , & Tuulari, J. J. (2020). Partial support for an interaction between a polygenic risk score for major depressive disorder and prenatal maternal depressive symptoms on infant right amygdalar volumes. Cerebral Cortex, 30, 6121–6134. 10.1093/cercor/bhaa158 [DOI] [PubMed] [Google Scholar]
- Akudjedu, T. N. , Nabulsi, L. , Makelyte, M. , Scanlon, C. , Hehir, S. , Casey, H. , Ambati, S. , Kenney, J. , O'Donoghue, S. , McDermott, E. , Kilmartin, L. , Dockery, P. , McDonald, C. , Hallahan, B. , & Cannon, D. M. (2018). A comparative study of segmentation techniques for the quantification of brain subcortical volume. Brain Imaging and Behavior, 12(6), 1678–1695. 10.1007/s11682-018-9835-y [DOI] [PubMed] [Google Scholar]
- Barch, D. M. , Harms, M. P. , Tillman, R. , Hawkey, E. , & Luby, J. L. (2019). Early childhood depression, emotion regulation, episodic memory, and hippocampal development. Journal of Abnormal Psychology, 128(1), 81–95. 10.1037/abn0000392 [DOI] [PMC free article] [PubMed] [Google Scholar]
- Barch, D. M. , Tillman, R. , Kelly, D. , Whalen, D. , Gilbert, K. , & Luby, J. L. (2019). Hippocampal volume and depression among young children. Psychiatry Research: Neuroimaging, 288, 21–28. 10.1016/j.pscychresns.2019.04.012 [DOI] [PMC free article] [PubMed] [Google Scholar]
- Braak, H. , & Braak, E. (1991). Neuropathological stageing of Alzheimer‐related changes. Acta Neuropathologica, 82, 239–259. 10.1007/BF00308809 [DOI] [PubMed] [Google Scholar]
- Cherbuin, N. , Anstey, K. J. , Réglade‐Meslin, C. , & Sachdev, P. S. (2009). In vivo hippocampal measurement and memory: A comparison of manual tracing and automated segmentation in a large community‐based sample. PLoS ONE, 4(4), e5265. 10.1371/journal.pone.0005265 [DOI] [PMC free article] [PubMed] [Google Scholar]
- Copeland, A. , Silver, E. , Korja, R. , Lehtola, S. J. , Merisaari, H. , Saukko, E. , Sinisalo, S. , Saunavaara, J. , Lähdesmäki, T. , Parkkola, R. , Nolvi, S. , Karlsson, L. , Karlsson, H. , & Tuulari, J. J. (2021). Infant and child MRI: A review of scanning procedures. Frontiers in Neuroscience, 15, 666020. 10.3389/fnins.2021.666020 [DOI] [PMC free article] [PubMed] [Google Scholar]
- de Macedo Rodrigues, K. , Ben‐Avi, E. , Sliva, D. D. , Choe, M. , Drottar, M. , Wang, R. , Fischl, B. , Grant, P. E. , & Zöllei, L. (2015). A FreeSurfer‐compliant consistent manual segmentation of infant brains spanning the 0–2 year age range. Frontiers in Human Neuroscience, 9, 21. 10.3389/fnhum.2015.00021 [DOI] [PMC free article] [PubMed] [Google Scholar]
- Doring, T. M. , Kubo, T. T. A. , Cruz, L. C. H. Jr. , Juruena, M. F. , Fainberg, J. , Domingues, R. C. , & Gasparetto, E. L. (2011). Evaluation of hippocampal volume based on MR imaging in patients with bipolar affective disorder applying manual and automatic segmentation techniques. Journal of Magnetic Resonance Imaging, 33(3), 565–572. 10.1002/jmri.22473 [DOI] [PubMed] [Google Scholar]
- Ferri, J. , Eisendrath, S. J. , Fryer, S. L. , Gillung, E. , Roach, B. J. , Mathalon, D. H. , & Francisco, S. (2018). Blunted amygdala activity is associated with depression severity in treatment‐resistant depression. Cognitive, Affective, & Behavioral Neuroscience, 17(6), 1221–1231. 10.3758/s13415-017-0544-6 [DOI] [PMC free article] [PubMed] [Google Scholar]
- Fischl, B. , Salat, D. H. , Busa, E. , Albert, M. , Dieterich, M. , Haselgrove, C. , Van Der Kouwe, A. , Killiany, R. , Kennedy, D. , Klaveness, S. , Montillo, A. , Makris, N. , Rosen, B. , & Dale, A. M. (2002). Whole brain segmentation: Neurotechnique automated labeling of neuroanatomical structures in the human. Brain, 33, 341–355. 10.1016/s0896-6273(02)00569-x [DOI] [PubMed] [Google Scholar]
- Fischl, B. , Salat, D. H. , van der Kouwe, A. J. W. , Makris, N. , Ségonne, F. , Quinn, B. T. , & Dale, A. M. (2004). Sequence‐independent segmentation of magnetic resonance images. NeuroImage, 23(Suppl 1), S69–S84. 10.1016/j.neuroimage.2004.07.016 [DOI] [PubMed] [Google Scholar]
- Fitzgerald, J. M. , DiGangi, J. A. , & Phan, K. L. (2019). Functional neuroanatomy of emotion and its regulation in PTSD. Harvard Review of Psychiatry, 26(3), 116–128. 10.1097/HRP.0000000000000185 [DOI] [PMC free article] [PubMed] [Google Scholar]
- Gousias, I. S. , Edwards, A. D. , Rutherford, M. A. , Counsell, S. J. , Hajnal, J. V. , Rueckert, D. , & Hammers, A. (2012). Magnetic resonance imaging of the newborn brain: Manual segmentation of labelled atlases in term‐born and preterm infants. NeuroImage, 62(3), 1499–1509. 10.1016/j.neuroimage.2012.05.083 [DOI] [PubMed] [Google Scholar]
- Greene, D. J. , Black, K. J. , & Schlaggar, B. L. (2016). Considerations for MRI study design and implementation in pediatric and clinical populations. Developmental Cognitive Neuroscience, 18, 101–112. 10.1016/j.dcn.2015.12.005 [DOI] [PMC free article] [PubMed] [Google Scholar]
- Grimm, O. , Pohlack, S. , Cacciaglia, R. , Winkelmann, T. , Plichta, M. M. , Demirakca, T. , & Flor, H. (2015). Amygdalar and hippocampal volume: A comparison between manual segmentation, Freesurfer and VBM. Journal of Neuroscience Methods, 253, 254–261. 10.1016/j.jneumeth.2015.05.024 [DOI] [PubMed] [Google Scholar]
- Grohs, M. N. , Lebel, C. , Carlson, H. L. , Craig, B. T. , & Dewey, D. (2021). Subcortical brain structure in children with developmental coordination disorder: A T1‐weighted volumetric study. Brain Imaging and Behavior, 15(6), 2756–2765. 10.1007/s11682-021-00502-y [DOI] [PMC free article] [PubMed] [Google Scholar]
- Hannoun, S. , Tutunji, R. , El Homsi, M. , Saaybi, S. , & Hourani, R. (2019). Automatic thalamus segmentation on unenhanced 3D T1 weighted images: Comparison of publicly available segmentation methods in a pediatric population. Neuroinformatics, 17(3), 443–450. 10.1007/s12021-018-9408-7 [DOI] [PubMed] [Google Scholar]
- Hashempour, N. , Tuulari, J. J. , Merisaari, H. , Lidauer, K. , Luukkonen, I. , Saunavaara, J. , Parkkola, R. , Lähdesmäki, T. , Lehtola, S. J. , Keskinen, M. , Lewis, J. D. , Scheinin, N. M. , Karlsson, L. , & Karlsson, H. (2019). A novel approach for manual segmentation of the amygdala and hippocampus in neonate MRI. Frontiers in Neuroscience, 13, 1025. 10.3389/fnins.2019.01025 [DOI] [PMC free article] [PubMed] [Google Scholar]
- Herrero, M. , & Barcia, C. (2002). Functional anatomy of thalamus and basal ganglia. Child's Nervous System, 18, 386–404. 10.1007/s00381-002-0604-1 [DOI] [PubMed] [Google Scholar]
- Jaroudi, W. , Garami, J. , Garrido, S. , Hornberger, M. , Keri, S. , & Moustafa, A. A. (2017). Factors underlying cognitive decline in old age and Alzheimer's disease: The role of the hippocampus. Reviews in the Neurosciences, 28(7), 705–714. 10.1515/revneuro-2016-0086 [DOI] [PubMed] [Google Scholar]
- Karlsson, L. , Tolvanen, M. , Scheinin, N. M. , Uusitupa, H. , Korja, R. , Ekholm, E. , Tuulari, J. J. , Pajulo, M. , Huotilainen, M. , Paunio, T. , Karlsson, H. , & FinnBrain Birth Cohort Study Group . (2018). Cohort profile: The FinnBrain birth cohort study (FinnBrain). International Journal of Epidemiology, 47(1), 15–16j. 10.1093/ije/dyx173 [DOI] [PubMed] [Google Scholar]
- Krabbe, S. , Gründemann, J. , & Lüthi, A. (2018). Review amygdala inhibitory circuits regulate associative fear conditioning. Biological Psychiatry, 83(10), 800–809. 10.1016/j.biopsych.2017.10.006 [DOI] [PubMed] [Google Scholar]
- Lee, A. , Poh, J. S. , Wen, D. J. , Tan, H. M. , Chong, Y.‐S. , Tan, K. H. , Gluckman, P. D. , Fortier, M. V. , Rifkin‐Graboi, A. , & Qiu, A. (2019). Maternal care in infancy and the course of limbic development. Developmental Cognitive Neuroscience, 40, 100714. 10.1016/j.dcn.2019.100714 [DOI] [PMC free article] [PubMed] [Google Scholar]
- Makowski, C. , Béland, S. , Kostopoulos, P. , Bhagwat, N. , Devenyi, G. A. , Malla, A. K. , Joober, R. , Lepage, M. , & Chakravarty, M. M. (2018). Evaluating accuracy of striatal, pallidal, and thalamic segmentation methods: Comparing automated approaches to manual delineation. NeuroImage, 170, 182–198. 10.1016/j.neuroimage.2017.02.069 [DOI] [PubMed] [Google Scholar]
- Manes, J. L. , Tjaden, K. , Parrish, T. , Simuni, T. , Roberts, A. , Greenlee, J. D. , Corcos, D. M. , & Kurani, A. S. (2018). Altered resting‐state functional connectivity of the putamen and internal globus pallidus is related to speech impairment in Parkinson's disease. 8(9), e01073. 10.1002/brb3.1073 [DOI] [PMC free article] [PubMed] [Google Scholar]
- Mcdonald, A. J. , & Mott, D. D. (2017). Functional neuroanatomy of amygdalohippocampal interconnections and their role in learning and memory. Journal of Neuroscience Research, 95(3), 797–820. 10.1002/jnr.23709 [DOI] [PMC free article] [PubMed] [Google Scholar]
- McGraw, K. O. , & Wong, S. P. (1996). Forming inferences about some intraclass correlation coefficients. Psychological Methods, 1(1), 30–46. 10.1037/1082-989X.1.1.30 [DOI] [Google Scholar]
- Moore, M. , Hu, Y. , Woo, S. , O'Hearn, D. , Iordan, A. D. , Dolcos, S. , & Dolcos, F. (2014). A comprehensive protocol for manual segmentation of the medial temporal lobe structures. Journal of Visualized Experiments: JoVE, (89), e50991. 10.3791/50991 [DOI] [PMC free article] [PubMed] [Google Scholar]
- Morey, R. A. , Petty, C. M. , Xu, Y. , Pannu Hayes, J. , Wagner, H. R. , Lewis, D. V. , LaBar, K. S. , Styner, M. , & McCarthy, G. (2009). A comparison of automated segmentation and manual tracing for quantifying hippocampal and amygdala volumes ☆. NeuroImage, 45(3), 855–866. 10.1016/j.neuroimage.2008.12.033 [DOI] [PMC free article] [PubMed] [Google Scholar]
- Mulder, E. R. , de Jong, R. A. , Knol, D. L. , van Schijndel, R. A. , Cover, K. S. , Visser, P. J. , Barkhof, F. , Vrenken, H. , & Alzheimer's Disease Neuroimaging Initiative . (2014). Hippocampal volume change measurement: Quantitative assessment of the reproducibility of expert manual outlining and the automated methods FreeSurfer and FIRST. NeuroImage, 92, 169–181. 10.1016/j.neuroimage.2014.01.058 [DOI] [PubMed] [Google Scholar]
- Næss‐Schmidt, E. , Tietze, A. , Blicher, J. U. , Petersen, M. , Mikkelsen, I. K. , Coupé, P. , Manjón, J. V. , & Eskildsen, S. F. (2016). Automatic thalamus and hippocampus segmentation from MP2RAGE: Comparison of publicly available methods and implications for DTI quantification. International Journal of Computer Assisted Radiology and Surgery, 11, 1979–1991. 10.1007/s11548-016-1433-0 [DOI] [PubMed] [Google Scholar]
- Nugent, A. C. , Luckenbaugh, D. A. , Wood, S. E. , Bogers, W. , Zarate, C. A. Jr. , & Drevets, W. C. (2013). Automated subcortical segmentation using FIRST: Test–retest reliability, interscanner reliability, and comparison to manual segmentation. 34(9), 2313–2329. 10.1002/hbm.22068 [DOI] [PMC free article] [PubMed] [Google Scholar]
- Owens‐Walton, C. , Jakabek, D. , Power, B. D. , Walterfang, M. , Velakoulis, D. , van Westen, D. , Looi, J. C. L. , Shaw, M. , & Hansson, O. (2019). Increased functional connectivity of thalamic subdivisions in patients with Parkinson's disease. PLoS ONE, 14(9), e0222002. 10.1371/journal.pone.0222002 [DOI] [PMC free article] [PubMed] [Google Scholar]
- Pardoe, H. R. , Pell, G. S. , Abbott, D. F. , & Jackson, G. D. (2009). Hippocampal volume assessment in temporal lobe epilepsy: How good is automated segmentation? Epilepsia, 50(12), 2586–2592. 10.1111/j.1528-1167.2009.02243.x [DOI] [PMC free article] [PubMed] [Google Scholar]
- Parnaudeau, S. , Bolkan, S. S. , & Kellendonk, C. (2018). The mediodorsal thalamus: An essential partner of the prefrontal cortex for cognition. Biological Psychiatry, 83, 648–656. 10.1016/j.biopsych.2017.11.008 [DOI] [PMC free article] [PubMed] [Google Scholar]
- Patenaude, B. , Smith, S. M. , Kennedy, D. N. , & Jenkinson, M. (2011). A Bayesian model of shape and appearance for subcortical brain segmentation. NeuroImage, 56(3), 907–922. 10.1016/j.neuroimage.2011.02.046 [DOI] [PMC free article] [PubMed] [Google Scholar]
- Perlaki, G. , Horvath, R. , Nagy, S. A. , Bogner, P. , Doczi, T. , Janszky, J. , & Orsi, G. (2017). Comparison of accuracy between FSL's FIRST and Freesurfer for caudate nucleus and putamen segmentation. Scientific Reports, 7(1), 2418. 10.1038/s41598-017-02584-5 [DOI] [PMC free article] [PubMed] [Google Scholar]
- Pipitone, J. , Park, M. T. , Winterburn, J. , Lett, T. A. , Lerch, J. P. , Pruessner, J. C. , Lepage, M. , Voineskos, A. N. , Chakravarty, M. M. , & Alzheimer's Disease Neuroimaging Initiative . (2014). Multi‐atlas segmentation of the whole hippocampus and subfields using multiple automatically generated templates. NeuroImage, 101, 494–512. 10.1016/j.neuroimage.2014.04.054 [DOI] [PubMed] [Google Scholar]
- Power, B. D. , Wilkes, F. A. , Hunter‐Dickson, M. , van Westen, D. , Santillo, A. F. , Walterfang, M. , Nilsson, C. , Velakoulis, D. , & Looi, J. C. L. (2015). Validation of a protocol for manual segmentation of the thalamus on magnetic resonance imaging scans. Psychiatry Research, 232(1), 98–105. 10.1016/j.pscychresns.2015.02.001 [DOI] [PubMed] [Google Scholar]
- Pulli, E. P. , Eero, S. , Venla, K. , Anni, C. , Harri, M. , Jani, S. , Riitta, P. , Tuire, L. , Ekaterina, S. , Saara, N. , Eeva‐Leena, K. , Riikka, K. , Linnea, K. , Hasse, K. , & Tuulari Jetro, J. (2022). Feasibility of FreeSurfer processing for T1‐weighted brain images of 5‐year‐olds: Semiautomated protocol of FinnBrain neuroimaging lab. Frontiers in Neuroscience, 16, 874062. 10.3389/fnins.2022.874062 [DOI] [PMC free article] [PubMed] [Google Scholar]
- Pulli, E. P. , Kumpulainen, V. , Kasurinen, J. H. , Korja, R. , Merisaari, H. , Karlsson, L. , Parkkola, R. , Saunavaara, J. , Lähdesmäki, T. , Scheinin, N. M. , Karlsson, H. , & Tuulari, J. J. (2019). Prenatal exposures and infant brain: Review of magnetic resonance imaging studies and a population description analysis. Human Brain Mapping, 40(6), 1987–2000. 10.1002/hbm.24480 [DOI] [PMC free article] [PubMed] [Google Scholar]
- Reuter, M. , Rosas, H. D. , & Fischl, B. (2010). Highly accurate inverse consistent registration: A robust approach. NeuroImage, 53(4), 1181–1196. 10.1016/j.neuroimage.2010.07.020 [DOI] [PMC free article] [PubMed] [Google Scholar]
- Reuter, M. , Schmansky, N. J. , Rosas, H. D. , & Fischl, B. (2012). Within‐subject template estimation for unbiased longitudinal image analysis. NeuroImage, 61(4), 1402–1418. 10.1016/j.neuroimage.2012.02.084 [DOI] [PMC free article] [PubMed] [Google Scholar]
- Roediger, D. J. , Krueger, A. M. , de Water, E. , Mueller, B. A. , Boys, C. A. , Hendrickson, T. J. , Schumacher, M. J. , Mattson, S. N. , Jones, K. L. , Lim, K. O. , & Wozniak, J. R. (2021). Hippocampal subfield abnormalities and memory functioning in children with fetal alcohol spectrum disorders. Neurotoxicology and Teratology, 83, 106944. 10.1016/j.ntt.2020.106944 [DOI] [PMC free article] [PubMed] [Google Scholar]
- Sandman, C. A. , Head, K. , Muftuler, L. T. , Su, L. , Buss, C. , & Davis, E. P. (2014). Shape of the basal ganglia in preadolescent children is associated with cognitive performance. NeuroImage, 99, 93–102. 10.1016/j.neuroimage.2014.05.020 [DOI] [PMC free article] [PubMed] [Google Scholar]
- Sawangjit, A. , Oyanedel, C. N. , Niethard, N. , Salazar, C. , Born, J. , & Inostroza, M. (2018). The hippocampus is crucial for forming non‐hippocampal long‐term memory during sleep. Nature, 564(7734), 109–113. 10.1038/s41586-018-0716-8 [DOI] [PubMed] [Google Scholar]
- Schoemaker, D. , Buss, C. , Head, K. , Sandman, C. A. , Davis, E. P. , Chakravarty, M. M. , Gauthier, S. , & Pruessner, J. C. (2016). Corrigendum to “Hippocampus and amygdala volumes from magnetic resonance images in children: Assessing accuracy of FreeSurfer and FSL against manual segmentation”[NeuroImage 129 (2016) 1–14] (S1053811916000537) (10.1016/j.neuroimage.2016.01.038). NeuroImage, 173, 1–2. 10.1016/j.neuroimage.2018.02.009 [DOI] [PMC free article] [PubMed] [Google Scholar]
- Segonne, F. , Dale, A. M. , Busa, E. , Glessner, M. , Salat, D. , Hahn, H. K. , & Fischl, B. (2004). A hybrid approach to the skull stripping problem in MRI. NeuroImage, 22, 1060–1075. 10.1016/j.neuroimage.2004.03.032 [DOI] [PubMed] [Google Scholar]
- Shrout, P. E. , & Fleiss, J. L. (1979). Intraclass correlations: Uses in assessing rater reliability. Psychological Bulletin, 86(2), 420–428. 10.1037//0033-2909.86.2.420 [DOI] [PubMed] [Google Scholar]
- Singh‐bains, M. K. , Waldvogel, H. J. , & Faull, R. L. M. (2016). The role of the human globus pallidus in Huntington's disease. Brain Pathology, 26, 741–751. 10.1111/bpa.12429 [DOI] [PMC free article] [PubMed] [Google Scholar]
- Terwee, C. B. , Bot, S. D. M. , de Boer, M. R. , van der Windt, D. A. , Knol, D. L. , Dekker, J. , Bouter, L. M. , & de Vet, H. C. (2007). Quality criteria were proposed for measurement properties of health status questionnaires. Journal of Clinical Epidemiology, 60, 34–42. 10.1016/j.jclinepi.2006.03.012 [DOI] [PubMed] [Google Scholar]
- Toazza, R. , Franco, A. R. , Buchweitz, A. , Molle, R. D. , Rodrigues, D. M. , Reis, R. S. , Mucellini, A. B. , Esper, N. B. , Aguzzoli, C. , Silveira, P. P. , Salum, G. A. , & Manfro, G. G. (2016). Amygdala‐based intrinsic functional connectivity and anxiety disorders in adolescents and young adults. Psychiatry Research: Neuroimaging, 257, 11–16. 10.1016/j.pscychresns.2016.09.010 [DOI] [PubMed] [Google Scholar]
- Tye, K. M. , Prakash, R. , Kim, S. , Fenno, L. E. , Grosenick, L. , Zarabi, H. , Thompson, K. R. , Gradinaru, V. , Ramakrishnan, C. , & Deisseroth, K. (2011). Amygdala circuitry mediating reversible and bidirectional control of anxiety. Nature, 471(7338), 358–362. 10.1038/nature09820.Amygdala [DOI] [PMC free article] [PubMed] [Google Scholar]
- Velasco‐Annis, C. , Akhondi‐asl, A. , Stamm, A. , & Warfield, S. K. (2017). Reproducibility of brain MRI segmentation algorithms: Empirical comparison of local MAP PSTAPLE, FreeSurfer, and FSL‐FIRST. 12–15. 10.1111/jon.12483 [DOI] [PubMed]
- Wang, Z. , Fontaine, M. , Cyr, M. , Rynn, M. A. , Simpson, H. B. , Marsh, R. , & Pagliaccio, D. (2022). Subcortical shape in pediatric and adult obsessive‐compulsive disorder. Depression and Anxiety, 39, 504–514. 10.1002/da.23261 [DOI] [PMC free article] [PubMed] [Google Scholar]
- Zou, K. , Warfield, S. , Bharatha, A. , Tempany, C. , Kaus, M. , Haker, S. , Wells, W. M. III , Jolesz, F. A. , & Kikinis, R. (2004). Statistical validation of image segmentation quality based on a spatial overlap index. Academic Radiology, 11(2), 178–189. 10.1016/S1076-6332(03)00671-8 [DOI] [PMC free article] [PubMed] [Google Scholar]
Associated Data
This section collects any data citations, data availability statements, or supplementary materials included in this article.
Supplementary Materials
Table S1. Comparison of mean (standard deviation) volumes and percentage of volume difference between techniques in randomly chosen half (n = 40) of the subjects. The volumetric unit used is 1 voxel (= 1 mm3)
Table S2. Comparison of mean (standard deviation) volumes and percentage of volume difference between techniques in randomly chosen half (n = 40) of the subjects. The volumetric unit used is 1 voxel (= 1 mm3)
Table S3. Comparison of correlation analysis between manual and automated segmentation techniques (FSL‐FIRST, FreeSurfer) in randomly chosen half of the subjects (n = 40)
Table S4. Comparison of correlation analysis between manual and automated segmentation techniques (FSL‐FIRST, FreeSurfer) in randomly chosen half of the subjects (n = 40)
Data Availability Statement
Research data are not shared. The ethics committee decision and local legislation do not allow the open sharing of neuroimaging data.