

Abstract
Bisphenol S (BPS) has been introduced into the industry as a safer alternative to bisphenol A (BPA). However, the recent studies have reported a possible association between BPS and disturbed glucose homeostasis, indicating that it may be a risk factor for type 1 and type 2 diabetes mellitus, obesity, and gestational diabetes mellitus. Nevertheless, the role of BPS in glucose metabolism remains controversial. In this study, we investigated the glucose metabolism of male Wistar rats born from dams that were BPS‐exposed (groups: BPS‐L (0.05 mg/kg/day), BPS‐H (20 mg/kg/day)) during pregnancy and lactation. We observed that both BPS treated groups of animals presented a significant decrease in anogenital distance/weight1/3, as compared to control animals, although no alterations in testosterone levels were observed. Furthermore, the BPS‐L group presented a significant decrease in body weight from postnatal day (PND) 21 to adult stage. In addition, a significant increase in glucose tolerance, pancreatic β‐cell proliferation, the frequency of small islets, and the average β‐cell size at PND 36 was observed in this group. However, no changes in insulin serum levels and percentage of β‐cells were recorded. Furthermore, these changes were not preserved at the adult stage (PND 120). The results suggest that the administration of low doses of BPS during the perinatal period induced an estrogenic like effect, with males apparently becoming more female‐like in their responses to a glucose challenge.
Keywords: Bisphenol‐S, glucose homeostasis, insulin, pancreas, perinatal
1. INTRODUCTION
An endocrine‐disrupting compound (EDC) was defined by the U.S. Environmental Protection Agency (US EPA) as an exogenous agent that interferes with synthesis, secretion, transport, metabolism, binding action, or elimination of natural blood‐borne hormones that are present in the body and are responsible for homeostasis, reproduction, and developmental process. Over the past decades, the adverse effects of EDCs have been demonstrated over endocrine‐related disorders in humans and animals. Bisphenol‐A (BPA) is one of the most studied EDCs with estrogenic actions, as it is ubiquitous in the environment, and humans are routinely exposed to it. 1 BPA exposure has been associated with increased risk of various health abnormalities, including metabolic disorders like diabetes and obesity in humans and animals. 2 , 3 , 4 , 5 , 6 , 7 , 8 Exposure of mice and rats to BPA at low doses during pregnancy, or pregnancy and lactation, produced alterations in blood glucose homeostasis and β‐cell function in male adult offspring. 9 , 10 , 11 , 12 , 13 Due to all these investigations, BPA has been facing stricter regulations in the recent years. Since 2011, the EU has prohibited the use of BPA in polycarbonate baby bottles and set a migration limit of 0.6 mg/kg for the production of plastics. 14 , 15 France has expanded these restrictions and prohibited the use of BPA in all food contact material since 2015. 16 In the United States, BPA in food contact material is generally permitted, although there are restrictions for baby bottles, sippy cups, and infant formula packaging. 17 , 18 Therefore, the industry quickly formulated new BPA‐free plastics to be used as food packaging and food storage containers instead, which are made using bisphenol analogs with very similar structural and chemical properties, resulting in the increased usage of these plastics. Unfortunately, little or no research was done to determine the safety of these BPA‐free products before they were marketed to the public as a healthier alternative. Bisphenol S (4,4′‐sulfonyldiphenol, BPS), which contains two sulfur‐connected phenolic rings, is one of the most used analogs of BPA, given its physical–chemical characteristics, which includes higher resistance to sunlight and high temperatures. 19 , 20 Therefore, BPS has a longer half‐life and is more likely to accumulate in the environment. 21 It can be found in thermal receipt papers, polycarbonate plastics, canned foods/soft drinks, epoxy resins, and plastic baby bottles. 22 BPS has been detected in human urine samples in different countries. 19 , 23 Generally, the concentrations of BPS in environmental matrices and human samples are lower than that of BPA. 24 However, it is worth stating that BPS concentrations bigger than that of BPA in surface water and human samples have been detected in some regions. For example, the mean values 135 ng/L of BPS and 73 ng/L of BPA (from 2012 to 2016) were reported in surface water from the Pearl River, China. 24 Also, 0.76 ng/mL of BPS and 0.6 ng/mL of BPA in male blood samples have been reported in China. 25 BPS has also been found in maternal and cord blood serum (<0.03–0.07 and 0.03–0.12 ng/mL, respectively), 26 suggesting that BPS can cross the placental barrier and in breastmilk at a concentration of 0.23 μg/kg, 27 suggesting that infants may be exposed to BPS through breastfeeding. Like BPA, BPS has been reported to have estrogenic activity in vitro, 28 and because of its structural similarities with BPA, there is a risk that BPS may have similar adverse effects on the endocrine system. Moreover, as BPS continues to be used as BPA replacement, it is pretty logical to speculate that in the future, its presence in the environment will be more significant than BPA and potentially cause similar or greater toxicity than BPA.
Like BPA, BPS has been considered a potential EDC that may contribute to metabolic disorders. 24 Several studies have recently reported a possible association between BPS and disturbed glucose homeostasis, but this correlation is inconclusive. Epidemiological studies have revealed that, as reflected by urine concentrations, BPS exposure may be a risk factor for type 2 diabetes mellitus (T2DM), obesity, and gestational diabetes mellitus. 29 , 30 , 31 Additionally, BPS was suggested to induce the risk of type 1 diabetes mellitus (T1DM). 32 In rats, postnatal administration of BPS induced an increase in fasting glucose levels and glucose levels in glucose tolerance tests and reduced insulin tolerance. 33 , 34 , 35 However, no significant associations have been found between serum BPS concentrations and fasting blood‐glucose concentrations in humans. 36 Likewise, in perinatal BPS treated offspring rats, no significant changes were observed in the fasting insulinemia and glycemia. Furthermore, no changes were observed in the oral glucose tolerance test and the pyruvate test. 37 In addition, BPS is significantly negatively associated with fasting insulin concentration and Homeostatic Model of Insulin Resistance (HOMA‐IR) index score among women of reproductive age with a body mass index (BMI) ≥ 25 kg/m2. 38 The underlying mechanisms are not well understood, but the previous studies suggest that the pancreas is one of the most critical targets of bisphenols concerning pancreatic impairment and β‐cell ultrastructural injuries. 10 , 39 , 40 , 41
Due to the concerns about the effect of BPS exposure on human health, it is necessary to expand our knowledge about BPS exposure over glucose homeostasis, especially its effects at different stages of life when it is administered during sensitive stages of organ differentiation. In this sense, the present study aimed to evaluate the effects of perinatal BPS exposure on glucose homeostasis and pancreatic β‐cell function, proliferation, and death. In our research, pregnant rats were exposed to a vehicle or BPS (0.05 or 20 mg/kg/day) from gestational day (GD) 6 to postnatal day (PND) 21. We evaluated male offspring weight, anogenital distance, glucose tolerance, insulin serum levels, pancreatic β‐cell proliferation and death, percentage of β‐cell area, average area of the β‐cells, and testosterone serum levels at PND 36 and 120.
2. MATERIALS AND METHODS
2.1. Animals and study design
Animal maintenance and handling were carried out in accordance with the Guidelines of the Mexican Law of Animal Protection and the National Institutes of Health guide for the care and use of laboratory animals, with approval of the Institutional Animal Use and Care Committee at the School of Chemistry, UNAM. Wistar rats were obtained from the animal center UNAM‐Harlan. Adult pregnant female rats (200–250 g) were used. Animals were maintained under a 12:12 h light: dark cycle with commercial food (Teklad Global Rodent Diet T.2018S.15, Envigo, USA) and tap water available ad libitum. The nutritional composition of the commercial food can be consulted at: https://insights.envigo.com/hubfs/resources/data-sheets/2018s-datasheet-0915.pdf. This food does not contain alfalfa, thus lowering the occurrence of natural phytoestrogens. Typical isoflavone concentrations (daidzein + genistein aglycone equivalents) range from 150 to 250 mg/kg. Although we did not evaluate endocrine disruptors contained in the food and water, all animal groups were feed with the same food and water, so the differences observed between groups would be due to the BPS administered to the animals.
Cycling female rats (F0 generation) were mated with unexposed, fertility‐proven males. The day after, females were checked for a vaginal sperm plug or sperm in the vaginal smear, considering that day as the gestational day (GD) 1. Then they were individually housed for further procedures. Considering that there are no established safe doses for BPS, we used those preconized for BPA as references. In 2010, both the EPA and FDA considered 50 μg/kg body weight (BW)/day BPA as tolerable daily ingestion (TDI). 42 In 2020, EFSA reported the lowest NOAEL for BPS of 20 mg/kg BW/d. 43 Given this information, three groups of n = 7 rats each were made: BPS (Sigma‐Aldrich, Co., St. Louis, MO, USA) low dose (BPS‐L) received 0.05 mg/kg/day, BPS high dose (BPS‐H) received 20 mg/kg/day, and the control group only received vehicle. Experimental females were exposed to BPS in their drinking water; BPS was diluted in water–ethanol 0.1%. BPS was given from GD 6 to lactation day 21. We selected this exposure period since both fetal and neonatal life is critical to pancreas development in rodents. We used glass water bottles to ensure that related compounds did not leach from plastic water bottles. Control females were given water containing only 0.1% ethanol (vehicle). Upon delivery, litters were adjusted to 10 pups per dam. Pups were not handled until weaning day to avoid dams' rejection, so on weaning day (PND 21), anogenital distance (AGD) and weight were measured in offspring. The weight of the offspring was evaluated every week until 120 days of age.
Beginning on the day of weaning, F1 pups were supplied with unadulterated drinking water and commercial food ad libitum. Experiments were performed when animals were at PND 36 and PND 120.
2.2. Glucose tolerance test
For the ip glucose tolerance test (IPGTT), animals fasted for 12 hours, and blood samples were obtained from the tail vein. Animals were then injected ip with 2 g/kg BW of glucose, and blood samples were taken at 0, 20, 40, 60, and 120 min. For each group, seven animals from 7 litters were used. Another set of animals of each experimental group was made in a nonfasting condition, and a glucose tolerance test (GTT) was carried out as previously described. The area under the curve (AUC) was measured as a glucose tolerance index. For each group, seven animals from seven different litters were used.
2.3. Serum insulin levels
Blood samples were collected for insulin analysis after decapitation of the animals at a fed state. Serum samples were obtained by centrifugation for 15 min at 1200 rpm at 4°C and stored at −80°C. A competitive radioimmunoassay analyzed the serum insulin level in a liquid phase. 44 Intra‐ and inter‐assay coefficients of variation were 6.5% and 6.0%, respectively.
2.4. Pancreatic β‐cell proliferation and islet morphometric analysis
For each experimental group, seven animals from 7 litters were given an ip injection of 5‐Bromo‐2′‐deoxyuridine (BrdU; 100 μg/g) 6 h before they were euthanized. Pancreatic tissue was collected and fixed overnight in 4% paraformaldehyde. Subsequently, pancreatic tissue was embedded in paraffin, and tissue sections (5 μm thick) were prepared and mounted on poly‐L‐lysine coated slides. The BrdU labeling and detection kit (11 296 736 001, Merck, Germany) was used to detect the cells that had incorporated BrdU into DNA, following the manufacturer's protocol. Briefly, rehydrated sections were microwaved (two cycles of 10 min each) in 0.01 M sodium citrate, pH 6, and cooled to room temperature. After washing with PBS, the slides were incubated in 0.5% Triton X‐100 for 10 min, and non‐specific immunoglobulin binding was blocked by incubating sections in 5% bovine serum albumin (BSA) for 30 min. Sections were incubated with anti‐BrdU mouse monoclonal antibody at a 1:20 dilution in incubation buffer (66 mM Tris buffer, 0.66 mM MgCl2, 1 mM 2‐mercaptoethanol) for 60 min at 37 °C. For negative control, the primary antibody was omitted. Samples were then incubated with rabbit anti‐insulin (1:200, SC‐9168; Santa Cruz Biotechnology, Inc., USA) and mouse anti‐glucagon (1:1000; G2654, Sigma‐Aldrich Co., USA) overnight at 4°C. After washing with PBS, sections were incubated for 2 h at room temperature with fluorescein‐conjugated rabbit anti‐mouse IgG (11 296 736 001, Merck, Germany) diluted 1:20 in PBS and TRITC‐conjugated donkey anti‐rabbit IgG (711–025‐152, Jackson ImmunoResearch Laboratories, Inc.) diluted 1:100 in PBS. Slides were washed with PBS and covered with Fluoroshield with DAPI (Sigma‐Aldrich Co., St. Louis, MO, USA). Sections were observed in an Eclipse E600 fluorescent microscope (Nikon Co., LTD., Tokyo, Japan). Images were acquired for triple‐stained sections: Blue DAPI nuclei staining, red insulin staining, green BrdU, and glucagon staining. All three images were merged, and the number of β cells in the islet, the islet area (calculated by insulin‐positive cells in sections), the total pancreas area, and the number of proliferating β cells in the islet were analyzed with ImageJ. BrdU‐positive nuclei were scored only in cells that were also positive for insulin. The percentage of the β‐cell area was calculated as a ratio of β‐cell area to the total pancreas area and multiplying this ratio by 100. The average area of the β cells was obtained by dividing the area of the islet by the number of β‐cells in the islet. At least 20 islets were analyzed from each animal; n = 7 animals from 7 different litters were used for each studied group.
2.5. Pancreatic β‐cell death
Pancreatic tissue sections previously mounted on poly‐L‐lysine coated slides were used to evaluate apoptotic β‐cell death. First, sections were heated at 60°C and cleared of Paraplast Plus with xylene and then rehydrated. Next, an in situ cell death detection kit (Merck, Germany) was used to visualize the apoptotic pancreatic β‐cells. Rehydrated sections were incubated at room temperature for 30 min with proteinase K (MP Biomedical, Irvine, Calif) (20 μg/mL in 10 mM Tris–HCl, pH 8.0). After rising with phosphate‐buffered saline (PBS), sections were permeabilized with 0.1% Triton X‐100 (Sigma Chemical Co, St Louis Mo) in PBS for 2 min at 4°C. Positive control sections were treated for 10 min at 37°C with DNase I (Sigma Chemical Co). Next, slides were rinsed with PBS and incubated for 1 h at 37°C in the terminal deoxynucleotidyl transferase biotin‐dUTP nick end labeling (TUNEL) reaction mixture (terminal deoxynucleotidyl transferase enzyme [TdT] with the nucleotide‐rhodamine‐conjugated mixture in reaction buffer; Merck). In negative controls, the TdT enzyme was omitted from the reaction mixture. Next, the slides were rinsed in PBS and incubated overnight at 4°C with a rabbit polyclonal anti‐insulin antibody (1:200, SC‐9168 rabbit polyclonal; Santa Cruz Biotechnology, Inc., USA). The subsequent day, sections were rinsed and incubated for 1 h with fluorescein‐conjugated goat anti‐rabbit antibody (1:100 Alexa Fluor™ 488, A11034, Invitrogen, USA). For negative control, the primary antibody was omitted. Next, slides were washed with PBS and covered with Fluoroshield with DAPI (Sigma‐Aldrich Co., St. Louis, MO, USA). Another positive control was done to detect a high number of apoptotic β‐cells 45 : Adult male rats were gonadectomized. Four days after gonadectomy, animals were given an intraperitoneal injection of streptozotocin (Sigma Chemical Co) 60 mg/kg BW in citrate buffer (100 mM, pH 4.5). After 6 h of streptozotocin treatment, rats were killed, and the pancreas was processed as previously described. Sections were observed in an Eclipse E600 fluorescent microscope (Nikon Co., LTD., Tokyo, Japan). Each preparation images were acquired in a Nikon Digital Sight DS‐5 M Camera System (Nikon Co, LTD, Tokyo, Japan). TUNEL‐positive nuclei were scored only in cells that were also positive for insulin. The TUNEL fluorescent nuclei (red) were counted in at least 10 islets per animal and expressed as a percentage of apoptotic nuclei to the total nuclei in the pancreatic islets.
2.6. Testosterone serum levels
Serum testosterone levels were determined by enzyme‐linked immunosorbent assay (ELISA) (DRG Instruments GmbH, Marburg, Germany). The analyses were performed in independent serum samples from groups of seven rats for each experimental condition. All samples were stored at −70 °C until needed and determined as previously described. 46 Analytical sensitivity was 5.0 ng/dL; intra‐ and inter‐assay coefficients were 4.6% and 6.2%, respectively.
2.7. Statistical analysis
Due to the nonmonotonic dose–response effects of bisphenols, the data of both BPS groups were directly compared with those of the control, not to each other. Therefore, all data were analyzed using unpaired Student's t‐test. Prism 2.01 program (Graph Pad, San Diego, CA) was used for calculating probability values.
3. RESULTS
3.1. BPS perinatal treatment reduces AGD and weight of F1 animals
AGD is the distance between the anus and the external genitalia, and it has been long used as a marker for fetal androgen disturbance. 47 This parameter was measured in F1 offspring on PND 21 using a vernier. Male offspring from BPS‐L and BPS‐H treated dams showed a significant decrease of AGD/weight1/3 than the control group (Figure 1).
FIGURE 1.

BPS perinatal treatment reduces AGD/BW1/3 and the weight of F1 animals. (A) AGD and body weight were evaluated at weaning (PND 21). (B) Mean body weight and (C) percentage of control weight were evaluated from weaning to 18 weeks. Data are expressed as mean ± SEM; some SEMs are not visible due to their low values. *p < 0.05 as compared to the control. n = 35 animals per group
In order to study BPS perinatal treatment over glucose metabolism of the offspring, animals from the three experimental groups were weighted starting at PND 21 until PND 126. During this time, the BPS‐L group presented a statistically lower weight than the control group, while the BPS‐H presented a weight similar to the control group (Figure 1).
3.2. BPS perinatal treatment decreased glucose serum levels at PND 36
In order to investigate the cause of the lower weight of the BPS‐L group, we performed an ip glucose tolerance test (IPGTT) in the PND 36 and PND 120 groups, both in a fasted and nonfasted state. At PND 36 in the fasted state, there was no difference in blood glucose levels between studied groups (Figure 2A). In contrast, in the nonfasted state, the BPS‐L group showed a statistically lower total glucose response (area under the curve (AUC)) to the glucose load relative to the control group, while the BPS‐H group presented a similar value to the control group (Figure 2B). At PND 120, no statistical differences were observed in any of the BPS treated groups, in the fasted and the nonfasted state, compared to the control group (Supplementary Figure 1).
FIGURE 2.
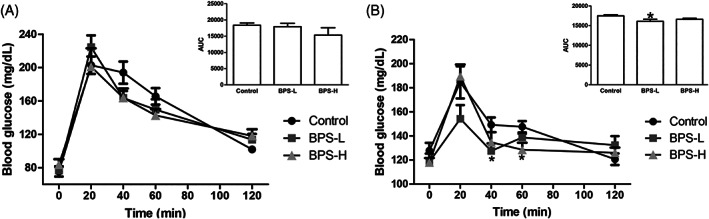
IPGTT shows blood glucose homeostasis in offspring. Serum glucose concentrations (mg/dL) following administration of glucose load (2 g/kg BW) in fasted (A) and nonfasted state (B) at PND 36 of age. The mean total glucose AUC is shown in the inset at each condition. Data are presented as mean ± SEM. *p < 0.05, as compared to the control. n = 7 animals per group from seven different litters
Since a difference in glucose tolerance was observed in the nonfasted state, we evaluated insulin serum levels in these animals. Although a trend to increase insulin serum level was observed in the PND 36 BPS‐L group, as compared to the control group, this difference was not significant (Supplementary Figure 2A). At PND 120, a trend to decrease insulin serum levels was observed in the BPS‐L group, as compared to the control (Supplementary Figure 2B). BPS‐H group presented insulin levels similar to the control group at both ages (Supplementary Figure 2).
3.3. β‐cell proliferation is increased in BPS‐L animals
Since it has been observed that BPA treatment induced a decrease in body weight was correlated to an increase in β‐cell proliferation, 11 we evaluated the proliferation of pancreatic β‐cells at PND 36 and PND 120. At PND 36, we observed a significant increase in the number of proliferating β‐cells in the BPS‐L group, compared to the control, while in the BPS‐H group, there was no difference (Figure 3 A–C, G). At PND 120, the proliferation of β‐cells decreased compared to PND 36. Although a trend to increase β‐cell proliferation in BPS‐L and BPS‐H groups was observed, as compared to the control, this was not statistically significant (Figure 3 D–F, H).
FIGURE 3.
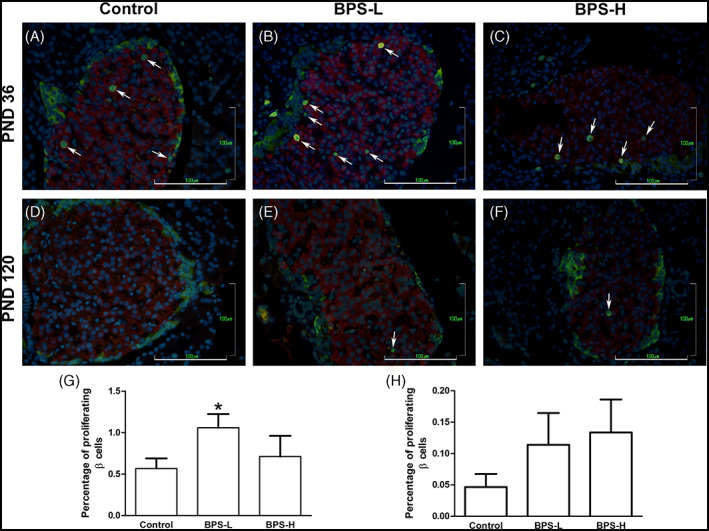
BPS‐L perinatal treatment induces an increase of β‐cells proliferation in offspring at PND 36. Proliferating β‐cells at PND 36 (A‐C, G) and PND 120 (D‐F, H), in control (A, D), BPS‐L (B, E), and BPS‐H (C, F) groups. Proliferating β‐cells were revealed by immunofluorescence using anti‐BrdU (green nuclei), anti‐insulin (red cytoplasm), and anti‐glucagon (green cytoplasm) antibodies, and nuclei were counterstained with DAPI (blue nuclei). White arrows indicate proliferating β‐cells. Bar = 100 μm. Data are presented as mean ± SEM. *p < 0.05, as compared to the control. n = 7 animals per group from seven different litters
3.4. Apoptosis
Apoptotic cell death in pancreatic β‐cells from PND 36 animals was evaluated by TUNEL. In all the groups, we observed a low number of apoptotic β‐cells, and no significant differences were detected among them (Figure 4).
FIGURE 4.
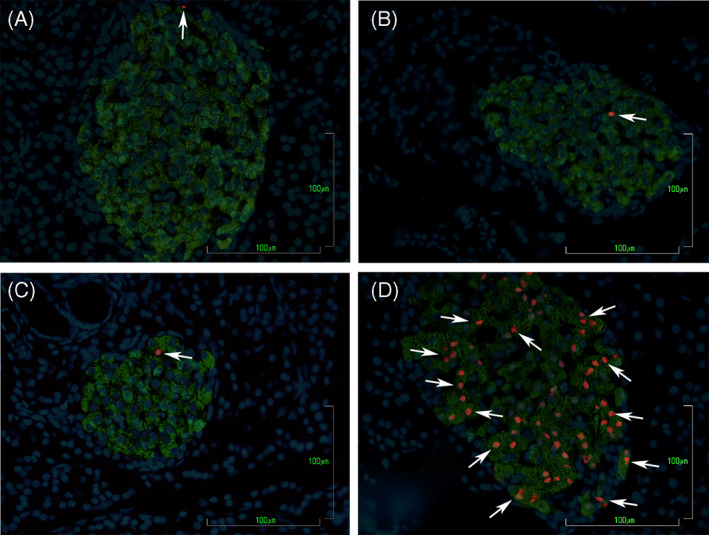
BPS perinatal treatment does not produce changes in β‐cells apoptosis in offspring at PND 36. Apoptotic β‐cells detected by TUNEL technique in pancreas slides from control (A), BPS‐L (B), BPS‐H (C), and positive control streptozotocin‐treated gonadectomized rats (D). Apoptotic β‐cells were revealed by TUNEL reaction (red nuclei), anti‐insulin (green cytoplasm), and nuclei were counterstained with DAPI (blue nuclei). White arrows indicate apoptotic β‐cells. Bar = 100 μm. n = 7 animals per group from seven different litters
3.5. Islet morphometric analysis
Since we observed an increase in β‐cell proliferation in BPS‐L treated animals at PND 36, we decided to study whether the pancreatic β‐cell area was altered in BPS treated rats. At PND 36, although the percentage of β‐cell area presented a trend to decrease in both BPS treated groups, as compared to the control, these differences were not statistically significant (Figure 5A).
FIGURE 5.
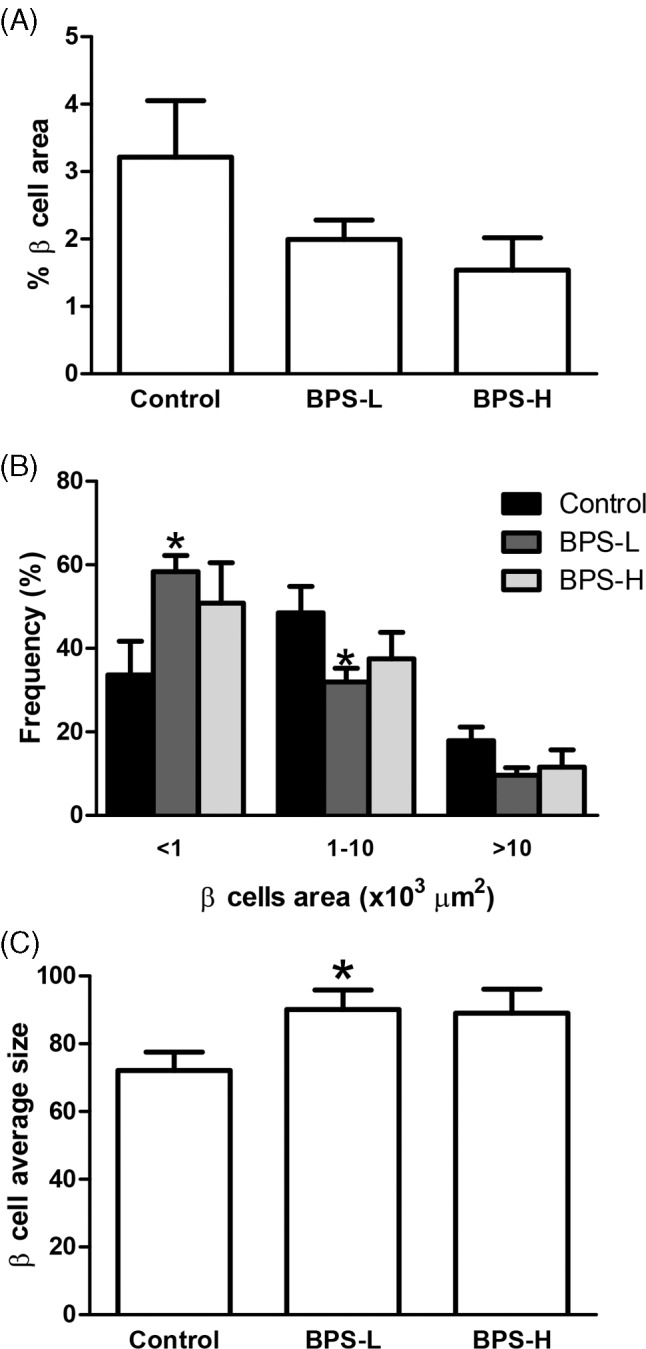
β‐cell morphological analysis in offspring at PND 36. Percentage of β cell area calculated as the percentage of the insulin‐positive area over the total pancreas area (A), frequency of small, medium, and large islets (B), and average β‐cell size (C) were determined as indicated in the Methods section. Data are presented as mean ± SEM. *p < 0.05, as compared to the control. n = 7 animals per group from seven different litters
When the islets were separated by area into small (<1000 μm2), medium (1000–10 000 μm2), or large islets (>10 000 μm2), in BPS‐L treated offspring, the frequency of small islets was significantly higher. Conversely, the frequency of medium islets was significantly lower than in the control group (Figure 5B). No differences were observed in the BPS‐H group compared to the control (Figure 5B).
At PND 36, the average area of the β‐cells in the BPS‐L group was significantly higher than the control group, while it was not significantly different in the BPS‐H group (Figure 5C).
3.6. Testosterone serum levels
Testosterone serum levels were evaluated at PND 36 and 120. There were no differences in testosterone serum levels in any of the BPS‐treated animals compared to the control in any of the two studied ages (Supplementary Figure 3).
4. DISCUSSION
The Developmental Origins of Health and Disease paradigm maintains that early life environment influences health outcomes later in life. 48 BPS is an endocrine disruptor and one of the most widely used analogs of BPA. Diverse studies indicate that the effects of BPS on glucose metabolism are complex and depend on multiple factors such as sex, diet, exposure dosage, and age. In the present study, we observed that exposure to a low dose of BPS during critical periods of development (gestation and lactation) resulted in endocrine and metabolic changes: decreased AGD/weight1/3, body weight, and an increase in glucose tolerance, β‐cell proliferation, and average β‐cell size, as compared to control animals. These differences were only observed in the BPS‐L treated group but not in the BPS‐H offspring. It is well established that bisphenols act through multiple receptors (nuclear and membrane‐associated receptors), which in some cases have opposing effects, resulting in nonmonotonic dose–response relationships in vivo and in vitro, 12 , 49 , 50 as observed in our results. Furthermore, it is difficult to predict the complex systemic interactions of hormones responsible for a given result because physiological responses and phenotypes are regulated by the interplay of a myriad of hormonal and developmental signals. Therefore, these findings highlight the importance of evaluating diverse doses when evaluating endocrine disruptors' effects on diverse endpoints. Also, most of the effects were detected at PND 36 but not at PND 120. In several studies, bispenols' effects are time‐dependent, like the glucose tolerance or the β‐cell mass evaluated at different PND in BPA perinatally treated rats, 11 , 41 thus emphasizing the importance of evaluating different time points. Whether effects on glucose homeostasis are observed later in life deserves to be investigated.
Birth weight and other infant size measures at birth are considered important markers of the intrauterine environment, with potential long‐term consequences for adult health. 51 , 52 , 53 We detected a decrease in AGD/weight1/3 at weaning in the BPS‐L and BPS‐H offspring. AGD is a sensitive sexually dimorphic biomarker of the fetal hormonal milieu and a measure of reproductive toxicity in animal models. An altered AGD in male or female offspring at birth indicates that the endocrine signaling, which is necessary for normal reproductive development, has been altered. 54 , 55 Such altered programming can have adverse consequences later in life. 55 , 56 , 57 Our results agree with the data presented by Kaimal et al., where a decrease in male AGD was reported in rats treated during gestation with BPS. 58 AGD has also been evaluated in different animal models perinatally exposed to BPA, and the results are contradictory since some studies showed increased AGD in both male and female animals, 59 decreased AGD in males, 60 or no changes. 61 In humans, parental exposure to BPA during pregnancy was associated with shortened AGD in male offspring, 62 , 63 causing further concern about BPA exposure during gestation. Thus, a decrease in AGD/weight1/3 could indicate possible feminization 57 or compromised testicular function. 64 , 65 However, we did not observe any significant changes in serum testosterone levels in BPS treated animals neither at PND 36 nor at adult age. These reports agree with those reported previously, where no changes in testosterone serum levels in BPS treated offspring during gestation and lactation, neither at weaning nor in the adult stage, were observed. 37 , 58 Further studies are needed to determine if perinatal exposure to BPS does alter the male reproductive system/function in adult animals.
Experimental and epidemiological studies in rodents and humans suggest that high or low birth weight is a risk factor of type 2 diabetes later in life. 66 We detected a significantly lower body weight in the BPS‐L group than the control group from PND 21 to PND 120. Meanwhile, the BPS‐H group presented a bodyweight similar to the control group. A majority of animal studies, although notably not all (13/24 for males and 8/15 for females) have reported an association between perinatal exposure of BPA and an increased body weight of animal pups. 67 , 68 , 69 , 70 Some studies have also reported no association (8/24 for males and 3/15 for females), 70 , 71 , 72 and others reported an inverse correlation (2/24 for males and 4/15 for females). 11 , 59 , 70 , 73 , 74 , 75 Although fewer studies report the association between perinatal exposure to BPS and bodyweight of the pups, the results are similar to those of BPA. Some studies report an increase in bodyweight, 76 , 77 other studies report no significant difference in pups birth weights as compared to controls, 37 , 78 and others report a significant decrease. 79 In humans, urinary concentrations of BPS have been associated with significantly lower birth weight. 80 , 81 , 82 The decrease observed in body weight could be due to a decrease in visceral fat mass, as has been reported in adult BPS offspring treated during gestation and lactation, 37 or a decrease in perigonadal fat pad weight, as reported in offspring treated with 0.4 mg/kg BW/d BPA. 49 So, our results agree with the previous studies, and the observed variations may be due to the different doses, administration routes, windows of exposure, etc.
It has been reported that mice with low‐birth weight present glucose intolerance and β‐cell failure during adulthood. 83 Therefore, the bodyweight changes prompted us to explore the intrinsic changes in glucose homeostasis. In the IPGTT, we observed a significant reduction in the AUC in the BPS‐L group in the nonfasted state at PND 36. However, there was no difference in the BPS‐H treated group, either in the fasted or nonfasted state at PND 36. At PND 120, there were no differences in blood glucose levels between all studied groups. Previously, it has been reported that maternal exposure to BPS (10 and 50 μg/kg BW/d), from GD1 to PND21, does not disrupt glucose homeostasis of the male offspring. 37 Also, no changes in glycemia in fasted male Wistar rats, treated for 20 weeks with BPS (50 and 500 μg/kg BW/d), were detected. 34 In contrast, adult or weaned male Wistar rats treated for 90 days or 38 weeks, respectively, with BPS (0.05, 0.5, and 5 mg/kg BW/d) presented an increase in the blood glucose concentration in a GTT, expressed as the AUC. 33 , 35 However, after only 30 days of treatment in these animals, there were no changes in the AUC for glucose tolerance testing compared to control animals. 35 Similar results have been observed in male offspring perinatally treated with BPA, where a decrease glucose tolerance, indicated by an increase in the AUC for the GTT, has been reported. 9 , 10 , 11 , 12 , 13 , 84 However, reports have also indicated no differences in the AUC in GTT between control and BPA perinatally exposed males. 9 , 10 , 11 , 13 , 41 , 85 , 86 , 87 Even more, an improvement in glucose tolerance and lower baseline fasting blood glucose have been reported in BPA‐perinatally exposed male mice. 49 This decrease in blood glucose in an IPGTT compared to control animals has also been reported in mice treated with bisphenol AP (BPAP). 88 Since the differences in the IPGTT were found in the non‐fasted condition, we evaluated insulin serum levels also in the non‐fasted condition. We observed no changes in insulin levels between all groups, both at 36 and 120 PND. Similar results, with no changes in insulin levels, have been reported in perinatal (from GD1 to PND21) BPS (10 and 50 μg/kg BW/d) exposed offspring, neither at weaning nor the adult stage, 37 and mice treated with BPA (50–50 000 μg/kg BW/d) from GD 9 to 18. However, Angle et al. reported elevated insulin serum levels in the 5 μg/kg BW/d compared to the control. 12 However, Alonso‐Magdalena and colleagues exposed pancreatic islets isolated from mice prenatally treated with BPA to stimulatory levels of glucose, which would be a comparable situation to a fed animal. They found that pancreatic islets of animals prenatally exposed to 100 μg/kg/day BPA from GD 9 to 16 secreted similar insulin levels as controls islets. 9 Thus, the outcomes in all these studies are likely to reflect differences in the exposure paradigm and suggest that the observed changes in glucose tolerance in males were at least partly due to the presence of bisphenols.
Bisphenols may affect β‐cell function by the partial loss of mass or purely functional defect of insulin secretion. So, we evaluated the percentage of islet β‐cell area. We observed a decrease in both BPS treated groups, compared to the control, at PND 36, although this difference was not significant. Islet β‐cell mass is mainly coordinately regulated by cell replication, neogenesis, and apoptosis. 89 Consequently, we evaluated the proliferation and apoptosis of β‐cells. We observed that treatment with BPS at low and high doses induced an increase in β‐cell proliferation compared to control animals at PND 36 and 120. However, this increase was only significant in the BPS‐L group at PND 36. Apoptosis of β‐cells was scarce in all the studied groups, and no significant differences were detected among them. According to Liu et al., perinatal (GD6‐PND21) BPA treated (100 μg/kg BW/d) female offspring presented a significant increase in islet β‐cell proliferation, with no changes in β‐cell apoptosis, at 3 months of age, while male offspring presented a significant decrease in proliferation and apoptosis. 11 In these female offspring, no change in glucose tolerance in an IPGTT and in the fasting insulin levels was observed, while in the male, an increase in the AUC and in the fasting insulin levels was documented. 11 In another study, at 30 days of age, prenatal (GD9‐GD16) BPA treated (10 and 100 μg/kg BW/d) male offspring presented a significant increase in β‐cell proliferation and a significant decrease of β‐cell apoptosis, with a glucose tolerance similar to control and an increase in plasma insulin in the nonfasting state. 41 The differences in the results may be due to the age at which each study was done. When the islets were separated by area into large (>10 000 μm2), medium (1000–10 000 μm2), or small islets (<1000 μm2), the frequency of small islets was higher. The frequency of medium islets was lower in BPS‐treated offspring compared to control, although these differences were only significant for the BPS‐L group. It has been reported that small islets secrete more insulin than large islets, 90 , 91 and small islets are more resistant to the impact of stressful conditions on their morphometric characteristics because of their high proliferation. 92 Therefore, even though there is a slight decrease in the % of the β‐cell area in BPS treated offspring, the increased presence of small islets may contribute to the increase in insulin production, so no differences in insulin levels were detected between the BPS treated and control animals. β‐cell average size was also increased in BPS treated animals, although this difference was only significant for the BPS‐L group. In a partially pancreatectomized rat model, it has been shown that the administration of various estrogens was associated with hypertrophy and regeneration of the islets. 93 Hence, the increase in the β cell average size and proliferation in the BPS‐L group may be due to the estrogenic action of BPS. 94
All the significant changes observed in the BPS treated offspring, the decrease in body weight, in anogenital distance/weight1/3, the increase in glucose tolerance, β‐cell proliferation, in the frequency of small islets, and in the average β‐cell size could be due to a decrease in the degree of sexual dimorphism between males and females, with males apparently becoming more female‐like in their responses to glucose challenge, as proposed by Kendig et al. 49 Indeed, in BPA‐perinatally exposed male mice, BPA acts in an estrogen‐like manner to affect metabolic function (glucose tolerance) and adipose deposition in males. 49 Females are protected against insulin resistance more than males because the presence of estrogens—within the physiological range—protects against diabetes in mice. 95 , 96 The antidiabetic actions of estrogen have been confirmed in humans in large, randomized, double‐blind, and placebo‐controlled trials. The Women's Health Initiative study, which included more than 15 000 women, showed a 20% decrease in the incidence of diabetes in the estrogen replacement therapy (ERT) group at 5 years. 97 Also, the Heart and Estrogen/Progestin Replacement Study, which focused on 3000 women with a predisposition to oxidative stress and coronary heart disease, and thus at high risk of developing Type 2 Diabetes Mellitus, resulted in a 35% reduction in the incidence of diabetes in the ERT group at 4 years. 98 Because hyperglycemia cannot develop without β‐cell failure, the observation that ERT prevents diabetes suggests that estrogens improve β‐cell function or survival via direct or indirect mechanisms. Consequently, it seems that BPS administration during the perinatal period acts as an estrogenic compound affecting several metabolic pathways, most of which are only affected at the PND 36.
5. CONCLUSION
In conclusion, administration of low doses (0.05 mg/kg/day) of BPS during the perinatal period induced an estrogenic‐like effect that decreased the weight and the AGD/weight1/3. In addition, it increased the glucose tolerance, β‐cell proliferation, the frequency of small islets, and the average β‐cell size, with males apparently becoming more female‐like in their responses to a glucose challenge.
FUNDING
This work was supported by PAIP 5000‐9141 from Universidad Nacional Autónoma de México/Facultad de Química.
CONFLICT OF INTEREST
The authors declare no conflict of interest.
Supporting information
Supplementary Figure 1 IPGTT shows blood glucose homeostasis in offspring. Serum glucose concentrations (mg/dL) following administration of glucose load (2 g/kg BW) in fasted (A) and nonfasted state (B) at PND 120 of age. The mean total glucose AUC is shown in the inset at each condition. Data are presented as mean ± SEM. n = 7 animals per group from 7 different litters.
Supplementary Figure 2 BPS perinatal treatment did not affect insulin serum levels. Insulin serum levels in the nonfasted state at PND 36 (A) and PND 120 (B). Data are presented as mean ± SEM. n = 7 animals per group from 7 different litters.
Supplementary Figure 3 Testosterone serum levels did not differ from control in BPS‐treated animals. Testosterone serum levels were evaluated in all the studied groups at PND 36 (A) and PND 120 (B). n = 7 animals per group from 7 different litters.
ACKNOWLEDGMENT
We thank MVZ Lucía Macías Rosales and MS Marisol Rivera Huerta for their support in animal handling.
Morimoto S, Solís‐Lemus E, Jiménez‐Vivanco J, Castellanos‐Ruiz D, Díaz‐Díaz E, Mendoza‐Rodríguez CA. Maternal perinatal exposure to bisphenol S induces an estrogenic like effect in glucose homeostasis in male offspring. Environmental Toxicology. 2022;37(9):2189‐2200. doi: 10.1002/tox.23585
Funding information Dirección General de Asuntos del Personal Académico, Universidad Nacional Autónoma de México; Universidad Nacional Autónoma de México/Facultad de Química, Grant/Award Number: PAIP 5000‐9141
REFERENCES
- 1. Kang JH, Kondo F, Katayama Y. Human exposure to bisphenol A. Toxicology. 2006;226(2–3):79‐89. doi: 10.1016/j.tox.2006.06.009 [DOI] [PubMed] [Google Scholar]
- 2. Alonso‐Magdalena P, Morimoto S, Ripoll C, Fuentes E, Nadal A. The estrogenic effect of bisphenol A disrupts pancreatic beta‐cell function in vivo and induces insulin resistance. Environ Health Perspect. 2006;114(1):106‐112. doi: 10.1289/ehp.8451 [DOI] [PMC free article] [PubMed] [Google Scholar]
- 3. Shankar A, Teppala S. Relationship between urinary bisphenol a levels and diabetes mellitus. J Clin Endocrinol Metab. 2011;96(12):3822‐3826. doi: 10.1210/jc.2011-1682 [DOI] [PMC free article] [PubMed] [Google Scholar]
- 4. Batista TM, Alonso‐Magdalena P, Vieira E, et al. Short‐term treatment with bisphenol‐A leads to metabolic abnormalities in adult male mice. PLoS One. 2012;7(3):e33814. doi: 10.1371/journal.pone.0033814 [DOI] [PMC free article] [PubMed] [Google Scholar]
- 5. Sabanayagam C, Teppala S, Shankar A. Relationship between urinary bisphenol A levels and prediabetes among subjects free of diabetes. Acta Diabetol. 2013;50(4):625‐631. doi: 10.1007/s00592-013-0472-z [DOI] [PubMed] [Google Scholar]
- 6. Sun Q, Cornelis MC, Townsend MK, et al. Association of urinary concentrations of bisphenol a and phthalate metabolites with risk of type 2 diabetes: a prospective investigation in the Nurses' Health Study (NHS) and NHSII cohorts. Environ Health Perspect. 2014;122(6):616‐623. doi: 10.1289/ehp.1307201 [DOI] [PMC free article] [PubMed] [Google Scholar]
- 7. Ahmadkhaniha R, Mansouri M, Yunesian M, et al. Association of urinary bisphenol a concentration with type‐2 diabetes mellitus. J Environ Health Sci Eng. 2014;12(1):64. doi: 10.1186/2052-336X-12-64 [DOI] [PMC free article] [PubMed] [Google Scholar]
- 8. Aekplakorn W, Chailurkit LO, Ongphiphadhanakul B. Relationship of serum bisphenol A with diabetes in the Thai population, National Health Examination Survey IV, 2009. J Diabetes. 2015;7(2):240‐249. doi: 10.1111/753-0407.12159 [DOI] [PubMed] [Google Scholar]
- 9. Alonso‐Magdalena P, Vieira E, Soriano S, et al. Bisphenol A exposure during pregnancy disrupts glucose homeostasis in mothers and adult male offspring. Environ Health Perspect. 2010;118:1243‐1250. doi: 10.1289/ehp.1001993 [DOI] [PMC free article] [PubMed] [Google Scholar]
- 10. Wei J, Lin Y, Li Y, et al. Perinatal exposure to bisphenol A at reference dose predisposes offspring to metabolic syndrome in adult rats on a high‐fat diet. Endocrinology. 2011. Aug;152(8):3049‐3061. doi: 10.1210/en.2011-0045 [DOI] [PubMed] [Google Scholar]
- 11. Liu J, Yu P, Qian W, et al. Perinatal bisphenol A exposure and adult glucose homeostasis: identifying critical windows of exposure. PLoS One. 2013;8(5):e64143. doi: 10.1371/journal.pone.0064143 [DOI] [PMC free article] [PubMed] [Google Scholar]
- 12. Angle BM, Do RP, Ponzi D, et al. Metabolic disruption in male mice due to fetal exposure to low but not high doses of bisphenol A (BPA): evidence for effects on body weight, food intake, adipocytes, leptin, adiponectin, insulin and glucose regulation. Reprod Toxicol. 2013;42:256‐268. doi: 10.1016/j.reprotox.2013.07.017 [DOI] [PMC free article] [PubMed] [Google Scholar]
- 13. Garcia‐Arevalo M, Alonso‐Magdalena P, Rebelo Dos Santos J, Quesada I, Carneiro EM, Nadal A. Exposure to bisphenol‐A during pregnancy partially mimics the effects of a high‐fat diet altering glucose homeostasis and gene expression in adult male mice. PLoS One. 2014;9:e100214. doi: 10.1371/journal.pone.0100214 [DOI] [PMC free article] [PubMed] [Google Scholar]
- 14. EC (European Commission) . Commission Directive 2011/8/EU of 28 January 2011 amending Directive 2002/72/EC as regards the restriction of use of Bisphenol A in plastic infant feeding bottles. Official Journal of the European Union. 2011;54:11‐14. https://eur-lex.europa.eu/legal-content/EN/TXT/PDF/?uri=OJ:L:2011:026:FULL&from=NL [Google Scholar]
- 15. EC (European Commission) . 2011b. Commission Regulation (EU) No 10/2011 of 14 January 2011 on Plastic Materials and Articles Intended to Come into Contact with Food. Official Journal of the European Union. 2011; 54: 1. https://eur-lex.europa.eu/legal-content/EN/TXT/?uri=uriserv%3AOJ.L_.2011.012.01.0001.01.ENG&toc=OJ%3AL%3A2011%3A012%3ATOC#d1e40-1-1
- 16. French National Assembly and Senate . 2010. LOI n° 2010‐729 du 30 juin 2010 tendant à suspendre la commercialisation de tout conditionnement comportant du bisphénol A et destiné à recevoir des produits alimentaires.
- 17. U.S. FDA (U.S. Food and Drug Administration) . 2013. FDA Regulations No Longer Authorize the Use of BPA in Infant Formula Packaging Based on Abandonment; Decision Not Based on Safety. Accessed June 14, 2018. http://www.fda.gov/Food/NewsEvents/ConstituentUpdates/ucm360147.htm
- 18. U.S. FDA (U.S. Food and Drug Administration) . 2014. Bisphenol A (BPA): use in food contact application. https://www.fda.gov/food/food-additives-petitions/bisphenol-bpa-use-food-contact-application
- 19. Wu LH, Zhang XM, Wang F, et al. Occurrence of bisphenol S in the environment and implications for human exposure: a short review. Sci Total Environ. 2018;615:87‐98. doi: 10.1016/j.scitotenv.2017.09.194 [DOI] [PubMed] [Google Scholar]
- 20. Liao C, Liu F, Kannan K. Bisphenol s, a new bisphenol analogue, in paper products and currency bills and its association with bisphenol a residues. Environ Sci Technol. 2012;46(12):6515‐6522. doi: 10.1021/es300876n [DOI] [PubMed] [Google Scholar]
- 21. Héliès‐Toussaint C, Peyre L, Costanzo C, Chagnon MC, Rahmani R. Is bisphenol S a safe substitute for bisphenol a in terms of metabolic function? An in vitro study. Toxicol Appl Pharmacol. 2014;280(2):224‐235. doi: 10.1016/j.taap.2014.07.025 [DOI] [PubMed] [Google Scholar]
- 22. Boucher JG, Ahmed S, Atlas E. Bisphenol S induces Adipogenesis in primary human Preadipocytes from female donors. Endocrinology. 2016;157(4):1397‐1407. doi: 10.1210/en.2015-1872 [DOI] [PubMed] [Google Scholar]
- 23. Liao C, Liu F, Alomirah H, et al. Bisphenol S in urine from the United States and seven Asian countries: occurrence and human exposures. Environ Sci Technol. 2012;46(12):6860‐6866. doi: 10.1021/es301334j [DOI] [PubMed] [Google Scholar]
- 24. Qiu W, Zhan H, Hu J, et al. The occurrence, potential toxicity, and toxicity mechanism of bisphenol S, a substitute of bisphenol A: a critical review of recent progress. Ecotoxicol Environ Saf. 2019;173:192‐202. doi: 10.1016/j.ecoenv.2019.01.114 [DOI] [PubMed] [Google Scholar]
- 25. Jin H, Zhu J, Chen Z, Hong Y, Cai Z. Occurrence and partitioning of Bisphenol analogues in Adults' blood from China. Environ Sci Technol. 2018;52(2):812‐820. doi: 10.1021/acs.est.7b03958 [DOI] [PubMed] [Google Scholar]
- 26. Liu J, Li J, Wu Y, et al. Bisphenol A metabolites and Bisphenol S in paired maternal and cord serum. Environ Sci Technol. 2017;51(4):2456‐2463. doi: 10.1021/acs.est.6b05718 [DOI] [PubMed] [Google Scholar]
- 27. Deceuninck Y, Bichon E, Marchand P, et al. Determination of bisphenol a and related substitutes/analogues in human breast milk using gas chromatography‐tandem mass spectrometry. Anal Bioanal Chem. 2015;407(9):2485‐2497. doi: 10.1007/s00216-015-8469-9 [DOI] [PubMed] [Google Scholar]
- 28. Kang JS, Choi JS, Kim WK, Lee YJ, Park JW. Estrogenic potency of bisphenol S, polyethersulfone and their metabolites generated by the rat liver S9 fractions on a MVLN cell using a luciferase reporter gene assay. Reprod Biol Endocrinol. 2014;12:102. doi: 10.1186/1477-7827-12-102 [DOI] [PMC free article] [PubMed] [Google Scholar]
- 29. Duan Y, Yao Y, Wang B, et al. Association of urinary concentrations of bisphenols with type 2 diabetes mellitus: a case‐control study. Environ Pollut. 2018;243(Pt B):1719‐1726. doi: 10.1016/j.envpol.2018.09.093 [DOI] [PubMed] [Google Scholar]
- 30. Rancière F, Botton J, Slama R, et al. Study group. Exposure to Bisphenol A and Bisphenol S and incident type 2 diabetes: a case‐cohort study in the French cohort D.E.S.I.R. Environ Health Perspect. 2019;127(10):107013. doi: 10.1289/EHP5159 [DOI] [PMC free article] [PubMed] [Google Scholar]
- 31. Zhang W, Xia W, Liu W, et al. Exposure to Bisphenol a substitutes and gestational diabetes mellitus: a prospective cohort study in China. Front Endocrinol (Lausanne). 2019;10:262. doi: 10.3389/fendo.2019.00262 [DOI] [PMC free article] [PubMed] [Google Scholar]
- 32. Xu J, Huang G, Guo TL. Bisphenol S modulates type 1 diabetes development in non‐obese diabetic (NOD) mice with diet‐ and sex‐related effects. Toxics. 2019;7(2):35. doi: 10.3390/toxics7020035 [DOI] [PMC free article] [PubMed] [Google Scholar]
- 33. Azevedo LF, Porto Dechandt CR, de Souza C, et al. Long‐term exposure to bisphenol A or S promotes glucose intolerance and changes hepatic mitochondrial metabolism in male Wistar rats. Food Chem Toxicol. 2019;132:110694. doi: 10.1016/j.fct.2019.110694 [DOI] [PubMed] [Google Scholar]
- 34. Azevedo LF, Hornos Carneiro MF, Dechandt CRP, Cassoli JS, Alberici LC, Barbosa F Jr. Global liver proteomic analysis of Wistar rats chronically exposed to low‐levels of bisphenol a and S. Environ Res. 2020;182:109080. doi: 10.1016/j.envres.2019.109080 [DOI] [PubMed] [Google Scholar]
- 35. Mandrah K, Jain V, Ansari JA, Roy SK. Metabolomic perturbation precedes glycolytic dysfunction and procreates hyperglycemia in a rat model due to bisphenol S exposure. Environ Toxicol Pharmacol. 2020;77:103372. doi: 10.1016/j.etap.2020.103372 [DOI] [PubMed] [Google Scholar]
- 36. Song S, Duan Y, Zhang T, et al. Serum concentrations of bisphenol A and its alternatives in elderly population living around e‐waste recycling facilities in China: associations with fasting blood glucose. Ecotoxicol Environ Saf. 2019;169:822‐828. doi: 10.1016/j.ecoenv.2018.11.101 [DOI] [PubMed] [Google Scholar]
- 37. da Silva BS, Pietrobon CB, Bertasso IM, et al. Short and long‐term effects of bisphenol S (BPS) exposure during pregnancy and lactation on plasma lipids, hormones, and behavior in rats. Environ Pollut. 2019;250:312‐322. doi: 10.1016/j.envpol.2019.03.100 [DOI] [PubMed] [Google Scholar]
- 38. Lee I, Kim S, Park S, et al. Association of urinary phthalate metabolites and phenolics with adipokines and insulin resistance related markers among women of reproductive age. Sci Total Environ. 2019;688:1319‐1326. doi: 10.1016/j.scitotenv.2019.06.125 [DOI] [PubMed] [Google Scholar]
- 39. Song L, Xia W, Zhou Z, et al. Low‐level phenolic estrogen pollutants impair islet morphology and β‐cell function in isolated rat islets. J Endocrinol. 2012;215(2):303‐311. doi: 10.1530/JOE-12-0219 [DOI] [PubMed] [Google Scholar]
- 40. Lin Y, Sun X, Qiu L, et al. Exposure to bisphenol a induces dysfunction of insulin secretion and apoptosis through the damage of mitochondria in rat insulinoma (INS‐1) cells. Cell Death Dis. 2013;4(1):e460. doi: 10.1038/cddis.2012.206 [DOI] [PMC free article] [PubMed] [Google Scholar]
- 41. García‐Arévalo M, Alonso‐Magdalena P, Servitja JM, et al. Maternal exposure to Bisphenol‐a during pregnancy increases pancreatic β‐cell growth during early life in male mice offspring. Endocrinology. 2016;157(11):4158‐4171. doi: 10.1210/en.2016-1390 [DOI] [PubMed] [Google Scholar]
- 42. Vandenberg LN, Colborn T, Hayes TB, et al. Hormones and endocrine‐disrupting chemicals: low‐dose effects and nonmonotonic dose responses. Endocr Rev. 2012;33(3):378‐455. doi: 10.1210/er.2011-1050 [DOI] [PMC free article] [PubMed] [Google Scholar]
- 43. EFSA (European Food Safety Authority) , FitzGerald R, Van Loveren H, Civitella C, Castoldi AF and Bernasconi G. 2020. Assessment of new information on Bisphenol S (BPS) submitted in response to the Decision under REACH Regulation (EC) No 1907/2006. EFSA supporting publication 2020:EN‐1844. 39 pp. doi: 10.2903/sp.efsa.2020.EN-1844 [DOI]
- 44. Jiménez IU, Díaz‐Díaz E, Castro JS, et al. Circulating concentrations of advanced glycation end products, its association with the development of diabetes mellitus. Arch Med Res. 2017;48(4):360‐369. doi: 10.1016/j.arcmed.2017.07.001 [DOI] [PubMed] [Google Scholar]
- 45. Palomar‐Morales M, Morimoto S, Mendoza‐Rodríguez CA, Cerbón MA. The protective effect of testosterone on streptozotocin‐induced apoptosis in beta cells is sex specific. Pancreas. 2010;39(2):193‐200. doi: 10.1097/MPA.0b013e3181c156d9 [DOI] [PubMed] [Google Scholar]
- 46. Martínez‐Peña AA, Rivera‐Baños J, Méndez‐Carrillo LL, et al. Perinatal administration of bisphenol A alters the expression of tight junction proteins in the uterus and reduces the implantation rate. Reprod Toxicol. 2017;69:106‐120. doi: 10.1016/j.reprotox.2017.02.009 [DOI] [PubMed] [Google Scholar]
- 47. Schwartz CL, Christiansen S, Vinggaard AM, Axelstad M, Hass U, Svingen T. Anogenital distance as a toxicological or clinical marker for fetal androgen action and risk for reproductive disorders. Arch Toxicol. 2019;93(2):253‐272. doi: 10.1007/s00204-018-2350-5 [DOI] [PubMed] [Google Scholar]
- 48. Wadhwa PD, Buss C, Entringer S, Swanson JM. Developmental origins of health and disease: brief history of the approach and current focus on epigenetic mechanisms. Semin Reprod Med. 2009;27(5):358‐368. doi: 10.1055/s-0029-1237424 [DOI] [PMC free article] [PubMed] [Google Scholar]
- 49. Kendig EL, Buesing DR, Christie SM, et al. Estrogen‐like disruptive effects of dietary exposure to bisphenol a or 17alpha‐ethinyl estradiol in CD1 mice. Int J Toxicol. 2012;31(6):537‐550. doi: 10.1177/1091581812463254 [DOI] [PMC free article] [PubMed] [Google Scholar]
- 50. Belcher SM, Chen Y, Yan S, Wang HS. Rapid estrogen receptor‐mediated mechanisms determine the sexually dimorphic sensitivity of ventricular myocytes to 17β‐estradiol and the environmental endocrine disruptor bisphenol A. Endocrinology. 2012;153(2):712‐720. doi: 10.1210/en.2011-1772 [DOI] [PMC free article] [PubMed] [Google Scholar]
- 51. Barker DJ. The origins of the developmental origins theory. J Intern Med. 2007;261(5):412‐417. doi: 10.1111/j.1365-2796.2007.01809.x [DOI] [PubMed] [Google Scholar]
- 52. Basso O. Birth weight is forever. Epidemiology. 2008;19(2):204‐205. doi: 10.1097/EDE.0b013e31816379d9 [DOI] [PubMed] [Google Scholar]
- 53. Visentin S, Grumolato F, Nardelli GB, Di Camillo B, Grisan E, Cosmi E. Early origins of adult disease: low birth weight and vascular remodeling. Atherosclerosis. 2014;237(2):391‐399. doi: 10.1016/j.atherosclerosis.2014.09.027 [DOI] [PubMed] [Google Scholar]
- 54. Bowman CJ, Barlow NJ, Turner KJ, Wallace DG, Foster PM. Effects of in utero exposure to finasteride on androgen‐dependent reproductive development in the male rat. Toxicol Sci. 2003;74(2):393‐406. doi: 10.1093/toxsci/kfg128 [DOI] [PubMed] [Google Scholar]
- 55. Hotchkiss AK, Parks‐Saldutti LG, Ostby JS, et al. A mixture of the "antiandrogens" linuron and butyl benzyl phthalate alters sexual differentiation of the male rat in a cumulative fashion. Biol Reprod. 2004;71(6):1852‐1861. doi: 10.1095/biolreprod.104.031674 [DOI] [PubMed] [Google Scholar]
- 56. Christiansen S, Scholze M, Axelstad M, Boberg J, Kortenkamp A, Hass U. Combined exposure to anti‐androgens causes markedly increased frequencies of hypospadias in the rat. Int J Androl. 2008;31(2):241‐248. doi: 10.1111/j.1365-2605.2008.00866.x [DOI] [PubMed] [Google Scholar]
- 57. Welsh M, Saunders PT, Fisken M, et al. Identification in rats of a programming window for reproductive tract masculinization, disruption of which leads to hypospadias and cryptorchidism. J Clin Invest. 2008;118(4):1479‐1490. doi: 10.1172/JCI34241 [DOI] [PMC free article] [PubMed] [Google Scholar]
- 58. Kaimal A, Al Mansi MH, Dagher JB, et al. Prenatal exposure to bisphenols affects pregnancy outcomes and offspring development in rats. Chemosphere. 2021;276:130118. doi: 10.1016/j.chemosphere.2021.130118 [DOI] [PubMed] [Google Scholar]
- 59. Honma S, Suzuki A, Buchanan DL, Katsu Y, Watanabe H, Iguchi T. Low dose effect of in utero exposure to bisphenol a and diethylstilbestrol on female mouse reproduction. Reprod Toxicol. 2002;16(2):117‐122. doi: 10.1016/s0890-6238(02)00006-0 [DOI] [PubMed] [Google Scholar]
- 60. Talsness C, Fialkowski O, Gericke C, Merker HJ, Chahoud I. The effects of low and high doses of bisphenol a on the reproductive system of female and male rat offspring. Congenit Anom (Kyoto). 2000;40:S94‐S107. [Google Scholar]
- 61. Tinwell H, Haseman J, Lefevre PA, Wallis N, Ashby J. Normal sexual development of two strains of rat exposed in utero to low doses of bisphenol a. Toxicol Sci. 2002;68(2):339‐348. doi: 10.1093/toxsci/68.2.339 [DOI] [PubMed] [Google Scholar]
- 62. Miao M, Yuan W, He Y, et al. In utero exposure to bisphenol‐a and anogenital distance of male offspring. Birth Defects Res A Clin Mol Teratol. 2011;91(10):867‐872. doi: 10.1002/bdra.22845 [DOI] [PubMed] [Google Scholar]
- 63. Sun X, Li D, Liang H, et al. Maternal exposure to bisphenol a and anogenital distance throughout infancy: a longitudinal study from Shanghai. China Environ Int. 2018;121(Pt 1):269‐275. doi: 10.1016/j.envint.2018.08.055 [DOI] [PubMed] [Google Scholar]
- 64. Thankamony A, Pasterski V, Ong KK, Acerini CL, Hughes IA. Anogenital distance as a marker of androgen exposure in humans. Andrology. 2016;4(4):616‐625. doi: 10.1111/andr.12156 [DOI] [PMC free article] [PubMed] [Google Scholar]
- 65. Freire C, Ocón‐Hernández O, Dávila‐Arias C, et al. Anogenital distance and reproductive outcomes in 9‐ to 11‐year‐old boys: the INMA‐Granada cohort study. Andrology. 2018;6(6):874‐881. doi: 10.1111/andr.12544 [DOI] [PubMed] [Google Scholar]
- 66. Gilbert SF, Epel D. Ecological Developmental Biology: Integrating Epigenetics, Medicine, and Evolution. Sinauer Associates Inc.; 2009. doi: 10.1093/icb/icp106 [DOI] [Google Scholar]
- 67. Howdeshell KL, Hotchkiss AK, Thayer KA, Vandenbergh JG, vom Saal FS. Exposure to bisphenol a advances puberty. Nature. 1999;401(6755):763‐764. doi: 10.1038/44517 [DOI] [PubMed] [Google Scholar]
- 68. Rubin BS, Murray MK, Damassa DA, King JC, Soto AM. Perinatal exposure to low doses of bisphenol a affects body weight, patterns of estrous cyclicity, and plasma LH levels. Environ Health Perspect. 2001;109(7):675‐680. doi: 10.1289/ehp.01109675 [DOI] [PMC free article] [PubMed] [Google Scholar]
- 69. Miyawaki J, Sakayama K, Kato H, Yamamoto H, Masuno H. Perinatal and postnatal exposure to bisphenol a increases adipose tissue mass and serum cholesterol level in mice. J Atheroscler Thromb. 2007;14(5):245‐252. doi: 10.5551/jat.e486 [DOI] [PubMed] [Google Scholar]
- 70. Legeay S, Faure S. Is bisphenol a an environmental obesogen? Fundam Clin Pharmacol. 2017;31(6):594‐609. doi: 10.1111/fcp.12300 [DOI] [PubMed] [Google Scholar]
- 71. Cagen SZ, Waechter JM Jr, Dimond SS, et al. Normal reproductive organ development in Wistar rats exposed to bisphenol A in the drinking water. Regul Toxicol Pharmacol. 1999;30(2 Pt 1):130‐139. doi: 10.1006/rtph.1999.1340 [DOI] [PubMed] [Google Scholar]
- 72. Nagao T, Saito Y, Usumi K, Yoshimura S, Ono H. Low‐dose bisphenol a does not affect reproductive organs in estrogen‐sensitive C57BL/6N mice exposed at the sexually mature, juvenile, or embryonic stage. Reprod Toxicol. 2002;16(2):123‐130. doi: 10.1016/s0890-6238(02)00003-5 [DOI] [PubMed] [Google Scholar]
- 73. Kim JC, Shin HC, Cha SW, Koh WS, Chung MK, Han SS. Evaluation of developmental toxicity in rats exposed to the environmental estrogen bisphenol A during pregnancy. Life Sci. 2001;69(22):2611‐2625. doi: 10.1016/s0024-3205(01)01341-8 [DOI] [PubMed] [Google Scholar]
- 74. Takagi H, Shibutani M, Masutomi N, et al. Lack of maternal dietary exposure effects of bisphenol A and nonylphenol during the critical period for brain sexual differentiation on the reproductive/endocrine systems in later life. Arch Toxicol. 2004;78(2):97‐105. doi: 10.1007/s00204-003-0517-0 [DOI] [PubMed] [Google Scholar]
- 75. Nunez AA, Kannan K, Giesy JP, Fang J, Clemens LG. Effects of bisphenol A on energy balance and accumulation in brown adipose tissue in rats. Chemosphere. 2001;42(8):917‐922. doi: 10.1016/s0045-6535(00)00196-x [DOI] [PubMed] [Google Scholar]
- 76. Meng Z, Wang D, Yan S, et al. Effects of perinatal exposure to BPA and its alternatives (BPS, BPF and BPAF) on hepatic lipid and glucose homeostasis in female mice adolescent offspring. Chemosphere. 2018;212:297‐306. doi: 10.1016/j.chemosphere.2018.08.076 [DOI] [PubMed] [Google Scholar]
- 77. Meng Z, Wang D, Liu W, et al. Perinatal exposure to Bisphenol S (BPS) promotes obesity development by interfering with lipid and glucose metabolism in male mouse offspring. Environ Res. 2019;173:189‐198. doi: 10.1016/j.envres.2019.03.038 [DOI] [PubMed] [Google Scholar]
- 78. Ullah A, Pirzada M, Jahan S, et al. Prenatal BPA and its analogs BPB, BPF, and BPS exposure and reproductive axis function in the male offspring of Sprague Dawley rats. Hum Exp Toxicol. 2019;38(12):1344‐1365. doi: 10.1177/0960327119862335 [DOI] [PubMed] [Google Scholar]
- 79. Kim B, Colon E, Chawla S, Vandenberg LN, Suvorov A. Endocrine disruptors alter social behaviors and indirectly influence social hierarchies via changes in body weight. Environ Health. 2015;14:64. doi: 10.1186/s12940-015-0051-6 [DOI] [PMC free article] [PubMed] [Google Scholar]
- 80. Ferguson KK, Meeker JD, Cantonwine DE, et al. Environmental phenol associations with ultrasound and delivery measures of fetal growth. Environ Int. 2018;112:243‐250. doi: 10.1016/j.envint.2017.12.011 [DOI] [PMC free article] [PubMed] [Google Scholar]
- 81. Goodrich JM, Ingle ME, Domino SE, et al. First trimester maternal exposures to endocrine disrupting chemicals and metals and fetal size in the Michigan Mother‐Infant Pairs study. J Dev Orig Health Dis. 2019;10(4):447‐458. doi: 10.1017/S204017441800106X [DOI] [PMC free article] [PubMed] [Google Scholar]
- 82. Hu J, Zhao H, Braun JM, et al. Associations of trimester‐specific exposure to Bisphenols with size at birth: a Chinese prenatal cohort study. Environ Health Perspect. 2019;127(10):107001. doi: 10.1289/EHP4664 [DOI] [PMC free article] [PubMed] [Google Scholar]
- 83. Jimenez‐Chillaron JC, Hernandez‐Valencia M, Reamer C, et al. Beta‐cell secretory dysfunction in the pathogenesis of low birth weight‐associated diabetes: a murine model. Diabetes. 2005;54(3):702‐711. doi: 10.2337/diabetes.54.3.702 [DOI] [PubMed] [Google Scholar]
- 84. Mackay H, Patterson ZR, Khazall R, Patel S, Tsirlin D, Abizaid A. Organizational effects of perinatal exposure to bisphenol‐A and diethylstilbestrol on arcuate nucleus circuitry controlling food intake and energy expenditure in male and female CD‐1 mice. Endocrinology. 2013;154(4):1465‐1475. doi: 10.1210/en.2012-2044 [DOI] [PubMed] [Google Scholar]
- 85. Ryan KK, Haller AM, Sorrell JE, Woods SC, Jandacek RJ, Seeley RJ. Perinatal exposure to bisphenol‐a and the development of metabolic syndrome in CD‐1 mice. Endocrinology. 2010;151(6):2603‐2612. doi: 10.1210/en.2009-1218 [DOI] [PMC free article] [PubMed] [Google Scholar]
- 86. van Esterik JC, Dollé ME, Lamoree MH, et al. Programming of metabolic effects in C57BL/6JxFVB mice by exposure to bisphenol A during gestation and lactation. Toxicology. 2014;321:40‐52. doi: 10.1016/j.tox.2014.04.001 [DOI] [PubMed] [Google Scholar]
- 87. Patel BB, Di Iorio M, Chalifour LE. Metabolic response to chronic bisphenol a exposure in C57bl/6n mice. Toxicol Rep. 2014;1:522‐532. doi: 10.1016/j.toxrep.2014.07.012 [DOI] [PMC free article] [PubMed] [Google Scholar]
- 88. Xiao X, Li J, Yu T, et al. Bisphenol AP is anti‐estrogenic and may cause adverse effects at low doses relevant to human exposure. Environ Pollut. 2018;242(Part B):1625‐1632. doi: 10.1016/j.envpol.2018.07.115 [DOI] [PubMed] [Google Scholar]
- 89. Bernal‐Mizrachi E, Wen W, Stahlhut S, Welling CM, Permutt MA. Islet beta cell expression of constitutively active Akt1/PKB alpha induces striking hypertrophy, hyperplasia, and hyperinsulinemia. J Clin Invest. 2001;108(11):1631‐1638. doi: 10.1172/JCI13785 [DOI] [PMC free article] [PubMed] [Google Scholar]
- 90. Huang HH, Novikova L, Williams SJ, Smirnova IV, Stehno‐Bittel L. Low insulin content of large islet population is present in situ and in isolated islets. Islets. 2011;3(1):6‐13. doi: 10.4161/isl.3.1.14132 [DOI] [PMC free article] [PubMed] [Google Scholar]
- 91. Farhat B, Almelkar A, Ramachandran K, et al. Small human islets comprised of more β‐cells with higher insulin content than large islets. Islets. 2013;5(2):87‐94. doi: 10.4161/isl.24780 [DOI] [PMC free article] [PubMed] [Google Scholar]
- 92. Rodríguez‐Castelán J, Nicolás L, Morimoto S, Cuevas E. The Langerhans islet cells of female rabbits are differentially affected by hypothyroidism depending on the islet size. Endocrine. 2015;48(3):811‐817. doi: 10.1007/s12020-014-0418-4 [DOI] [PubMed] [Google Scholar]
- 93. Houssay BA, Foglia VG, Rodriguez RR. Production or prevention of some types of experimental diabetes by oestrogens or corticosteroids. Acta Endocrinol. 1954;17(1–4):146‐164. [PubMed] [Google Scholar]
- 94. Park C, Song H, Choi J, et al. The mixture effects of bisphenol derivatives on estrogen receptor and androgen receptor. Environ Pollut. 2020;260:114036. doi: 10.1016/j.envpol.2020.114036 [DOI] [PubMed] [Google Scholar]
- 95. Liu S, Mauvais‐Jarvis F. Minireview: estrogenic protection of beta‐cell failure in metabolic diseases. Endocrinology. 2010;151(3):859‐864. doi: 10.1210/en.2009-1107 [DOI] [PMC free article] [PubMed] [Google Scholar]
- 96. Louet JF, LeMay C, Mauvais‐Jarvis F. Antidiabetic actions of estrogen: insight from human and genetic mouse models. Curr Atheroscler Rep. 2004;6(3):180‐185. doi: 10.1007/s11883-004-0030-9 [DOI] [PubMed] [Google Scholar]
- 97. Margolis KL, Bonds DE, Rodabough RJ, et al. Women's Health Initiative investigators. Effect of oestrogen plus progestin on the incidence of diabetes in postmenopausal women: results from the Women's Health Initiative hormone trial. Diabetologia. 2004;47(7):1175‐1187. doi: 10.1007/s00125-004-1448-x [DOI] [PubMed] [Google Scholar]
- 98. Kanaya AM, Herrington D, Vittinghoff E, et al. Heart and estrogen/progestin replacement study. Glycemic effects of postmenopausal hormone therapy: the heart and estrogen/progestin replacement study. A randomized, double‐blind, placebo‐controlled trial. Ann Intern Med. 2003;138(1):1‐9. doi: 10.7326/0003-4819-138-1-200301070-00005 [DOI] [PubMed] [Google Scholar]
Associated Data
This section collects any data citations, data availability statements, or supplementary materials included in this article.
Supplementary Materials
Supplementary Figure 1 IPGTT shows blood glucose homeostasis in offspring. Serum glucose concentrations (mg/dL) following administration of glucose load (2 g/kg BW) in fasted (A) and nonfasted state (B) at PND 120 of age. The mean total glucose AUC is shown in the inset at each condition. Data are presented as mean ± SEM. n = 7 animals per group from 7 different litters.
Supplementary Figure 2 BPS perinatal treatment did not affect insulin serum levels. Insulin serum levels in the nonfasted state at PND 36 (A) and PND 120 (B). Data are presented as mean ± SEM. n = 7 animals per group from 7 different litters.
Supplementary Figure 3 Testosterone serum levels did not differ from control in BPS‐treated animals. Testosterone serum levels were evaluated in all the studied groups at PND 36 (A) and PND 120 (B). n = 7 animals per group from 7 different litters.