

Abstract
Gill disease is an important cause of economic losses, fish mortality and reduced animal welfare in salmonid farming. We performed a prospective cohort study, following groups of Atlantic salmon in Western Norway with repeated sampling and data collection from the hatchery phase and throughout the 1st year at sea. The objective was to determine if variation in pathogen prevalence and load, and zoo‐ and phytoplankton levels had an impact on gill health. Further to describe the temporal development of pathogen prevalence and load, and gill pathology, and how these relate to each other. Neoparamoeba perurans appeared to be the most important cause of gill pathology. No consistent covariation and no or weak associations between the extent of gill pathology and prevalence and load of SGPV, Ca. B. cysticola and D. lepeophtherii were observed. At sea, D. lepeophtherii and Ca. B. cysticola persistently infected all fish groups. Fish groups negative for SGPV at sea transfer were infected at sea and fish groups tested negative before again testing positive. This is suggestive of horizontal transmission of infection at sea and may indicate that previous SGPV infection does not protect against reinfection. Coinfections with three or more putative gill pathogens were found in all fish groups and appear to be the norm in sea‐farmed Atlantic salmon in Western Norway.
Keywords: AGD, Atlantic salmon, Ca. B. cysticola, D. lepeophtherii, gill disease, SGPV
1. INTRODUCTION
Gill disease is an important cause of economic losses, fish mortality and reduced animal welfare in the marine and freshwater phase of salmonid farming in Norway and across the world (Shinn et al., 2015; Sommerset, Bang Jensen, Bornø, Haukaas, & Brun, 2021). Reduced gill health may also impact outcomes of, and decisions about, management operations, such as non‐medicinal delousing and transport, because diseased fish might have reduced tolerance for handling and stress. Gill disease and gill injuries can be caused by infectious agents, environmental factors, management operations or a combination of these (Boerlage et al., 2020; Mitchell & Rodger, 2011; Rodger, Henry, & Mitchell, 2011). Gill disease has been classified as either simple or complex/multifactorial based on a presumption of single or multiple causes and/or infectious agents involved in the disease process (Gjessing, Thoen, Tengs, Skotheim, & Dale, 2017; Herrero, Thompson, Ashby, Rodger, & Dagleish, 2018; Noguera et al., 2019). However, the exact cause(s) and pathogenesis of a considerable proportion of gill disease cases are unknown (Boerlage et al., 2020).
Microorganisms Ca. Branchiomonas cysticola, salmon gill poxvirus (SGPV), Neoparamoeba perurans (syn. Paramoeba perurans) and Desmozoon lepeophtherii (syn. Paranucleospora theridion) are commonly detected in gills of Norwegian sea‐farmed Atlantic salmon (Salmo salar L), whereas the first two are also found during the freshwater phase of production (Downes et al., 2018; Gjessing et al., 2017; Gunnarsson et al., 2017; Nylund et al., 2008). N. perurans is the causative agent of amoebic gill disease (AGD) which has been causing endemic gill disease of variable severity in Norway since 2012 (Crosbie, Bridle, Cadoret, & Nowak, 2012; Mo, Hytterod, Olsen, & Hansen, 2015; Sommerset et al., 2021; Young, Crosbie, Adams, Nowak, & Morrison, 2007). SGPV infection can lead to salmon gill poxvirus disease (SGPVD) and high, acute mortality in hatcheries, though predisposing factors such as stress and immunosuppression may be necessary for disease development (Amundsen et al., 2021; Gjessing et al., 2015; Thoen et al., 2020). Whether SPGV is an important cause of clinical gill disease in the sea phase of production remains unclear, but SGPV infection and associated pathology have been reported in both fresh‐ and sea water (Gjessing et al., 2017; Gjessing et al., 2015; Nylund et al., 2008).
The understanding of the roles of Ca. Branchiomonas cysticola and D. lepeophtherii in the development of gill disease is limited by the lack of established challenge models and the fact that both agents are nearly ubiquitous in sea‐farmed salmon in Northern Europe (Downes et al., 2018; Gunnarsson et al., 2017; Mitchell et al., 2013; Steinum et al., 2010). Whilst these agents are detected in salmon without gill disease, higher pathogen loads have been reported in diseased gills and the microorganisms have been detected in association with gill lesions using in situ hybridization (Gjessing et al., 2021; Mitchell et al., 2013; Weli et al., 2017).
Environmental factors such as harmful algal blooms (HABs) and jellyfish blooms can lead to significant fish mortality and gill injuries in sea‐farmed salmon (Clinton, Ferrier, Martin, & Brierley, 2021; Rodger et al., 2010). However, HABs and jellyfish blooms causing clinical disease and mortality are relatively rarely reported and appear to be sporadic in Norwegian salmonid mariculture (Båmstedt, Fosså, Martinussen, & Fosshagen, 2012; Halsband et al., 2018; Karlson et al., 2021; Rodger et al., 2011; Smage et al., 2017). Monitoring of zoo‐ and phytoplankton levels is not commonly performed at Norwegian sea farms and whether zoo‐ and phytoplankton levels not associated with acute severe mortality can impact gill and fish health has not been explored.
Farmed Atlantic salmon will frequently be exposed to a range of potential insults and environmental factors during a production cycle at sea. Each might have an impact separately, but they can also coincide in time and interact to determine whether fish will develop clinical disease or mortality. Cohort studies are especially useful for evaluating the relationship between exposures and the development of disease, and to observe change over time. Further, the sequence of events can be established and it may be possible to identify and link events (like gill disease) to a particular exposure (Caruana, Roman, Hernández‐Sánchez, & Solli, 2015). However, relatively few longitudinal studies focusing on gill health including multiple sites and fish groups and with a parallel sampling of fish for histopathology and RT‐qPCR have been performed.
In order to gain more knowledge about factors affecting the gill health of Atlantic salmon in Norwegian aquaculture, we performed a prospective cohort study, following 16 fish groups from 8 sea farms with repeated sampling and data collection from the hatchery phase and throughout the 1st year at sea. The objective of this study was to determine if variation in pathogen prevalence and load of N. perurans, Ca. B. cysticola, D. lepeophtherii and SGPV, and water concentration of jellyfish and phytoplankton had an impact on gill health as measured by gill‐related mortality, gross gill scores and extent of tissue damage detected by histopathology. The secondary aim was to describe the temporal development of pathogen prevalence and load of N. perurans, Ca. B. cysticola, D. lepeophtherii and SGPV, observation of pathogens, and different types of gill pathology, and how these relate to each other. In this article, we report the descriptive analysis of these data and the associations between gross gill scores, extent of gill histopathology and pathogen load in individual fish.
2. MATERIAL AND METHODS
2.1. Study population
The main study unit was the ‘fish group’, defined as fish from the same hatchery transferred to sea at the same time and to the same cage. Parallel gross scores, histopathology and RT‐qPCR results from individual fish additionally allowed for examination of the correlation between tissue lesions, pathogen prevalence and load using ‘fish’ as the study unit.
Four freshwater sites and eight seawater sites were included in the study. Fish groups were split into two pens at the same site at sea transfer, resulting in eight separate fish groups (A‐H) during the freshwater phase and 16 fish groups (A1‐H2) during the seawater phase of production (Figure 1). Freshwater sites were selected to include two sites using flow‐through systems (FT), two using recirculating aquaculture systems (RAS), two sites with a history of gill disease (sites 3 and 4) and two sites without known gill issues (sites 1 and 2). From each freshwater site, one fish group sea transferred in autumn 2018 (S0) and one fish group sea transferred in spring 2019 (S1) were included. A winter signal was given at site 1 (12 h light:12 h dark for 5 weeks, S0 fish only) and 3 (12 h light:12 h dark for 6 weeks), and salinity was increased prior to sea transfer to facilitate smoltification at sites 2–4.
FIGURE 1.

Overview of freshwater sites (n = 4), sea sites (n = 8) and fish groups (n = 16). Stocking period (S0 = autumn stock/S1 = spring stock) and water treatment (flow through vs. RAS = circular arrow) is indicated
Sea sites were selected to include four sites with a history of problems with gill disease and gill‐related mortality (sites A, C, D and G), whereas the remaining four other sites only had mild or no recorded historic gill‐related mortality. Sea sites were in Western Norway and fish groups at each site were sea transferred at approximately the same time (A‐D: August 2018, E‐F: June 2019, G‐H: April 2019). Sites were in fjords (A, B, D, G and H) with relatively low exposure or at sea (C, E and F) with moderate to high exposure to currents and waves.
2.2. Environmental data
Sea temperatures were recorded daily for each sea site, whereas salinity was only repeatedly recorded for sea sites B and C varying from >1 month to 1 week between recorded measurements. Measurements of salinity at the remaining sites were not available or very limited.
2.3. Mortality data
Mortality data from all sites were retrieved through the management database Mercatus Farmer (ScaleAQ, Norway). The total number of fish dead per day (total mortality), the number of dead fish in each mortality category (cause‐specific mortality) per day and the number of stocked fish per day were provided for each site and pen. Cause‐specific mortality was generated by site staff daily assigning a likely cause of death based on gross examination of dead fish and knowledge of infectious disease and management events occurring at the site. Each fish was only assigned one mortality cause and if the classification of mortality to one category was not possible, mortalities were classified as ‘unknown’ or ‘other’. Fish health personnel gave recommendations about classification and were further involved if there were any significant mortality events. Following visits by fish health personnel and/or results from laboratory analysis, the mortality categories could have been retrospectively adjusted. Results of RT‐qPCR analysis performed as part of this study were made continually available to sites and may have been used when categorizing mortalities.
2.4. Sampling of fish
Each fish group was followed prospectively with regular sampling in the freshwater (FW) and seawater (SW) phases, whereas regular gross gill scoring was performed in the sea phase only. In the freshwater phase, 20 to 30 fish per fish group were sampled 0 to 3 times for histopathology (n = 350) and RT‐qPCR (n = 378) analysis. For a sample overview, see Table S1. Fish groups B and C were not sampled during the FW phase. The time from sea transfer until first sampling at sea ranged from 20 to 84 days across fish groups and the time between each sampling ranged from 20 to 122 days. About 10 to 30 fish were sampled per fish group and at 6 to 10 time points at sea. Fish groups A2, B1, B2 and F1 were mixed with fish from other cages during summer and autumn 2019, whereas fish groups G1, G2, E1, E2 and F2 were split into smaller groups during spring, summer or autumn of 2020. During each splitting or mixing event, the pen with the most fish from the original fish group was designated the project pen and fish group and followed moving forward. Most mixing events occurred late in production, with only one sampling performed after mixing for three fish groups (A2, B1 and B2), whereas six sample sets were collected after mixing of fish group F1. After the mixing, 49% (B2), 64% (A2), 85% (B1) and 95% (F1) of the original fish group remained in the designated project pen.
At each sampling point, the aim was to sample up to 15 fish with clinical signs of disease and 15 presumed healthy fish per pen/tank, but no fish sampled during FW and very few fish sampled in SW showed clinical signs of disease (n = 44) and most were presumed healthy (n = 2075) or of unknown health status (n = 1814). In the freshwater phase, fish were sampled using a dip net. At the sea sites, fish in the net pens were crowded using feeding and a purse seine, and fish were selected from the seine with a dip net, as described in the standard operating procedure of the fish farms. Prior to tissue collection, fish were killed by placing them in anaesthetic bath until dead. Within 5 minutes after euthanasia, the second left gill arch was sampled for histology, whereas tissue samples from the third left gill arch were placed in RNAlater (Sigma‐Aldrich) for RT‐qPCR analysis. Gross gill scoring was performed on anaesthetized fish prior to tissue sampling as far as practically possible (n = 3593).
2.5. Gross gill scoring
A gross gill score system based on the total area of abnormal tissue in the gill was adapted from a system developed by Fish Vet Group UK (personal communication Angela Ashby). Each left gill arch (both surfaces) was scored separately on a scale from 0 to 5 and then, a mean gill score for all arches was calculated. For each scoring session and fish group, the median of the mean gill score and the proportion of fish with a mean gill score higher than 1 were calculated. Lesions counting towards the score and score categories are outlined in Table 1. Gross gill scoring of 20 fish per fish group was planned to be performed weekly during the sea phase, but between 6 and 50 fish were scored per time point and fish group, with scores available from 33 to 51 weeks across all fish groups (n = 15,553). Scorers included site staff, Mowi project participants, attending fish health personnel and veterinarians and varied from site to site and over time. The majority of scorers received a training session and example images of the different lesions to be scored and categories were provided to each site.
TABLE 1.
Gross score system. The lesions counting towards the score, score categories and the extent of gill tissue affected for each score category are outlined
| Lesions | Score category | Gill tissue affected |
|---|---|---|
| White areas (presumed hyperplasia) | 0 | No abnormal gill tissue |
| Haemorrhages | 1 | <5% of gill tissue affected |
| Loss of gill tissue – shortened filaments | 2 | 5–25% of gill tissue affected |
| Swollen, thickened gill tissue | 3 | 25–50% of gill tissue affected |
| Yellow discolouration of gill tissue | 4 | 50–75% of gill tissue affected |
| Fusion of filaments | 5 | 75–100% of gill tissue affected |
| Necrosis (defined as grey or discoloured tissue and/or loss of normal tissue structure) |
2.6. Histopathology
Gills were fixed in 10% buffered formalin (4% formaldehyde, 0.08 M sodium phosphate, pH 7.0), processed routinely, and sectioned, stained with haematoxylin‐eosin (HE) and scanned for histopathologic examination as previously described in Østevik et al. (2021). The study pathologists were ‘blinded’ regarding results of RT‐qPCR‐analysis, gross score or water analysis if available. Two different pathologists (HH and MA) examined samples from the freshwater phase, whereas a third pathologist (LØ) examined all samples from the sea phase.
A slightly modified two‐step assessment protocol developed by the authors was used (Østevik et al., 2021). Briefly, first, the number of lamellae available for evaluation in each sample was estimated, and then, all affected lamella with hyperplasia or hyperplasia and inflammation, necrosis and vascular lesions (thrombi and aneurysms) were counted (Figure 2). For details and definitions of the type of lesions recorded, see File S1. These counts were used to calculate the estimated percent of gill tissue affected for each type of lesion. A total histology count was calculated by summarizing the number of lamellae with the lesions listed above and subtracting the number of lamellae with more than one lesion. The total percent affected tissue was then calculated by dividing the total histology count by the estimated lamellar count and multiplying by 100. Similarly, the percent of tissue affected by hyperplasia, vascular lesions or overlap of vascular lesions, and hyperplasia was calculated for each fish. The presence or absence of the following lesions was recorded as 0 or 1 (dichotomous variables):
Haemorrhage
Epithelial cell necrosis or apoptosis
Adhesion of lamella
Lamellar oedema/‘lifting’
Deformed filaments
Chronic inflammation of the filaments
Amoebic gill disease (AGD)
Foreign material present between lamella associated with tissue reaction
Any pathogens or microorganisms observed in or associated with the gill tissue were recorded as present or absent. For further work with the histopathology data on fish group level the median total percent affected tissue, median percent hyperplasia, median percent vascular lesions and median percent tissue with concurrent hyperplasia and vascular lesions per sampling point were used. In addition, the proportion of fish with the above lesions and pathogens as well as the proportion of fish with more than 5% total affected gill tissue was calculated for each fish group and sampling point and for the fish group overall.
FIGURE 2.

Normal gill tissue and histology lesions recorded as counts and percent. All tissues stained with haematoxylin and eosin. (a) Almost normal gill tissue at low magnification, very few foci of pathology are seen. Bar 2 mm. (b) Normal gill tissue at high magnification. Bar 200 μm. (c) Multifocal vascular lesions and focal segmental hyperplasia, fish group B2, 3% of lamella with vascular lesions. Bar 4 mm. (d) Vascular lesions, high magnification. Aneurysms with associated lamellar epithelial hyperplasia and variable extent of recanalization (arrowhead). Bar 100 μm. (e) Multifocal segmental hyperplasia affecting both proximal and distal aspects of the filaments, fish group G2, 21% of gill tissue affected. Bar 3 mm. (f) Lamellar epithelial hyperplasia with amoeba (arrowheads), also note subepithelial inflammation (arrows) and haemorrhage, fish group G2, same fish as (e). Bar 100 μm. (g) Lamellar epithelial hyperplasia and inflammation of the distal aspects of the filaments – fish group A1, 33% of gill tissue affected. Bar 4 mm. (h) High magnification of inflammation shows loss of lamella (arrowheads) and expansion of the filament by fibrous tissue with mild inflammatory infiltrates (*) and hyperplasia and inflammation (arrow) in surrounding lamellar epithelium. Fish group A2. Bar 200 μm
2.7. RT‐qPCR
Gill samples from the fresh water and sea water were examined with RT‐qPCR for Candidatus Branchiomonas cysticola and salmon gill poxvirus, whereas samples from sea water, in addition, were analysed for Desmozoon lepeophtherii and Neoparamoeba perurans. Nucleic acid extraction and RT‐qPCR‐analysis were performed as reported previously (Østevik et al., 2022).
Reverse Ct‐values were calculated as follows:
Reverse Ct for negative samples was set to 0. Median reverse Ct‐values and proportion of positive samples were used to assess the development of infection per fish group and sampling point.
2.8. Non‐medicinal delousing
Information on the treatment method, start date and number of sea lice treatments per fish group was provided by the farming company.
2.9. Plankton sampling and analysis
Sampling of sea water for classification and quantification of gelatinous zooplankton (jellyfish) and phytoplankton was conducted throughout the sea phase. In addition, farm staff was asked to record observations of jellyfish blooms occurring during the study period. A total of 29 to 56 water samples per site were examined for the presence of jellyfish and phytoplankton (n = 323 and n = 322). Plankton was collected using 250‐μm mesh nets, with 25 cm and 50 cm diameter ring for phyto‐ and zooplankton, respectively. Two vertical net hauls (10 m depth) were collected and zoo‐ and phytoplankton samples were fixed with formalin or iodine, respectively, prior to examination at the laboratory in Oslo. Phytoplankton levels were quantified and classified by examination of a subsample in a Sedgewick counting chamber slide under an inverted microscope. The number of microscopic jellyfish was quantified and classified by examination of a subsample in a cell culture bottle under a stereomicroscope. For a detailed description of plankton sampling and assessment, see File S2.
2.10. Descriptive statistical analysis
Statistical analysis was undertaken in STATA (StataCorp. 2015. Stata Statistical Software: Release 14. College Station, Texas, United States). Line plots were produced to provide a visual presentation of histopathology results, RT‐qPCR results, gross scores, mortality data, water temperature, zoo‐ and phytoplankton levels and management procedures per fish group over time at sea. Trends for the development of gill infections, gill‐related mortality, gross scores and gill histopathology over time and by season were described based on these graphs. Possible covariation and associations between the three main gill outcomes; gill‐related mortality; gross scores and histopathology results, and between exposures pathogen prevalence and density and zoo‐and phytoplankton levels were also assessed at fish group level based on these graphs.
Possible associations between pathogen load and detection by RT‐qPCR and pathogen observation in tissue sections per fish group were assessed by producing scatter plots and computation of Spearman's rank‐order correlation coefficient. To assess whether the extent of tissue lesions was increasing with increased pathogen load in the fish‐level data set an ordinal variable was generated for each pathogen. 0 indicated not detected, 1 a low amount of genetic material (Ct‐values were higher than 25), 2 a moderate amount of genetic material (Ct‐values were between 20 and 25) and 3 a high amount of genetic material (Ct‐values were lower than 20). Associations between pathogen load and gill histopathology or gill gross score were assessed by producing box and whisker plots of percent of tissue lesions or mean gross scores by pathogen loads 0 to 3, and by computation of Spearman's rank‐order correlation coefficient for percent tissue lesions or mean gross score and reverse Ct‐values for the different lesion and pathogen combinations. To determine if there was an association between epithelial cell necrosis and pathogen load, we used a series of logistic regression models with epithelial cell necrosis as the response variable and pathogen load (ordinal variables) as predictor variables. The odds ratio (OR) was calculated using the PCR‐negative fish as a baseline.
3. RESULTS
3.1. Gill health in the freshwater phase
Histopathological lesions were absent or minimal to mild suggestive of overall good gill health in all the sampled fish groups (n = 6). One fish group (D) experienced SGPVD‐related mortality (3.36% accumulated mortality), but the mortality had ceased when project samples were collected. SGPV was detected with RT‐qPCR in four fish groups (C, D, G and H), from two freshwater facilities (sites 3 and 4). The prevalence of infection ranged from 0 to 53% across fish groups and time points. Ca. B. cysticola was only found in fish group E. No gill‐related mortality, nor severe histopathological lesions or high gross gill scores were detected during the sea phase for fish groups D1 and D2, the fish groups that experienced gill‐related mortality due to SGPVD in the freshwater phase.
3.2. Environmental data
Sea temperatures during the project period ranged from 4.2 to 17.7°C across all sites and time points and followed a clear seasonal pattern (Figure 3). The lowest mean temperatures were recorded in March (6.1°C, range: 4.4 to 8.6°C) and the highest in August (14.4°C, range: 10 to 16.9°C). The salinity at sea site B ranged from 27.6 to 30.9‰, without any evident seasonal pattern. At site C, salinity showed considerable variation throughout the year (range: 14.11 to 29.14‰) and was lowest in late summer and autumn (August to October). A single measurement of 20.62‰ was recorded for site H. The salinity at the remainder of the sites was unknown.
FIGURE 3.

Sea temperature, daily gill‐related mortality (%), percentage of fish with gross gill score >1 and percentage of fish with >5% of gill tissue affected (histopathology) over time at sea per fish group. Daily gill‐related mortality (%) for (a) autumn‐transferred fish and (b) spring‐transferred fish, percentage of fish with gross gill score >1 for (c) autumn‐transferred fish and (d) spring‐transferred fish, percentage of fish with >5% of gill tissue affected (histopathology) for (e) autumn‐transferred fish and (f) spring‐transferred fish. The mean daily sea temperature across all study sites is shown in each figure
3.3. Gill‐related mortality
Presumed gill‐related mortality was observed in 10 of 16 fish groups (Figures 3a and b), whereas no gill‐related mortality was recorded at sites C, D and F. The mortality assigned as gill‐related was generally low with the accumulated gill‐related mortality ranging from 0.04 to 1.69% (Table S2). Gill‐related mortality was observed both in the spring, summer, winter and autumn months. The highest gill‐related mortality occurred at sites G and H. Mortality at site G coincided and followed a peak in severity and extent of histopathology lesions and a high prevalence and load of N. perurans. The gill‐related mortality at site H occurred late in the production cycle when sampling and gross scoring were completed, thus the extent of gill pathology and prevalence and load of potential pathogens at the time were unknown.
3.4. Gross gill pathology
Median gross gill scores across the project period were mostly below 1 (Table 2), but in five autumn‐transferred fish groups (A1–2, B1–2 and C1), more than 50% of the scored fish had a mean gill score higher than 1 towards the end of the production cycle (Figures 3c and d). In groups A1, B1 and B2, the increase in gross pathology coincided with low levels of gill‐related mortality. Fish group C1 developed bacterial branchitis and likely gross gill lesions as part of systemic bacterial infection, but mortality associated with this condition was recorded as infectious disease‐related mortality. No increase in gross gill scores was evident during the time period when sea site G experienced gill‐related mortality, the increased extent of gill histopathology and a high prevalence and load of N. perurans. Overall, gross gill scores did not appear to show a consistent seasonal variation or consistent covariation with water temperature, or prevalence of the putative gill pathogens detected by RT‐qPCR analysis.
TABLE 2.
Summary of gross scores for all fish groups across the sea phase of the study (n = 15,553)
| Gross pathology | Median | #fish ≥1 | #fish > 0 |
|---|---|---|---|
| Min–Max | %fish ≥ 1 | %fish > 0 | |
| Gross score (mean all scored arches) | 0 | 1053 | 7744 |
| 0–5 | 6.77 | 49.79 |
3.5. Gill histopathology
The number and prevalence of fish with different lesions and pathogens observed and median, minimum and maximum lesion counts and percent across all samples are shown in Tables 3 and 4. The prevalence of lesions and pathogens per fish group is available in Table S2. There was a tendency towards a seasonal variation with more gill lesions observed in autumn and winter. The most severe gill lesions were also detected during or following periods of high sea temperatures in autumn and winter months (Figures 3e and f).
TABLE 3.
Overview of histopathology lesions recorded as counts and percent for all fish groups across the sea phase of the study (n = 3897)
| Lesion | Counts(median) | % (median) | #fish ≥5% | #fish > 0% |
|---|---|---|---|---|
| Min–Max | Min–Max | %fish ≥5% | %fish > 0% | |
| Acute vascular lesions | 2 | 0.02 | 1 | 2585 |
| 0–833 | 0–5.68 | 0.03 | 66.33 | |
| Non‐acute vascular lesions | 12 | 0.09 | 21 | 3360 |
| 0–5885 | 0–30.32 | 0.54 | 86.22 | |
| All vascular lesions | 18 | 0.14 | 26 | 3617 |
| 0–5885 | 0–30.32 | 0.67 | 92.81 | |
| Hyperplasia and hyperplasia and inflammation | 14 | 0.1 | 120 | 3300 |
| 0–5119 | 0–51.84 | 3.08 | 84.68 | |
| Overlap vascular lesions and hyperplasia | 0 | 0 | 3 | 1330 |
| 0–754 | 0–6.54 | 0.08 | 34.12 | |
| Total gill tissue affected | 45 | 0.31 | 162 | 3836 |
| 0–5988 | 0–51.90 | 4.16 | 98.43 |
TABLE 4.
Summary of histopathology lesions and pathogens recorded as dichotomous variables for all fish groups across the sea phase of the study (n = 3897)
| Lesion/organism | # Fish | % Fish |
|---|---|---|
| Chronic inflammation filament | 195 | 5.0 |
| Deformed filaments | 352 | 9.03 |
| Lamellar oedema | 185 | 4.75 |
| Haemorrhage | 2855 | 73.26 |
| Necrosis whole lamella | 17 | 0.44 |
| Epithelial cell necrosis | 341 | 8.75 |
| Intracellular bacteria (Epitheliocysts) | 1630 | 41.83 |
| Trichodina spp. | 41 | 1.05 |
| Crustaceans | 145 | 3.72 |
| Filamentous bacteria | 1 | 0.03 |
| Other Bacteria | 21 | 0.54 |
| Metacercaria | 42 | 1.08 |
| Ichthyobodo spp. | 28 | 0.72 |
| Amoeba/AGD a | 330 | 8.47 |
| Foreign material b | 18 | 0.46 |
This category includes both the observation of parasites morphologically consistent with amoeba and AGD diagnosed based on the presence of these parasites and typical histopathological lesions.
The presence of foreign material was only recorded when the material was associated with a tissue reaction as for instance inflammation or hyperplasia.
The histopathological lesions observed in the fish groups were generally mild, with the exceptions of fish groups G1 and G2 and to a lesser extent C1, A and B. The median total percent affected gill tissue was generally <2% across all time points and fish groups but ranged from 0 to 52% amongst individual fish. The exception to this was fish groups G1 and G2, where an increase in the median percent affected tissue to higher than 8% was observed during late autumn and winter of 2019. The pattern was similar for the proportion of fish with more than 5% of gill tissue affected. The first autumn and winter at sea more than 60% of fish had lesions affecting at least 5% of gill tissue at site G. In contrast, less than 10% of the sampled fish had this extent of gill lesions at any time in most of the remaining groups (Figures 3e and f).
The median percent lamellar epithelial hyperplasia and/or hyperplasia and inflammation generally showed a similar pattern as percent total tissue affected across fish groups and time points, though more vascular lesions than hyperplastic lesions were observed at some sites and time points. The highest median percent hyperplasia was found in groups G1 and G2, coinciding with the highest median total gill tissue affected. Median percent vascular lesions were less than 1% for all fish groups and time points, and the highest median percent vascular lesion was found in group G1 concurrently with the highest median percent tissue affected. In general, the median percent vascular lesions appeared to increase with increasing time at sea for autumn‐transferred fish, but this pattern was not evident for spring‐transferred fish. The extent of gill tissue with vascular and hyperplastic lesions in individual fish ranged from 0 to 30% and 0 to 52%, respectively. Overlap of hyperplastic and/or inflammatory lesions and vascular lesions were found in 34% of fish overall but did not constitute a substantial part of the histopathology observed in most fish groups.
Necrosis of lamellae was rarely observed (0.44% of gills sampled) and did not substantially contribute to the total percent affected gill tissue. Necrotic lamella was most often associated with bacterial infection and/or foreign material trapped between filaments (Figures 4a‐c). Epithelial cell necrosis or apoptosis was observed in a minority of fish in all fish groups and did not appear to have a clear seasonal distribution. Chronic inflammation of the filaments, deformed filaments and lamellar oedema were relatively rarely observed across the fish groups and time points (Figures 2g, h and 4d). No consistent increase in the proportion of fish with deformed filaments was observed over the time at sea. Chronic inflammation of the filaments was observed in more than 40% of fish from fish groups A1–A2 and B1–B2 during the second autumn at sea coinciding with an increase in hyperplastic and vascular lesions. An increase in the prevalence of lamellar oedema was seen in fish groups C1, F1 and F2 at different time points. The increase coincided and was associated with lesions of bacterial branchitis for fish group C1, but no specific disease diagnosis, changes in pathogen density or management operations were associated with the increase in fish groups F1 and F2.
FIGURE 4.

Lesions and pathogens observed. (a) Bacteria, haemorrhage, necrosis and lamellar epithelial hyperplasia. Note basophilic granular material (bacteria) partially embedded in eosinophilic material (fibrin) expanding filament vessels (*) and lamellar sinusoids (arrowheads). Pasteurella spp.– infection in fish group C1. Bar 300 μm. (b) Foreign material, possibly plant material (*), caught between filaments. Inflammation and haemorrhage are seen in the filament and there are necrosis (loss) of surrounding lamella (arrowheads). Fish group F2. Bar 300 μm. (c) Necrosis of lamella with loss of normal tissue structures and large amounts of filamentous bacteria, likely Tenacibaculum sp., in the necrotic tissue. Inflammatory cells and haemorrhage are seen in the filament. Fish group C1. Bar 60 μm. (d) Focal proliferation of filament cartilage—possibly callus formation caused by previous trauma. Recorded as a deformity. Bar 400 μm. (e) Small crustacean between lamellae. Fish group A1. Bar 80 μm. (f) Metacercaria surrounded by a thin fibrous capsule in the filament. Fish group A2. Bar 50 μm
3.6. Gill pathogens
The prevalence of microorganisms observed in tissue sections across fish groups and per fish group is shown in Table 4 and Table S2. The prevalence, median reverse Ct‐values and number of fish with mild, moderate and high pathogen load detected by RT‐qPCR across all fish groups are available in Table 5. The median reverse Ct‐values and prevalence per fish group over time are shown in Figure 5 and Figure S1, respectively.
TABLE 5.
Summary of pathogens detected by RT‐qPCR for all pens across the sea phase of the study (n = 3933). Numbers in the column headings indicate low, moderate and high pathogen load. 1 indicates Ct‐values higher than 25, 2 indicates Ct‐values between 25 and 20, 3 indicates Ct‐values lower than 20
| Organism | Median reverse Ct | Detection | Pathogen load ≥1 | Pathogen load ≥2 | Pathogen load ≥3 |
|---|---|---|---|---|---|
| Min–max | # fish positive | #fish | #fish | #fish | |
| %fish positive | %fish | %fish | %fish | ||
| N. perurans | 0 | 772 | 388 | 291 | 93 |
| 0–26.49 | 19.63 | 9.87 | 7.40 | 2.36 | |
| Ca. B. cysticola | 14.72 | 3083 | 1211 | 1459 | 413 |
| 0–25.27 | 78.39 | 30.79 | 37.10 | 10.50 | |
| D. lepeophtherii | 10.69 | 3227 | 3076 | 146 | 5 |
| 0–23.27 | 82.05 | 78.21 | 3.71 | 0.13 | |
| SGPV | 0 | 538 | 514 | 23 | 1 |
| 0–21.67 | 13.68 | 13.68 | 0.58 | 0.03 |
FIGURE 5.

Median reverse Ct‐values per fish group throughout the sea phase for autumn‐transferred (S0) and spring‐transferred (S1) fish groups. (a) SGPV (S0), (b) SGPV (S1), (c) Ca. B. cysticola (S0), (d) Ca. B. cysticola (S1), (e) D. lepeophtherii (S0), (f) D. lepeophtherii (S1), (g) N. perurans (S0), (h) N. perurans (S1)
SGPV was detected sporadically during the seawater phase with a prevalence ranging from 0 to 100% and seemed to have a seasonal distribution with positive samples collected in summer and autumn at most sites (Figure S1a and b). Overall SGPV was detected in 13.7% of the tested gills, the majority of which contained low amounts of viral genetic material (Table 5, Figures 5a and b). However, all fish groups tested positive for SGPV at least once at sea even if they were negative prior to sea transfer. Further, in several fish groups, SPGV appeared to disappear in late winter and early spring before being detected again during the following summer.
All fish groups became positive for Ca. B. cysticola and D. lepeophtherii after sea transfer and prevalence remained high (60–100%) throughout the sea phase (Figures S1c‐f). Most positive gill samples contained low amounts of D. lepeophtherii genetic material, whereas close to half of the tested gills (47.6%) contained moderate to high amounts of Ca. B. cysticola genetic material (Table 5). A consistent seasonal variation of prevalence and pathogen load was not evident for Ca. B. cysticola or D. lepeophtherii (Figures 5 and S1). All autumn‐transferred fish groups were positive for D. lepeophtherii at the first sample point 54 to 84 days after sea transfer. D. lepeophtherii were detected in most of the fish groups transferred in June 2019 at the second sample point at 74 to 84 days after sea transfer, whereas the parasite was not detected in fish groups transferred in April 2019 until the third or fourth sampling point at 124 to 172 days after sea transfer. For all fish groups, median reverse Ct‐values peaked relatively rapidly after the first detection during the first autumn at sea. Most fish groups were negative for Ca. B. cysticola at the first sample point, but the bacterium was detected in all autumn‐transferred fish groups by the second sample point at 84 to 96 days after sea transfer, whereas the first detection in most spring‐transferred fish groups was at 120 to 138 days after sea transfer. After infection, median reverse Ct‐values peaked rapidly during the first autumn at sea at some sites (C, G and H), whereas the peak occurred during the subsequent spring for the remaining sites.
Intraepithelial intracytoplasmic bacteria (epitheliocysts) were found in all fish groups after sea transfer, but prevalence varied markedly between fish groups and time points. A consistent seasonal variation was not observed. Epitheliocysts were observed in 50.7% of Ca. B. cysticola PCR‐positive gills. The correlation between intracellular bacteria observed in the tissue sections recorded as proportion per fish group and time point and proportion of Ca. B. cysticola PCR‐positive samples were strong (Spearman's rho = 0.57, Prob > |t| = 0.0000, n = 139). There was no clear association between increasing proportion of fish with epitheliocysts and increasing median reverse Ct‐values for Ca. B. cysticola on the fish group level, and the variation in the proportion of fish with epitheliocysts at a similar median reverse Ct‐level was large (Figure 7a). A consistent covariation between the proportion of Ca. B. cysticola PCR‐positive fish and fish with intracellular bacteria in the lamellar epithelial cells was not observed for the different fish groups and time points.
FIGURE 7.
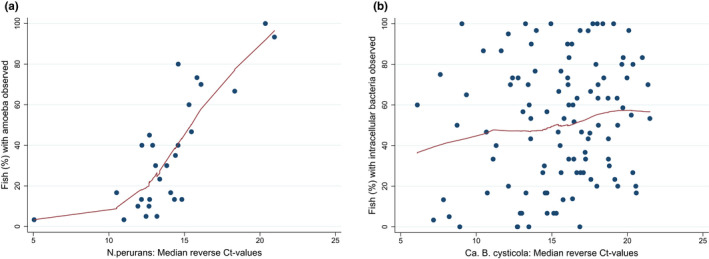
Relationship between pathogens observed in tissue sections and Ct‐levels detected by RT‐qPCR per fish group. Scatterplots show the percentage of fish per sampling point and fish group (n = 139) where a) amoeba and b) intracellular bacteria (epitheliocysts) were observed in the tissue sections against median reverse Ct‐values for N. perurans and Ca.B. cysticola, respectively. Fish groups with a median reverse Ct of 0 are excluded for clarity leaving (a) n = 28 and (b) n = 107 fish groups. [Correction added on 12 July 2022, after first online publication: figure 7(a) has been updated in this version]
Amoebic gill disease as diagnosed by the presence of amoeba and segmental lamellar epithelial hyperplasia (Figures 2e and f) was found in all but fish group C2. Amoeba without associated lamellar epithelial hyperplasia was not identified in any of the samples. N. perurans genetic material was detected in all fish groups, and the prevalence of both infection and AGD‐diagnosis ranged from 0 to 100% across time points and fish groups (Tables 4 and 5). Presumed amoeba and histopathological lesions consistent with AGD were observed in 8.5% of gills and in 36.6% of N. perurans PCR‐positive gills. There was a strong correlation between the proportion of gills with the observation of amoeba and the proportion of fish with PCR detection of N. perurans (Spearman's rho = 0.90, Prob > |t| = 0.0000, n = 139). For median reverse Ct‐values higher than 10, there was an association between the proportion of fish with amoeba/AGD observed in tissue sections and the median reverse Ct‐value (Figure 7b). There was a consistent covariation between the proportion of N. perurans PCR‐positive fish and fish with amoeba/AGD across fish groups and time points, though the proportion of fish with AGD/amoeba was considerably lower than the proportion of fish with positive PCR tests.
The presence and load of the parasite and the diagnosis of AGD by histopathology showed a seasonal distribution, being detected during late summer, autumn and winter and disappearing in spring and early summer (Figures 5g‐h and 6). A histopathologic diagnosis of AGD or detection of the parasite by RT‐qPCR was not necessarily coinciding with severe and extensive lamellar epithelial hyperplasia (Figure 6), or gill‐related mortality or increased gross gill scores. However, markedly higher median reverse Ct‐values in fish groups G1 and G2 (Figures 5g and h) coincided with a high prevalence of N. perurans infection and AGD diagnoses, the most severe histopathological lesions and gill‐related mortality.
FIGURE 6.

Prevalence of N. perurans, AGD and percentage of fish with >5% of gill tissue with lamellar epithelial hyperplasia and hyperplasia and inflammation over time at sea per fish group. (a) N. perurans (S0), (b) N. perurans (S1), (c) AGD (S0), (d) AGD (S1), (e) hyperplasia (S0), (f) hyperplasia (S1). Non‐medicinal and medicinal sea lice treatment events that could impact the development of AGD and N. perurans prevalence are represented as x for fish groups A1‐H1 and o for fish groups A2‐H2
Excluding the fish with pasteurellosis from site C and intraepithelial intracytoplasmic bacteria (epitheliocysts), bacteria were sporadically observed in association with or within gill tissue and only in 0.13% of the fish. Filamentous rod‐shaped bacteria, most likely Tenacibaculum spp., were observed in just one fish that also had pasteurellosis and were associated with focal necrotizing branchitis (Figure 4c). Parasites Trichodina spp., Ichthyobodo spp., encysted metacercaria and small and large crustaceans were rarely found within or associated with the gill tissue (Figure 4e and f, Table 4). No clear seasonal distribution was evident, but the most fish with Trichodina spp. and Ichthyobodo spp. were found at site G when the most severe gill histopathology was detected.
3.7. Association between gill lesions and pathogens
Segmental hyperplasia and unicellular parasites consistent with amoeba were the main histopathological findings in fish with moderate to marked gill pathology at site G during autumn and winter 2019 (Figure 2e and f). However, lamellar subepithelial inflammation and pale, yellow to brown, intracellular, granular pigment, and intracellular bacteria (epitheliocysts) were also observed in most fish. A high load and 100% prevalence of N. perurans coincided with the increase in gill pathology. A moderate to high load of pathogens D. lepeophtherii and Ca. B. cysticola was observed at the same time points, but similar loads of these pathogens were observed in other fish groups and at other time points without the associated increase in gill pathology seen at site G.
In fish group C1, intravascular fine rod‐shaped bacteria associated with variable extent of haemorrhage, thrombosis, inflammation, necrosis and hyperplasia were found in 50% of fish at the last sampling point in November 2019 (Figure 4a). Mild AGD lesions and amoeba were also observed. Pasteurella spp. infection was confirmed in the fish group by bacteriology the month prior. In November 2019, chronic inflammation of the distal part of the filaments with epithelial hyperplasia and variable extent of vascular lesions and loss of the overlying lamella was the dominating finding in fish groups A1 and A2 (Figure 2g and h). When comparing with other sampling points and fish groups, no increase or higher prevalence and load of gill pathogens as detected by RT‐qPCR appeared to be associated with these lesions. For fish group B2, the most severe gill pathology was observed in September 2019, and lesions at this time point were dominated by segmental hyperplasia and amoeba and to a lesser extent vascular lesions and chronic inflammation of the distal filaments as described for fish groups A1 and A2.
Correlations between histopathology lesions recorded as percent and reverse Ct‐values in the fish‐level data set were not significant, very weak or weak (Spearman's rho < 0.3) for the majority of pathogen and lesion combinations. A moderate association was only found for hyperplasia and reverse Ct‐values of N. perurans (Spearman's rho = 0.34, Prob > |t| = 0.0000, n = 3885). Correlations between mean gross scores and reverse Ct‐values in the fish‐level data set were also not significant, very weak or weak (Spearman's rho < 0.3) for all pathogens. Examination of box and whisker plots of percent of tissue lesions in gills with no, mild, moderate or high pathogen load (ordinal RT‐qPCR results) showed an increasing extent of hyperplasia with an increasing amount of N. perurans genetic material detected (Figure 8). Similarly, there was an increasing extent of total tissue affected with an increasing amount of N. perurans, whereas there was no clear or only a very mild tendency of increasing extent of hyperplasia, total tissue affected, vascular lesions or overlap of vascular and hyperplastic lesions with increasing pathogen load for the remainder of the pathogens. Correlation between reverse Ct‐values for the different pathogens was not significant, very weak or weak (Spearman's rho < 0.3), except for between N. perurans and D. lepeophtherii (Spearman's rho = 0.34, Prob > |t| = 0.0000, n = 3933). There was an increasing number of fish with epithelial cell necrosis with an increasing load of SPGV, N. perurans and Ca. B. cysticola (Table 6), but the association was strongest for SGPV. The probability (odds) of observing epithelial necrosis in the gills of fish with a moderate load of SGPV was 21.60 times higher compared to fish testing negative for SGPV. The correlation between the mean gross score and total tissue affected as assessed by histopathology was weak (Spearman's rho = 0.24, Prob > |t| = 0.0000, n = 3541). Similarly, the correlation between the total tissue affected and the gross score of the arch that was sampled for histopathology (2nd left arch) was also weak (Spearman's rho = 0.25, Prob > |t| = 0.0000, n = 3593).
FIGURE 8.

The extent of lamellar epithelial hyperplasia at different loads of pathogens detected in the gill tissue. Box and whisker plots show percent lesions (n = 3885) grouped by ordinal RT‐qPCR‐results for (a) N. perurans, (b) Ca. B. cysticola. Outliers are excluded for clarity
TABLE 6.
Epithelial cell necrosis or apoptosis. Results of statistical analysis of the association between epithelial cell necrosis or apoptosis and pathogen load
| Pathogen | Pathogen load | Odds ratio | P > |z| | 95% Conf. Interval |
|---|---|---|---|---|
| N. perurans | 0 | |||
| 1 | 1.21 | 0.331 | 0.82, 1.77 | |
| 2 | 2.62 | 0.000 | 1.88, 3.67 | |
| 3 | 7.82 | 0.000 | 5.03, 12.16 | |
| Ca. B. cysticola | 0 | |||
| 1 | 1.02 | 0.934 | 0.71, 1.45 | |
| 2 | 1.60 | 0.005 | 1.16, 2.22 | |
| 3 | 3.02 | 0.000 | 2.06, 4.41 | |
| D. lepeophtherii | 0 | |||
| 1 | 0.28 | 0.000 | 0.15, 0.52 | |
| 2 | 1.27 | 0.494 | 0.65, 2.48 | |
| SGPV | 0 | |||
| 1 | 2.64 | 0.000 | 2.02, 3.46 | |
| 2 | 21.60 | 0.000 | 9.35, 49.86 |
3.8. Non‐medicinal delousing
The type and number of sea lice treatments (excluding in‐feed treatment) per fish group are summarized in Table S2. The number of delousing operations during the sea phase ranged from 0 to 11 between fish groups, with a median of five treatments per group. Freshwater and hydrogen peroxide bath treatments that may impact the prevalence and median Ct‐values of N. perurans, the prevalence of AGD and development of hyperplastic gill lesions, were performed in 13 fish groups (Table S2). A reduction in the proportion of N. perurans and AGD positive fish was seen at the sampling points immediately after one or more freshwater or hydrogen peroxide bath treatments in six fish groups, whereas an increase was seen in five groups (Figure 6).
3.9. Jellyfish and phytoplankton
The levels of plankton were generally low with the highest levels of phytoplankton detected during spring and summer at sites C and D (data not shown). The number of microscopic jellyfish was < 50 organisms/m3 with the highest number during the spring months. Based on the submitted samples, there were no apparent phytoplankton or jellyfish blooms during the study period. Furthermore, observation of jellyfish blooms was not reported from any of the sea sites. No increase in gross gill scores, gill histopathology, gill‐related mortality or total mortality was evident following peaks in total phytoplankton levels to 732,164 and 535,779 cells/L detected at sites C and D, respectively. Additionally, there was no covariation between phytoplankton levels and any of our gill indicators.
4. DISCUSSION
Neoparamoeba perurans appeared to be the most important cause of gill pathology and specifically lamellar epithelial hyperplasia in this study, whereas no consistent covariation and no or weak associations between extent of hyperplasia and prevalence and load of SGPV, Ca. B. cysticola and D. lepeophtherii were observed. There were no or weak associations between vascular lesions and overlap of vascular and hyperplastic lesions and pathogen load for any of these pathogens and N. perurans. AGD appeared to resolve without treatment with falling sea temperatures in fish groups with mild infections and pathology. D. lepeophtherii and Ca. B. cysticola infections were established and persisted after sea transfer in all fish groups and a clear seasonal variation in pathogen load and prevalence were not observed. Ca. B. cysticola prevalence and prevalence of intracellular bacteria observation were highly correlated, but there was no association between the prevalence of intracellular bacteria observed and increasing pathogen load for Ca. B. cysticola. SGPV infection and prevalence showed a seasonal pattern varying with sea temperature. Fish groups negative for SGPV at sea transfer became infected, apparently cleared the infection before again testing positive which may indicate that previous SGPV infection does not protect against reinfection of the same fish group. Coinfection with three or more putative gill pathogens was found in all fish groups and appears to be the norm in sea‐farmed Atlantic salmon in Western Norway.
4.1. The impact of gill pathogens on gill health
Neoparamoeba perurans is an important cause of gill disease and gill pathology in salmonid aquaculture, and this has been firmly established since amoebic gill disease was first described in Tasmania (Munday, 1986; Young et al., 2007). Thus, the finding that high loads of N. perurans were associated and coincided with hyperplastic gill lesions and gill‐related mortality was unsurprising. Our findings are also in agreement with two longitudinal studies from marine farms in Ireland and Scotland in which increasing N. perurans loads was associated with increasing gill histology scores (Downes et al., 2018; Herrero‐Fernández, 2019). N. perurans load and prevalence of amoeba and AGD pathology in tissue sections at group level were highly correlated, indicating an increasing prevalence of amoeba and AGD lesions with increasing pathogen load. However, as tissue sampling was standardized, different gill arches were collected for histopathology and RT‐qPCR, and AGD was only diagnosed when amoeba was observed in the tissue section, the true prevalence of N. perurans and AGD in our fish groups was likely higher than reported here, and an even stronger association between RT‐qPCR and histology would be expected if the same arch was sampled for these analyses (Adams, Ellard, & Nowak, 2004; Fringuelli, Gordon, Rodger, Welsh, & Graham, 2012).
As in the current study, increasing Ca. B. cysticola loads was not associated with increased histological gill scores or a clinical diagnosis of gill disease in recent longitudinal studies (Downes et al., 2018; Gunnarsson et al., 2017; Herrero‐Fernández, 2019). These findings are further supported by the lack of clinical disease in fish infected with Ca. B. cysticola, SGPV and Ca. Piscichlamydia salmonis in a cohabitation study (Wiik‐Nielsen et al., 2017). In contrast to the current study, an association between the amount and prevalence of epitheliocysts observed in the gill tissue and Ca. B. cysticola load has been reported previously. Further, an association between gill histopathology and high numbers of epitheliocysts was described (Mitchell et al., 2013; Steinum et al., 2010). Ca. B. cysticola is the predominant epitheliocyst‐forming bacteria in gills of Atlantic salmon in Norway and Ireland, but other epitheliocyst‐forming bacterial species exist (Mitchell et al., 2013; Toenshoff et al., 2012). Thus, the lack of association between the proportion of fish with epitheliocysts and load of Ca. B. cysticola in our material could indicate that some of the observed epitheliocysts contain other bacteria like Candidatus Piscichlamydia salmonis, Candidatus Syngnamydia salmonis or a new epitheliocyst‐forming bacterium recently described (Wiik‐Nielsen et al., 2015). However, Ca. B. cysticola can be present in gill tissues without forming intracellular cysts, so the lack of association may also be related to higher levels of bacterial colonization without epitheliocyst formation in the fish groups (Gjessing et al., 2021).
The relatively low prevalence and load of SGPV and the lack of association between SGPV load and the extent of proliferative lesions and overall gill pathology are in agreement with previous studies (Downes et al., 2018; Gjessing et al., 2019; Herrero‐Fernández, 2019). The increased likelihood of observation of epithelial cell necrosis or apoptosis in fish with higher loads of SGPV is in line with studies demonstrating SGPV in the apoptotic gill epithelium of sea‐farmed salmon with complex gill pathology (Gjessing et al., 2017; Gjessing et al., 2021). Whilst SGPV initially was suggested to be a primary pathogen that could pave the way for other gill pathogens (Gjessing et al., 2017), recent studies have shown that immunosuppression may be necessary for disease development in SGPV‐infected fish (Amundsen et al., 2021; Thoen et al., 2020). The results of the longitudinal studies conducted so far suggest that SGPV is not an important cause of severe gill disease in sea‐farmed Atlantic salmon, at least not in the populations examined, and the significance of SPGV infection and pathology in the sea water phase needs to be further explored (Downes et al., 2018; Herrero‐Fernández, 2019).
We did not find a moderate to strong association or consistent covariation between the extent of gill pathology, gross gill score or gill‐related mortality and D. lepeophtherii loads in the current study. This is in contrast with previous studies reporting that higher D. lepeophtherii loads were associated with gill disease, proliferative gill lesions, proliferative gill inflammation (PGI) and increased histology gill scores (Gunnarsson et al., 2017; Hamadi, 2011; Herrero‐Fernández, 2019; Nylund et al., 2011; Nylund, Nylund, Watanabe, Arnesen, & Karlsbakk, 2010; Steinum et al., 2010). A possible reason for the discrepancy may be related to the low and moderate loads of D. lepeophtherii and relatively few fish and fish groups with severe gill pathology in the current study. Histologic lesions reported to be associated with D. lepeophtherii and/or Ca. B. cysticola, that is, ballooning degenerative cells containing pigmented material, lamellar epithelial hyperplasia, necrosis in hyperplastic lesions, pustules, subepithelial inflammation and necrosis of subepithelial cells were observed in several of our fish groups (Gjessing et al., 2019; Gjessing et al., 2021; Matthews, Richards, Shinn, & Cox, 2013; Weli et al., 2017). But, because the primary aim of the current study was to determine which factors might impact the overall gill health, we chose to provide an accurate estimate of the extent of gill tissue with the presumed most important and commonly observed gill lesions. Thus, the extent of lesions reported to be associated with high loads of D. lepeophtherii and Ca. B. cysticola was not consistently recorded or quantified, and this could be pursued in future studies. However, the repeated finding of widespread D. lepeophtherii‐ and Ca. B. cysticola infection and persistence in healthy Atlantic salmon strongly suggest that predisposing or additional factors are necessary for these agents to cause gill lesions and gill disease and/or that there might be variation in virulence and pathogenicity within these species.
This study further demonstrates that coinfections of multiple putative gill pathogens are the norm in sea‐farmed Atlantic salmon in Western Norway. Infection with three or more microorganisms was found in >20% of the fish, but the majority of fish groups did not develop severe gill pathology or associated mortality. As all fish groups were infected with all pathogens, it was not possible to determine if fish groups infected with a given pathogen had worse outcomes or higher pathogen loads after infection with a second or third pathogen. The prevalence and pathogen load of the four pathogens largely followed different patterns and there was only moderate correlation between pathogen load for D. lepeophtherii and N. perurans. This might suggest an association in which infection with one pathogen allows and promotes the proliferation of another. Such a relationship might explain the frequent observation of gill lesions ascribed to different pathogens in the same fish. Another possibility is that higher sea temperatures during autumn favours the proliferation of these pathogens independent of infection status with the other.
A strong association or covariation between the extent of vascular lesions and pathogen load, or between concurrent vascular and hyperplastic lesions and pathogen load was not observed in our material. Whilst vascular lesions frequently were associated with hyperplasia of the immediately overlying and surrounding lamellar epithelium, aneurysms and thrombi were often not associated with severe inflammation or severe lamellar epithelial hyperplasia. Further, the chronic inflammation, lamellar epithelial hyperplasia and vascular lesions observed in fish groups A1 and A2 were not associated with higher loads of pathogens compared to other fish groups. These observations suggest that factors other than the gill pathogens included in this study could be involved in the development of these lesions. Vascular lesions are unspecific responses and are not characteristic of a particular insult. An increase in prevalence and severity of thrombi, haemorrhage and/or aneurysms have been reported after non‐medicinal delousing and in situ net washing, and haemorrhage, thrombi and aneurysms have been observed after exposure to jellyfish (Baxter, Sturt, et al., 2011; Baxter, Rodger, McAllen, & Doyle, 2011; Bloecher et al., 2018; Marcos‐Lopez, Mitchell, & Rodger, 2016; Mitchell, Baxter, & Rodger, 2011; Østevik et al., 2021; Østevik et al., 2022; Powell, Atland, & Dale, 2018).
Notably, extensive lamellar thrombosis and fibrinohemorrhagic and necrotizing branchitis were observed in fish with systemic bacterial infection (pasteurellosis). Pasteurellosis caused by the currently unofficially named Pasteurella atlantica genomvar salmonicida has become endemic in sea‐farmed salmon in Southwestern and Western Norway since 2018. The disease manifests as a systemic bacterial infection with fibrinous polyserositis, necrosis and inflammation of internal organs, muscle abscesses, exophthalmia and ophthalmitis (Gulla, Nilsen, Olsen, & Colquhoun, 2020; Legård & Strøm, 2020). In the authors experience intravascular bacteria and histological lesions are frequently identified in the gills of fish with pasteurellosis. Disturbances of coagulation and haemostasis are also common in fish with other systemic bacterial infections (Salte, Nafstad, & Asgård, 1987). Thus, pasteurellosis has become a cause of gill lesions in Atlantic salmon in Western Norway, and it is possible that lamellar thrombi and vascular lesions are related to concurrent and/or previous systemic bacterial infection in some cases, even when bacteria are not observed in the gill tissue.
4.2. The impact of season and sea temperature on gill pathogens
Neoparamoeba perurans infection in our fish groups showed a seasonal variation with the highest prevalence and pathogen load in autumn and winter, and clearing of infection in spring. This is consistent with the pattern observed in Norway since AGD first became endemic and is likely related to the seasonal variation in sea temperatures (Clark & Nowak, 1999; Mo et al., 2015; Sommerset et al., 2021). Our results also further demonstrate that N. perurans infection and AGD can be self‐limiting and resolve without treatment when sea temperatures fall (Clark & Nowak, 1999). Sites C and H with the lowest recorded salinities had the lowest overall prevalence of N. perurans infection and AGD. Unfortunately, information about salinity at most sites and variation in salinity at site H over time was not available, but the low salinity likely explains the markedly lower prevalence of AGD at sites C and H (Clark & Nowak, 1999; Mo et al., 2015; Oldham, Rodger, & Nowak, 2016).
In agreement with previous studies, there was a very high prevalence of D. lepeophtherii and Ca. B. cysticola infection in Southern and Western Norway, and infection was established after sea transfer and persisted amongst all fish groups (Gunnarsson et al., 2017; S. Nylund et al., 2011; Steinum et al., 2015; Steinum et al., 2010; Sveen, Overland, Karlsbakk, & Nylund, 2012). As reported by Sveen et al. (2012) we also found that D. lepeophtherii infection and peak D. lepeophtherii load occurred more rapidly after sea transfer for autumn‐transferred fish compared to spring‐transferred fish. This difference is likely related to the higher sea temperatures in autumn compared to spring. However, we did not observe a seasonal and temperature‐dependent variation in pathogen load once fish groups were infected with these two pathogens. Rather in some fish groups, the highest levels of Ca. B. cysticola were found during the coldest periods of the year. The highest pathogen load of D. lepeophtherii was found during the first autumn at sea relatively early after fish groups became infected, but no consistent increase was seen in the subsequent autumn. This could suggest that the parasite may infect or proliferate at higher levels in recently sea‐transferred naïve fish. SGPV infection at sea appeared to have a seasonal distribution with most infected fish detected in late summer and fall. The detection of SGPV infection after sea transfer in previously negative fish groups is consistent with previous findings that the virus spreads horizontally and suggests that SGPV infection also occurs in sea water (Gjessing et al., 2017; Wiik‐Nielsen et al., 2017). The disappearance and reappearance of the virus throughout the sea phase suggest that fish groups may clear the virus and become re‐infected multiple times over a production cycle. This contrasts with the lack of reinfection reported by Gjessing et al. (2018) and indicates that previous infection does not protect against reinfection of the same fish group. Alternatively, the virus may persist in the population at a very low prevalence and may proliferate and spread when conditions are more favourable.
4.3. The impact of the site on gill infections, gill pathology and gill‐related mortality
The patterns of gill infections, gill pathology and gill‐related mortality within each farm site were markedly more similar than between sites indicating that factors relating to the site are important for these outcomes. This finding is perhaps not surprising as local environmental conditions and infection pressure likely have a considerable impact on gill health and gill infections. Fish groups at the same farm experience a similar environment and are generally exposed to the same type and number of management operations like net cleaning and delousing treatments. These fish also originate from the same stock and hatchery and had experienced similar environmental conditions and exposure to infectious agents before sea transfer. Further, staff performing gross gill scoring and cause‐specific mortality classification may also contribute to differences between sites because the local staff at each farm performed these tasks.
4.4. Lacking impact of plankton levels on gill health
In the current study, there was no discernible impact of zoo‐ and phytoplankton on any of the gill outcomes or the total mortality. However, mostly low concentrations of plankton and jellyfish were detected, and Pseudo‐nitzschia spp. and other diatoms were the dominating type of phytoplankton observed. Pseudo‐nitzschia species can produce toxins (Amnesic Shellfish Toxins (AST), domoic acid (DA)) that can accumulate in the marine food chain and in mussels. The toxins can cause serious disease in humans consuming shellfish but are not reported to be associated with fish mortality or disease in Norwegian waters (Karlson et al., 2021). Whilst brief and transient phytoplankton and zooplankton blooms might have been missed because of our sampling regime, the lack of association between plankton levels and gill pathology and mortality in the current study is likely related to the lack of a substantial plankton bloom at any of the sites during the study period.
4.5. Gill‐related mortality and gill gross score as indicators of gill health
Gill‐related mortality, gross gill scores and extent of tissue damage detected by histopathology were used as indictors of gill health status in this study. We found overall weak correlations between gross scores and the extent of microscopic gill lesions, and low correlations and little covariation between pathogen load and prevalence and gross scores. Our results contrast with several studies reporting good agreement between gross scores and histopathological scores, and gross scores and pathogen load in fish with moderate to severe AGD and N. perurans infections (Adams et al., 2004; Bridle, Crosbie, Cadoret, & Nowak, 2010; Clark & Nowak, 1999). However, Krol et al. (2020) examined the gill arch with the most gross lesions and found no difference in gill histopathology or gene expression in fish receiving different proliferative gill disease (PGD) gross scores, and questioned the usefulness of the PGD gross scoring system for diagnosis and monitoring of gill disease. Mild, focal lesions and diffuse inflammation or hyperplasia can be difficult or impossible to detect grossly (Clark & Nowak, 1999). Thus, the lack of severe gill pathology and high pathogen load in most of the sampled fish likely contributed to poorer correlation between gross and histopathological assessments in the current study (Adams et al., 2004; Clark & Nowak, 1999; Collins et al., 2017). The area of the gill examined by gross scorers and the histopathologist overlapped but differed which is likely to further reduce agreement (Adams et al., 2004; Taylor, Wynne, Kube, & Elliott, 2007). Lastly, the inclusion of multiple gross scorers with variable experience and the variation of scorers over time, across and within sites, in addition to the use of a scoring system that was new to the scorers, likely introduced variation into the gross score observations unrelated to actual variation in gross pathology (Adams et al., 2004). In conclusion, the overall poor correlation between gross and microscopic lesions is likely explained a combination of factors, from gross scorers, scoring system, histology sampling protocol and the inability to detect mild lesion grossly. However, despite moderate to severe microscopic gill lesions and a high load and prevalence of N. perurans at site G, a concurrent increase in gross score was not recorded for all left arches overall or for the second left gill arch sampled for histology. This observation indicates that cases of moderate to severe gill pathology and AGD may go undetected if gills are only assessed by gross examination.
Cause‐specific mortality was assigned as gill‐related based on gross examination of dead fish by site staff and/or fish health personnel, information from diagnostic reports and knowledge about environmental and managerial events at the site. Due to the assignment of a single cause and lack of gross examination of each dead fish, there is a risk of underestimating the contribution of infectious diseases to the mortality observed at a site. From human studies of verbal autopsies, it has been shown that it is easier to correctly classify mortality caused by acute, severe trauma, than infectious or cardiovascular disease (Lozano et al., 2011). Commonly, all mortalities occurring after a handling or treatment event at a site are recorded as treatment‐related mortality irrespective of other diseases present in the population or gross findings suggestive of concurrent infectious disease. This may lead to further overestimation of observable management events as causes of mortality and an underestimation of the contribution of infectious and non‐infectious disease to the observed mortality. Individual fish dying of diseases in which gross lesions are not readily apparent or non‐specific are also more likely to be incorrectly classified. However, despite the weaknesses, cause‐specific mortality classification has the advantage of being fast, cheap, can be performed on‐site and by site staff and consider data from concurrent laboratory analysis. The resulting data provide an estimate of the drivers of mortality at the population level and can be used for future statistical analysis. But these data were not intended or suited for studies of the interactions between pathogens or interactions between infectious, managerial and environmental factors causing gill disease. Further, the gill‐related mortality data should be considered a very conservative estimate of (severe) gill disease in a population.
4.6. Limitations of the study
In addition to the limitations related to the standardized sampling and histopathological assessment discussed previously, there are some limitations of this study related to the fact that this was a field study performed at sites in commercial production. During the study period at sea several fish groups were split or mixed with other fish groups. Mixing leads to a dilution of the study fish group with fish from one or more other pens that may have another disease history. In contrast, the splitting of a fish group is not problematic if groups were randomly split, but unfortunately, whether specific criteria were applied during the splitting of one or more of our fish groups was unknown. The inability to follow the same cohorts throughout the production cycle could have impacted results for the sampling points following the mixing and splitting events and lead to an uncertainty in the estimate of the prevalence and extent of gill lesions and gill infections within a fish group over time. The information obtained from subsets of sampled fish were presumed to be representative of their respective fish groups. To ensure representative samples, randomized sampling is ideal yet impossible to achieve when performing field sampling at commercial sea farms. The use of food to lure fish towards the surface during sampling may have led to the collection of fish with better health than the general population because diseased fish can become anorexic and lethargic. To have a greater chance of detecting gill disease within the population, up to 15 fish with clinical signs of disease should have been sampled if available. Unfortunately, for a considerable proportion of the samples, fish health status was not recorded and it is unknown if these fish displayed clinical signs of disease. Nonetheless, it is possible that the sampling method led to an underestimation of the degree of gill pathology and gill infections in the fish groups.
CONFLICT OF INTEREST
The authors have no conflicts of interest to declare.
Supporting information
Fig S1
File S1
File S2
Tables S1 and S2
ACKNOWLEDGEMENTS
The authors would like to thank the Fish Vet Group Norge histology and PCR teams for processing the histology and PCR samples, Åkerblå AS for sampling and Mowi staff and fish health personnel for help and support during sampling. This work was funded by the Norwegian Seafood Research Fund (grant/project number 901515), Mowi ASA, Fish Vet Group Norge AS and Pharmaq Analytiq AS.
Østevik, L. , Stormoen, M. , Hellberg, H. , Kraugerud, M. , Manji, F. , Lie, K‐I , Nødtvedt, A. , Rodger, H. , & Alarcón, M. (2022). A cohort study of gill infections, gill pathology and gill‐related mortality in sea‐farmed Atlantic salmon (Salmo salar L.): A descriptive analysis. Journal of Fish Diseases, 45, 1301–1321. 10.1111/jfd.13662
DATA AVAILABILITY STATEMENT
Research data are not available.
REFERENCES
- Adams, M. B. , Ellard, K. , & Nowak, B. F. (2004). Gross pathology and its relationship with histopathology of amoebic gill disease (AGD) in farmed Atlantic salmon, Salmo salar L. Journal of Fish Diseases, 27(3), 151–161. 10.1111/j.1365-2761.2004.00526.x [DOI] [PubMed] [Google Scholar]
- Amundsen, M. M. , Tartor, H. , Andersen, K. , Sveinsson, K. , Thoen, E. , Gjessing, M. C. , & Dahle, M. K. (2021). Mucosal and systemic immune responses to salmon gill poxvirus infection in Atlantic salmon is modulated upon hydrocortisone injection. Frontiers in Immunology, 12. 10.3389/fimmu.2021.689302 [DOI] [PMC free article] [PubMed] [Google Scholar]
- Båmstedt, U. , Fosså, J. H. , Martinussen, M. B. , & Fosshagen, A. (2012). Mass occurrence of the physonect siphonophore Apolemia uvaria (Lesueur) in Norwegian waters. Sarsia, 83(1), 79–85. 10.1080/00364827.1998.10413673 [DOI] [Google Scholar]
- Baxter, E. J. , Rodger, H. D. , McAllen, R. , & Doyle, T. K. (2011). Gill disorders in marine‐farmed salmon: investigating the role of hydrozoan jellyfish. Aquaculture Environment Interactions, 1(3), 245–257. 10.3354/aei00024 [DOI] [Google Scholar]
- Baxter, E. J. , Sturt, M. M. , Ruane, N. M. , Doyle, T. K. , McAllen, R. , Harman, L. , & Rodger, H. D. (2011). Gill damage to Atlantic salmon (Salmo salar) caused by the common jellyfish (Aurelia aurita) under experimental challenge. PLoS One, 6(4), e18529. 10.1371/journal.pone.0018529 [DOI] [PMC free article] [PubMed] [Google Scholar]
- Bloecher, N. , Powell, M. , Hytterød, S. , Gjessing, M. , Wiik‐Nielsen, J. , Mohammad, S. N. , Johansen, J. , Hansen, H. , Floerl, O. , & Gjevre, A. G. (2018). Effects of cnidarian biofouling on salmon gill health and development of amoebic gill disease. PLoS 1, 13(7), e0199842. 10.1371/journal.pone.0199842 [DOI] [PMC free article] [PubMed] [Google Scholar]
- Boerlage, A. S. , Ashby, A. , Herrero, A. , Reeves, A. , Gunn, G. J. , & Rodger, H. D. (2020). Epidemiology of marine gill diseases in Atlantic salmon (Salmo salar) aquaculture: a review. Reviews in Aquaculture, 12(4), 2140–2159. 10.1111/raq.12426 [DOI] [Google Scholar]
- Bridle, A. R. , Crosbie, P. B. B. , Cadoret, K. , & Nowak, B. F. (2010). Rapid detection and quantification of Neoparamoeba perurans in the marine environment. Aquaculture (Amsterdam, Netherlands), 309(1–4), 56–61. 10.1016/j.aquaculture.2010.09.018 [DOI] [Google Scholar]
- Caruana, E. J. , Roman, M. , Hernández‐Sánchez, J. , & Solli, P. (2015). Longitudinal studies. Journal of Thoracic Disease, 7(11), E537‐E540. Retrieved from https://jtd.amegroups.com/article/view/5822 [DOI] [PMC free article] [PubMed] [Google Scholar]
- Clark, A. , & Nowak, B. F. (1999). Field investigations of amoebic gill disease in Atlantic salmon, Salmo salar L., in Tasmania. Journal of Fish Diseases, 22(6), 433–443. 10.1046/j.1365-2761.1999.00175.x [DOI] [Google Scholar]
- Clinton, M. , Ferrier, D. E. K. , Martin, S. A. M. , & Brierley, A. S. (2021). Impacts of jellyfish on marine cage aquaculture: an overview of existing knowledge and the challenges to finfish health. ICES Journal of Marine Science, 78(5), 1557–1573. 10.1093/icesjms/fsaa254 [DOI] [Google Scholar]
- Collins, C. , Hall, M. , Bruno, D. , Sokolowska, J. , Duncan, L. , Yuecel, R. , McCarthy, U. , Fordyce, M. J. , Pert, C. C. , McIntosh, R. , & MacKay, Z. (2017). Generation of Paramoeba perurans clonal cultures using flow cytometry and confirmation of virulence. Journal of Fish Diseases, 40(3), 351–365. 10.1111/jfd.12517 [DOI] [PubMed] [Google Scholar]
- Crosbie, P. B. , Bridle, A. R. , Cadoret, K. , & Nowak, B. F. (2012). In vitro cultured Neoparamoeba perurans causes amoebic gill disease in Atlantic salmon and fulfils Koch's postulates. International Journal for Parasitology, 42(5), 511–515. 10.1016/j.ijpara.2012.04.002 [DOI] [PubMed] [Google Scholar]
- Downes, J. K. , Yatabe, T. , Marcos‐Lopez, M. , Rodger, H. D. , MacCarthy, E. , O'Connor, I. , Collins, E. , & Ruane, N. M. (2018). Investigation of co‐infections with pathogens associated with gill disease in Atlantic salmon during an amoebic gill disease outbreak. Journal of Fish Diseases, 41(8), 1217–1227. 10.1111/jfd.12814 [DOI] [PubMed] [Google Scholar]
- Fringuelli, E. , Gordon, A. W. , Rodger, H. , Welsh, M. D. , & Graham, D. A. (2012). Detection of Neoparamoeba perurans by duplex quantitative Taqman real‐time PCR in formalin‐fixed, paraffin‐embedded Atlantic salmonid gill tissues. Journal of Fish Diseases, 35(10), 711–724. 10.1111/j.1365-2761.2012.01395.x [DOI] [PubMed] [Google Scholar]
- Gjessing, M. C. , Christensen, D. H. , Manji, F. , Mohammad, S. , Petersen, P. E. , Saure, B. , Skjengen, C. , Weli, S. C. , & Dale, O. B. (2018). Salmon gill poxvirus disease in Atlantic salmon fry as recognized by improved immunohistochemistry also demonstrates infected cells in non‐respiratory epithelial cells. Journal of Fish Diseases, 41(7), 1103–1110. 10.1111/jfd.12802 [DOI] [PubMed] [Google Scholar]
- Gjessing, M. C. , Spilsberg, B. , Steinum, T. M. , Amundsen, M. , Austbø, L. , Hansen, H. , & Olsen, A. B. (2021). Multi‐agent in situ hybridization confirms Ca. Branchiomonas cysticola as a major contributor in complex gill disease in Atlantic salmon. Fish and Shellfish Immunology Reports, 2, 100026. 10.1016/j.fsirep.2021.100026 [DOI] [PMC free article] [PubMed] [Google Scholar]
- Gjessing, M. C. , Steinum, T. , Olsen, A. B. , Lie, K. I. , Tavornpanich, S. , Colquhoun, D. J. , & Gjevre, A. G. (2019). Histopathological investigation of complex gill disease in sea farmed Atlantic salmon. PLoS One, 14(10), e0222926. 10.1371/journal.pone.0222926 [DOI] [PMC free article] [PubMed] [Google Scholar]
- Gjessing, M. C. , Thoen, E. , Tengs, T. , Skotheim, S. A. , & Dale, O. B. (2017). Salmon gill poxvirus, a recently characterized infectious agent of multifactorial gill disease in freshwater‐ and seawater‐reared Atlantic salmon. Journal of Fish Diseases, 40(10), 1253–1265. 10.1111/jfd.12608 [DOI] [PubMed] [Google Scholar]
- Gjessing, M. C. , Yutin, N. , Tengs, T. , Senkevich, T. , Koonin, E. , Rønning, H. P. , Alarcon, M. , Ylving, S. , Lie, K. I. , Saure, B. , Tran, L. , Moss, B. , & Dale, O. B. (2015). Salmon gill poxvirus, the deepest representative of the Chordopoxvirinae . Journal of Virology, 89(18), 9348–9367. 10.1128/JVI.01174-15 [DOI] [PMC free article] [PubMed] [Google Scholar]
- Gulla, S. , Nilsen, H. , Olsen, A. B. , & Colquhoun, D. J. (2020). Fiskepatogene Pasteurella i Norge. Norsk Fiskeoppdrett, 11, 46–47. [Google Scholar]
- Gunnarsson, G. S. , Karlsbakk, E. , Blindheim, S. , Plarre, H. , Imsland, A. K. , Handeland, S. , Sveier, H. , & Nylund, A. (2017). Temporal changes in infections with some pathogens associated with gill disease in farmed Atlantic salmon (Salmo salar L.). Aquaculture, 468, 126–134. 10.1016/j.aquaculture.2016.10.011 [DOI] [Google Scholar]
- Halsband, C. , Majaneva, S. , Hosia, A. , Emaus, P. , Gaardsted, F. , Zhou, Q. , Nost, O. A. , & Renaud, P. (2018). Jellyfish summer distribution, diversity and impact on fish farms in a Nordic fjord. Marine Ecology Progress Series, 591, 267–279. 10.3354/meps12274 [DOI] [Google Scholar]
- Hamadi, M. N. (2011). Desmozoon lepeophtherii as a pathogen in Norwegian salmon aquaculture (Master of Science in Aquamedicine). University of Bergen. Retrieved from http://hdl.handle.net/1956/5594 [Google Scholar]
- Herrero, A. , Thompson, K. D. , Ashby, A. , Rodger, H. D. , & Dagleish, M. P. (2018). Complex Gill Disease: an Emerging Syndrome in Farmed Atlantic Salmon (Salmo salar L.). Journal of Comparative Pathology, 163, 23–28. 10.1016/j.jcpa.2018.07.004 [DOI] [PubMed] [Google Scholar]
- Herrero‐Fernández, A. (2019). The role of Desmozoon lepeophtherii in complex gill disorder of Atlantic salmon (Salmo salar). (Doctor of Philosophy Thesis or Dissertation). University of Stirling. Retrieved from http://hdl.handle.net/1893/31807 [Google Scholar]
- Karlson, B. , Andersen, P. , Arneborg, L. , Cembella, A. , Eikrem, W. , John, U. , West, J. J. , Klemm, K. , Kobos, J. , Lehtinen, S. , Lundholm, N. , Mazur‐Marzec, H. , Naustvoll, L. , Poelman, M. , Provoost, P. , De Rijcke, M. , & Suikkanen, S. (2021). Harmful algal blooms and their effects in coastal seas of Northern Europe. Harmful Algae, 102, 101989. 10.1016/j.hal.2021.101989 [DOI] [PubMed] [Google Scholar]
- Krol, E. , Noguera, P. , Shaw, S. , Costelloe, E. , Gajardo, K. , Valdenegro, V. , Bickerdike, R. , Douglas, A. , & Martin, S. A. M. (2020). Integration of transcriptome, gross morphology and histopathology in the gill of sea farmed Atlantic salmon (Salmo salar): Lessons from multi‐site sampling. Frontiers in Genetics, 11, 610. 10.3389/fgene.2020.00610 [DOI] [PMC free article] [PubMed] [Google Scholar]
- Legård, B. K. , & Strøm, S. B. (2020). Pasteurellosis in Atlantic salmon (Salmo salar) in Western Norway. Bulletin of European Association of Fish Pathologists, 40(4), 148–155. Retrieved from https://eafp.org/download/2020‐volume40/issue_4/40‐4‐148‐legard.pdf [Google Scholar]
- Lozano, R. , Lopez, A. D. , Atkinson, C. , Naghavi, M. , Flaxman, A. D. , & Murray, C. J. L. (2011). Performance of physician‐certified verbal autopsies: multisite validation study using clinical diagnostic gold standards. Population Health Metrics, 9(1), 32. 10.1186/1478-7954-9-32 [DOI] [PMC free article] [PubMed] [Google Scholar]
- Marcos‐Lopez, M. , Mitchell, S. O. , & Rodger, H. D. (2016). Pathology and mortality associated with the mauve stinger jellyfish Pelagia noctiluca in farmed Atlantic salmon Salmo salar L. Journal of Fish Diseases, 39(1), 111–115. 10.1111/jfd.12267 [DOI] [PubMed] [Google Scholar]
- Matthews, C. G. , Richards, R. H. , Shinn, A. P. , & Cox, D. I. (2013). Gill pathology in Scottish farmed Atlantic salmon, Salmo salar L., associated with the microsporidian Desmozoon lepeophtherii Freeman et Sommerville, 2009. Journal of Fish Diseases, 36(10), 861–869. 10.1111/jfd.12084 [DOI] [PubMed] [Google Scholar]
- Mitchell, S. O. , Baxter, E. J. , & Rodger, H. D. (2011). Gill pathology in farmed salmon associated with the jellyfish Aurelia aurita . Veterinary Record, 169(23), 609. 10.1136/vr.100045 [DOI] [PubMed] [Google Scholar]
- Mitchell, S. O. , & Rodger, H. D. (2011). A review of infectious gill disease in marine salmonid fish. Journal of Fish Diseases, 34(6), 411–432. 10.1111/j.1365-2761.2011.01251.x [DOI] [PubMed] [Google Scholar]
- Mitchell, S. O. , Steinum, T. M. , Toenshoff, E. R. , Kvellestad, A. , Falk, K. , Horn, M. , & Colquhoun, D. J. (2013). 'Candidatus Branchiomonas cysticola' is a common agent of epitheliocysts in seawater‐farmed Atlantic salmon Salmo salar in Norway and Ireland. Diseases of Aquatic Organisms, 103(1), 35–43. 10.3354/dao02563 [DOI] [PubMed] [Google Scholar]
- Mo, T. A. , Hytterod, S. , Olsen, A. B. , & Hansen, H. (2015). Utvikling av amøbegjellesykdom (AGD) hos laks i tre oppdrettsanlegg i 2013‐2014 (Veterinstituttets rapportserie 9/2015) Retrieved from: https://www.vetinst.no/rapporter‐og‐publikasjoner/rapporter/2015/utvikling‐av‐amobegjellesykdom‐agd‐hos‐laks‐i‐tre‐oppdrettsanlegg‐i‐2013‐2014
- Munday, B. L. (1986). Diseases of salmonids. Paper presented at the Workshop on Diseases of Australian Fish and Shellfish, Benalla, Australia .
- Noguera, P. , Olsen, A. B. , Hoare, J. , Lie, K. I. , Marcos‐Lopez, M. , Poppe, T. , & Rodger, H. (2019). Complex gill disorder (CGD): A histopathology workshop report. Bulletin of the European Association of Fish Pathologists, 39(4), 172–176. Retrieved from https://eafp.org/download/2019‐volume39/issue_4/39‐4‐172‐noguera.pdf [Google Scholar]
- Nylund, S. , Andersen, L. , Saevareid, I. , Plarre, H. , Watanabe, K. , Arnesen, C. E. , Karlsbakk, E. , & Nylund, A. (2011). Diseases of farmed Atlantic salmon Salmo salar associated with infections by the microsporidian Paranucleospora theridion . Diseases of Aquatic Organisms, 94(1), 41–57. 10.3354/dao02313 [DOI] [PubMed] [Google Scholar]
- Nylund, S. , Nylund, A. , Watanabe, K. , Arnesen, C. E. , & Karlsbakk, E. (2010). Paranucleospora theridion n. gen., n. sp. (Microsporidia, Enterocytozoonidae) with a Life Cycle in the Salmon Louse (Lepeophtheirus salmonis, Copepoda) and Atlantic Salmon (Salmo salar). Journal of Eukaryotic Microbiology, 57(2), 95–114. 10.1111/j.1550-7408.2009.00451.x [DOI] [PubMed] [Google Scholar]
- Nylund, A. , Watanabe, K. , Nylund, S. , Karlsen, M. , Sæther, P. A. , Arnesen, C. E. , & Karlsbakk, E. (2008). Morphogenesis of salmonid gill poxvirus associated with proliferative gill disease in farmed Atlantic salmon (Salmo salar) in Norway. Archives of Virology, 153(7), 1299–1309. 10.1007/s00705-008-0117-7 [DOI] [PubMed] [Google Scholar]
- Oldham, T. , Rodger, H. , & Nowak, B. F. (2016). Incidence and distribution of amoebic gill disease (AGD) — An epidemiological review. Aquaculture (Amsterdam, Netherlands), 457, 35–42. 10.1016/j.aquaculture.2016.02.013 [DOI] [Google Scholar]
- Østevik, L. , Stormoen, M. , Evensen, Ø. , Xu, C. , Lie, K. I. , Nødtvedt, A. , Rodgerd, H. , Skagøye, A. , Manji, F. , & Alarcon, M. (2022). Effects of thermal and mechanical delousing on gill health of farmed Atlantic salmon (Salmo salar L.). Aquaculture (Amsterdam, Netherlands), 552, 738019. 10.1016/j.aquaculture.2022.738019 [DOI] [Google Scholar]
- Østevik, L. , Stormoen, M. , Nødtvedt, A. , Alarcón, M. , Lie, K. I. , Skagøy, A. , & Rodger, H. (2021). Assessment of acute effects of in situ net cleaning on gill health of farmed Atlantic salmon (Salmo salar L.). Aquaculture (Amsterdam, Netherlands), 545, 737203. 10.1016/j.aquaculture.2021.737203 [DOI] [Google Scholar]
- Powell, M. D. , Atland, A. , & Dale, T. (2018). Acute lion's mane jellyfish, Cyanea capillata (Cnideria: Scyphozoa), exposure to Atlantic salmon (Salmo salar L.). Journal of Fish Diseases, 41(5), 751–759. 10.1111/jfd.12771 [DOI] [PubMed] [Google Scholar]
- Rodger, H. D. , Henry, L. , & Mitchell, S. O. (2011). Non‐infectious gill disorders of marine salmonid fish. Reviews in Fish Biology and Fisheries, 21(3), 423–440. 10.1007/s11160-010-9182-6 [DOI] [Google Scholar]
- Salte, R. , Nafstad, P. , & Asgård, T. (1987). Disseminated intravascular coagulation in "Hitra disease" (hemorrhagic syndrome) in farmed Atlantic salmon. Veterinary Pathology, 24(5), 378–385. 10.1177/030098588702400503 [DOI] [PubMed] [Google Scholar]
- Shinn, A. P. , Pratoomyot, J. , Bron, J. E. , Paladini, G. , Brooker, E. E. , & Brooker, A. J. (2015). Economic costs of protistan and metazoan parasites to global mariculture. Parasitology, 142(1), 196–270. 10.1017/S0031182014001437 [DOI] [PubMed] [Google Scholar]
- Smage, S. B. , Brevik, O. J. , Frisch, K. , Watanabe, K. , Duesund, H. , & Nylund, A. (2017). Concurrent jellyfish blooms and tenacibaculosis outbreaks in Northern Norwegian Atlantic salmon (Salmo salar) farms. PLoS One, 12(11), e0187476. 10.1371/journal.pone.0187476 [DOI] [PMC free article] [PubMed] [Google Scholar]
- Sommerset, I. , Bang Jensen, B. , Bornø, G. , Haukaas, A. , & Brun, E. (2021). Fiskehelserapporten 2020 (Veterinærinstituttets rapportserie 41a/2021). Retrieved from: https://www.vetinst.no/rapporter‐og‐publikasjoner/rapporter/2021/fiskehelserapporten‐2020
- Steinum, T. , Brun, E. , Colquhoun, D. J. , Gjessing, M. C. , Lie, K. I. , Olsen, A. B. , Tavornpanich Saraya, Gjevre, A. G. (2015). Proliferativ gjellebetennelse hos oppdrettslaks i sjøvann ‐ patologi, utvalgte agens og risikofaktorer (Veterinærinstituttets rapportserie 8/2015). Retrieved: https://www.vetinst.no/rapporter‐og‐publikasjoner/rapporter/2015/proliferativ‐gjellebetennelse‐hos‐oppdrettslaks‐i‐sjvann‐patologi‐utvalgte‐agens‐og‐risikofaktorer
- Steinum, T. , Kvellestad, A. , Colquhoun, D. J. , Heum, M. , Mohammad, S. , Grøntvedt, R. N. , & Falk, K. (2010). Microbial and pathological findings in farmed Atlantic salmon Salmo salar with proliferative gill inflammation. Diseases of Aquatic Organisms, 91(3), 201–211. 10.3354/dao02266 [DOI] [PubMed] [Google Scholar]
- Sveen, S. , Overland, H. , Karlsbakk, E. , & Nylund, A. (2012). Paranucleospora theridion (Microsporidia) infection dynamics in farmed Atlantic salmon Salmo salar put to sea in spring and autumn. Diseases of Aquatic Organisms, 101(1), 43–49. 10.3354/dao02464 [DOI] [PubMed] [Google Scholar]
- Taylor, R. S. , Wynne, J. W. , Kube, P. D. , & Elliott, N. G. (2007). Genetic variation of resistance to amoebic gill disease in Atlantic salmon (Salmo salar) assessed in a challenge system. Aquaculture, 272, S94–S99. 10.1016/j.aquaculture.2007.08.007 [DOI] [Google Scholar]
- Thoen, E. , Tartor, H. , Amundsen, M. , Dale, O. B. , Sveinsson, K. , Ronning, H. P. , Grønneberg, E. , Dahle, M. K. , & Gjessing, M. C. (2020). First record of experimentally induced salmon gill poxvirus disease (SGPVD) in Atlantic salmon (Salmo salar L.). Veterinary Research, 51(1), 63. 10.1186/s13567-020-00787-9 [DOI] [PMC free article] [PubMed] [Google Scholar]
- Toenshoff, E. R. , Kvellestad, A. , Mitchell, S. O. , Steinum, T. , Falk, K. , Colquhoun, D. J. , & Horn, M. (2012). A novel betaproteobacterial agent of gill epitheliocystis in seawater farmed Atlantic salmon (Salmo salar). PLoS One, 7(3), e32696. 10.1371/journal.pone.0032696 [DOI] [PMC free article] [PubMed] [Google Scholar]
- Weli, S. C. , Dale, O. B. , Hansen, H. , Gjessing, M. C. , Rønneberg, L. B. , & Falk, K. (2017). A case study of Desmozoon lepeophtherii infection in farmed Atlantic salmon associated with gill disease, peritonitis, intestinal infection, stunted growth, and increased mortality. Parasites & Vectors, 10(1), 370. 10.1186/s13071-017-2303-5 [DOI] [PMC free article] [PubMed] [Google Scholar]
- Wiik‐Nielsen, J. , Gjessing, M. , Solheim, H. T. , Litlabo, A. , Gjevre, A. G. , Kristoffersen, A. B. , Powell, M. D. , & Colquhoun, D. J. (2017). Ca. Branchiomonas cysticola, Ca. Piscichlamydia salmonis and Salmon Gill Pox Virus transmit horizontally in Atlantic salmon held in fresh water. Journal of Fish Diseases, 40(10), 1387–1394. 10.1111/jfd.12613 [DOI] [PubMed] [Google Scholar]
- Wiik‐Nielsen, J. , Solheim, H. T. , Steinum, T. M. , Bornø, G. , Skjelstad, H. R. , Olsen, A. B. , & Colquhoun, D. J. (2015). A novel epitheliocystis assosiated bacterium in Atlantic salmon ‐ Laser microdissection facilitates identification. Paper presented at the 17th European Association of Fish Pathologists (EAFP) Conference, Las Palmas . Retrieved from: https://www.researchgate.net/publication/291337188_A_novel_epitheliocystis_assosiated_bacterium_in_Atlantic_salmon
- Young, N. D. , Crosbie, P. B. , Adams, M. B. , Nowak, B. F. , & Morrison, R. N. (2007). Neoparamoeba perurans n. sp., an agent of amoebic gill disease of Atlantic salmon (Salmo salar). International Journal for Parasitology, 37(13), 1469–1481. 10.1016/j.ijpara.2007.04.018 [DOI] [PubMed] [Google Scholar]
Associated Data
This section collects any data citations, data availability statements, or supplementary materials included in this article.
Supplementary Materials
Fig S1
File S1
File S2
Tables S1 and S2
Data Availability Statement
Research data are not available.