

Abstract
Background and Aim
Rates of antimicrobial‐resistant Helicobacter pylori infection are rising globally; however, geospatial location and its interaction with risk factors for infection have not been closely examined.
Methods
Gastric biopsy specimens were collected to detect H. pylori infection at multiple centers in Adelaide, South Australia, between 1998 and 2017. The geospatial distribution of antibiotic‐resistant H. pylori in the Greater Adelaide region was plotted using choropleth maps. Moran's I was used to assess geospatial correlation, and multivariate linear regression (MLR) was used to examine associations between migration status, socioeconomic status, age, gender, and rates of H. pylori positivity and antibiotic resistance. Geographically weighted regression (GWR) was used to determine the extent to which the associations varied according to geospatial location.
Results
Of 20 108 biopsies across 136 postcodes within the Greater Adelaide region, 1901 (9.45%) were H. pylori positive. Of these, 797 (41.9%) displayed clarithromycin, tetracycline, metronidazole, or amoxicillin resistance. In MLR, migration status was associated with the rate of H. pylori positivity (β = 3.85% per 10% increase in a postcode's migrant population; P < 0.001). H. pylori positivity and resistance to any antibiotic were geospatially clustered (Moran's I = 0.571 and 0.280, respectively; P < 0.001 for both). In GWR, there was significant geospatial variation in the strength of the migrant association for both H. pylori positivity and antibiotic resistance.
Conclusion
Our study demonstrates the heterogeneous geospatial distribution of H. pylori positivity and antibiotic resistance, as well as its interaction with migrant status. Geographic location and migrant status are important factors to consider for H. pylori eradication therapy.
Keywords: antibiotics, antimicrobial, antimicrobial resistance, geospatial, Helicobacter pylori , resistance
Introduction
Geospatial technology has helped to target disease prevention programs through characterization of disease distribution and etiology. 1 Helicobacter pylori infection has been estimated to be responsible for up to 90% of cases of gastric cancer globally, and H. pylori eradication has been shown to reduce the incidence of gastric cancer at a population level. 2 , 3 , 4 , 5 The prevalence of antimicrobial‐resistant H. pylori has been increasing globally and represents a significant public health threat. 6 Eradication rates have been declining in many countries due to antimicrobial resistance, culminating in the World Health Organization listing clarithromycin‐resistant H. pylori as a high priority for antibiotic research and development. 7
Helicobacter pylori antibiotic resistance varies between geographic regions, has increased over time in most areas of the world, and is inversely associated with eradication rates. 8 , 9 , 10 , 11 In Australia, between 15% and 30% of the population have H. pylori infection. 12 , 13 Varying ranges of antibiotic resistance and increasing rates of clarithromycin resistance have also been reported in Australia. 14 , 15 Known risk factors for the development of resistant strains include prior antibiotic exposure, national antibiotic consumption, and smoking. 16 , 17 , 18 Other proposed mechanisms of increasing resistance in Australia include migration from countries with a high prevalence of H. pylori infection and resistance, as well as low grade antibiotic exposure through intake of food products from antibiotic‐treated animals. 19 The use of macrolides for the treatment of conditions such as pneumonia and sexually transmitted infections since the 1990s is also likely to have played a role. 20 Fluoroquinolone resistance has been largely attributed to increased community exposure, with rising rates described overseas. 16 , 21 Metronidazole resistance is also rising due to its widespread use and is more common in developing countries, where it is used for parasitic diseases and gynecological infections, and women have been shown to have higher rates of resistance than men. 22 , 23
Geospatial analyses are underutilized for studying antimicrobial resistance and have not previously been applied to H. pylori . Globally, geospatial analyses have been useful for understanding the distribution of infection in antimicrobial‐resistant Staphylococcus aureus , 24 Streptococcus pneumoniae , 25 and Escherichia coli . 26 Given the large variation in H. pylori resistance rates, a better understanding of the geospatial distribution of both infection and resistance, and its influence on risk factors for resistance, is needed to guide eradication therapy. Most of the data on resistance rates have been derived from large geographical regions, often comprising entire countries, whereas more granularity is needed to determine the extent of local variation and thereby inform local therapy. No established regional or national H. pylori resistance monitoring systems exists within Australia, supporting a need for better characterization of the distribution of disease and antibiotic resistance.
The present study combined clinical and geospatial data to assess both the rates and spatial distribution of H. pylori infection and antibiotic resistance using the largest Australia database of isolate susceptibility data collected between 1998 and 2018. It was hypothesized that an understanding of the geospatial distribution of infection, resistance and risk factor associations, may assist clinicians with risk stratification for H. pylori infection, particularly in those at increased risk of harboring resistant strains, and assist in guiding eradication therapy.
Methods
Gastric biopsy specimens collected from five centers in South Australia underwent histopathology testing for H. pylori infection. The Greater Adelaide region of South Australia comprises a multicultural population of approximately 1.4 million people, with a varied range of ethnicities and significant number of migrants from areas including Europe and Asia. All specimens taken between November 1998 and December 2018 were analyzed. Isolates positive for H. pylori were cultured and tested for susceptibility to amoxicillin, clarithromycin, tetracycline, and metronidazole. All samples were collected as part of routine clinical practice, and therefore, informed consent to be included in this study was not obtained. Analysis of the data was conducted following approval by the Central Adelaide Human Research Ethics Committee (reference number: 12902).
Data collection
Demographic data including age, gender, year of presentation, and postcode were obtained from patient records. The patient postcode was linked to information on the percentage of each postcode's population that was born within Australia and overseas, and the Socioeconomic Index For Areas (SEIFA) index, using the 2016 national census data. 23
Geospatial data
The spatial area of interest was defined by the Greater Adelaide Planning Region of South Australia, which contains 185 different postcodes (Fig. 1). A shapefile containing the polygons of all Australian postcodes was obtained from the Australian Bureau of Statistics, 27 and the Greater Adelaide Planning Region shapefile polygon was obtained from the South Australian Government Data Dictionary. 28 Patients from postcodes outside of the Greater Adelaide Planning Region were excluded from the analysis.
Figure 1.
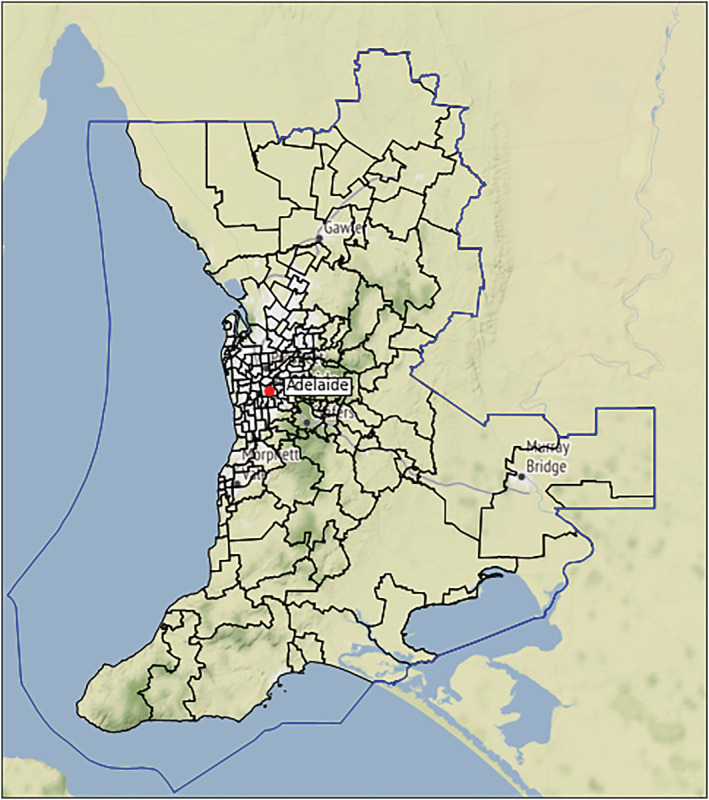
The boundary and 185 postcodes of the Greater Adelaide Planning Region. [Color figure can be viewed at wileyonlinelibrary.com]
Helicobacter pylori culture and antibiotic susceptibility test
Gastric biopsies were cultured at 37°C on brain heart infusion plates (Difco Laboratories Pty Ltd) containing 7% horse blood under microaerobic conditions (5% O2; 10% CO2; 85% N2) for 3–7 days. If there was no visible microbial growth at 3 days, specimens were cultured for a further 3–4 days due to slower growth rates for some strains. Positive H. pylori isolates were tested for susceptibility to amoxicillin, clarithromycin, metronidazole, and tetracycline using ETest strips (AB Biodisk, Sweden), from which minimum inhibitory concentrations were determined. European Committee on Antimicrobial Susceptibility Testing guidelines breakpoints were used for clarithromycin, amoxicillin, tetracycline, and metronidazole of > 0.5, > 0.125, > 1, and > 8 mg/L, respectively. 29
Statistical analysis
Spatial distribution and rates of H. pylori infection were assessed, as well as antibiotic resistance of H. pylori to clarithromycin, metronidazole, amoxicillin, and tetracycline. Postcode‐level data for migration status (percentage of the population born overseas) and the SEIFA were retrieved for each postcode from the 2016 Australian national census data. 30
Multivariate linear regression was performed with postcode data to examine the predictors of H. pylori positivity and rates of antibiotic resistance. Models included the mean age, gender, migration status (percentage born overseas in each postcode), the SEIFA, and the period (1998–2007 vs 2008–2018) of the testing. We plotted the overall rates of H. pylori positivity and antibiotic resistance over time and examined whether there was evidence of a linear trend using Poisson or negative binomial regression as appropriate. The degree of spatial clustering of H. pylori isolates and antibiotic resistance was assessed using Moran's I, 31 and H. pylori infection rates and antibiotic resistance rates for each postcode were plotted with choropleth maps. Hot spots were defined as postcodes with rates above the 90th percentile and P < 0.001 for local Moran's I. Cold spots were defined as postcodes with rates below the 10th percentile and P < 0.001 for local Moran's I.
In addition to the multivariate linear regression, we also performed geographically weighted regression (GWR) to determine the extent to which geospatial location contributed to variability in H. pylori infection and antibiotic resistance and to determine the spatial variation in the strength of the regression coefficients. The optimal spatial weights for the calculation of Moran's I and the GWR were determined using the k‐nearest neighbors' method with varying bandwidths. 32 The proportion of explained variance for infection and resistance rates was described using the R 2 statistic from the GWR. A two‐sided type 1 error rate of α = 0.05 was used for all hypothesis tests. Descriptive statistics and linear regression were performed using Stata version 16.0 (StataCorp, Texas, USA). Geospatial analysis was performed using Python (version 3.8.5) and the Python geospatial packages geopandas (v 0.8.1), pysal (v 2.1.0), libpysal (v 4.4.0), esda (v 2.1.1), contextily (v 1.1.0), and mgwr (v 2.1.2).
Results
Patient demographics
The study population consisted of 20 108 subjects across 136 of the 185 Greater Adelaide Planning Region postcodes (Table 1). Amongst all subjects, 9050 (45.0%) were male and the mean (SD) age was 57.5 (17.8) years. A total of n = 1901 (9.5%) biopsies tested were H. pylori positive (Fig. A1). Of these, 797 (41.9%) displayed resistance to clarithromycin (19%), tetracycline (1.8%), metronidazole (31%), or amoxicillin (3.3%), with 222 of these isolates (28%) demonstrating resistance to two or more antibiotics. Across the 136 postcodes, the minimum number of subjects included per postcode was 10, and the median (interquartile range) was 75 (28–192.5). There were several differences in the demographics between subjects with biopsies that were H. pylori positive, compared with those that were H. pylori negative, including age, gender, number of subjects tested within each postcode, migration status, SEIFA, and period of testing (Table 1).
Table 1.
Demographic characteristics and antibiotic resistance of subjects by Helicobacter pylori status
| All subjects (n = 20 108) | H. pylori negative (n = 18 207) | H. pylori positive (n = 1901) | P‐value † | |
|---|---|---|---|---|
| Age, mean (SD) | 57.5 (17.8) | 57.5 (17.9) | 56.7 (16.7) | 0.046 |
| Gender | ||||
| Male, n (%) | 9050 (45.01) | 8145 (44.7) | 905 (47.6) | 0.017 |
| Female, n (%) | 11 058 (55.0) | 10 062 (55.3) | 996 (52.4) | |
| N per postcode, median (IQR) | 75 (28–192.5) | 75 (28–192) | 91 (43–211) | < 0.001 |
| Overseas born, median (IQR) | 28.95 (23.6–34.4) | 30.8 (25.9–36.3) | 34.2 (28.9–39.3) | < 0.001 |
| SEIFA, median (IQR) | 972 (929–1016) | 975 (929–1019) | 944 (895–1000) | < 0.001 |
| Period, n (%) | < 0.001 | |||
| 1998–2007 | 7069 (35.2) | 5929 (32.6) | 1140 (60.0) | |
| 2008–2018 | 13 039 (64.8) | 12 278 (67.4) | 761 (40.0) | |
| Any antibiotic resistance, n (%) | 797 (3.96) | 0 (0.00) | 797 (41.9) | < 0.001 |
| Specific resistance | ||||
| Amoxicillin, n (%) | 63 (0.31) | 0 (0.00) | 63 (3.31) | < 0.001 |
| Clarithromycin, n (%) | 364 (1.81) | 0 (0.00) | 364 (19.2) | < 0.001 |
| Metronidazole, n (%) | 592 (2.94) | 0 (0.00) | 592 (31.1) | < 0.001 |
| Tetracycline, n (%) | 34 (0.17) | 0 (0.00) | 34 (1.79) | < 0.001 |
P‐value from χ 2, Mann–Whitney, or t‐test as appropriate.
IQR, interquartile range; SEIFA, Socioeconomic Index For Areas.
Predictors of Helicobacter pylori positivity and antibiotic resistance
An absolute increase in the rate of H. pylori positivity was associated with higher migrant density (β = 3.85% per 10% increase in the postcode's migrant population; P < 0.001) and with decade of analysis, but not with the SEIFA index, mean age for the postcode, or proportion of males in the postcode. There were also positive associations between migrant status and resistance to any antibiotic, and resistance to metronidazole, amoxicillin, and clarithromycin (Table 2). There was an overall 10.9% linear decline in the rate of H. pylori positivity per year (incidence rate ratio = 0.89, 95% confidence interval = 0.87, 0.92; P < 0.001) (Fig. A2). However, amongst subjects who tested positive for H. pylori , there was an overall 2.2% increase per year in the rate of antibiotic resistance, with all antibiotics tested increasing over the study period. Specifically, the rate of amoxicillin resistance increased by 9.0% per year, clarithromycin by 5.7% per year, metronidazole by 1.6% per year, and tetracycline by 13.7% per year (Fig. 2).
Table 2.
Multivariate linear regression results for the percentage of subjects with Helicobacter pylori positivity, any antibiotic resistance, and specific antibiotic resistance
| β (95% CI) | P‐value † | |
|---|---|---|
| H. pylori | ||
| Age (10 years) | −0.58 (−2.99, 1.33) | 0.604 |
| Gender (male vs female) | −5.70 (−13.00, 1.59) | 0.125 |
| Migrant status (per 10% of the postcode population born overseas) | 3.85 (2.27, 5.44) | < 0.001 |
| SEIFA (per 100‐unit increase) | 1.50 (−0.35, 3.35) | 0.111 |
| Period (2008–2018 vs 1998–2007) | −10.09 (−12.64, −7.53) | < 0.001 |
| Any antibiotic resistance | ||
| Age (10 years) | −0.48 (−1.74, 0.77) | 0.448 |
| Gender (male vs female) | 3.50 (−1.31, 8.31) | 0.153 |
| Migrant status (per 10% of the postcode population born overseas) | 1.77 (0.72, 2.81) | 0.001 |
| SEIFA (per 100‐unit increase) | 0.57 (−0.64, 1.79) | 0.353 |
| Period (2008–2018 vs 1998–2007) | −4.06 (−5.74, −2.38) | < 0.001 |
| Clarithromycin | ||
| Age (10 years) | −0.27 (−1.01, 0.48) | 0.479 |
| Gender (male vs female) | 1.25 (−1.60, 4.10) | 0.390 |
| Migrant status (per 10% of the postcode population born overseas) | 1.13 (0.51, 1.75) | < 0.001 |
| SEIFA (per 100‐unit increase) | 0.06 (−0.67, 4.10) | 0.879 |
| Period (2008–2018 vs 1998–2007) | −1.46 (−2.46, −0.46) | 0.004 |
| Amoxicillin | ||
| Age (10 years) | −0.01 (−0.12, 0.10) | 0.146 |
| Gender (male vs female) | −0.08 (−0.51, 0.33) | 0.721 |
| Migrant status (per 10% of the postcode population born overseas) | 0.14 (0.04, 0.23) | 0.004 |
| SEIFA (per 100‐unit increase) | −0.05 (−0.16, 0.06) | 0.383 |
| Period (2008–2018 vs 1998–2007) | 0.19 (0.04, 0.34) | 0.015 |
| Metronidazole | ||
| Age (10 years) | −0.13 (−1.11, 0.85) | 0.796 |
| Gender (male vs female) | 2.78 (−0.97, 6.52) | 0.145 |
| Migrant status (per 10% of the postcode population born overseas) | 1.05 (0.24, 1.86) | 0.012 |
| SEIFA (per 100‐unit increase) | 0.52 (−0.43, 1.47) | 0.280 |
| Period (2008–2018 vs 1998–2007) | −2.92 (−4.23, −1.61) | < 0.001 |
| Tetracycline | ||
| Age (10 years) | −0.01 (−0.20, 0.19) | 0.949 |
| Gender (male vs female) | 0.04 (−0.70, 0.78) | 0.914 |
| Migrant status (per 10% of the postcode population born overseas) | 0.15 (−0.01, 0.31) | 0.068 |
| SEIFA (per 100‐unit increase) | 0.14 (−0.04, 0.33) | 0.131 |
| Period (2008–2018 vs 1998–2007) | −0.05 (−0.31, 0.21) | 0.708 |
From multivariate linear regression Wald statistic.
CI, confidence interval; SEIFA, Socioeconomic Index For Areas.
N = 271 postcode‐level observations (n = 135 in 1998–2007 and n = 136 in 2008–2018).
Figure 2.
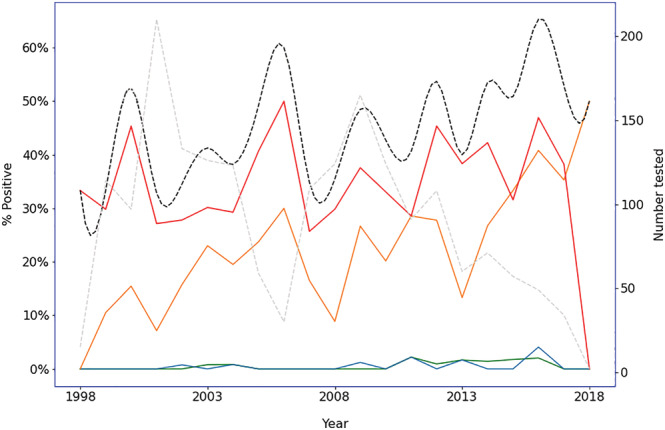
Change in rates of antibiotic resistance amongst those positive for Helicobacter pylori by year. •••, Amoxicillin; •••, tetracycline; •••, clarithromycin; •••, metronidazole; •••, overall. •••, N tested. [Color figure can be viewed at wileyonlinelibrary.com]
Geospatial distributions
The distribution of resistance to H. pylori and rates of overall antibiotic resistance within the Greater Adelaide Planning Region postcodes showed strong evidence of clustering (Fig. A3). The pattern of resistance rates with antibiotics showed a similar trend (Fig. 3). Moran's I showed a positive spatial auto‐correlation, indicating significant geospatial clustering for rates of H. pylori (I = 0.573, P < 0.001), overall antibiotic resistance (I = 0.280, P < 0.001), and resistance to clarithromycin (I = 0.157, P < 0.001) and metronidazole (I = 0.182, P < 0.001), but not amoxicillin (I = 0.022, P = 0.382) or tetracycline (I = −0.028, P = 0.298). The pattern of both rates of H. pylori positivity and antibiotic resistance across the postcodes each closely matched the respective migrant status (Fig. 4).
Figure 3.
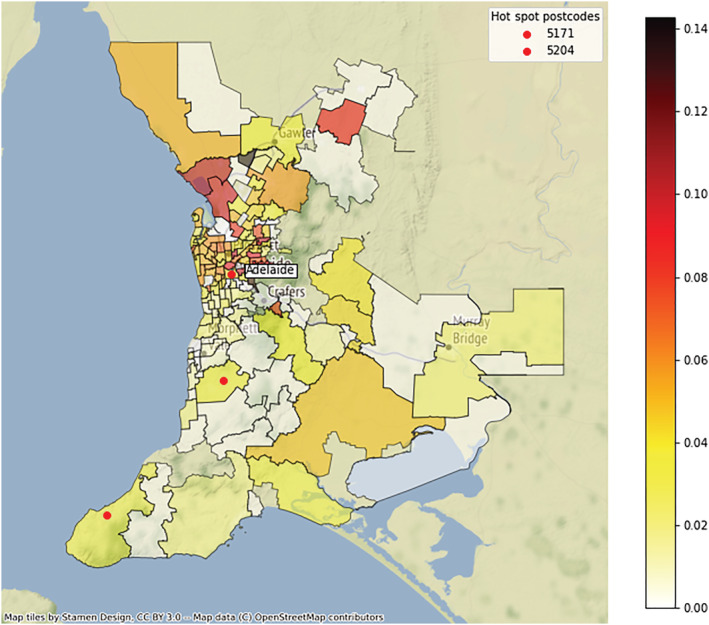
Choropleth map of antibiotic resistance rates amongst those subjects positive for Helicobacter pylori by Greater Adelaide Planning Region postcode 1998–2018. [Color figure can be viewed at wileyonlinelibrary.com]
Figure 4.
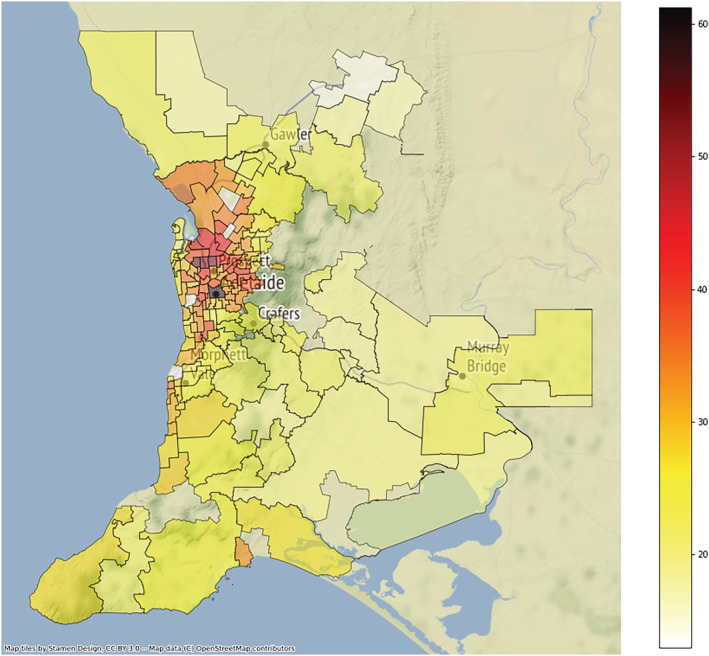
Choropleth map of migrant rates by postcode in the Greater Adelaide Planning Region for 1998–2018. [Color figure can be viewed at wileyonlinelibrary.com]
Geographically weighted regression
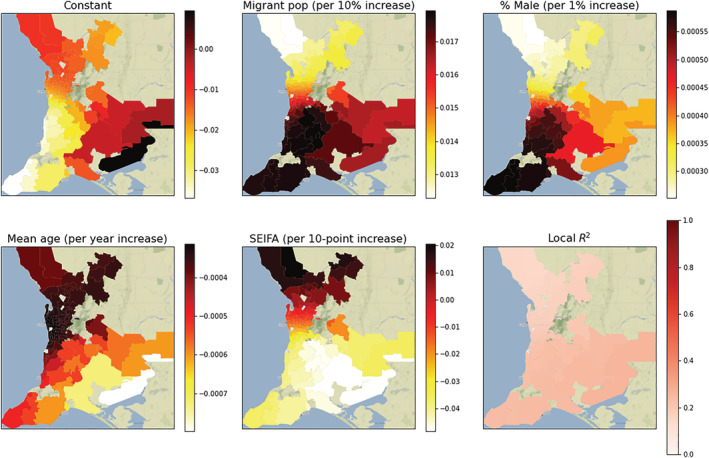
In GWR, which included the independent variables mean postcode age, gender, SEIFA, and migrant status, the global regression R 2 statistic was 0.225, while the ensemble R 2 for the local model was 0.371. The difference in these R 2 values demonstrated that 14.6% of the variation in H. pylori positivity was due to a spatial component; that is, there was substantial variation in the individual postcode regression coefficients (Fig. A4). Specifically, the regression coefficients for migrant status ranged from 0.0265 to 0.0415, indicating that a 10% increase in migrant density was associated with an absolute increase in H. pylori positivity of between 2.65% and 4.15% depending on the postcode.
Local regression coefficients from the GWR for antibiotic resistance and migrant status ranged from 1.22% to 1.79% (Fig. A5) indicating an absolute 1.22–1.79% increase in antibiotic resistance rates for persons positive to H. pylori per 10% increase in the migrant density. Similar to H. pylori positivity, all 136 local coefficients for antibiotic resistance were significant for migrant status, while none were significant for gender, age, or SEIFA. Based on the R 2 statistics, each local model explained between 14.8% and 26.9% of the variation in antibiotic resistance rates for that postcode.
Discussion
This is the first population‐based study that provides evidence for a heterogeneous distribution of H. pylori resistance within a city. The data also reveal an association between the migrant density of a suburb and the rate of resistant H. pylori isolates. These findings illustrate that a patient's geospatial location may be a useful surrogate marker for risk of H. pylori resistance, which may help to guide clinicians in appropriate empirical H. pylori eradication therapy.
This study illustrates the role of risk factor stratification for H. pylori resistance to include geospatial location alongside previously established risk factors. Prior studies have demonstrated that migrants have higher rates of H. pylori infection as a consequence of emigrating from regions of higher antibiotic resistance than the general Australian population. 33 , 34 Clustering of resistant H. pylori strains is likely to relate to both migration status and local transmission of H. pylori amongst close contacts within the suburb. Recognition of a patient's individual migrant status as well as a geospatial region associated with higher migrant density should alert a clinician to a higher risk of harboring a resistant H. pylori strain. Prompt consideration should then be given to additional culture and sensitivity analyses, as well as consideration of alternative (even second‐line) empirical eradication therapy.
Rates of primary H. pylori resistance to clarithromycin in Australia have historically been thought to be low (between 6% and 8%) based on data collected during the 1990s. 35 , 36 , 37 However, recent studies have demonstrated increasing resistance in Australia and New Zealand, with particular evidence of increasing clarithromycin resistance since the year 2000. 14 , 15 Yet, there has been little recognition of rising rates of H. pylori resistance, and risk factors for resistance, in current Australian guidelines. Factors driving these emerging trends include widespread community antibiotic use, and population changes due to migration from countries with a high prevalence of H. pylori resistance. 37 The proportion of Australians born overseas has been increasing over time (1/3 of Australians in the 2016 census), and the number of immigrants has been rising from countries, particularly in Asia, where clarithromycin resistance rates are known to be above 30%. 23 , 38 This study is the first to demonstrate that patients originating from postcodes that are associated with higher migrant density are more likely to harbor antibiotic‐resistant strains.
Risk factor stratification should be advocated in the individualized management of H. pylori , which should be modified not only according to risk of antibiotic resistance but also according to risk of developing complications of H. pylori infection, including known gastric metaplasia or a family history of gastric cancer. Migrant populations are frequently burdened by both the risk of resistance and complications of H. pylori infection.
Individualizing eradication therapy, particularly in nations where health care resources are in short supply and rates of treatment failure are increasing, has potential for economic cost savings. Effective empiric eradication therapy will reduce the probability of treatment failure and need for repeated courses of antibiotic therapy. While there is a proven benefit for H. pylori eradication at a population level for reducing the incidence of gastric cancer, the benefits may be greater in specific subpopulations, such as those with atrophic or non‐atrophic gastritis. 4 , 5 For low‐risk patients without a family history or other risk factors for gastric cancer, the benefits of eradication are not established. Further identification and characterization of specific strains, and environmental and bacterial genetic factors, would help to identify determinants of poor clinical outcomes. Both genetic factors and virulence factors with a high gastric cancer risk may be associated with the host and the H. pylori strain, and these would help to stratify subgroups of patients into those more or less likely to benefit from eradication therapy.
The reason for variable long‐term clinical outcomes in patients infected with H. pylori , such as development of gastric cancer or duodenal ulceration, remains unclear. However, genetics modulating the immune response towards the infection, bacterial genetics and age at acquisition of H. pylori infection, in addition to environmental factors such as smoking and high intake of salt have been shown to play a role. 39 Testing for H. pylori as a gastric cancer pre‐screening strategy has been described in Japan, and the importance of H. pylori eradication as a cancer prevention strategy is emphasized in Japanese guidelines. 40 Increased virulence and malignant potential of H. pylori strains have been linked to mutations in vacuolating cytotoxin (vacA) and the Cag pathogenicity island (cagPAI). 41 , 42 Geospatial analyses have previously been used to link virulence factors of H. pylori , such as cagA, such that a relationship has been observed between areas with high rates of cagA and those with a strong prevalence of diffuse gastric cancer. 43 Additionally, prior studies have demonstrated that sociodemographic variables may result in high‐risk patients being overlooked for H. pylori testing. 44 An understanding of patients at risk of H. pylori infection and resistance may help to reduce this bias.
Major strengths of this study include the multicenter approach, the large number of H. pylori isolates, and the prolonged period of data capture, allowing comparisons both over time and across metropolitan areas. A limitation of this study was the lack of information on the migration status of individual patients as well as detailed clinical information including historic antibiotic exposure. However, if the migrant‐to‐resistance association is valid, our data are likely, if anything, to have underestimated the true strength of this relationship. In addition, each patient's geospatial location was based on postcode, which can cover a wide geographical area and may therefore be either a higher or lower indicator of the true rate of infection rate in the patient's location. Again, assuming that a real spatial component exists in the data, the estimated degree of spatial correlation is likely to be an underestimate rather than an overestimate. Data capture was limited to Greater Adelaide, and further studies are recommended to confirm whether the associations we observed are generalizable to other locations. Geospatial analyses across a broader context will confirm whether these relationships are observed nationally and internationally and may assist in risk‐stratifying patients for antibiotic‐resistant isolates.
Conclusions
This study demonstrates a heterogeneous distribution of H. pylori resistance, which is increased particularly in isolates originating from suburbs with a high percentage of migrants. This provides evidence that the current “one‐size‐fits‐all” approaches to antibiotic eradication therapy may not be suited to the general population and that further risk stratification of patients for resistant strains should be considered in routine clinical practice. Further studies of eradication therapy success rates are warranted in regions with high numbers of migrants.
Acknowledgments
We wish to thank SA Pathology staff George Koutsouridis and Casey Moore for their assistance with data collection. Open access publishing facilitated by The University of Adelaide, as part of the Wiley ‐ The University of Adelaide agreement via the Council of Australian University Librarians.
Figure A1.
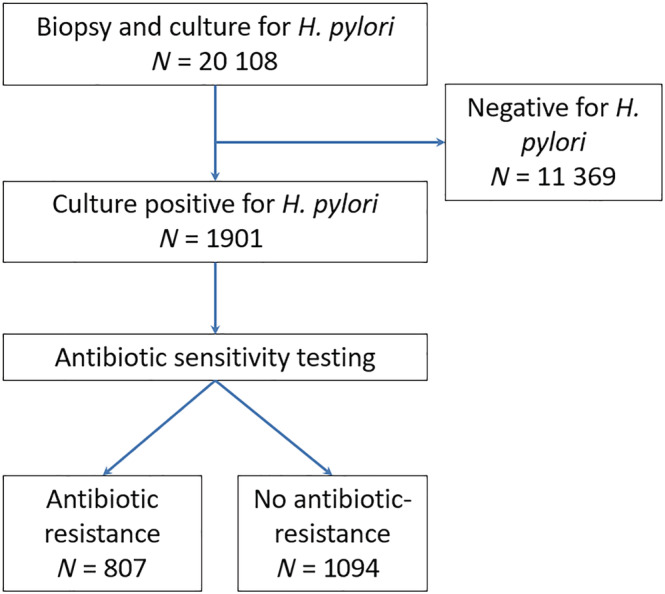
Flow chart of patients undergoing upper gastrointestinal endoscopy. [Color figure can be viewed at wileyonlinelibrary.com]
Figure A2.
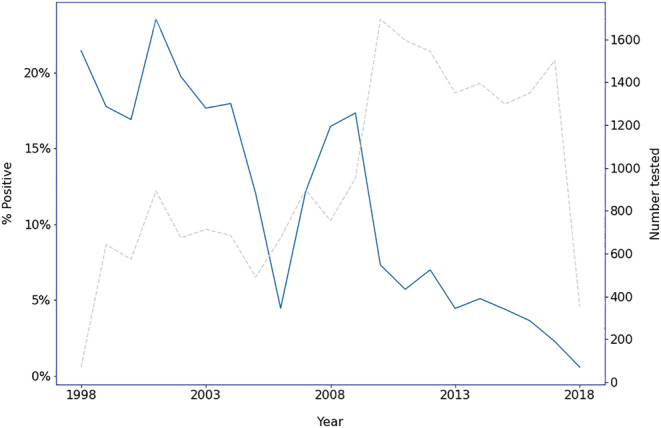
Change in rates of Helicobacter pylori positivity by year. •••, H. pylori positive. •••, N tested. [Color figure can be viewed at wileyonlinelibrary.com]
Figure A3.
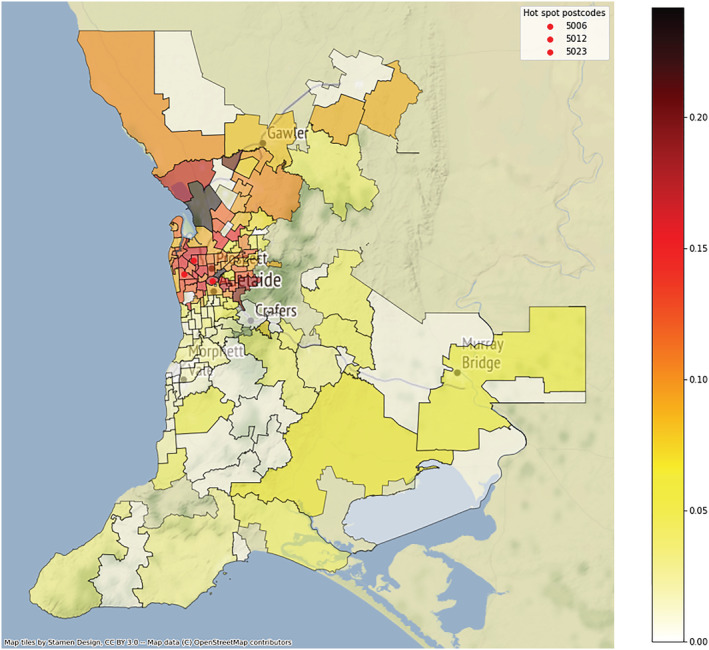
Choropleth map of Helicobacter pylori positivity rates by Greater Adelaide Planning Region postcode, 1998–2018. [Color figure can be viewed at wileyonlinelibrary.com]
Figure A4.
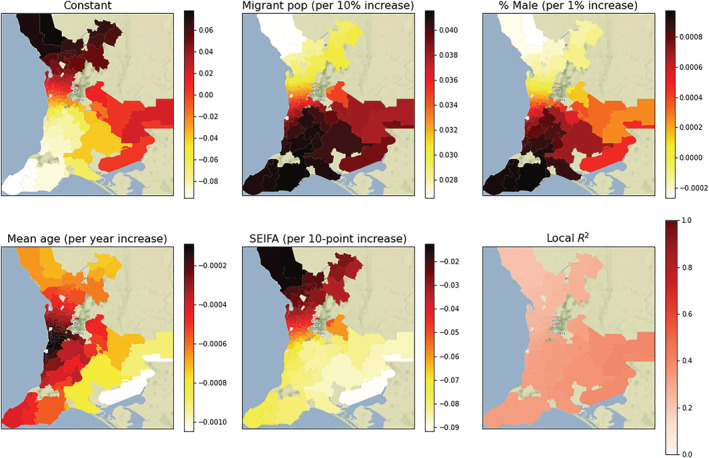
Choropleth map of the postcode‐level coefficients and R 2 from the geographically weighted regression of Helicobacter pylori positivity rates. Each plot represents the regression coefficient between H. pylori and the demographic variable within each postcode. All 136 postcodes showed a significant migrant density‐to‐H. pylori association (P < 0.05), with the strength of the association varying from a 2.65% to 4.15% increase in the absolute rate of H. pylori per 10% increase in the migrant density. The color bar indicates the value of the local coefficient or R 2 statistic. SEIFA, Socioeconomic Index For Areas. [Color figure can be viewed at wileyonlinelibrary.com]
Figure A5.
Choropleth map of the postcode‐level coefficients and R 2 from the geographically weighted regression of rates of antibiotic resistance. Each plot represents the regression coefficient between antibiotic resistance and the demographic variable within each postcode. All 136 postcodes showed a significant migrant density‐to‐Helicobacter pylori association (P < 0.05), with the strength of the association varying from a 1.22% to 1.79% increase in the absolute rate of antibiotic resistance per 10% increase in the migrant density. The color bar indicates the value of the local coefficient or R 2 statistic. SEIFA, Socioeconomic Index For Areas. [Color figure can be viewed at wileyonlinelibrary.com]
Schubert, J. P. , Woodman, R. J. , Mangoni, A. A. , Rayner, C. K. , Warner, M. S. , Roberts‐Thomson, I. C. , Costello, S. P. , and Bryant, R. V. (2022) Geospatial analysis of Helicobacter pylori infection in South Australia: Should location influence eradication therapy?. Journal of Gastroenterology and Hepatology, 37: 1263–1274. 10.1111/jgh.15832.
References
- 1. Cromley EK. GIS and disease. Annu. Rev. Public Health 2003; 24: 7–24. [DOI] [PubMed] [Google Scholar]
- 2. González CA, Megraud F, Buissonniere A et al. Helicobacter pylori infection assessed by ELISA and by immunoblot and noncardia gastric cancer risk in a prospective study: the Eurgast‐EPIC project. Ann. Oncol. 2012; 23: 1320–1324. [DOI] [PubMed] [Google Scholar]
- 3. Lee YC, Chiang TH, Chou CK et al. Association between Helicobacter pylori eradication and gastric cancer incidence: a systematic review and meta‐analysis. Gastroenterology 2016; 150: 1113–24.e5. [DOI] [PubMed] [Google Scholar]
- 4. Rokkas T, Rokka A, Portincasa P. A systematic review and meta‐analysis of the role of Helicobacter pylori eradication in preventing gastric cancer. Ann. Gastroenterol. 2017; 30: 414–423. [DOI] [PMC free article] [PubMed] [Google Scholar]
- 5. Ford AC, Yuan Y, Moayyedi P. Helicobacter pylori eradication therapy to prevent gastric cancer: systematic review and meta‐analysis. Gut 2020; 69: 2113–2121. [DOI] [PubMed] [Google Scholar]
- 6. Goh KL, Chan WK, Shiota S, Yamaoka Y. Epidemiology of Helicobacter pylori infection and public health implications. Helicobacter 2011; 16: 1–9. [DOI] [PMC free article] [PubMed] [Google Scholar]
- 7. World Health Organization . Global Priority List of Antibiotic‐resistance Bacteria to Guide Research, Discovery, and Development of New Antibiotics. 2017. https://www.who.int/medicines/publications/global‐priority‐list‐antibiotic‐resistant‐bacteria/en/. Accessed August 2021 [Google Scholar]
- 8. Meyer JM, Silliman NP, Wang W et al. Risk factors for Helicobacter pylori resistance in the United States: the surveillance of H pylori antimicrobial resistance partnership (SHARP) study, 1993–1999. Ann. Intern. Med. 2002; 136: 13–24. [DOI] [PubMed] [Google Scholar]
- 9. Graham DY. Helicobacter pylori update: gastric cancer, reliable therapy, and possible benefits. Gastroenterology 2015; 148: 719–31.e3. [DOI] [PMC free article] [PubMed] [Google Scholar]
- 10. Graham DY, Shiotani A. New concepts of resistance in the treatment of Helicobacter pylori infections. Nat. Clin. Pract. Gastroenterol. Hepatol. 2008; 5: 321–331. [DOI] [PMC free article] [PubMed] [Google Scholar]
- 11. Gisbert JP, Pajares JM. Helicobacter pylori “rescue” therapy after failure of two eradication treatments. Helicobacter 2005; 10: 363–372. [DOI] [PubMed] [Google Scholar]
- 12. Moujaber T, MacIntyre CR, Backhouse J, Gidding H, Quinn H, Gilbert GL. The seroepidemiology of Helicobacter pylori infection in Australia. Int. J. Infect. Dis. 2008; 12: 500–504. [DOI] [PubMed] [Google Scholar]
- 13. Robertson MS, Cade JF, Savoia HF, Clancy RL. Helicobacter pylori infection in the Australian community: current prevalence and lack of association with ABO blood groups. Intern. Med. J. 2003; 33: 163–167. [DOI] [PubMed] [Google Scholar]
- 14. Schubert JP, Gehlert J, Rayner CK et al. Antibiotic resistance of Helicobacter pylori in Australia and New Zealand: a systematic review and meta‐analysis. J. Gastroenterol. Hepatol. 2020. [DOI] [PubMed] [Google Scholar]
- 15. Schubert JP, Warner S, Rayner CK et al. Increasing Helicobacter pylori clarithromycin resistance in Australia over 20 years. World J. Gastroenterol. (Accepted for publication). 2021. [Google Scholar]
- 16. Megraud F, Coenen S, Versporten A et al. Helicobacter pylori resistance to antibiotics in Europe and its relationship to antibiotic consumption. Gut 2013; 62: 34–42. [DOI] [PubMed] [Google Scholar]
- 17. Perez Aldana L, Kato M, Nakagawa S et al. The relationship between consumption of antimicrobial agents and the prevalence of primary Helicobacter pylori resistance. Helicobacter 2002; 7: 306–309. [DOI] [PubMed] [Google Scholar]
- 18. Mhaskar RS, Ricardo I, Azliyati A et al. Assessment of risk factors of Helicobacter pylori infection and peptic ulcer disease. J. Global Infect. Dis. 2013; 5: 60–67. [DOI] [PMC free article] [PubMed] [Google Scholar]
- 19. Hu Y, Zhang M, Lu B, Dai J. Helicobacter pylori and antibiotic resistance, a continuing and intractable problem. Helicobacter 2016; 21: 349–363. [DOI] [PubMed] [Google Scholar]
- 20. McMullan BJ, Mostaghim M. Prescribing azithromycin. Aust. Prescr. 2015; 38: 87–89. [DOI] [PMC free article] [PubMed] [Google Scholar]
- 21. Kuo YT, Liou JM, El‐Omar EM et al. Primary antibiotic resistance in Helicobacter pylori in the Asia‐Pacific region: a systematic review and meta‐analysis. Lancet Gastroenterol. Hepatol. 2017; 2: 707–715. [DOI] [PubMed] [Google Scholar]
- 22. Glupczynski Y, Mégraud F, Lopez‐Brea M, Andersen LP. European multicentre survey of in vitro antimicrobial resistance in Helicobacter pylori . Eur. J. Clin. Microbiol. Infect. Dis. 2001; 20: 820–823. [DOI] [PubMed] [Google Scholar]
- 23. Mégraud F. H pylori antibiotic resistance: prevalence, importance, and advances in testing. Gut 2004; 53: 1374–1384. [DOI] [PMC free article] [PubMed] [Google Scholar]
- 24. Tirabassi MV, Wadie G, Moriarty KP et al. Geographic information system localization of community‐acquired MRSA soft tissue abscesses. J. Pediatr. Surg. 2005; 40: 962–965 discussion 5–6. [DOI] [PubMed] [Google Scholar]
- 25. Mouro A, Kiffer C, Koga PC, Monteiro AM, Camargo EC, Pignatari AC. Spatial exploration of Streptococcus pneumoniae clonal clustering in São Paulo, Brazil. Braz. J. Infect. Dis. 2011; 15: 462–466. [DOI] [PubMed] [Google Scholar]
- 26. Kiffer CR, Camargo EC, Shimakura SE et al. A spatial approach for the epidemiology of antibiotic use and resistance in community‐based studies: the emergence of urban clusters of Escherichia coli quinolone resistance in Sao Paulo. Brasil. Int. J. Health Geogr. 2011; 10: 17. [DOI] [PMC free article] [PubMed] [Google Scholar]
- 27. Australian Bureau of Statistics . Australian Statistical Geography Standard (ASGS): Vol. 3. 2016. https://www.abs.gov.au/AUSSTATS/abs@.nsf/DetailsPage/1270.0.55.003July%202016?OpenDocument. Accessed August 2021 [Google Scholar]
- 28. Australian Bureau of Statistics . Greater Adelaide Planning Region. 2015. https://plan.sa.gov.au/__data/assets/pdf_file/0005/282974/G16_2015.pdf. Accessed August 2021 [Google Scholar]
- 29. European Committee on Antimicrobial Susceptibility Testing (EUCAST) . http://www.eucast.org/. Accessed August 31, 2021
- 30. Australian Bureau of Statistics . Census of Population and Housing: Socio‐Economic Indexes for Areas (SEIFA), Australia, 2016. https://www.abs.gov.au/ausstats/abs@.nsf/mf/2033.0.55.001. Accessed August 2021 [Google Scholar]
- 31. Moran PA. Notes on continuous stochastic phenomena. Biometrika 1950; 37: 17–23. [PubMed] [Google Scholar]
- 32. Altman NS. An introduction to kernel and nearest‐neighbor nonparametric regression. Am. Stat. 1992; 46: 175–185. [Google Scholar]
- 33. Pandeya N, Whiteman DC. Prevalence and determinants of Helicobacter pylori sero‐positivity in the Australian adult community. J. Gastroenterol. Hepatol. 2011; 26: 1283–1289. [DOI] [PubMed] [Google Scholar]
- 34. Mitchell H, Katelaris P. Epidemiology, clinical impacts and current clinical management of Helicobacter pylori infection. Med. J. Aust. 2016; 204: 376–380. [DOI] [PubMed] [Google Scholar]
- 35. Katelaris PH, Adamthwaite D, Midolo P, Yeomans ND, Davidson G, Lambert J. Randomized trial of omeprazole and metronidazole with amoxycillin or clarithromycin for Helicobacter pylori eradication, in a region of high primary metronidazole resistance: the HERO study. Aliment. Pharmacol. Ther. 2000; 14: 751–758. [DOI] [PubMed] [Google Scholar]
- 36. Katelaris PH, Forbes GM, Talley NJ, Crotty B. A randomized comparison of quadruple and triple therapies for Helicobacter pylori eradication: the QUADRATE study. Gastroenterology 2002; 123: 1763–1769. [DOI] [PubMed] [Google Scholar]
- 37. https://www.tg.org.au TGecdHpiAAU.
- 38. Savoldi A, Carrara E, Graham DY, Conti M, Tacconelli E. Prevalence of antibiotic resistance in Helicobacter pylori: a systematic review and meta‐analysis in World Health Organization regions. Gastroenterology 2018; 155: 1372–82.e17. [DOI] [PMC free article] [PubMed] [Google Scholar]
- 39. Bornschein J, Malfertheiner P. Gastric carcinogenesis. Langenbeck's Arch. Surg. 2011; 396: 729–742. [DOI] [PubMed] [Google Scholar]
- 40. Kato M, Ota H, Okuda M et al. Guidelines for the management of Helicobacter pylori infection in Japan: 2016 Revised Edition. Helicobacter 2019; 24: e12597. [DOI] [PubMed] [Google Scholar]
- 41. Polk DB, Peek RM Jr. Helicobacter pylori: gastric cancer and beyond. Nat. Rev. Cancer 2010; 10: 403–414. [DOI] [PMC free article] [PubMed] [Google Scholar]
- 42. Blaser MJ, Perez‐Perez GI, Kleanthous H et al. Infection with Helicobacter pylori strains possessing cagA is associated with an increased risk of developing adenocarcinoma of the stomach. Cancer Res. 1995; 55: 2111–2115. [PubMed] [Google Scholar]
- 43. Dominguez RL, Cherry CB, Estevez‐Ordonez D et al. Geospatial analyses identify regional hot spots of diffuse gastric cancer in rural Central America. BMC Cancer 2019; 19: 545. [DOI] [PMC free article] [PubMed] [Google Scholar]
- 44. Ma I, Guo M, Pillai DR, Church DL, Naugler C. Is the utilization of Helicobacter pylori stool antigen tests appropriate in an urban Canadian population? Am. J. Clin. Pathol. 2020; 153: 686–694. [DOI] [PMC free article] [PubMed] [Google Scholar]