

Abstract
Adversity‐exposed youth tend to score lower on cognitive tests. However, the hidden talents approach proposes some abilities are enhanced by adversity, especially under ecologically relevant conditions. Two versions of an attention‐shifting and working memory updating task—one abstract, one ecological—were administered to 618 youth (M age = 13.62, SD age = 0.81; 48.22% female; 64.56% White). Measures of environmental unpredictability, violence, and poverty were collected to test adversity × task version interactions. There were no interactions for attention shifting. For working memory updating, youth exposed to violence and poverty scored lower than their peers with abstract stimuli but almost just as well with ecological stimuli. These results are striking compared to contemporary developmental science, which often reports lowered performance among adversity‐exposed youth.
Abbreviations
- OSF
Open Science Framework
Youth living in adverse conditions tend to score lower on cognitive tests than youth in supportive conditions. For example, youth raised in poverty are more likely to have difficulties learning in school and score lower on standardized tests (Farah et al., 2006; Hackman et al., 2010; Noble et al., 2007; Ursache & Noble, 2016). Harsh and unpredictable environments are thought to cause high levels of chronic stress, which can impair brain regions responsible for memory and learning (Blair & Raver, 2012). Thus, the contemporary view is that exposure to adversity undermines cognitive development and leads to a host of cognitive deficits (reviewed in Duncan et al., 2017; Hackman et al., 2010; McLaughlin et al., 2019; Pechtel & Pizzagalli, 2011). Although it is clear that harsh and unpredictable environments are harmful to youth, there is growing interest in the hidden talents approach, which proposes that some abilities may be enhanced by adversity, especially skills and abilities that help youth meet real‐world challenges in adverse environments (Ellis et al., 2017, 2020; Frankenhuis & de Weerth, 2013; Frankenhuis, Young, et al., 2020). These stress‐adapted skills are referred to in this literature as hidden talents.
The hidden talents approach is rooted in an adaptation‐based framework (see Ellis et al., 2017, 2020; Frankenhuis & de Weerth, 2013; Frankenhuis, Young, et al., 2020 for reviews), which assumes development tailors skills and abilities in relation to the environment. Accordingly, exposure to adversity should shape skills and abilities well‐suited for dealing with the challenges and opportunities associated with harsh and unpredictable environments. However, because specific dimensions of adversity (e.g., violence vs. resource‐scarcity) may pose unique challenges (Ellis et al., 2020; Frankenhuis, Young, et al., 2020; McLaughlin et al., 2019; Sheridan & McLaughlin, 2014), the hidden talents approach proposes that cognitive skills should match specific dimensions of adversity (Frankenhuis, Young, et al., 2020). For instance, some evidence suggests that physically abused youth can detect angry facial expressions quickly and accurately (Gibb et al., 2009; Pollak, 2008; Pollak et al., 2009), lower perceived social class or status predicts more accurate social perceptions (Bjornsdottir et al., 2017; Dietze & Knowles, 2021; Piff et al., 2018), and that anxiously attached people can more accurately detect deception (Ein‐Dor & Perry, 2014; Shoda & McConnell, 2013).
Although some abilities themselves are more ecologically relevant to specific dimensions of adversity, hidden talents may also emerge under ecologically relevant conditions. For example, previous studies of hidden talents have tested cognition under ecologically relevant contexts and situations. In particular, studies have experimentally manipulated the current context to be uncertain and mildly stressful (or not) and measured performance on executive functioning and working memory tasks (Mittal et al., 2015; Young et al., 2018). Strikingly, people from unpredictable environments showed more efficient switching on attention‐shifting tasks and more accurate responses on working memory updating tasks, but this effect only emerged under conditions of uncertainty. There was no performance increase under control conditions. However, some studies have found similar patterns without uncertainty (Fields et al., 2021; Nweze et al., 2021).
Hidden talents may also emerge when testing content and stimuli are more ecologically relevant and concrete. Typical cognitive tests use abstract content that is largely detached from the real world. Such abstract materials may disadvantage youth whose childhood experiences involve less abstract, analytical problem solving (Ellis et al., 2020; Frankenhuis & de Weerth, 2013). Cultural psychologists and anthropologists have demonstrated this fact across the world. For example, people from non‐Western cultures tend to score lower than people in Western cultures on standard versions of cognitive tests, but this performance gap closes or disappears when more ecologically relevant measures are used (Banerjee et al., 2017; Grigorenko et al., 2004; Rogoff et al., 2017; Sternberg et al., 2001). This work challenges the assumption that “baseline” performance is best captured by standard, abstract tests. In fact, they suggest that abstract stimuli, and more broadly standard testing conditions, are specific contexts that may not match one's lived experience (Doebel, 2020; Miller‐Cotto et al., 2021; Nketia et al., 2021; Zuilkowski et al., 2016). These ideas also raise an important question: do adversity‐exposed youth score higher on tests with ecologically relevant stimuli relative to those with abstract stimuli?
One way to test this question is to replace sterile testing materials with ecologically relevant content from the real world. For example, one study tested memory and reasoning among young adults who varied in their exposures to violence (Frankenhuis, de Vries, et al., 2020). They created two versions of a memory and reasoning task, one neutral (chronological age) and one more ecologically relevant (social dominance). They found that people with more current exposures to violence were equally, or more, accurate when memorizing social‐dominance relationships than people with fewer exposures. Notably, such violence exposures were associated with less accurate memory for neutral (age) relationships. This pattern was specific to current exposures: people with more childhood exposures to violence memorized both content types less accurately. There were no associations between violence exposures and reasoning performance. Overall, this study suggests that ecologically relevant testing materials may, in some conditions, “level the playing field” for adversity‐exposed youth (Ellis et al., 2020; Frankenhuis, Young, et al., 2020; Rifkin‐Graboi et al., 2021; VanTassel‐Baska, 2018).
Although research testing performance in ecologically relevant contexts or situations and using ecologically relevant materials have generated innovative ideas and findings, it remains unclear whether or how they can be practically applied. For example, narrow abilities, such as memorizing social dominance hierarchies or accurately detecting anger in faces, seem to have limited practical value in educational contexts. In addition, although executive functions and working memory are related to many educational outcomes, it remains unclear how schools and teachers might leverage skills and abilities that specifically depend on inducing uncertainty. That seems impractical, at best, and unethical, at worst.
Here, we address this issue by evaluating the role of ecologically relevant content in attention‐shifting and working memory tasks. We define ecologically relevant content as testing material that resembles the local environment and therefore has more meaning and consequence. We used two criteria for stimulus selection. First, we selected stimuli that youth would encounter and interact with on a daily basis. Second, we selected stimuli believed to be more consequential or salient to adversity‐exposed youth. For example, money is more consequential to poverty‐exposed youth and an angry face more salient to violence‐exposed youth than neutral objects (a book, dishes, etc.). Although some stimuli are likely to be more relevant to one adversity dimension than another, different adversity exposures tend to co‐occur (Jacobs et al., 2012; Smith & Pollak, 2021). Thus, we selected stimuli that are broadly relevant in the context of correlated adversity exposures.
We target both within‐subject and between‐subject patterns of improvement. That is, improvements in performance relative to oneself (within‐subjects—one's performance on abstract compared to ecological task versions), relative to others (between‐subjects—high vs. low adversity), or a combination, are theoretically and practically important. In the current study, we expected all youth would score higher on tasks with ecological stimuli. However, we expected this increase to be larger among youth living in adverse conditions compared to youth in supportive conditions.
To address our research questions, we sampled 618 youth from a socioeconomically diverse population to ensure sufficient variation in adversity‐exposure. Using interviews, self‐reports, and school records, we measured exposure to environmental unpredictability, violence, and poverty. We used these information sources to arrive at a “best estimate” for each construct. Our a priori assumption was that each information source (e.g., interview, self‐report, school‐provided information) would correlate within constructs, which was largely true (see Table 1).
TABLE 1.
Bivariate correlations and descriptive statistics for adversity measures
| Unpredictability | Violence | Poverty | ||||||||
|---|---|---|---|---|---|---|---|---|---|---|
| 1 | 2 | 3 | 4 | 5 | 6 | 7 | 8 | 9 | 10 | |
| 1. Perceived | — | 601 | 601 | 601 | 601 | 601 | 601 | 599 | 558 | 601 |
| 2. Interview | .50** | — | 618 | 601 | 601 | 601 | 601 | 616 | 574 | 618 |
| 3. Composite | .87** | .87** | — | 601 | 601 | 601 | 601 | 616 | 574 | 618 |
| 4. Neighborhood | .40** | .20** | .35** | — | 601 | 601 | 601 | 599 | 558 | 601 |
| 5. Fighting | .25** | .10* | .20** | .60** | — | 601 | 601 | 599 | 558 | 601 |
| 6. Composite | .36** | .17** | .31** | .89** | .89** | — | 601 | 599 | 558 | 601 |
| 7. Perceived | .45** | .28** | .42** | .44** | .34** | .44** | — | 599 | 558 | 601 |
| 8. Interview | .13** | .15** | .16** | .18** | .12** | .17** | .23** | — | 573 | 616 |
| 9. School | .18** | .24** | .24** | .15** | .12** | .15** | .28** | .36** | — | 574 |
| 10. Composite | .37** | .29** | .37** | .38** | .28** | .37** | .75** | .77** | .62** | — |
| Min | 1.00 | −0.79 | −1.16 | 1.00 | 1.00 | −1.09 | 1.00 | −2.06 | −0.50 | −1.47 |
| Median | 1.83 | −0.39 | −0.16 | 1.71 | 2.00 | −0.25 | 2.00 | 0.05 | −0.50 | −0.06 |
| Max | 4.67 | 2.69 | 3.34 | 4.57 | 8.00 | 3.64 | 4.67 | 1.96 | 0.50 | 2.08 |
| Range | 3.67 | 3.48 | 4.50 | 3.57 | 7.00 | 4.73 | 3.67 | 4.03 | 1.00 | 3.54 |
| M | 1.99 | −0.00 | 0.01 | 1.94 | 2.31 | −0.00 | 2.20 | 0.01 | −0.05 | −0.01 |
| SD | 0.73 | 0.83 | 0.87 | 0.75 | 1.43 | 0.89 | 0.67 | 0.87 | 0.50 | 0.62 |
Column headers denote adversity constructs and rows indicate components. The upper triangle contains sample sizes for each correlation.
p < .05.
p < .01.
We then tested performance on two widely used tasks: attention‐shifting and working memory updating. There were two versions of each task. The first used standard abstract stimuli and the second replaced these stimuli with more ecological stimuli from the real‐world (see Figure 1). We then tested the interactive effect of task content and adversity exposure. As such, our primary analyses involved two preregistered confirmatory analyses and one exploratory analysis. Our confirmatory analyses focused on environmental unpredictability and violence exposure. Both dimensions have been associated with improved performance under ecologically relevant conditions (contexts and testing materials) and represent specific environmental challenges. Our exploratory analyses focused on exposure to poverty. Poverty is both relevant to hidden talents (e.g., hidden talents could develop in response to specific challenges of poverty) and a general proxy for adversity rather than a specific exposure.
FIGURE 1.
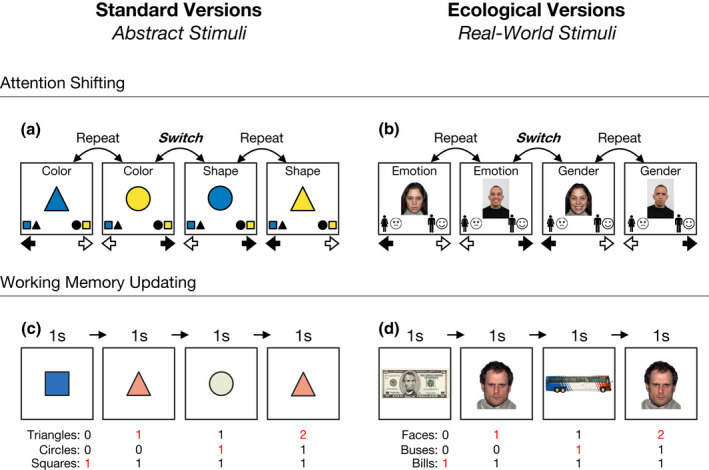
Schematic display of the attention shifting and working memory updating tasks: (a) abstract attention shifting, (b) ecological attention shifting, (c) abstract working memory updating, and (d) ecological working memory updating
We also evaluated the relative robustness of our models to arbitrary data processing decisions using a multiverse analysis approach (Simonsohn et al., 2020; Steegen et al., 2016). Specifically, we systematically and explicitly generated all possible combinations of (arbitrary) data processing decisions and analyzed them simultaneously. We conducted a separate multiverse analysis for each task (attention shifting and working memory updating) and each measure of adversity exposure combination. All multiverse analyses used the same underlying statistical models.
METHOD
Participants
The current study collected data from 681 youth (M age = 13.63, SD age = 0.83) from two sources across Salt Lake City, Utah, USA starting in the spring of 2018 and ending in early 2020. The first was a middle school and the second was 5 after‐school clubs. The middle school sample (seventh and eighth graders, N = 583; 290 females) formed 85.61% of the total sample and is socioeconomically and ethnically diverse: 11 youth identified as Asian, 3 as Native American, 18 as African American, 391 as White, 163 as Hispanic, 10 as Pacific Islander, 46 with multiple racial identities, and 39 were missing. According to school district records, 40.31% of students were receiving economic assistance based on family income and homelessness (i.e., free or reduced‐price lunch or fee waivers). The club sample (N = 98; 32 females) contained a wider age range (M age = 14.22, SD age = 1.42) and were also ethnically diverse. 57.14% were receiving free or reduced‐price lunch.
We aggregated data from both sources and applied a set of five exclusion criteria. We applied these criteria before inspecting or testing any relations between predictors and outcomes. Specifically, we excluded participants: (1) with incomplete cognitive task data, (2) with apparent cognitive impairments (e.g., head injuries, disabilities, drug use), (3) who missed two or more trap questions, (4) exposed to extreme distractions during the assessment, and (5) who received more than 60 min per day of special education services. After exclusions, the final sample contained 618 youth (M age = 13.62, SD age = 0.81; 298 females; 87.38% from the middle school). In terms of racial identity, 10 youth identified as Asian, 3 as Native American, 12 as African American, 366 as White, 142 as Hispanic, 7 as Pacific Islander, 45 with multiple racial identities, and 33 were missing.
Procedure
Data collection involved six parts: consent and assent, demographics form, cognitive testing, structured interview, questionnaire, and debriefing. Consent was obtained from the primary parent or guardian before assessments and assent was obtained from the participant at the beginning of the session. On the demographics form, participants indicated if they were left‐handed, their birthdate, and their racial and ethnic background.
Cognitive testing included abstract (i.e., standard) and ecological versions of an attention‐shifting and working memory updating task. Task order (shifting vs. updating) and version (abstract vs. ecological) were counterbalanced across participants. Some participants started with the attention shifting and then moved to the updating tasks. For those starting with the shifting (or updating) tasks, some started with the abstract version and then completed the ecological version (and vice versa). Regardless of which task was first, participants always completed both versions of one task before moving to the other task.
The interview contained two parts. The first part was about participants’ home and family life, such as their family composition, the number of adults in the household, and occupation and education information about caregivers. Participants also reported on the number of romantic partners their caregivers had and if these partners lived with the participant. The second part was about residential mobility. Participants listed all the homes they lived in from birth to age 13. For each home, they reported at which ages they lived in the home. If they moved, they also reported any changes in their family structure (loss or gain of adults in the home), social network (e.g., a new school), and town or city.
The questionnaire contained measures focused on the childhood environment. The measures included perceived unpredictability in the home, exposure to neighborhood violence, access to material resources, direct exposure to violence and fighting, and a child version of socially desirable responding.
Procedures across the middle school and after‐school clubs were the same, with a few minor differences. First, participants in the clubs completed the tasks before the interview, but the opposite occurred in the middle school. The second was that, in the middle school, the questionnaire was completed in a separate session. Whereas the tasks and interview were completed in a small room, alone with the interviewer, the questionnaire was completed approximately 2 weeks later in a mass testing context (large computer room). This was done because the middle school was on a strict class schedule, which limited the length of individual sessions. In the clubs, sessions were conducted in the summer during flexible hours.
Measures
Attention shifting
We measured attention shifting with two versions of the color–shape task (Friedman et al., 2008; Mittal et al., 2015; Miyake & Friedman, 2012), which involves categorizing stimuli according to one of two rules (see below). On each trial, the rule is displayed on the top of the screen. Using arrow keys, participants categorized the stimulus as quickly and accurately as possible. Response options appeared at the bottom of the screen (see Figure 1).
On the abstract (standard) attention‐shifting task, participants categorized colored (blue or yellow) shapes (squares or triangles) according to the “color” or “shape” rule (see Figure 1a). For example, if a blue triangle appeared on the screen and the rule was “color,” participants categorized the blue triangle as blue. However, if the rule was “shape,” participants instead categorized the blue triangle as a triangle.
The ecological attention‐shifting task replaced shapes and colors with faces (see Figure 1b). Faces were either male or female (gender), and were happy or angry (emotion). If a happy female face appeared on screen and the rule was “gender,” for example, participants categorized the face as female. If the rule was “emotion,” participants instead categorized the face as happy. The stimuli for the ecological attention‐shifting task were selected from the NimStim library (Tottenham et al., 2009). The same female and male models were used for happy and angry expressions.
For both versions, there were two types of trials: repeat and switch. Repeat trials use the same rule as the previous trial. If the current and previous rule is “color,” for instance, the current trial is a repeat trial. Switch trials are trials where the rule changes from the previous trial. If the current rule is “color” but the previous was “shape” (or vice versa), the current trial is a switch trial.
Accuracy on attention‐shifting tasks is normally high, and was in the current sample for both versions (M standard = 89.88%, SD standard = 8.44%; M ecological = 86.53%, SD ecological = 12.25%). Thus, instead of accuracy, attention‐shifting ability is measured by comparing reaction times on repeat trials to switch trials. Reaction times on repeat trials are normally faster than switch trials; average repeat trial reaction times on the abstract and ecological versions were 1195.29 ms (SD = 375.59 ms) and 1279.53 ms (SD = 461.01 ms), respectively. On switch trials, average reaction times were 1309.23 ms (SD = 446.11 ms) and 1589.07 ms (SD = 589.15 ms) on the standard and ecological versions.
To calculate attention‐shifting scores, we first cleaned trial‐level data (Friedman et al., 2008; Miyake et al., 2000). We removed fast and slow reaction times and removed trials after incorrect responses (see https://osf.io/kvt5e/ for details). We then subtracted the average reaction time on valid repeat trials from the average reaction time on valid switch trials to calculate switch cost scores (M switch − M repeat). The switch cost measures the relative delay in reaction time caused by switching between categorization rules. Average switch costs on the standard and ecological versions were 134.07 ms (SD = 203.66 ms) and 287.53 ms (SD = 255.46 ms), respectively (r = .17, n = 618). Higher switch costs mean longer reaction times on switch trials compared to repeat trials. Higher switch costs indicate less efficient attention shifting.
Working memory updating
Working memory updating was measured using two versions of the continuous counters task (Unsworth & Engle, 2008; Unsworth et al., 2015; Young et al., 2018), in which participants track a sequence of stimuli containing three different objects (see Figure 1). Participants keep running counts of each object in sequences nine items long. Each object was displayed for one second at a time. At the end of each sequence, participants reported the number of times each object appeared. For each round, there were three possible correct answers, one for each object type.
In the abstract (standard) version, participants kept running counts of squares, circles, and triangles (see Figure 1c). The participant must keep track of each shape, updating counts as new shapes appeared, and report them at the end of the sequence. The ecological version followed the same format, but participants kept running counts of three different real‐world objects (see Figure 1d): one positive (five‐dollar bill), one negative (angry face), and one neutral (Salt Lake City bus).
Participants completed five rounds of both versions. The maximum score was 15 for each version (five rounds × three possible correct). On the abstract and ecological versions, participants averaged 10.5 (SD = 2.7) and 10.95 (SD = 2.55), respectively (r = .46). Higher scores indicate better working memory updating performance.
Environmental unpredictability
Environmental unpredictability is difficult to measure and different definitions exist alongside each other (Young et al., 2020). Despite this, we aligned our measurement approach with previous literature in two ways. First, we measured caregiver and residential instability, which are both thought to be proxies to environmental unpredictability, using interview‐based measures (Ellis et al., 2009). Second, we measured the extent to which youth perceive their family context as unpredictable using a questionnaire (Young et al., 2018). Our goal was to aggregate these two information sources to arrive at a “best estimate” of environmental unpredictability.
The interview contained three variables of interest. The first measured the level of exposure to living in a biologically non‐intact family from birth to age 13. Interviewers asked participants about their family composition and the adults that lived with them in the home. If a participant's family composition changed, for example, because of a divorce, interviewers recorded the ages when participants experienced the change and for how long it persisted. A family was considered non‐intact if the participant did not live with both biological parents during any period from birth to age 13. Based on the earliest age of disruption, we indexed the onset of exposure to a non‐intact family by creating a four‐level variable from 0 to 3. A 0 indicated the participant lived in an intact family (lived with both biological parents) from birth until age 13 (n = 336); a 1 indicated that a disruption occurred after the age of 5 (n = 89); a 2 indicated that a disruption occurred before age 5 (n = 132); and a 3 indicated the participant was born into a non‐intact family (n = 56). Five participants had missing information.
The second interview variable tabulated the number of different parental figures (defined as spouses or boyfriends or girlfriends of the participant's mother and father) who lived in the same home with the participant. Trained interviewers tabulated the total number of co‐residing parental figures, excluding the participant's biological mother and father (M = 1.36, SD = 1.8).
The third interview variable focused on residential changes from birth to age 13 (reported retrospectively). Specifically, interviewers probed participants about the number of different homes they lived in and, in particular, whether moving to a new home involved living with new or different adults. On average, participants experienced 1.35 (SD = 1.66) moves that involved changes in residential adults.
The questionnaire included a measure of perceived childhood unpredictability (Mittal et al., 2015; Young et al., 2018). Participants responded to six items that assessed exposure to unpredictability up to age 13: (1) “Things were pretty calm and stable in my house” (reversed); (2) “People moved in and out of my house a lot”; (3) “I had a hard time knowing what my parent(s) or other people in my house were going to say or do from day‐to‐day”; (4) “My parent(s) argued or fought a lot with each other or with other people”; (5) “My parent(s) changed jobs a lot”; (6) “My parental situation changed a lot (e.g., divorce or separation of parents, parents starting new romantic relationships, parents leaving the home).” Participants rated each item on a scale from 1 (never true) to 5 (very often true). Responses to these items were averaged to create a self‐reported perceived childhood unpredictability measure (M = 1.99, SD = 0.73, α = .72). Higher scores indicated more perceived exposure to unpredictable environments.
To create a composite measure of unpredictability, we aggregated across the interview and questionnaire. First, we created an interview‐based measure of unpredictability using family intactness or disruptions, exposure to different parental figures, and residential moves involving new adults living in the home. We standardized these interview measures and then averaged them together (α = .77). We then aggregated this interview measure with self‐reported perceived unpredictability from the questionnaire, standardizing each before averaging (r = .5). Higher scores indicated more exposure to unpredictability.
Violence exposure
We measured violence exposure using the Neighborhood Violence Scale (Frankenhuis & Bijlstra, 2018; Frankenhuis, de Vries, et al., 2020) and two items about witnessing and involvement in physical fights. The measure contains seven items rated on a scale from 1 (never true) to 5 (very often true): (1) “I grew up in a safe neighborhood”; (2) “Crime was common in the neighborhood where I grew up”; (3) “In the neighborhood where I grew up, people had plenty of money” (reversed); (4) “In the neighborhood where I grew up, physical fights were common”; (5) “In the neighborhood where I grew up, shootings or stabbings occurred”; (6) “In the neighborhood where I grew up, most people felt unsafe walking alone after dark”; (7) “Where I grew up, it was important to be able to defend yourself against physical harm.” The physical fighting items asked about witnessing fights: “Based on your experiences at school and in your neighborhood, how many times did you see or hear someone being beaten up in real life?”; and involvement in fights: “How many times were you in a physical fight at school or in your neighborhood?” Both items were rated on a scale from 1 (0 times) to 8 (12 or more times).
Responses were averaged to create a composite measure of neighborhood violence (M = 1.94, SD = 0.75, α = .85). Likewise, the two fighting items were averaged together (M = 2.31, SD = 1.43). To create a violence exposure composite, the neighborhood violence composite and fighting composite were standardized and then averaged (r = .6). Higher scores indicated more exposure to violence.
Poverty exposure
We assessed each participant's poverty exposure using three information sources: interview‐assessed parent education and occupational prestige, school or club‐provided economic information, and self‐reported resource scarcity.
During the interview, participants reported their parents’ education and primary occupation. For parental education level, participants reported whether their mother and father graduated high school, went to college, and if they obtained a bachelor's degree or higher. Responses to each question were coded as 0 = “no” and 1 = “yes.” These items were summed to create a four‐level variable for each parent where 0 = did not graduate high school, 1 = graduated high school but did not attend any college, 2 = graduated high school and completed some college, and 3 = went to college and obtained a bachelor's degree or higher. Mother and father education were averaged to create a parental education score (M = 1.63, SD = 0.91).
Participants also reported their parents’ occupation. Participants described, in general terms, their mother's and father's jobs and the kind of work involved. Trained coders cross‐referenced these descriptions with 2010 census job codes (Hout, 2018). We calculated mother and father occupational prestige by matching census codes with prestige ratings from an established occupational prestige rating dataset (Hout et al., 2016). Prestige codes ranged from 0 to 100, with higher scores indicating higher occupational prestige for a particular job code. Mother and father prestige codes were averaged to create a parent occupational prestige score (M = 41.35, SD = 10.57).
We also obtained school or club‐provided economic information. The middle school provided four information sources: (1) whether or not students were receiving free lunch (n = 159); (2) whether or not they were receiving reduced‐price lunch (n = 45); (3) whether they were receiving fee waivers (n = 103); and (4) if they were experiencing homelessness (n = 32). These information sources were compiled to create a binary economic disadvantage variable. A participant was economically disadvantaged if they were receiving any benefits or experiencing homelessness (n = 215). In the afterschool clubs, free or reduced‐price lunch status was provided by self‐report, staff, and club enrollment forms and cross‐referenced to determine economic disadvantage in the clubs (n = 41). Overall, 256 participants were receiving economic assistance, 318 were not, and 44 had missing economic information.
Participants also reported their perceived level of resource scarcity. They rated seven items from 1 (never true) to 5 (very often true): (1) “Your family had enough money to afford the kind of home you all needed”; (2) “Your family had enough money to afford the kind of clothing you all needed”; (3) “Your family had enough money to afford the kind of food that you all needed”; (4) “Your family had enough money to afford the kind of medical care that you all needed”; (5) “I felt well‐off (rich, wealthy) compared to other kids in my school”; (6) “I felt well‐off (rich, wealthy) compared to other kids in my neighborhood”; and (7) “Your family struggled to make ends meet (get by financially).” The first six items were reversed, and all items were averaged to create a perceived resource scarcity measure (M = 2.2, SD = 0.67, α = .83). Higher scores indicated more perceived resource scarcity.
To create a poverty exposure composite, we combined parent education and occupational prestige (reversed), school or club reported economic disadvantage, and perceived resource scarcity. First, we standardized and averaged parent education and occupation (r = .47). Then, we recoded school‐provided economic codes to be equal to half of a standard deviation above and below the mean (in terms of z‐scores). Specifically, those receiving free or reduced‐price lunch were coded as .5, and those who were not were coded as −.5. To create a final composite, we averaged parent education and occupation (standardized), perceived resource scarcity (standardized), and the recoded school or club economic disadvantage. Higher values indicated more exposure to poverty.
Control variables
We included two control variables: age and interviewer‐rated distractions during testing. We included these because older youth tend to score higher on cognitive tests than younger youth (Best et al., 2011), and disruptions during the tasks could negatively impact performance. Interviewers completed quantitative ratings of the testing environment including (1) the level of noise; (2) the level of chaos; (3) how often there were interruptions; and (4) how often the participant appeared distracted. Interviewers rated each item on a scale from 1 (not at all) to 7 (much more than average). Items were averaged to create a composite (M = 1.3, SD = 0.46), where higher scores indicate more distractions.
We also included the Child Social Desirability scale (Miller et al., 2014). The measure includes 14 items such as “Have you ever broken a rule?” and “Do you sometimes feel angry when you don't get your way?” Participants indicated 1 (yes) or 0 (no) for each item. More socially desirable responses were scored as 1. Items were then summed to create a social desirability index (M = 5.36, SD = 3.1, α = .77).
RESULTS
Data analysis strategy
We used a multiverse analysis approach for all analyses to systematically evaluate the robustness (or sensitivity) of analyses across all arbitrary data processing decisions (see Simonsohn et al., 2020; Steegen et al., 2016 for details). We identified six arbitrary data processing decisions. First, we conducted analyses with and without the after‐school club sample. We did this because our procedure was slightly different across the two samples and the testing environment was more disruptive in the clubs compared with the middle school. Second, we conducted analyses with and without participants with minor distractions during testing. Third, we analyzed the data with and without participants who missed one trap question (those who missed more than 1 were already excluded). Fourth, we analyzed data with and without participants having any amount of special education (participants receiving more >60 min were already excluded). Fifth, we analyzed data with and without participants who performed at or below chance levels of accuracy on the attention‐shifting task (see https://osf.io/kvt5e/ for more information).
Our last arbitrary data processing decision pertained to socially desirable responses. It is well‐known that some youth tend to describe themselves in socially desirable ways. This raises concerns about the validity of self‐reported childhood adversity measures: youth scoring higher on social desirability might underreport or underrate their exposures to negative experiences. Indeed, scores on the Child Social Desirability scale were correlated with exposures to unpredictability (r = −.2) and violence (r = −.27), though not with poverty. One way to handle this issue is to statistically remove overlapping variance between social desirability and each predictor, using the leftover variance (e.g., the residual variance in childhood adversity exposures not associated with social desirability) as a predictor. Because it remains unclear how social desirability might affect the interpretation of our models, we analyzed our data with residualized and non‐residualized predictors.
To test our hypotheses, we performed a set of primary and secondary analyses on attention‐shifting and working memory performance. Our primary analyses tested the effects of task version, adversity dimensions, and adversity dimension × task version interactions. Specifically, we tested the main effect of environmental unpredictability (confirmatory), violence exposure (confirmatory), and poverty exposure (exploratory), and the interaction between each adversity dimension with task version (abstract vs. ecological) on attention‐shifting and working memory performance. We ran separate analyses for each adversity dimension and outcome combination. Using all possible combinations of arbitrary decisions, we constructed a multiverse of 64 datasets. The minimum and maximum sample sizes were 418 and 618, respectively.
We ran the same underlying mixed‐effects linear regression model. Analyses were conducted using R (R Core Team, 2020) and mixed models were fit using the lme4 package (Bates et al., 2015). Our mixed‐effects models included five fixed terms: the main effect of task version (ecological or abstract version, within‐subjects), the main effect of childhood adversity (between‐subjects), the interaction between task version and adversity exposure, the main effect of age (control variable), and the main effect of test distraction ratings (control variable). Task version was grand mean centered (abstract versions = −1, ecological versions = 1). All childhood adversity measures were standardized before model fitting, and all models included a random intercept for task version nested in participants.
Our models for attention‐shifting and working memory updating differed in one respect. Our sample included a small subset of siblings (n = 93, 45 families). All sibling groups were pairs of two (43 sibling pairs) except for one group of three and one group of four siblings. We computed intraclass correlations for sibling groups for attention‐shifting and working memory updating scores. Intraclass correlations for attention shifting were essentially zero. However, for working memory updating scores, intraclass correlations were .02 and .24 for the standard and ecological versions, respectively. Thus, all models analyzing working memory updating included an additional random intercept for siblings. Non‐siblings were given the same sibling‐group code, so the model could compute an intercept for non‐siblings.
To facilitate interpretation of multiverse results, we report median standardized βs, median 95% CIs, and percent significant for each term in our model (see Table 2). Percent significant refers to the number of analyses (out of 64) that resulted in a significant effect (two‐sided p‐value < .05) for a particular term and reflects the relative sensitivity (or robustness) of an effect to arbitrary data processing decisions. For the main effects of adversity and task version × adversity interactions, we used a bootstrapping technique to compute overall p‐values. The technique makes it possible to know if a multiverse analysis produced a median effect size larger than expected, given the null hypothesis that the median β = 0 (see Simonsohn et al., 2020 for details).
TABLE 2.
Median standardized effects, 95% CIs, percent significant, and bootstrapped p‐values for the main effect of adversity and adversity by task version interactions
| Main effect | Interaction | |||||||
|---|---|---|---|---|---|---|---|---|
| β | 95% CI | p (%) | p | β | 95% CI | p (%) | p | |
| Attention shifting | ||||||||
| Unpredictability | −.05 | [−.12, .01] | 25.00% | .022 | .02 | [−.03, .08] | 0.00% | .218 |
| Violence | −.06 | [−.12, .00] | 21.88% | .020 | −.02 | [−.08, .04] | 0.00% | .176 |
| Poverty | −.03 | [−.10, .03] | 0.00% | .310 | .02 | [−.04, .07] | 0.00% | .312 |
| Working memory updating | ||||||||
| Unpredictability | −.04 | [−.11, .04] | 0.00% | .106 | .02 | [−.03, .06] | 0.00% | .374 |
| Violence | −.06 | [−.13, .02] | 18.75% | .082 | .04 | [−.00, .09] | 40.62% | .036 |
| Poverty | −.10 | [−.18, −.03] | 100.00% | .000 | .05 | [.00, .09] | 53.12% | .012 |
The p (%) column reflects the number of analyses that produced p‐values < .05 for a given multiverse. The total number of analyses for each measure was 64. Overall p‐values were computed using a bootstrapped resampling method and reflect the probability of obtaining an effect size as extreme or more extreme given the median effect is 0.
Table 1 displays bivariate associations between all composite measures of adversity, including components of each, and descriptive statistics. Our primary interests were the main effect of adversity and the interaction of adversity with task‐version. Table 2 shows median effect sizes (β‐coefficients) and bootstrapped p‐values for attention‐shifting and working memory updating analyses for the main effect of adversity (unpredictability, violence, and poverty) and the interaction term (task version × adversity). Table 3 reports median simple effects of task version across high and low levels of adversity and median simple effects of adversity across abstract and ecologically relevant task versions.
TABLE 3.
Median simple effects for task version and adversity
| Task version | Adversity exposure | |||||||
|---|---|---|---|---|---|---|---|---|
| b (abstract) | p (%) | b (ecological) | p (%) | b (low) | p (%) | b (high) | p (%) | |
| Attention shifting | ||||||||
| Unpredictability | −18.22 | 10.94% | −7.29 | 0.00% | 74.14 | 100.00% | 84.88 | 100.00% |
| Violence | −9.62 | 0.00% | −18.61 | 25.00% | 83.60 | 100.00% | 74.34 | 100.00% |
| Poverty | −12.51 | 0.00% | −4.08 | 0.00% | 75.17 | 100.00% | 83.63 | 100.00% |
| Working memory updating | ||||||||
| Unpredictability | −0.95 | 0.00% | −0.32 | 0.00% | 1.01 | 28.12% | 1.68 | 100.00% |
| Violence | −1.80 | 81.25% | −0.31 | 0.00% | 0.58 | 0.00% | 2.08 | 100.00% |
| Poverty | −2.66 | 100.00% | −1.03 | 7.81% | 0.56 | 0.00% | 2.12 | 100.00% |
Simple effects are unstandardized. Task Version reflects the median simple effect of adversity when the task version was abstract and ecological. Adversity reflects the median simple effect of task version when adversity is low (−1 SD) and high (+1 SD). The p (%) columns reflect the number of analyses that produced simple effect p‐values < .05.
Figures 2 and 3 visualize multiverse task version × adversity interaction results for attention‐shifting and working memory updating performance, including depictions of performance on abstract and ecological task versions across high (+1 SD) and low (−1 SD) adversity exposure (Figures 2a and 3a), p‐curves associated with each interaction term (Figures 2b and 3b), sorted interaction β‐coefficients across arbitrary decisions (Figures 2c and 3c), sample sizes (Figures 2d and 3d), and a specification grid showing the arbitrary data processing decisions associated with each effect (Figures 2e and 3e).
FIGURE 2.
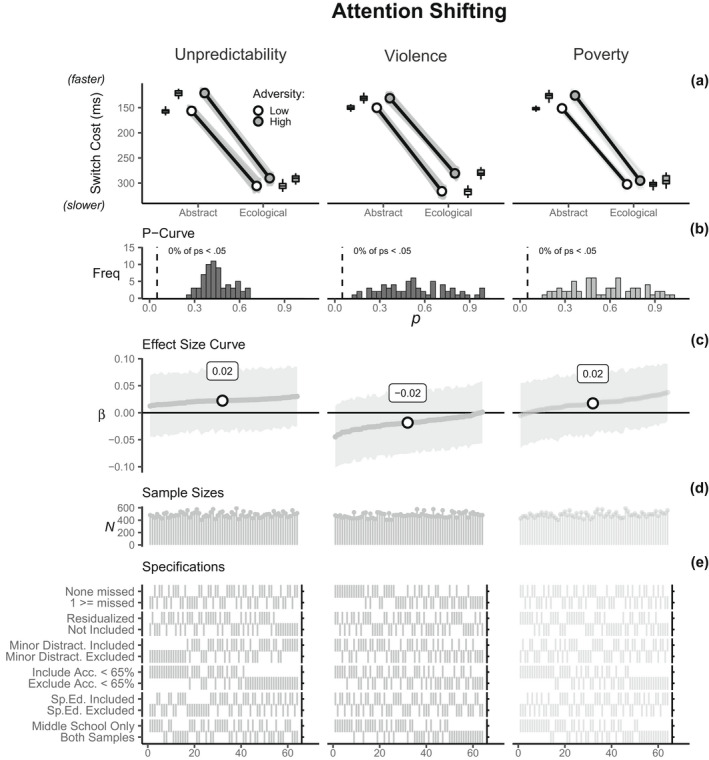
Visualization of multiverse attention‐shifting results. Unpredictability and violence exposure multiverse analyses were confirmatory and poverty analyses were exploratory. (a) visualizes the multiverse task version × adversity interaction on abstract and ecological task versions across high (+1 SD) and low (−1 SD) adversity exposure (y‐axis was reversed so that higher values = faster shifting), (b) plots p‐curves associated with each interaction term, (c) plots sorted interaction β‐coefficients across each arbitrary decision, (d) plots the sample sizes for each effect, and (e) is a specification grid indicating the data processing decisions associated with each effect
FIGURE 3.
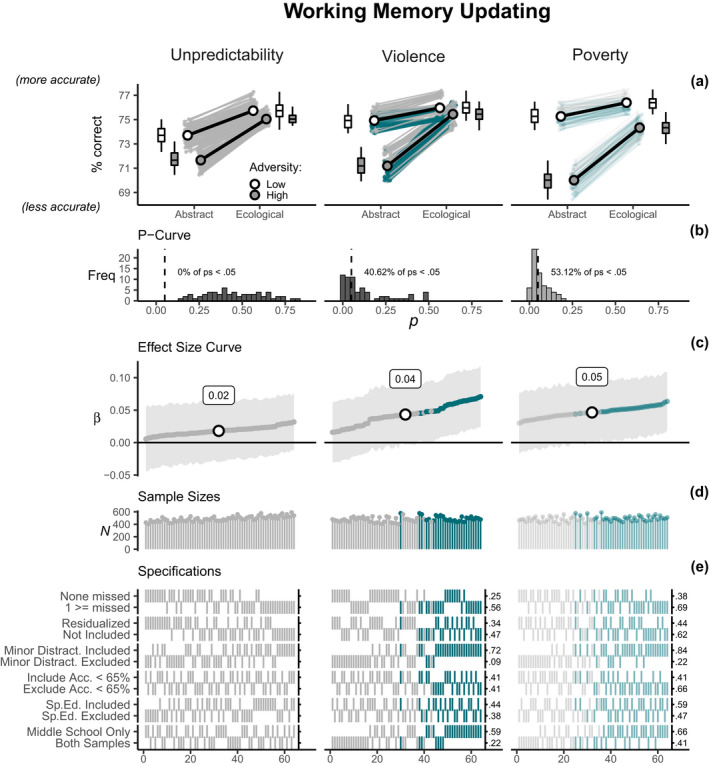
Visualization of multiverse working memory updating results. Unpredictability and Violence exposure multiverse analyses were confirmatory and poverty analyses were exploratory. (a) visualizes the multiverse task version × adversity interaction on abstract and ecological task versions across high (+1 SD) and low (−1 SD) adversity exposure, (b) plots p‐curves associated with each interaction term, (c) plots sorted interaction β‐coefficients across each arbitrary decision, (d) plots the sample sizes for each effect, and (e) is a specification grid indicating the data processing decisions associated with each effect. Proportions of each arbitrary decision with p‐values < .05 are indicated on the right side of each specification grid. Blank proportions indicate proportions = 0. Teal lines and points reflect individual multiverse effect sizes with p‐values < .05
We preregistered all primary analyses on the Open Science Framework (OSF; see https://osf.io/6r95z/), including an updated primary analysis plan (see https://osf.io/4vsnz/), which included more details. We conducted secondary analyses after our primary analyses (see Secondary Analyses below). Before conducting these analyses, we uploaded secondary analysis plans (see https://osf.io/7fu35/ for the first plan and https://osf.io/wcauf/ for the second plan), explaining the goals and purpose of each secondary analysis. A Red Team Critic (Red Team Market, 2021) successfully reproduced and verified (see https://osf.io/xv94z/ for a report) all analyses prior to submission. All associated data and code are included in our preregistration repository on GitHub (https://github.com/ethan‐young/hidden‐talents‐multiverse) and the OSF (https://osf.io/6r95z/), including source code to reproduce the manuscript itself.
Primary analyses
Attention shifting
Across each set of multiverse analyses, there were significant main effects of task version. All median effects sizes for task version were βs = .33 (all ps < .05) for multiverse models testing unpredictability, violence exposure, and poverty exposure, indicating that switch costs (see Attention Shifting for switch cost explanation) were moderately higher for the ecological version compared to the abstract version (see Figures S1–S3). That is, reaction times on switch trials, compared to repeat trials, were longer when stimuli were ecologically relevant as opposed to abstract. However, there were no effects of age (all median βs = .02, all ps > .05) or test distraction ratings (all median β = .02, all ps > .05) on overall switch costs (see Figures S1–S3).
Overall, there were no significant interaction effects between task version and unpredictability, violence exposure, or poverty exposure (see Tables 2 and 3; Figure 2b). However, analyses produced main effects of unpredictability (median β = −.05, 25% of ps < .05, overall p = .022) and violence exposure (median β = −.06, 21.88% of ps < .05, overall p = .020; see Table 2). There were no main effects of poverty exposure (median β = −.03, no ps < .05, overall p = .310; see Table 2). That is, exposure to more unpredictability and violence was associated with smaller switch costs, suggesting such exposures were associated with somewhat better shifting performance on average, irrespective of whether stimuli were abstract or ecological.
Working memory updating
Across each set of multiverse analyses, there were again significant main effects of task version. All median effects sizes for task version were βs = .08 (all ps < .05) for models testing unpredictability, violence exposure, and poverty exposure, indicating that updating performance was better when stimuli were ecological compared to abstract, on average (see Figures S4–S6). There were also consistent main effects of age; median effects were β = .14 (all ps < .05) for unpredictability models, β = .15 (all ps < .05) for violence exposure models, and β = .15 (all ps < .05) for poverty exposure models (see Figures S4–S6). That is, older youth scored higher on working memory updating, on average. Finally, there were some main effects of test environment distraction ratings. Median effects sizes were β = −.1 (62.5% of ps < .05) for unpredictability models, β = −.11 (75% of ps < .05) for violence exposure models, and β = −.1 (62.5% of ps < .05) for poverty exposure models, indicating that more test distractions reduced working memory updating performance, on average (see Figures S4–S6).
Multiverse analyses revealed a main effect of poverty exposure (median β = −.10, all ps < .05, bootstrapped p < .001) but no main effects of unpredictability (median β = −.04, no ps < .05, bootstrapped p = .106) or violence exposure (median β = −.06, 18.75% of ps < .05, bootstrapped p = .082). Analyses also revealed two significant interactions: task version × violence exposure (median β = .04, 40.62% of ps < .05, bootstrapped p = .036) and task version × poverty exposure (median β = .05, 53.12% of ps < .05, bootstrapped p = .012). Youth exposed to low levels of violence or poverty tended to perform better on the abstract working memory updating task (violence exposure median b abstract = −1.80, 81.25% of ps < .05; poverty exposure median b abstract = −2.66, all ps < .05), compared to youth exposed to high levels of violence and poverty (see Table 3; Figure 3). However, this performance gap closed on the ecological working memory task (violence exposure median b ecological = −0.31, no ps < .05; poverty exposure median b ecological = −1.03, 7.81% of ps < .05). Put differently, youth exposed to high levels of violence or poverty (+1 SD) performed better on the ecological version compared to their own performance on the abstract version (median simple b high‐violence = 2.08, all ps < .05; median simple b high‐poverty = 2.12, all ps < .05), whereas youth exposed to low violence or poverty (−1 SD) performed similarly across task versions (median simple b low‐violence = 0.58, no ps < .05; median simple b low‐poverty = 0.56, no ps < .05). In this sense, ecological stimuli appeared to equalize working memory updating performance among youth exposed to high levels of violence and poverty (see Table 3; Figure 3a).
Secondary analyses
We followed up our primary analyses with two sets of secondary, exploratory analyses. We uploaded secondary analysis plans to the OSF prior to conducting them (see https://osf.io/7fu35/ for the first plan and https://osf.io/wcauf/ for the second plan). These analyses focused on two questions. First, in contrast to prior work (Mittal et al., 2015; Young et al., 2018), we found limited support for improved working memory updating performance in relation to unpredictability (although we found a main effect of unpredictability on attention shifting). However, prior work measured retrospective perceptions of unpredictability, whereas the current combined perceptions with more objective, interview‐based measures. Thus, one possibility is that specific components of our composite adversity measures (unpredictability, violence exposure, and poverty exposure; see Measures section) have unique associations with attention‐shifting and working memory updating performance. To address this, we expanded our multiverse approach to include each component of our predictor variables as additional arbitrary decisions.
The second question focused on the interactive effects of task version × violence exposure and task version × poverty exposure on working memory updating performance. Specifically, primary analyses revealed an equalization effect for both violence and poverty exposures on working memory updating. However, because measures of violence and poverty were not included in the same statistical model, it remains unclear whether these interactions are independent. For example, one possibility is that exposures to violence and poverty are independently associated with working memory updating performance. Alternatively, they may overlap, reflecting the same association. To test this question, we ran a focused multiverse analysis with the same controls, main effects of task version, poverty and violence exposure, and two interaction terms: task‐version × violence exposure and task‐version × poverty exposure in the same model. If violence and poverty exposures interact independently with task version, both interaction terms should remain significant. However, if they represent overlapping effects on working memory updating performance, one or the other may drop out of significance, which would suggest that one or the other adversity dimension is driving the effects of the other.
Exploring components of adversity dimensions
We ran an expanded multiverse analysis to explore the effects of each component of our adversity composites (see Measures section) on attention‐shifting and working memory updating performance. Environmental unpredictability contained two components, perceived unpredictability (self‐reported) and an interview‐based measure tabulating family disruptions, parental figures, and residential moves. Violence exposure contained two self‐report components: neighborhood violence and exposure to and involvement in violence. Poverty exposure contained three components: parental education and occupation (interview), perceived resource scarcity (self‐report), and school‐coded economic disadvantage (fee waivers, free‐ or reduced‐priced lunch, and homelessness).
For this expanded multiverse approach, we retained all original data processing decisions (i.e., original 64 combinations of decisions) and added adversity component as an additional decision. For unpredictability, we analyzed each unpredictability component and the composite measure (composite analyses are redundant with primary analyses but were retained for comparison purposes), which resulted in 384 analyses (64 original × three versions of unpredictability × two performance measures: attention shifting and working memory updating). We applied the same approach to violence exposure (three violence variables, 384 analyses) and poverty exposure (four poverty variables, 512 analyses). The full results of these analyses are reported in the supplement (see Table S2).
For attention shifting, consistent with our primary analyses, there were no interactions for any component of adversity and task version (see Table S2; Figures S7–S9). However, there were a few main effects of adversity. First, primary analyses revealed, under some analytic decisions, a main effect of unpredictability. Upon inspection of each unpredictability component, this effect appeared to be entirely driven by self‐reported perceived unpredictability. Specifically, no main effect p‐values for interview‐based unpredictability were <.05, whereas 90.62% were for perceived unpredictability (see Tables S2 and S3; Figure S7). In addition, violence exposure revealed that our primary analyses were driven by neighborhood violence (65.62% of ps < .05) and not by direct witnessing or involvement in fights (no ps < .05, see Tables S2 and S3; Figure S8). There were no main effects of poverty exposure components on attention shifting (see Tables S2 and S3; Figure S9).
For working memory updating, there were no interactions between any unpredictability component (perceived or interview‐based) and task‐version (see Figure S10). However, our expanded analysis with violence exposure revealed that interactions obtained with the composite measure were not driven by neighborhood violence but instead by witnessing or involvement in violence (75% of interaction ps < .05, see Tables S2 and S3; Figure S11). No interactions were significant with the neighborhood violence component of the violence composite. For poverty exposure, interview‐based parental occupational prestige and school‐reported economic disadvantage showed some interaction effects (parental education and occupational prestige 26.56% of ps < .05; school coded economic disadvantage 18.75% of ps < .05, see Tables S2 and S3; Figure S12). Self‐reported perceived resource scarcity showed no interaction effects (see Tables S2 and S3; Figure S12).
Comparing violence and poverty exposure interactions with task‐version
Our next secondary analysis was designed to compare the violence exposure × task‐version interaction with poverty exposure × task‐version interaction on working memory updating performance in the same model. To do so, we ran a multiverse analysis using the original set of 64 data processing decisions. We entered the same controls, main effects of task‐version, poverty and violence exposure, and two interaction terms: task‐version × violence exposure and task‐version × poverty exposure. Analyses revealed a main effect of poverty (90.62% of ps < .05); consistent with the primary analyses, lower poverty was associated with better updating performance under most analytic decisions. However, there were no main effects of violence exposure (no ps < .05). For interactions, there were no effects of task version × poverty (no ps < .05, see Figure S13) and only a small number of significant task version × violence exposure effects (14.06% of ps < .05, see Figure S13). More specifically, when both interactions were entered into the same model, only task‐version × violence exposure remained significant, although only under a small set of analytic decisions.
Violence and poverty exposure interaction patterns were qualitatively similar to those obtained in our primary analyses (see Figure 3a; Figure S13). However, these secondary results suggest that the violence exposure interaction with task version may be driving our poverty × task version results for working memory updating. One possibility is that the shared variance between poverty and violence exposures (r = −.37) is responsible for both interaction effects. In other words, although poverty and violence exposure are theoretically distinct, our poverty composite may capture poverty‐related violence exposures (e.g., high poverty neighborhoods contain more crime) and therefore interact with task version. When directly compared, explicit measures of violence exposure remained significant (although only under a small set of analytical decisions), whereas poverty interactions dropped out entirely.
DISCUSSION
We examined how ecologically relevant testing materials affect cognitive performance among adversity‐exposed youth. We measured three dimensions of adversity—environmental unpredictability, violence exposure, and poverty—and tested performance on attention‐shifting and working memory updating tasks. We administered two versions of each task: one using abstract stimuli and the other using ecological, real‐world stimuli, allowing us to compare performance within‐ and between‐subjects. Leveraging multiverse analysis (Simonsohn et al., 2020; Steegen et al., 2016), we tested interactions between dimensions of adversity and task version on attention‐shifting and working memory updating performance. We did not find interaction effects for attention shifting. However, youth exposed to unpredictability and violence showed lower switch costs on average, suggesting slightly improved attention‐shifting performance irrespective of task content.
These findings are consistent with a recent study showing that higher caregiving instability was associated with improved attention shifting (Fields et al., 2021). However, our findings also partially diverge from prior work (Mittal et al., 2015; Nweze et al., 2021). For example, whereas we found unpredictability was associated with improved attention shifting on average, Mittal et al. (2015) found no difference in performance under neutral conditions. And, although they found improved attention shifting for those exposed to high unpredictability under uncertainty, it remains unclear how this effect relates to those obtained in the current study. In addition, Nweze et al. (2021) found no association between adversity and attention shifting, but they tested institutionalized children rather than measuring adversity dimensions. In general, we should interpret the results cautiously. Although we followed field standards for calculating switch costs by computing difference scores, such scores ignore participant‐level reaction times. Mixed‐modeling approaches can account for both overall reaction times and differences across switch and repeat trials, but require more statistical power to test three‐way interactions. Future research should consider modeling approaches that capture participant‐level reaction times and differences across conditions.
For working memory updating, we found lowered performance among violence‐ and poverty‐exposed youth on the abstract working memory updating task than peers with reduced exposures. However, ecological materials produced an equalization effect: the updating performance gap between low and high adversity‐exposed youth narrowed on the ecological updating task. Interestingly, updating performance was unrelated to unpredictability. These findings are partially consistent with prior work on adversity exposure and working memory updating performance (Nweze et al., 2021; Young et al., 2018). For example, both Young et al. (2018) and the current study found lowered abstract working memory performance among high adversity‐exposed individuals. Although performance with ecological stimuli is not directly comparable to performance under manipulated uncertainty, both studies reduced the updating performance gap under ecologically relevant conditions. However, there are also discrepancies. For example, Young et al. (2018) found effects with unpredictability and not poverty, whereas the current study found associations with violence and poverty but not unpredictability. Finally, Nweze et al. (2021) found improved working memory performance among institutionalized youth without ecological stimuli or uncertainty manipulations. However, both their adversity and working memory measures were different.
Overall, inconsistencies across prior work and the current attention‐shifting and working memory updating findings could be attributed to differences in sampling (adults vs. youth), the sampled range of adversity exposure (restricted vs. broad), or methods and design (within‐ vs. between‐subjects design; lab vs. community and school settings). Future research should both address these inconsistencies and conduct more direct replications of individual studies to converge on reliable patterns.
Our first set of secondary analyses focused on the components of our adversity composites. For attention‐shifting performance, the main effect of our unpredictability composite appeared to be driven by self‐reported perceived unpredictability and not by the interview‐based measure which captured changes in youths’ living situations. Likewise, the main effect of violence exposure appeared to be driven by neighborhood violence and not involvement or witnessing fights. For working memory updating, interaction effects involving violence exposure were driven by involvement or witnessing fights but not perceptions of neighborhood violence. All components of poverty exposure measures, except self‐reported perceptions of resource scarcity, showed interactive effects with task version on working memory updating. Our second set of secondary analyses compared violence to poverty exposure in the same model. Findings suggest, at least when directly comparing interaction terms, violence exposure × task version predicted the working memory updating equalization effect, whereas the poverty × task version interaction did not.
There are many possible explanations for the diverging adversity component patterns. First, some information sources may be more accurate than others. For example, asking about the number of fights one has been involved in or witnessed might be easier to report than asking broader questions about neighborhood danger. Second, for different cognitive abilities, objective versus subjective reports may be more relevant. For example, for attention shifting, perceptions appeared to matter, whereas objective events did for working memory updating. Third, although adversity components were correlated in the moderate range—as typically observed in the literature (Jacobs et al., 2012; Smith & Pollak, 2021)—they may measure different constructs. For example, more objective indicators might capture aspects of the broader ecology but subjective, self‐reported measures capture how youth have internalized and perceived their environment and family life. Although interesting, all secondary analyses are exploratory, and should be interpreted with caution. Nonetheless, these analyses highlight the need to measure multiple dimensions of adversity, compare them, and consider each measure's report format and source.
Taken together, our equalization patterns of results are striking compared to the backdrop of developmental science, which almost exclusively reports lowered cognitive performance in people exposed to harsh environments. We also document lowered performance among adversity‐exposed youth, but this effect was specific to abstract stimuli, at least for working memory updating. When testing materials were more concrete, adversity‐exposed youth perform about as well as youth from supportive backgrounds. These results converge with recent work comparing stimulus types among adversity‐exposed youth. For example, Rifkin‐Graboi et al. (2021) found preschoolers exposed to caregiver adversity were more accurate on relational memory for socioemotional than non‐socioemotional stimuli and Zuilkowski et al. (2016) found that sub‐Saharan African children from high poverty backgrounds were more accurate on reasoning tests with three‐dimensional stimuli than two‐dimensional stimuli.
These effects have both practical and theoretical implications. Practically, these effects support the idea that ecologically relevant testing materials may “even the playing field” for adversity‐exposed youth. That is, pending replication and extension, our data suggest leveraging ecologically relevant materials in education may hold promise for closing achievement gaps (Ellis et al., 2017, 2020; Frankenhuis, Young, et al., 2020). In fact, programs for gifted students from low‐income backgrounds already leverage concrete learning materials (VanTassel‐Baska, 2018). However, our data also suggest the effect of ecological content may be specific to particular abilities. On the one hand, our data showing within‐subject improvements on working memory updating is consistent with past research using ecological versions of Raven's Progressive Matrices (Richardson, 1991). On the other, ecological content actually lowered attention‐shifting performance for everyone compared to abstract content, possibly because shifting was more difficult with more ecologically hot or “sticky” stimuli. This negative effect is consistent with other studies reporting lowered performance on some tests with ecologically relevant content (Duquennois, 2022; Frankenhuis, Young, et al., 2020; Muskens, 2019).
Theoretically, our findings support the notion that hidden talents may emerge when using ecologically relevant testing materials, but they also raise questions. In particular, why should ecologically relevant stimuli equalize working memory updating performance for adversity‐exposed youth? There are at least three possibilities. First, adversity exposure could simultaneously lower and improve performance. While abstract working memory updating performance is lowered, ecological working memory updating performance is improved. However, this explanation requires that different cognitive mechanisms process different classes of stimuli, even on tests of the same ability. If this is true, those mechanisms that process abstract content underperform compared to those that process ecological content. Second, there may be no actual differences in underlying abilities. Instead, ecologically relevant stimuli may activate intact, but dormant or underrecruited, working memory updating processes. Thus, when adversity‐exposed youth are tested under abstract testing conditions, their cognitive processes operate at a lower level (remain inactive) but operate equally well with ecological testing materials. This makes sense if adversity limits energy or cognitive resources. Under such constraints, it may be adaptive to activate expensive cognitive processes only when necessary. Third, ecological testing materials may remove barriers, such as testing anxiety or test unfamiliarity, that disadvantage adversity‐exposed youth. Unlike the selective activation of cognitive resources, the additional stressors of testing are removed, allowing cognitive mechanisms to operate unimpeded. However, this explanation is difficult to reconcile with experimental work which finds that mild stress and uncertainty improve performance (Mittal et al., 2015; Young et al., 2018). Future research should use methods and designs that can disentangle these explanations.
Our study has several strengths and limitations. First, we leveraged a within‐person design, which illuminated the effects of ecological testing materials in the same person. However, the correspondence between each version of our tests was modest for working memory updating (r = .46) and low for attention shifting (r = .17). Although the task structure was the same, it remains unclear to what extent the ecological tests measured the same construct, especially for attention shifting. In addition, test difficulty may have been different across test versions (e.g., switch costs were larger on the ecological version). Future research should consider teasing apart test difficulty from ecological relevance. Second, our strategy for creating ecological test versions was to select stimuli believed to be more salient or impactful to adversity‐exposed youth. However, we did not independently assess the ecological validity of our real‐world stimuli. Thus, it remains unclear whether our tests were specifically matched to the actual experiences of adversity‐exposed youth or more ecologically relevant for these youth than for those from supportive conditions. Third, we leveraged multiverse analysis to examine the robustness of our findings to arbitrary data processing decisions. Though powerful, the technique is relatively new and should be interpreted with caution. For instance, as with other statistical techniques, researchers might disagree over which data processing decisions are arbitrary (Del Giudice & Gangestad, 2021). Fourth, although we found some effects of ecological testing materials, we measured abilities that have shown some evidence of adversity‐related enhancement. To explore the generalizability of ecological content across abilities, future research may create ecological versions of tests known to disadvantage adversity‐exposed youth, such as inhibition or working memory retrieval (Mittal et al., 2015; Young et al., 2018), and compare performance to abstract versions. Finally, although we used interviews and self‐report methods, all of our childhood adversity measures were cross‐sectional and some were retrospective. These measurement limitations may be partially offset because our sample was still living in their developmental environment. However, this does not replace the need for prospective, longitudinal measures and cannot eliminate all biases associated with retrospective reporting (Reuben et al., 2016). Thus, it remains unclear to what extent the current environment, rather than the developmental environment, is driving our findings.
Until recently, developmental science has almost exclusively reported lowered cognitive performance in people from harsh conditions. The hidden talents framework has challenged this notion and inspired researchers to document the strengths and abilities of people from adversity. Theoretically, our data help to refine the hidden talents framework and illuminate future research questions surrounding the unique skills and abilities of people living in harsh conditions. Though much is yet to be done, our data have exciting practical implications, such as developing ecologically relevant materials for education, that might “even the playing field” for adversity‐exposed youth.
Supporting information
Supplementary Material
Young, E. S. , Frankenhuis, W. E. , DelPriore, D. J. , & Ellis, B. J. (2022). Hidden talents in context: Cognitive performance with abstract versus ecological stimuli among adversity‐exposed youth. Child Development, 93, 1493–1510. 10.1111/cdev.13766
Funding information
The development of this research was supported by the Robert Wood Johnson Foundation (73657) Research Network on Adaptations to Childhood Stress (Directors: Ellis & Frankenhuis). WEF’s contributions have been supported by the Dutch Research Council (016.155.195 and V1.Vidi.195.130), the James S. McDonnell Foundation (220020502), and the Jacobs Foundation (2017 1261 02). BJE’s contributions were supported by the Consortium for Families and Health Research (University of Utah) and the Sorenson Legacy Foundation.
REFERENCES
- Banerjee, A. V. , Bhattacharjee, S. , Chattopadhyay, R. , & Ganimian, A. J. (2017). The untapped math skills of working children in India: Evidence, possible explanations, and implications [Unpublished manuscript]. [Google Scholar]
- Bates, D. , Mächler, M. , Bolker, B. , & Walker, S. (2015). Fitting linear mixed‐effects models using lme4. Journal of Statistical Software, 67(1). 10.18637/jss.v067.i01 [DOI] [Google Scholar]
- Best, J. R. , Miller, P. H. , & Naglieri, J. A. (2011). Relations between executive function and academic achievement from ages 5 to 17 in a large, representative national sample. Learning and Individual Differences, 21(4), 327–336. 10.1016/j.lindif.2011.01.007 [DOI] [PMC free article] [PubMed] [Google Scholar]
- Bjornsdottir, R. T. , Alaei, R. , & Rule, N. O. (2017). The perceptive proletarian: Subjective social class predicts interpersonal accuracy. Journal of Nonverbal Behavior, 41(2), 185–201. 10.1007/s10919-016-0248-6 [DOI] [Google Scholar]
- Blair, C. , & Raver, C. C. (2012). Child development in the context of adversity: Experiential canalization of brain and behavior. American Psychologist, 67(4), 309–318. 10.1037/a0027493 [DOI] [PMC free article] [PubMed] [Google Scholar]
- Del Giudice, M. , & Gangestad, S. W. (2021). A traveler’s guide to the multiverse: Promises, pitfalls, and a framework for the evaluation of analytic decisions. Advances in Methods and Practices in Psychological Science, 4(1), 2515245920954925. 10.1177/2515245920954925 [DOI] [Google Scholar]
- Dietze, P. , & Knowles, E. D. (2021). Social class predicts emotion perception and perspective‐taking performance in adults. Personality and Social Psychology Bulletin, 47(1), 4256. 10.1177/0146167220914116 [DOI] [PubMed] [Google Scholar]
- Doebel, S. (2020). Rethinking executive function and its development. Perspectives on Psychological Science, 15(4), 942–956. 10.1177/1745691620904771 [DOI] [PubMed] [Google Scholar]
- Duncan, G. J. , Magnuson, K. , & Votruba‐Drzal, E. (2017). Moving beyond correlations in assessing the consequences of poverty. Annual Review of Psychology, 68(1), 413–434. 10.1146/annurev-psych-010416-044224 [DOI] [PMC free article] [PubMed] [Google Scholar]
- Duquennois, C. (2022). Fictional money, real costs: Impacts of financial salience on disadvantaged students. American Economic Review, 112(3), 798–826. 10.1257/aer.20201661 [DOI] [Google Scholar]
- Ein‐Dor, T. , & Perry, A. (2014). Full house of fears: Evidence that people high in attachment anxiety are more accurate in detecting deceit. Journal of Personality, 82(2), 83–92. 10.1111/jopy.12035 [DOI] [PubMed] [Google Scholar]
- Ellis, B. J. , Abrams, L. S. , Masten, A. S. , Sternberg, R. J. , Tottenham, N. , & Frankenhuis, W. E. (2020). Hidden talents in harsh environments. Development and Psychopathology, 34(1), 95–113. 10.1017/S0954579420000887 [DOI] [PubMed] [Google Scholar]
- Ellis, B. J. , Bianchi, J. , Griskevicius, V. , & Frankenhuis, W. E. (2017). Beyond risk and protective factors: An adaptation‐based approach to resilience. Perspectives on Psychological Science, 12(4), 561–587. 10.1177/1745691617693054 [DOI] [PubMed] [Google Scholar]
- Ellis, B. J. , Figueredo, A. J. , Brumbach, B. H. , & Schlomer, G. L. (2009). Fundamental dimensions of environmental risk. Human Nature, 20(2), 204–268. 10.1007/s12110-009-9063-7 [DOI] [PubMed] [Google Scholar]
- Farah, M. J. , Shera, D. M. , Savage, J. H. , Betancourt, L. , Giannetta, J. M. , Brodsky, N. L. , Malmud, E. K. , & Hurt, H. (2006). Childhood poverty: Specific associations with neurocognitive development. Brain Research, 1110(1), 166–174. 10.1016/j.brainres.2006.06.072 [DOI] [PubMed] [Google Scholar]
- Fields, A. , Bloom, P. A. , VanTieghem, M. , Harmon, C. , Choy, T. , Camacho, N. L. , Gibson, L. , Umbach, R. , Heleniak, C. , & Tottenham, N. (2021). Adaptation in the face of adversity: Decrements and enhancements in children’s cognitive control behavior following early caregiving instability. Developmental Science, 24(6). 10.1111/desc.13133 [DOI] [PMC free article] [PubMed] [Google Scholar]
- Frankenhuis, W. E. , & Bijlstra, G. (2018). Does exposure to hostile environments predict enhanced emotion detection? Collabra‐Psychology, 4(1), 18. 10.1525/collabra.127 [DOI] [Google Scholar]
- Frankenhuis, W. E. , de Vries, S. A. , Bianchi, J. , & Ellis, B. J. (2020). Hidden talents in harsh conditions? A preregistered study of memory and reasoning about social dominance. Developmental Science, 23(4), e12835. 10.1111/desc.12835 [DOI] [PMC free article] [PubMed] [Google Scholar]
- Frankenhuis, W. E. , & de Weerth, C. (2013). Does early‐life exposure to stress shape or impair cognition? Current Directions in Psychological Science, 22(5). http://cdp.sagepub.com/content/22/5/407.short [Google Scholar]
- Frankenhuis, W. E. , Young, E. S. , & Ellis, B. J. (2020). The hidden talents approach: Theoretical and methodological challenges. Trends in Cognitive Sciences, 24(7), 569–581. 10.1016/j.tics.2020.03.007 [DOI] [PubMed] [Google Scholar]
- Friedman, N. P. , Miyake, A. , Young, S. E. , DeFries, J. C. , Corley, R. P. , & Hewitt, J. K. (2008). Individual differences in executive functions are almost entirely genetic in origin. Journal of Experimental Psychology: General, 137(2), 201–225. 10.1037/0096-3445.137.2.201 [DOI] [PMC free article] [PubMed] [Google Scholar]
- Gibb, B. E. , Schofield, C. A. , & Coles, M. E. (2009). Reported history of childhood abuse and young adults’ information‐processing biases for facial displays of emotion. Child Maltreatment, 14(2), 148–156. 10.1177/1077559508326358 [DOI] [PMC free article] [PubMed] [Google Scholar]
- Grigorenko, E. L. , Meier, E. , Lipka, J. , Mohatt, G. , Yanez, E. , & Sternberg, R. J. (2004). Academic and practical intelligence: A case study of the Yup’ik in Alaska. Learning and Individual Differences, 14(4), 183–207. 10.1016/j.lindif.2004.02.002 [DOI] [Google Scholar]
- Hackman, D. A. , Farah, M. J. , & Meaney, M. J. (2010). Socioeconomic status and the brain: Mechanistic insights from human and animal research. Nature Reviews Neuroscience, 11(9), 651–659. 10.1038/nrn2897 [DOI] [PMC free article] [PubMed] [Google Scholar]
- Hout, M. (2018). Americans’ occupational status reflects the status of both of their parents. Proceedings of the National Academy of Sciences of the United States of America, 115(38), 9527–9532. 10.1073/pnas.1802508115 [DOI] [PMC free article] [PubMed] [Google Scholar]
- Hout, M. , Smith, T. W. , & Marsden, P. V. (2016). Prestige and socioeconomic scores for the 2010 census codes. NORC. [Google Scholar]
- Jacobs, J. , Agho, K. , Stevens, G. , & Raphael, B. (2012). Do childhood adversities cluster in predictable ways? A systematic review. Vulnerable Children and Youth Studies, 7(2), 103–115. 10.1080/17450128.2012.658886 [DOI] [Google Scholar]
- McLaughlin, K. A. , Weissman, D. , & Bitrán, D. (2019). Childhood adversity and neural development: A aystematic review. Annual Review of Developmental Psychology, 1(1), 277–312. 10.1146/annurev-devpsych-121318-084950 [DOI] [PMC free article] [PubMed] [Google Scholar]
- Miller, P. H. , Baxter, S. D. , Hitchcock, D. B. , Royer, J. A. , Smith, A. F. , & Guinn, C. H. (2014). Test–retest reliability of a short form of the children’s social desirability scale for nutrition and health‐related research. Journal of Nutrition Education and Behavior, 46(5), 423–428. 10.1016/j.jneb.2013.11.002 [DOI] [PMC free article] [PubMed] [Google Scholar]
- Miller‐Cotto, D. , Smith, L. V. , Wang, A. H. , & Ribner, A. D. (2021). Changing the conversation: A culturally responsive perspective on executive functions, minoritized children and their families. Infant and Child Development, 31(1). 10.1002/icd.2286 [DOI] [Google Scholar]
- Mittal, C. , Griskevicius, V. , Simpson, J. A. , Sung, S. , & Young, E. S. (2015). Cognitive adaptations to stressful environments: When childhood adversity enhances adult executive function. Journal of Personality and Social Psychology, 109(4), 604–621. 10.1037/pspi0000028 [DOI] [PubMed] [Google Scholar]
- Miyake, A. , & Friedman, N. P. (2012). The nature and organization of individual differences in executive functions: Four general conclusions. Current Directions in Psychological Science, 21(1), 8–14. 10.1177/0963721411429458 [DOI] [PMC free article] [PubMed] [Google Scholar]
- Miyake, A. , Friedman, N. P. , Emerson, M. J. , Witzki, A. H. , Howerter, A. , & Wager, T. D. (2000). The unity and diversity of executive functions and their contributions to complex “frontal lobe” tasks: A latent variable analysis. Cognitive Psychology, 41(1), 49–100. 10.1006/cogp.1999.0734 [DOI] [PubMed] [Google Scholar]
- Muskens . (2019). Hidden obstacles in education for students from low socioeconomic backgrounds [PhD thesis]. 10.26481/dis.20191115mm [DOI] [Google Scholar]
- Nketia, J. , Amso, D. , & Brito, N. H. (2021). Towards a more inclusive and equitable developmental cognitive neuroscience. Developmental Cognitive Neuroscience, 52, 101014. 10.1016/j.dcn.2021.101014 [DOI] [PMC free article] [PubMed] [Google Scholar]
- Noble, K. G. , McCandliss, B. D. , & Farah, M. J. (2007). Socioeconomic gradients predict individual differences in neurocognitive abilities. Developmental Science, 10(4), 464–480. 10.1111/j.1467-7687.2007.00600.x [DOI] [PubMed] [Google Scholar]
- Nweze, T. , Nwoke, M. B. , Nwufo, J. I. , Aniekwu, R. I. , & Lange, F. (2021). Working for the future: Parentally deprived Nigerian children have enhanced working memory ability. Journal of Child Psychology and Psychiatry, and Allied Disciplines, 62(3), 280–288. 10.1111/jcpp.13241 [DOI] [PubMed] [Google Scholar]
- Pechtel, P. , & Pizzagalli, D. A. (2011). Effects of early life stress on cognitive and affective function: An integrated review of human literature. Psychopharmacology (Berl), 214(1), 55–70. 10.1007/s00213-010-2009-2 [DOI] [PMC free article] [PubMed] [Google Scholar]
- Piff, P. K. , Kraus, M. W. , & Keltner, D. (2018). Unpacking the inequality paradox: The psychological roots of inequality and social class. In Olson J. M. (Ed.), Advances in experimental social psychology (Vol. 57, pp. 53–124). Academic Press. 10.1016/bs.aesp.2017.10.002 [DOI] [Google Scholar]
- Pollak, S. D. (2008). Mechanisms linking early experience and the emergence of emotions: Illustrations from the study of maltreated children. Current Directions in Psychological Science, 17(6), 370–375. 10.1111/j.1467-8721.2008.00608.x [DOI] [PMC free article] [PubMed] [Google Scholar]
- Pollak, S. D. , Messner, M. , Kistler, D. J. , & Cohn, J. F. (2009). Development of perceptual expertise in emotion recognition. Cognition, 110(2), 242–247. 10.1016/j.cognition.2008.10.010 [DOI] [PMC free article] [PubMed] [Google Scholar]
- R Core Team . (2020). R: A language and environment for statistical computing. R Foundation for Statistical Computing. https://www.R‐project.org/ [Google Scholar]
- Red Team Market . (2021). Build trust through criticism. https://redteammarket.com/ [Google Scholar]
- Reuben, A. , Moffitt, T. E. , Caspi, A. , Belsky, D. W. , Harrington, H. , Schroeder, F. , Hogan, S. , Ramrakha, S. , Poulton, R. , & Danese, A. (2016). Lest we forget: Comparing retrospective and prospective assessments of adverse childhood experiences in the prediction of adult health. Journal of Child Psychology and Psychiatry, 57(10), 1103–1112. 10.1111/jcpp.12621 [DOI] [PMC free article] [PubMed] [Google Scholar]
- Richardson, K. (1991). Reasoning with raven—In and out of context. British Journal of Educational Psychology, 61, 129–138. 10.1111/j.2044-8279.1991.tb00969.x [DOI] [Google Scholar]
- Rifkin‐Graboi, A. , Goh, S.‐K.‐Y. , Chong, H. J. , Tsotsi, S. , Sim, L. W. , Tan, K. H. , Chong, Y. S. , & Meaney, M. J. (2021). Caregiving adversity during infancy and preschool cognitive function: Adaptations to context? Journal of Developmental Origins of Health and Disease, 12(6), 890–901. 10.1017/S2040174420001348 [DOI] [PubMed] [Google Scholar]
- Rogoff, B. , Coppens, A. D. , Alcala, L. , Aceves‐Azuara, I. , Ruvalcaba, O. , Lopez, A. , & Dayton, A. (2017). Noticing learners’ strengths through cultural research. Perspectives on Psychological Science, 12(5), 876–888. 10.1177/1745691617718355 [DOI] [PubMed] [Google Scholar]
- Sheridan, M. A. , & McLaughlin, K. A. (2014). Dimensions of early experience and neural development: Deprivation and threat. Trends in Cognitive Sciences, 18(11), 580–585. 10.1016/j.tics.2014.09.001 [DOI] [PMC free article] [PubMed] [Google Scholar]
- Shoda, T. M. , & McConnell, A. R. (2013). Interpersonal sensitivity and self‐knowledge: Those chronic for trustworthiness are more accurate at detecting it in others. Journal of Experimental Social Psychology, 49(3), 440–443. 10.1016/j.jesp.2012.12.011 [DOI] [Google Scholar]
- Simonsohn, U. , Simmons, J. P. , & Nelson, L. D. (2020). Specification curve analysis. Nature Human Behaviour, 4(11), 1208–1214. 10.1038/s41562-020-0912-z [DOI] [PubMed] [Google Scholar]
- Smith, K. E. , & Pollak, S. D. (2021). Rethinking concepts and categories for understanding the neurodevelopmental effects of childhood adversity. Perspectives on Psychological Science, 16(1), 67–93. 10.1177/1745691620920725 [DOI] [PMC free article] [PubMed] [Google Scholar]
- Steegen, S. , Tuerlinckx, F. , Gelman, A. , & Vanpaemel, W. (2016). Increasing transparency through a multiverse analysis. Perspectives on Psychological Science, 11(5), 702–712. 10.1177/1745691616658637 [DOI] [PubMed] [Google Scholar]
- Sternberg, R. J. , Nokes, C. , Geissler, P. W. , Prince, R. , Okatcha, F. , Bundy, D. A. , & Grigorenko, E. L. (2001). The relationship between academic and practical intelligence: A case study in Kenya. Intelligence, 29(5), 401–418. 10.1016/S0160-2896(01)00065-4 [DOI] [Google Scholar]
- Tottenham, N. , Tanaka, J. W. , Leon, A. C. , McCarry, T. , Nurse, M. , Hare, T. A. , Marcus, D. J. , Westerlund, A. , Casey, B. J. , & Nelson, C. (2009). The NimStim set of facial expressions: Judgments from untrained research participants. Psychiatry Research, 168(3), 242–249. 10.1016/j.psychres.2008.05.006 [DOI] [PMC free article] [PubMed] [Google Scholar]
- Unsworth, N. , & Engle, R. W. (2008). Speed and accuracy of accessing information in working memory: An individual differences investigation of focus switching. Journal of Experimental Psychology: Learning, Memory, and Cognition, 34(3), 616–630. 10.1037/0278-7393.34.3.616 [DOI] [PubMed] [Google Scholar]
- Unsworth, N. , Fukuda, K. , Awh, E. , & Vogel, E. K. (2015). Working memory delay activity predicts individual differences in cognitive abilities. Journal of Cognitive Neuroscience, 27(5), 853–865. 10.1162/jocn_a_00765 [DOI] [PMC free article] [PubMed] [Google Scholar]
- Ursache, A. , & Noble, K. G. (2016). Neurocognitive development in socioeconomic context: Multiple mechanisms and implications for measuring socioeconomic status. Psychophysiology, 53(1), 71–82. 10.1111/psyp.12547 [DOI] [PMC free article] [PubMed] [Google Scholar]
- VanTassel‐Baska, J. (2018). Achievement unlocked: Effective curriculum interventions with low‐income students. Gifted Child Quarterly, 62(1), 68–82. 10.1177/0016986217738565 [DOI] [Google Scholar]
- Young, E. S. , Frankenhuis, W. E. , & Ellis, B. J. (2020). Theory and measurement of environmental unpredictability. Evolution and Human Behavior, 41(6), 550–556. 10.1016/j.evolhumbehav.2020.08.006 [DOI] [Google Scholar]
- Young, E. S. , Griskevicius, V. , Simpson, J. A. , Waters, T. E. A. , & Mittal, C. (2018). Can an unpredictable childhood environment enhance working memory? Testing the sensitized‐specialization hypothesis. Journal of Personality and Social Psychology, 114(6), 891–908. 10.1037/pspi0000124 [DOI] [PubMed] [Google Scholar]
- Zuilkowski, S. S. , McCoy, D. C. , Serpell, R. , Matafwali, B. , & Fink, G. (2016). Dimensionality and the development of cognitive assessments for children in Sub‐Saharan Africa. Journal of Cross‐Cultural Psychology, 47(3), 341–354. 10.1177/0022022115624155 [DOI] [Google Scholar]
Associated Data
This section collects any data citations, data availability statements, or supplementary materials included in this article.
Supplementary Materials
Supplementary Material