

Abstract
Aim
To investigate temporal trends in birth prevalence, disability severity, and motor type for singletons with prenatal or perinatally acquired cerebral palsy (CP).
Method
Numerator data, number of children with CP born a singleton between 1995 and 2014, confirmed at 5 years of age, were drawn from three state registers with population‐level ascertainment. Birth prevalence estimates and 95% confidence intervals (CI) were calculated per 1000 singleton live births for the three states combined, overall, by gestational age group, by dichotomized disability severity, and spastic laterality. Poisson regression models were used to analyse trends. Using data from all eight registers, trends in the proportional distribution of CP subtypes overall and stratified by gestational age were examined.
Results
Birth prevalence of CP declined from 1.8 (95% CI 1.6–2.0) in 1995 to 1996 to 1.2 (95% CI 1.1–1.4) in 2013 to 2014 (average 5% per 2‐year epoch, p < 0.001). Declines in birth prevalence were observed across all gestational age groups with the largest decline in children born at <28 weeks (average 8% per epoch, p < 0.001). Prevalence of moderate‐severe disability declined for children born at <28 and ≥37 weeks (average 11% and 7% per epoch respectively, p < 0.001). The proportions of bilateral spastic CP declined (p < 0.001) at <28 weeks (p = 0.014) and ≥37 weeks (p < 0.001). The proportion of children with dyskinesia increased (28–31 weeks: p = 0.021, 32–36 weeks: p = 0.001, and ≥37 weeks: p < 0.001).
Interpretation
Birth prevalence of CP and moderate‐severe disability (<28 and ≥37 weeks) declined in Australian singletons between 1995 and 2014, reflecting changes in prenatal and perinatal care over time.
What this paper adds
Declines in birth prevalence of prenatal or perinatally acquired cerebral palsy were observed for singletons born in Australia between 1995 and 2014.
These declines were evident across all gestational age groups.
Declines in birth prevalence of moderate‐severe disability were observed for children born at <28 weeks and ≥37 weeks.
This original article is commented on by Villamor on pages 1054–1055 of this issue.

Abbreviations
- ACPR
Australian Cerebral Palsy Register
Cerebral palsy (CP) is a lifelong disorder of movement and posture resulting from maldevelopment or insult to the developing brain. 1 Recent estimates of birth prevalence range from 1.4 per 1000 live births in some high‐income settings to 3.2 per 1000 children in low‐income countries. 2 , 3 Whilst the causal pathways to CP are complex and often not fully understood, CP is commonly subclassified based on the known or assumed timing of brain injury as prenatally, perinatally, or postneonatally acquired CP.
The site, timing, and extent of the brain injury or maldevelopment that results in the motor disorder of CP are specific to each person. This results in heterogeneity in the type, topography, and severity of the motor disorder and the frequency of concomitant medical conditions. Changes in demographics, public health practices, and antenatal, intrapartum, and neonatal care have the potential to change the prevalence and phenotype of CP at the population level. 4 Clinicians, individuals with CP and their families, epidemiologists, and other researchers are, therefore, interested in understanding changes in the birth prevalence of CP, the severity of disability over time, and the factors that drive these changes. CP registers, which aim to collect data for all children with CP at a specific age and within a specified geographic region, provide a unique opportunity to investigate temporal trends in this population and measure the outcome of changes in practice in the real‐world setting.
International CP registers and register networks have recently reported significant declines in the overall birth prevalence of CP in Australia (1995–2009), Victoria (1983–2009), Europe (1980–2003), and Japan (1988–2007), with accompanying declines in the severity of disability in some gestational age groups. 5 , 6 , 7 , 8 New CP register data provide an opportunity to investigate whether these declines have continued in subsequent birth years in Australia. We restricted our data to singleton births which account for approximately 88% of all prenatal or perinatally acquired CP. 2 Infants born as part of a multiple birth have risk factors unique to such births. In a recent collaborative study with our European colleagues, we reported a decline in the prevalence of CP among twins in Europe and Australia. 9 Our specific aim in the current study was to use Australian Cerebral Palsy Register (ACPR) data for singletons with prenatal or perinatally acquired CP, across birth years 1995 to 2014 to investigate temporal trends in (1) birth prevalence and (2) severity of disability, gross motor function, and motor type, stratified by gestational age.
METHOD
The ACPR is a data repository used to study CP epidemiology and aetiology; it provides a means of evaluating the effectiveness of interventions and population trends using real‐world data. The ACPR was developed, and continues to exist, as a result of an ongoing collaboration between custodian organizations of CP registers from all Australian states and territories. Each state/territory CP register collects an agreed minimum set of data for children with CP born in their jurisdiction. The ACPR allows any definition of CP that includes the following five key elements, as described by the Surveillance of Cerebral Palsy in Europe: that CP (1) is an umbrella term for a group of disorders; (2) is a condition that is permanent but not unchanging; (3) involves a disorder of movement and/or posture and of motor function; (4) is caused by a non‐progressive interference, lesion, or abnormality; and (5) the interference, lesion, or abnormality originates in the immature brain. 10 Registers use multiple ascertainment sources to collect CP data, including hospital records, state‐wide data sets, clinician assessments, and family reports. The appropriateness of the CP diagnosis is verified, and clinical information updated when children reach 5 years of age; this snapshot at 5 years is used in all subsequent analyses.
Ethics
Each state and territory CP register has ethics approval to upload deidentified data to the ACPR database every 2 years. 11 Ethical oversite for the ACPR (2020/463) is held by The University of Sydney Human Research Ethics Committee and the Aboriginal Health and Medical Research Council (1388/18).
Study cohort
The study cohort included all singletons with CP that were born in Australia between 1995 and 2014 and were included on the ACPR at the time of the most recent state/territory data provision (July 2020). Register data are confirmed by the relevant state/territory register when children reach 5 years of age. If a child dies before their fifth birthday and their CP diagnosis had been confirmed, their data is still included. A singleton birth was defined as a single live birth of a fetus beyond 20 weeks’ gestation. Children with an identified postneonatal cause (brain injury after 28 days and before 2 years) were excluded. Data from all eight state/territory registers were included for descriptive analyses of the population with CP. Numerator data for birth prevalence analyses were limited to data from the three long‐standing state registers (South Australia, Victoria, and Western Australia) where researchers were confident that CP cases were consistently and near‐completely ascertained across the whole period. These registers will henceforth be referred to as having ‘total population ascertainment’. Together, these three states represent 42% of the total Australian population.
Study variables
Birth years were aggregated and reported for 10 2‐year epochs. Socioeconomic advantage/disadvantage was described using the Socio‐Economic Indexes for Areas 12 quintiles (1 = least advantaged and 5 = most advantaged). Maternal age was reported as <20 years, 20 to 34 years, ≥35 years, sex as male or female, and gestational age as <28 weeks, 28 to 31 weeks, 32 to 36 weeks, and ≥37 weeks. Small for gestational age was defined as birthweight below the 10th centile for gestational age and sex using Australian birthweight centiles for singleton births. 13 The predominant CP subtype at 5 years was classified according to the predominant motor type: spastic, ataxic, dyskinetic, or hypotonic, and by topography of spasticity as unilateral or bilateral. The remaining clinical variables were dichotomized as follows: Gross Motor Function Classification System (GMFCS) 14 as levels I to II versus III to V; intellect as no/borderline/mild impairment (IQ≥50) versus moderate‐severe impairment (IQ<50); speech as no/mild impairment versus non‐verbal; hearing as no/mild impairment versus deaf; and vision as no/mild impairment versus functionally blind. Severity of disability was also dichotomized based on a published methodology 7 whereby children with moderate‐severe intellectual impairment (IQ<50) and/or in GMFCS levels III to V at 5 years of age were classified as having moderate‐severe disability, and those with no/borderline/mild intellectual impairment (IQ≥50) and/or in GMFCS levels I to II were categorized as having mild disability. Data for the denominators (singleton live births 1995–2014) were obtained from the Australian Institute of Health and Welfare. 15
Statistical analyses
Numbers and percentages were used to describe the demographic and clinical characteristics of CP for each state/territory register and for all registers combined. 2 goodness of fit testing was used to compare proportional data from all state/territory CP registers with those from states with total population ascertainment. State/territory variable data were excluded from the analysis if they contained >20% missing data. The combined birth prevalence for South Australia, Victoria, and Western Australia – states with total population ascertainment – was calculated. The numerator was the count of eligible children with CP (as described above) born in these states for each epoch and included in these registers. The denominator was a count of all live‐born singletons born in these states during each epoch. Birth prevalence for each epoch was calculated as the ratio of the numerator to denominator expressed as the number of cases per 1000 singleton live births together with 95% confidence intervals (CI) around each estimate. To analyse temporal trends, a Poisson regression model was used with the described count as the outcome variable and including an offset term to account for differences in denominators across registers. Stratified by gestational age group, birth prevalence with 95% CIs pertaining to severity and spastic laterality were calculated per 1000 live births.
To compare changes in the proportional distribution of motor types stratified by gestational age, data from all states and territories were included in the analyses with birth years collapsed into five 4‐year epochs (1995–1998; 1999–2002; 2003–2006; 2007–2010, 2011–2014). Binary logistic regression was used to investigate any changes in proportions of motor types over time. Analysis was completed using IBM SPSS Statistics for Windows, version 27.0 (IBM Corp., Armonk, NY, USA).
RESULTS
The ACPR held data on a total of 7054 singletons with prenatal or perinatally acquired CP born in Australia between 1995 and 2014 (Table S1). The majority of children (74%) were born to mothers aged 20 to 34 years, with approximately 5% born to mothers <20 years and a further 20% to those ≥35 years. Socio‐Economic Indexes for Areas data were spread relatively evenly across all five quintiles from the least to most socioeconomically advantaged. Most children (>60%) were born at term (≥37 weeks’ gestation). The proportions of children born small for gestational age were higher than the 10% expected from population centiles across all gestational age groups. At 5 years of age, spasticity was the most common predominant motor type with approximately 50% having bilateral spastic CP. Most children were independently ambulant (>60%, GMFCS levels I–II), and had no/borderline/mild intellectual impairment (approximately 80%), no/mild speech impairment (>70%), no/mild vision or hearing impairments (>95%), and no epilepsy (approximately 70%) (Table S1).
Temporal trends in CP birth prevalence and severity
Using data (n = 3726) from three state registers with total population‐level ascertainment, we observed a significant decline in the birth prevalence of CP: an average drop of 5% per 2‐year birth epoch (p < 0.001). This translated to a decline in prenatal or perinatally acquired CP birth prevalence from 1.8 (95% CI 1.6–2.0) to 1.2 (95% CI 1.1–1.4) per 1000 live births from 1995 to 1996 and 2013 to 2014 (Figure 1a, Table S2).
FIGURE 1.
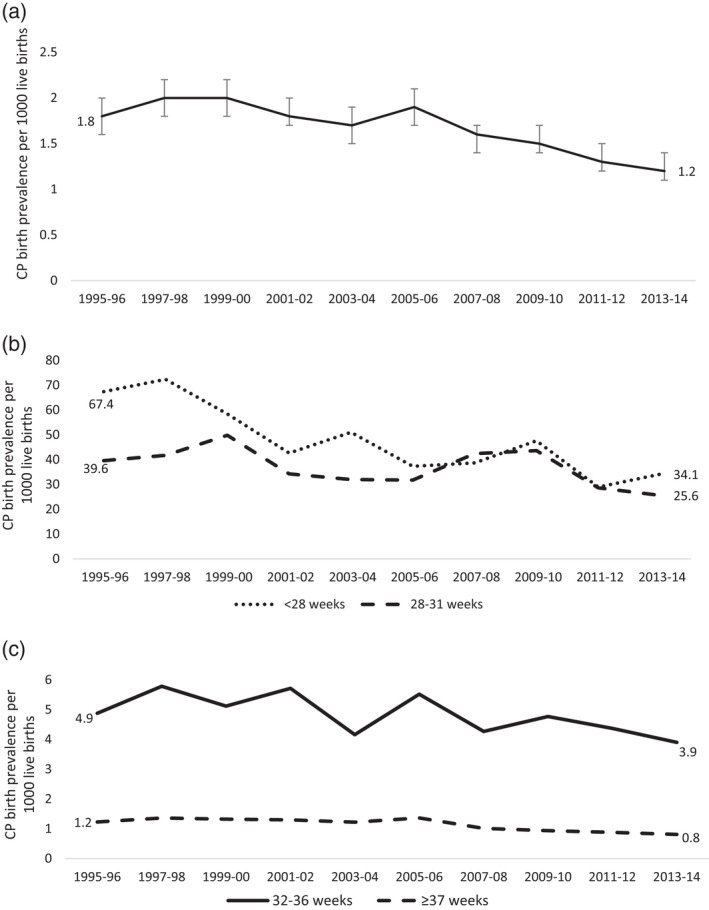
(a) Prenatal or perinatal singleton cerebral palsy (CP) birth prevalence per 1000 live births with 95% confidence intervals, South Australia, Victoria, and Western Australia combined, 1995–2014. (b) Prenatal or perinatal singleton CP birth prevalence per 1000 live births by gestational age group, and birth period, South Australia, Victoria, and Western Australia combined, 1995–2014. (c) Prenatal or perinatal singleton CP birth prevalence per 1000 live births by gestational age group, and birth period, South Australia, Victoria, and Western Australia combined, 1995–2014
Trends by gestational age at delivery
Gestational age data were available for 3703 (99%) children, and analysis of temporal trends from 1995 to 1996 and 2013 to 2014 revealed significant declines in CP birth prevalence across all gestational age groups (Figure 1b and c).
Children with CP born at <28 weeks (n = 365) accounted for 10% of all CP cases and had the highest CP birth prevalence. CP birth prevalence declined by an average of 8% per epoch (p < 0.001), from 67.4 (95% CI 50.6–89.2) to 34.1 (95% CI 23.9–48.6) per 1000 live births in the periods 1995 to 1996 and 2013 to 2014. Declining trends were observed in the prevalence of both mild and moderate‐severe disability and were particularly obvious in the subgroup with bilateral spastic CP (all p < 0.05). There was no discernible linear trend in the prevalence of unilateral spastic CP (Figure 2, Table S3).
FIGURE 2.

Prenatal or perinatal singleton cerebral palsy birth prevalence per 1000 live births by gestational age group, and birth epoch and (a) severity of disability and (b) laterality of spasticity, South Australia, Victoria, and Western Australia combined, 1995–2014. BSCP, bilateral spastic cerebral palsy; USCP, unilateral spastic cerebral palsy
Children born at 28 to 31 weeks (n = 434) accounted for 12% of all CP cases. Here, CP birth prevalence declined by an average of 4% per epoch (p = 0.025), from 39.6 (95% CI 29.5–52.9) to 25.6 (95% CI 18.4–35.6) per 1000 live births during 1995 to 1996 and 2013 to 2014 (Figure 1b). The prevalence of severity and spastic topography subgroups fluctuated. On visual inspection there were declines in all groups over the period, however, these declines were not statistically significant (Figure 2; Table S3).
There were 549 children born at 32 to 36 weeks, accounting for 15% of all CP cases. A declining trend in birth prevalence by an average of 3% per birth epoch (p = 0.038) was observed, from 4.9 (95% CI 3.7–6.5) to 3.9 (95% CI 3.0–5.0) per 1000 live births in the years 1995 to 1996 and 2013 to 2014 (Figure 1b). The prevalence of mild and moderate‐severe disability fluctuated over time. Observable declines in both unilateral and bilateral spastic CP were not statistically significant (Figure 2, Table S3).
The largest group of children with CP, those born ≥37 weeks (n = 2355), accounted for 63% of all CP cases. In this group, the birth prevalence of CP declined by an average of 5% per epoch (p < 0.001), from 1.2 (95% CI 1.1–1.4) to 0.8 (95% CI 0.7–0.9) per 1000 live births over the study period. Significant declines were observed in the prevalence of both severity subgroups (both p < 0.001) and in the prevalence of unilateral and bilateral spasticity. Unilateral spastic CP declined from 0.6 to 0.4 per 1000 live births (p = 0.003) and bilateral spastic CP from 0.5 to 0.4 per 1000 live births (p < 0.001; Figure 2 and Table S3).
Predominant CP subtype at age 5 years
All 7054 singletons with prenatal or perinatally acquired CP from Australian state and territory CP registers were included in the analysis of predominant CP type and spastic topography at age 5 years. Between 1995 to 1998 and 2011 to 2014 there was a significant decline in the proportion of children described as having bilateral spastic CP (52% to 44%, p < 0.001) and ataxia (5% to 3%, p < 0.001). Conversely, we saw increasing proportions of children with dyskinesia (7% to 13%, p < 0.001) and hypotonia (2% to 5%, p < 0.001) over time (Table 1).
TABLE 1.
Predominant motor type and spastic topography of singletons with prenatal or perinatally acquired cerebral palsy (CP) for all states and territories, 1995–2014
|
1995–1998 n (%) |
1999–2002 n (%) |
2003–2006 n (%) |
2007–2010 n (%) |
2011–2014 n (%) |
p a | |
|---|---|---|---|---|---|---|
| All children with CP, n | 1403 | 1423 | 1484 | 1512 | 1232 | |
| Spastic | 1161 (85.6) | 1173 (83.7) | 1211 84.7) | 1232 83.8) | 892 (78.6) | |
| Unilateral | 454 (33.5) | 484 (34.5) | 498 (34.8) | 530 (36.0) | 387 (34.1) | 0.947 |
| Bilateral | 707 (52.1) | 689 (49.2) | 713 (49.9) | 702 (47.7) | 505 (44.5) | <0.001 |
| Dyskinetic | 95 (7.0) | 112 (8.0) | 123 (8.6) | 133 (9.0) | 152 (13.4) | <0.001 |
| Ataxic | 75 (5.5) | 78 (5.6) | 63 (4.4) | 53 (3.6) | 35 (3.1) | <0.001 |
| Hypotonic | 26 (1.9) | 38 (2.7) | 33 (2.3) | 53 (3.6) | 56 (4.9) | <0.001 |
| Unknown | 46 (3.3) | 22 (1.5) | 54 (3.6) | 41 (2.7) | 97 (7.9) | |
| <28 weeks | ||||||
| Spastic | 156 (92.3) | 118 (88.1) | 119 (87.5) | 120 (87.0) | 77 (89.5) | |
| Unilateral | 35 (20.7) | 36 (26.9) | 26 (19.1) | 38 (27.5) | 26 (30.2) | 0.186 |
| Bilateral | 121 (71.6) | 82 (61.2) | 93 (68.4) | 82 (59.4) | 51 (59.3) | 0.014 |
| Dyskinetic | 5 (3.0) | 7 (5.2) | 9 (6.6) | 8 (5.8) | (3.5) | 0.582 |
| Ataxic | 7 (4.1) | 8 (6.0) | 5 (3.7) | 7 (5.1) | 5 (5.8) | 0.772 |
| Hypotonic | (0.6) b | (0.7) b | (2.2) b | (1.2) b | (1.2) b | 0.334 |
| Unknown | (2.3) b | (0.7) b | 6 (4.2) | (0.7) b | 8 (8.5) | |
| 28–31 weeks | ||||||
| Spastic | 147 (95.5) | 148 (93.1) | 132 (95.0) | 195 (94.2) | 112 (88.9) | |
| Unilateral | 39 (25.3) | 41 (25.8) | 23 (16.5) | 51 (24.6) | 25 (19.8) | 0.218 |
| Bilateral | 108 (70.1) | 107 (67.3) | 109 (78.4) | 144 (69.6) | 87 (69.0) | 0.517 |
| Dyskinetic | (2.6) b | 6 (3.8) | (2.9) b | 7 (3.4) | 13 (10.3) | 0.021 |
| Ataxic | (1.9) b | (1.9) b | (0.7) b | (1.0) b | (0.0) b | 0.098 |
| Hypotonic | (0.0) b | (1.3) b | (1.4) b | (1.4) b | (0.8) b | 0.461 |
| Unknown | (2.5) b | (0.6) b | (2.8) b | (0.5) b | 13 (9.4) | |
| 32–36 weeks | ||||||
| Spastic | 160 (90.4) | 173 (85.6) | 174 (88.3) | 192 (87.3) | 153 (82.3) | |
| Unilateral | 62 (35.0) | 70 (34.7) | 70 (35.5) | 76 (34.5) | 59 (31.7) | 0.291 |
| Bilateral | 98 (55.4) | 103 (51.0) | 104 (52.8) | 116 (52.7) | 94 (50.5) | 0.197 |
| Dyskinetic | 6 (3.4) | 11 (5.4) | 11 (5.6) | 17 (7.7) | 23 (12.4) | 0.001 |
| Ataxic | 8 (4.5) | 9 (4.5) | 6 (3.0) | 5 (2.3) | (0.5) b | 0.008 |
| Hypotonic | (1.7) b | 9 (4.5) | 6 (3.0) | 6 (2.7) | 9 (4.8) | 0.382 |
| Unknown | (1.7) b | 5 (2.4) | 13 (6.2) | 8 (3.5) | 17 (8.4) | |
| ≥37 weeks | ||||||
| Spastic | 665 (81.5) | 707 (80.6) | 750 (81.8) | 708 (80.6) | 531 (74.3) | |
| Unilateral | 305 (37.4) | 323 (36.8) | 365 (39.8) | 359 (40.9) | 265 (37.1) | 0.955 |
| Bilateral | 360 (44.1) | 384 (43.8) | 385 (42.0) | 349 (39.7) | 266 (37.2) | <0.001 |
| Dyskinetic | 75 (9.2) | 88 (10.0) | 96 (10.5) | 95 (10.8) | 113 (15.8) | <0.001 |
| Ataxic | 55 (6.7) | 57 (6.5) | 49 (5.3) | 36 (4.1) | 28 (3.9) | <0.001 |
| Hypotonic | 21 (2.6) | 25 (2.9) | 22 (2.4) | 39 (4.4) | 43 (6.0) | <0.001 |
| Unknown | 26 (3.1) | 11 (1.3) | 27 (2.8) | 27 (3.0) | 56 (7.3) | |
p‐values in bold are statistically significant.
p‐values from binary logistic regression, investigating change in proportions over time.
n < 5.
The proportion of children described as having predominantly bilateral spastic CP significantly declined between 1995 to 1998 and 2011 and 2014 in two gestational age groups. Within the subgroup born at <28 weeks, the proportion dropped from 72% to 59% (p = 0.014), and in those born at term the proportion decreased from 44% to 37% (p < 0.001). Except for children born at <28 weeks, the proportion of children with predominantly dyskinetic CP significantly increased over time in each gestational age group (28–31 weeks: 3% to 10%, p = 0.021; 32–36 weeks: 3% to 12%, p = 0.001; and ≥37 weeks: 9% to 16%, p < 0.001; Table 1).
DISCUSSION
In our previous publications, the ACPR Group reported a significant declining trend in birth prevalence of prenatal or perinatally acquired CP (1995–2009). 6 In this new study, we investigated birth prevalence of prenatal or perinatally acquired CP, limited to singletons, born from 1995 and extending to 2014. Declines were observed in total CP birth prevalence and across all gestational age groups, with the largest declines observed amongst children born at <28 weeks’ and ≥37 weeks’ gestation. These findings demonstrate the cumulative impact of a range of interventions that support maternal and perinatal well‐being. 4 , 5 , 16 , 17
The decline in CP birth prevalence for singletons born at ≥37 weeks’ gestation is encouraging, particularly as this is the largest group, proportionally accounting for 63% of the cohort. Declines in CP birth prevalence for term‐born/normal birthweight children have been reported for earlier birth years in Australia (1995–2007), 6 Victoria (1983–2009), 5 Sweden (2007–2010), 18 and Europe (1980–2003). 7 It will be interesting to see whether similar declines in these more recent birth years are observed by surveillance programmes in other comparable high‐income countries.
In recent research from Europe that investigated trends amongst children with CP (singletons and multiples born preterm, birth years 2004–2010), the authors identified significant declines in birth prevalence of CP 2004 to 2009, for those born at 32 to 36 weeks’ gestation and 28 to 31 weeks’ gestation but not for children born at <28 weeks’ gestation. 19 The declining trend in CP prevalence for children born at <28 weeks’ gestation reported in Australia pertained to singletons born in the period 1995 to 2014. Limiting our data to 2005 to 2010, to more closely align with the birth years reported in the European study, on visual inspection, no declining trend is evident. So, the differences reported may be explained by the abbreviated birth years included in the European study. Furthermore, the inclusion of multiple births and the challenges inherent in studying small subgroups over multiple time points, may also have contributed to the variability, as suggested by the authors. 19 Finally, it is likely that the birth prevalence of children with CP born at <28 weeks will fluctuate over time in response to ongoing changes in interventions trialled and received within the neonatal intensive care unit environment. 16 , 20 As more infants survive at earlier gestational ages, fluctuations in prevalence may also be observed with an initial increase in the prevalence of CP in children who survive, as observed historically. 21 , 22 CP registers, therefore, have an important role in completing the feedback loop to clinicians and researchers, describing the impact of new and emerging interventions at the population level.
This study also investigated trends in the prevalence of mild and moderate‐severe disability. Prevalence of moderate‐severe disability was observed to show a statistically significant decline for children born at <28 weeks and those born at term. Whilst on visual inspection declining trajectories were also observed for moderate‐severe disability amongst children born at 28 to 31 weeks, this decline did not reach statistical significance. Similarly, there was no statistically significant reduction in the proportion of bilateral spastic CP for children in either the 28 to 31 weeks or 32 to 36 weeks’ gestational age groups. Further research is required to better understand the nature of change in moderate‐severe disability in these groups.
Dyskinetic CP, which can frequently co‐occur with spasticity and other motor types, 2 , 23 , 24 was found to be the predominant motor type for <10% of singletons with CP. Dyskinetic CP is most commonly associated with term and near‐term birth and with a range of risk factors that include perinatal sentinel events, hypoxic‐ischaemic encephalopathy, and hyperbilirubinemia. 25 , 26 In this study, the small number of cases precluded meaningful analysis of trends in birth prevalence of dyskinetic CP; however, we did observe an increase in the frequency and proportion of children described with predominant dyskinetic CP, at which time the total number of singleton children with CP had declined. Increasing trends in the prevalence of dyskinetic CP have previously been reported in Europe (1976–1996), at a time when there was an increase in the number of children born with normal birthweight and lower rates of neonatal mortality, 26 and before the introduction of cooling for infants with hypoxic‐ischaemic encephalopathy. In more recent years, data from Sweden have shown that following an increase in the prevalence of dyskinetic CP, which peaked in the early 2000s, a significant decline has since been observed. 18 The cause(s) of this increase in the proportion of dyskinetic CP in our Australian data are unclear. It is possible that as yet unidentified aetiological factors are at play, however, we believe improved clinical identification of dyskinesia in children with CP may also have contributed to this finding. There has been considerable focus on dyskinetic CP in Australia in the last decade. This has been demonstrated by the development of resources such as The Identification and Measurement of Dyskinesia in Children with Cerebral Palsy: A toolkit for clinicians 27 , 28 , 29 that has highlighted important screening, 30 as well as classification tools (https://cpregister.com/wp‐content/uploads/2020/03/CP‐Description‐Form‐Version‐IV‐21Feb2020.pdf). These knowledge translation strategies have improved knowledge and awareness of the identification of children with dyskinetic CP, which may account for at least part of the observed increase in the proportion of children with dyskinetic CP.
One of the strengths of this study is the use of the ACPR data set. This large deidentified data set provides nationwide population data collected over time, making it possible to investigate temporal trends in birth prevalence with minimal selection bias. Access to new denominator data in 2‐year birth cohorts has expanded the utility of the ACPR data set. By limiting our trends data to that of the three long‐standing CP state registers that are considered to have total population ascertainment, we have confidence in these findings. In the coming years, the remaining states/territories with more recently established CP registers will reach population‐level ascertainment, allowing us to complete analyses of CP prevalence for the whole country.
This study has prompted the ACPR Group to reflect again on the definition of ‘singleton’ used by CP registers. In the ACPR data set, plurality is pragmatically described by the number of live births/fetuses that remain in utero at 20 weeks’ gestation and that are subsequently born separately. Therefore, in the case of multiple pregnancies, a child is only recorded with a multiple birth plurality if there was more than one live birth at or after 20 weeks’ gestation (or a birthweight of ≥400g). As such, there are likely to be a small number of ‘singletons’ included in this paper born from a multiple pregnancy with an early (<20 weeks) co‐fetal loss. To properly account for the increased risk of CP associated with death of a co‐fetus 31 in future studies, the ACPR Group has recently added a new data point for co‐fetal death of a multiple (≥20 weeks) to the minimum data set. The ACPR Group is also trialling the collection of co‐fetal loss (<20 weeks) data, however systematic identification of early co‐fetal loss is extremely difficult to achieve at the population level.
In conclusion, this research identified a decline in birth prevalence of prenatal or perinatally acquired CP amongst singletons, and in moderate‐severe disability for children born at <28 weeks and ≥37 weeks gestational age. Ongoing surveillance by Australian CP registers is required to continue to monitor and report changes in birth prevalence. By working in collaboration with clinicians, epidemiologists, and families, register programmes make an important contribution to our understanding of the prevalence and severity of CP, including the ‘real‐world’ impact of changes in population demographics and clinical practice. Furthermore, the ACPR Group will continue to partner with CP surveillance programmes and networks in high‐income 32 and low‐middle income settings 3 , 33 , 34 to compare findings, to work collaboratively towards shared research goals, and to support the work of CP register and surveillance programs.
Supporting information
Table S1: Sociodemographic and clinical profile of singletons with prenatal or perinatally acquired CP.
Table S2: Prenatal or perinatal singleton CP birth prevalence per 1000 live births.
Table S3: Prenatal or perinatal singleton CP birth prevalence per 1000 live births by gestational age group, severity, predominant spastic laterality at 5 years, and birth period.
Acknowledgements
The members of the Australian Cerebral Palsy Register Group are as follows: ACPR/Australian Capital Territory/New South Wales: Shona Goldsmith*, Sarah McIntyre*, Hayley Smithers‐Sheedy*, Nadia Badawi, Isabelle Balde, Petra Karlsson, Iona Novak, Katarina Ostojic, and Emma Waight; Northern Territory: Fiona Kay*, Cassie Goldsworthy; Queensland: Megan Auld* and Jacinta Quartermaine; South Australia: Catherine Gibson*, Heather Scott*, and Jennifer Hernandez; Tasmania: Eliza Maloney*, Nadine Davies, Marie Rauter, and Lynne Jones; Victoria: Sue Reid*, Gina Hinwood, Angela Guzys, and Dinah Reddihough; Western Australia: Linda Watson*, Eve Blair, Noula Gibson, Dylan Gration, Gareth Baynam, Katherine Langdon, and Sarah Love. *Members of the ACPR Policy Group. The ACPR Group acknowledge all the children with CP and their families and the clinicians who support them. We are grateful to Consultative Council on Obstetric and Paediatric Mortality and Morbidity for providing access to Victorian Denominator Data used for this project and for the assistance of the staff at Safer Care Victoria. The conclusions, findings, opinions, and views or recommendations expressed in this paper are strictly those of the author(s), they do not necessarily reflect those of CCOPMM. The Australian Capital Territory, New South Wales, and Australian CP Registers are funded by the Cerebral Palsy Alliance Research Foundation. The Northern Territory CP Register is funded by Women, Children and Youth, Royal Darwin Hospital. The Queensland CP Register is funded by Choice, Passion, Life. The South Australian CP Register is funded by the Women's and Children's Health Network with additional support provided by Novita. The Tasmanian CP Register is supported by St Giles and the Tasmanian Department of Health. The Victorian CP Register received funding from the Lorenzo and Pamela Galli Medical Research Trust, the Victorian Department of Health and Human Services, and the Royal Children's Hospital Foundation, and infrastructure support was provided by the Victorian Government's Operational Infrastructure Support Program. The Western Australian Register of Developmental Anomalies ‐ Cerebral Palsy is funded by Department of Health Western Australia. HSS received salary support through a National Health and Medical Research Council of Australia Early Career Fellowship (1144566) and Australasian Cerebral Palsy Clinical Trials Network. The authors have no interests which might be perceived as posing a conflict or bias. Open access publishing facilitated by The University of Sydney, as part of the Wiley ‐The University of Sydney agreement via the Council of Australian University Librarians. [Correction added on 14 May 2022, after first online publication:CAUL funding statement has been added.]
Smithers‐Sheedy H, Waight E, Goldsmith S, Reid S, Gibson C, Watson L, et al; The Australian Cerebral Palsy Register Group . Declining trends in birth prevalence and severity of singletons with cerebral palsy of prenatal or perinatal origin in Australia: A population‐based observational study. Dev Med Child Neurol. 2022;64:1114–1122. 10.1111/dmcn.15195
Contributor Information
Hayley Smithers‐Sheedy, Email: hsmitherssheedy@cerebralpalsy.org.au.
the Australian Cerebral Palsy Register Group:
Katarina Ostojic, Fiona Kay, Jacinta Quartermaine, Eliza Maloney, Nadine Davies, and Gina Hinwood
DATA AVAILABILITY STATEMENT
Data available on request following appropriate ethical clearance.
REFERENCES
- 1. Rosenbaum P, Paneth N, Leviton A, Goldstein M, Bax M. A report: the definition and classification of cerebral palsy April 2006. Dev Med Child Neurol. 2007;49:8–14. [PubMed] [Google Scholar]
- 2. ACPR Group . Report of the Australian Cerebral Palsy Register Birth Years 1995‐2012; 2018. Available from: https://cpregister.com/wp‐content/uploads/2019/02/Report‐of‐the‐Australian‐Cerebral‐Palsy‐Register‐Birth‐Years‐1995‐2012.pdf (Accessed 2nd December 2021). [Google Scholar]
- 3. Khandaker G, Muhit M, Karim T, Smithers‐Sheedy H, Novak I, Jones C, Badawi N. Epidemiology of cerebral palsy in Bangladesh: a population‐based surveillance study. Dev Med Child Neurol. 2019;61(5):601–9. [DOI] [PubMed] [Google Scholar]
- 4. Badawi N, McIntyre S, Hunt RW. Perinatal care with a view to preventing cerebral palsy. Dev Med Child Neurol. 2021;63(2):156–61. [DOI] [PMC free article] [PubMed] [Google Scholar]
- 5. Reid SM, Meehan E, McIntyre S, Goldsmith S, Badawi N, Reddihough DS. Temporal trends in cerebral palsy by impairment severity and birth gestation. Dev Med Child Neurol. 2016;58(Suppl 2):25–35. [DOI] [PubMed] [Google Scholar]
- 6. Galea C, McIntyre S, Smithers‐Sheedy H, Reid SM, Gibson C, Delacy M, Watson L, Goldsmith S, Badawi N, Blair E. Cerebral palsy trends in Australia (1995–2009): a population‐based observational study. Dev Med Child Neurol. 2019;61(2):186–93. [DOI] [PubMed] [Google Scholar]
- 7. Sellier E, Platt MJ, Andersen GL, Krägeloh‐Mann I, De La Cruz J, Cans C. Decreasing prevalence in cerebral palsy: a multi‐site European population‐based study, 1980 to 2003. Dev Med Child Neurol. 2016;58(1):85–92. [DOI] [PubMed] [Google Scholar]
- 8. Touyama M, Touyama J, Toyokawa S, Kobayashi Y. Trends in the prevalence of cerebral palsy in children born between 1988 and 2007 in Okinawa, Japan. Brain Dev. 2016;38(9):792–9. [DOI] [PubMed] [Google Scholar]
- 9. Sellier E, Goldsmith S, McIntyre S, Perra O, Rackauskaite G, Badawi N. Cerebral palsy in twins and higher multiple births: a Europe‐Australia population‐based study. Dev Med Child Neurol. 2021;63(6):712–720. [DOI] [PubMed] [Google Scholar]
- 10. Surveillance of Cerebral Palsy in Europe . Surveillance of cerebral palsy in Europe: a collaboration of cerebral palsy surveys and registers. Dev Med Child Neurol. 2000;42:816–24. [DOI] [PubMed] [Google Scholar]
- 11. Australian Cerebral Palsy Register Group . Australia and the Australian Cerebral Palsy Register for the birth cohort 1993 to 2006. Dev Med Child Neurol. 2016;58(Suppl 2):3–4. [DOI] [PubMed] [Google Scholar]
- 12. Australian Bureau of Statistics . Socio‐Economic Indexes for Areas. Australian Bureau of Statistics; 2018. Available from: https://www.abs.gov.au/websitedbs/censushome.nsf/home/seifa [Google Scholar]
- 13. Joseph FA, Hyett JA, Schluter PJ, McLennan A, Gordon A, Chambers GM, Hilder L, Choi SKY, Vries B. New Australian birthweight centiles. Med J Aust. 2020;213(2):79–85. [DOI] [PubMed] [Google Scholar]
- 14. Palisano R, Rosenbaum P, Walter S, Russell D, Wood E, Galuppi B. Development and reliability of a system to classify gross motor function in children with cerebral palsy. Dev Med Child Neurol. 1997;39(4):214–23. [DOI] [PubMed] [Google Scholar]
- 15. Australian Institute of Health and Welfare (AIHW) . National Perinatal Data Collection (NPDC). 2019. Available from: https://www.aihw.gov.au/about‐our‐data/our‐data‐collections/national‐perinatal‐data‐collection [Google Scholar]
- 16. Cheong JLY, Olsen JE, Lee KJ, Spittle AJ, Opie GF, Clark M et al. Temporal trends in neurodevelopmental outcomes to 2 years after extremely preterm birth. JAMA Pediatr. 2021;175(10):1035. doi: 10.1001/jamapediatrics.2021.2052 [DOI] [PMC free article] [PubMed] [Google Scholar]
- 17. Reid SM, Carlin JB, Reddihough DS. Rates of cerebral palsy in Victoria, Australia, 1970–2004: Have there been a change? Dev Med Ch Neurol. 2011;53:907–912. [DOI] [PubMed] [Google Scholar]
- 18. Himmelmann K, Uvebrant P. The panorama of cerebral palsy in Sweden part XII shows that patterns changed in the birth years 2007–2010. Acta Paediatr. 2018;107(3):462–8. [DOI] [PubMed] [Google Scholar]
- 19. Arnaud C, Ehlinger V, Delobel‐Ayoub M, Klapouszczak D, Perra O, Hensey O et al. Trends in prevalence and severity of pre/perinatal cerebral palsy among children born preterm from 2004 to 2010: A SCPE collaboration study. Front Neurol. 2021;12(710). 10.3389/fneur.2021.624884 [DOI] [PMC free article] [PubMed] [Google Scholar]
- 20. Doyle LW, Spittle AJ, Olsen JE, Kwong A, Boland RA, Katherine JL et al. Translating antenatal magnesium sulphate neuroprotection for infants born <28 weeks' gestation into practice: a geographical cohort study. Aust N Z J Obstet Gynaecol. 2021;61:513‐8. Feb 2. doi: 10.1111/ajo.13301 [DOI] [PubMed] [Google Scholar]
- 21. Krageloh‐Mann I, Cans C. Cerebral palsy update. Brain Dev. 2009;31(7):537–44. [DOI] [PubMed] [Google Scholar]
- 22. Surman G, Newdick H, Johnson A. Oxford Register of Early Childhood Impairments Management G. Cerebral palsy rates among low‐birthweight infants fell in the 1990s. Dev Med Child Neurol. 2003;45(7):456–62. [DOI] [PubMed] [Google Scholar]
- 23. Rice J, Skuza P, Baker F, Russo R, Fehlings D. Identification and measurement of dystonia in cerebral palsy. Dev Med Child Neurol. 2017;59(12):1249–55. [DOI] [PubMed] [Google Scholar]
- 24. Reid SM, Meehan EM, Reddihough DS, Harvey AR. Dyskinetic vs spastic cerebral palsy: a cross‐sectional study comparing functional profiles, comorbidities, and brain imaging patterns. J Child Neurol. 2018;33(9):593–600. [DOI] [PubMed] [Google Scholar]
- 25. Monbaliu E, Himmelmann K, Lin JP, Ortibus E, Bonouvrié L, Feys H, Vermeulen RJ, Dan B. Clinical presentation and management of dyskinetic cerebral palsy. Lancet Neurology. 2017;16(9):741–9. [DOI] [PubMed] [Google Scholar]
- 26. Himmelmann K, McManus V, Hagberg G, Uvebrant P, Krageloh‐Mann I, Cans C. Dyskinetic cerebral palsy in Europe: trends in prevalence and severity. Arch Dis Child. 2009;94(12):921–6. [DOI] [PubMed] [Google Scholar]
- 27. Stewart K, Harvey A. The Identification and Measurement of Dyskinesia in Children with Cerebral Palsy: A Toolkit for Clinicians. Figshare; 2017. [Google Scholar]
- 28. Stewart K, de Vries T, Harvey A. Implementing accurate identification and measurement of dyskinesia in cerebral palsy into clinical practice: A knowledge translation study. J Paediatr Child Health. 2019;55(11):1351–6. [DOI] [PubMed] [Google Scholar]
- 29. Stewart K, Tavender E, Rice J, Harvey A. Identification, classification and assessment of dyskinesia in children with cerebral palsy: A survey of clinicians. J Paediatr Child Health. 2018;54(4):432–8. [DOI] [PubMed] [Google Scholar]
- 30. Jethwa A, Mink J, Macarthur C, Knights S, Fehlings T, Fehlings D. Development of the Hypertonia Assessment Tool (HAT): a discriminative tool for hypertonia in children. Dev Med Child Neurol. 2010;52(5):e83–7. [DOI] [PubMed] [Google Scholar]
- 31. Taylor CL, de Groot J, Blair EM, Stanley FJ. The risk of cerebral palsy in survivors of multiple pregnancies with cofetal loss or death. Am J Obstet Gynecol. 2009;201(1):41 e1–6. [DOI] [PubMed] [Google Scholar]
- 32. Sellier E, McIntyre S, Smithers‐Sheedy H, Platt MJ. European and Australian Cerebral Palsy surveillance networks working together for collaborative research. Neuropediatrics. 2020;51(2):105–12. [DOI] [PubMed] [Google Scholar]
- 33. Heiyanthuduwage TM, Sumanasena SP, Kitnasamy G, Smithers Sheedy H, Khandaker G, Fernando R et al. Protocol for the Sri Lankan Cerebral Palsy Register pilot study. BMJ Open. 2020;10(8):e039353. [DOI] [PMC free article] [PubMed] [Google Scholar]
- 34. Jahan I, Muhit M, Hardianto D, Laryea F, Chhetri AB, Smithers‐Sheedy H, McIntyre S, Badawi N, Khandaker G. Epidemiology of cerebral palsy in low‐ and middle‐income countries: preliminary findings from an international multi‐centre cerebral palsy register. Dev Med Child Neurol. 2021;63(11):1327–1336. doi: 10.1111/dmcn.14926. [E‐pub ahead of print]. [DOI] [PubMed] [Google Scholar]
Associated Data
This section collects any data citations, data availability statements, or supplementary materials included in this article.
Supplementary Materials
Table S1: Sociodemographic and clinical profile of singletons with prenatal or perinatally acquired CP.
Table S2: Prenatal or perinatal singleton CP birth prevalence per 1000 live births.
Table S3: Prenatal or perinatal singleton CP birth prevalence per 1000 live births by gestational age group, severity, predominant spastic laterality at 5 years, and birth period.
Data Availability Statement
Data available on request following appropriate ethical clearance.