Abstract
Photodynamic therapy (PDT) is a highly promising therapeutic modality for cancer treatment. The development of stimuli‐responsive photosensitizer nanomaterials overcomes certain limitations in clinical PDT. Herein, we report the rational design of a highly sensitive PEGylated photosensitizer‐peptide nanofiber (termed PHHPEG6 NF) that selectively aggregates in the acidic tumor and lysosomal microenvironment. These nanofibers exhibit acid‐induced enhanced singlet oxygen generation, cellular uptake, and PDT efficacy in vitro, as well as fast tumor accumulation, long‐term tumor imaging capacity and effective PDT in vivo. Moreover, based on the prolonged presence of the fluorescent signal at the tumor site, we demonstrate that PHHPEG6 NFs can also be applied for prognostic monitoring of the efficacy of PDT in vivo, which would potentially guide cancer treatment. Therefore, these multifunctional PHHPEG6 NFs allow control over the entire PDT process, from visualization of photosensitizer accumulation, via actual PDT to the assessment of the efficacy of the treatment.
Keywords: Nanofibers, Long-Term Tumor Retention, Peptides, Photodynamic Therapy, Self-Assembly
A PEGylated porphyrin‐peptide (PHHPEG6) building block self‐assembled into nanofibers (NFs), which formed aggregates in the acidic tumor microenvironment. The pH‐induced aggregation of PHHPEG6 NFs resulted in enhanced 1O2 generation efficiency and prolonged tumor retention, thus enabling control over the entire PDT process, from the visualization of photosensitizer accumulation to actual PDT and subsequent assessment of the efficacy of the treatment.
Introduction
Photodynamic therapy (PDT) is a minimally invasive therapy that has been used as an anti‐tumor treatment method for various types of tumors.[ 1 , 2 ] Three nontoxic components i.e. oxygen, light and photosensitizer, are employed in PDT that on their own do not have any toxic effects on biological systems.[ 3 , 4 ] Cytotoxic reactive oxygen species (ROS) are generated through the combination of a light source, molecular oxygen, and photosensitizers, which then can oxidize key cellular macromolecules, leading to the direct death of tumor cells via apoptosis and/or necrosis.[ 5 , 6 ] This makes PDT a promising modern approach for cancer therapy with low toxicity for healthy tissues, unlike chemotherapy and radiation therapy.[ 7 , 8 ]
Currently, clinically applied photosensitizers are mostly based on derivatives of porphyrin, chlorin and phthalocyanine.[ 9 , 10 ] However, these photosensitizers still have many drawbacks, such as poor water solubility, poor biocompatibility and non‐selectivity, restricting the use of PDT in clinical practice. [2] In general, addition of solubilizers or chemical modification with hydrophilic groups can improve the solubility and biocompatibility of these hydrophobic photosensitizers. However, this often causes the problem of low bioavailability of these monomeric photosensitizers, because of their short circulating time and fast renal clearance in vivo. [11] To overcome these limitations, nanomaterial platforms have been developed for the delivery of hydrophobic photosensitizers, enabling prolonged blood circulation, precise drug delivery to tumor tissues based on passive and active tumor targeting strategies, and preventing the degradation of photosensitizers before reaching the target tumor tissue.[ 9 , 12 , 13 , 14 , 15 , 16 ] Biomaterials, especially peptide‐based nanomaterials, have been widely used as PDT carrier systems because of their biodegradability, biocompatibility, structural and functional versatility.[ 4 , 15 , 17 , 18 , 19 , 20 ] Moreover, the use of stimuli‐responsive nanomaterials makes it possible to alter the features of photosensitizers in the tumor microenvironment, which for example allows to increase the selectivity and efficiency of PDT, as well as enables the elimination of side effects.[ 7 , 21 , 22 ] Ideally, the photosensitization activity of the system should be switched off during blood circulation to reduce systemic toxicities in vivo and switched on in specific tumor tissues to provide high ROS production. [23]
In vivo imaging prior to the use of PDT is an essential step in therapeutic planning to assess if the tissue of interest, normally a tumor, lesion, or type of diseased tissue, can be effectively reached.[ 24 , 25 ] In addition to locating the tissue of interest, it is often possible to discern areas of pre‐existing necrosis, and areas of disease infiltration by choosing from a variety of techniques or contrast agents.[ 26 , 27 ] The structural and functional information gathered through pretreatment imaging can be used in treatment planning, such as the location of the light source, and even treatment dose assessment. [28] Moreover, imaging techniques have been successfully clinically implemented that allow for the assessment of the efficacy of PDT by comparing tissue images before and after treatment, showing evidence of necrosis, apoptosis, and blood vessel occlusion.[ 28 , 29 ] The development of photosensitizer‐based nanostructures with intrinsically built‐in fluorescence imaging capacity, would integrate these features in one particle, which would allow for facile monitoring of accumulation and retention at the tumor site before and after PDT, and assess the progress of PDT through in situ real‐time imaging without using additional contrast agent.
An interesting approach to enhance tumor tissue accumulation and retention of nanoparticles is to trigger their aggregation by stimuli provided by the tumor microenvironment, which increases the interaction between cells and nanoparticles.[ 21 , 29 , 30 ] Our group previously reported on a nanoparticle for long‐term tumor imaging and enhanced PDT, which was composed of a porphyrin‐peptide building block that displayed pH‐activated self‐assembly into peptide nanostructures. [21] However, the slow tumor accumulation of these nanoparticles compromised their utility for tracking the nanoparticles in in vivo tumor imaging, especially at early‐stage post injection.
In vivo nanoparticle behavior can be strongly affected by their morphology.[ 31 , 32 ] For example, nanofibers with a high aspect ratio have a therapeutic advantage over traditional spherical nanoparticles, owing to their prolonged circulation time in vivo;[ 33 , 34 ] PEGylated fibrillar structures persist in circulation considerably longer than spherical particles after intravenous injection because fibrous structures are less readily taken up by immune cells.[ 31 , 32 ] The rapid blood flow induces strong hydrodynamic shear during circulation, making it difficult for fibrous structures to prolong their interaction with the surface of macrophages. This allows them to accumulate more effectively at the tumor site and improve their therapeutic efficacy compared to their spherical counterparts.[ 31 , 32 , 35 ]
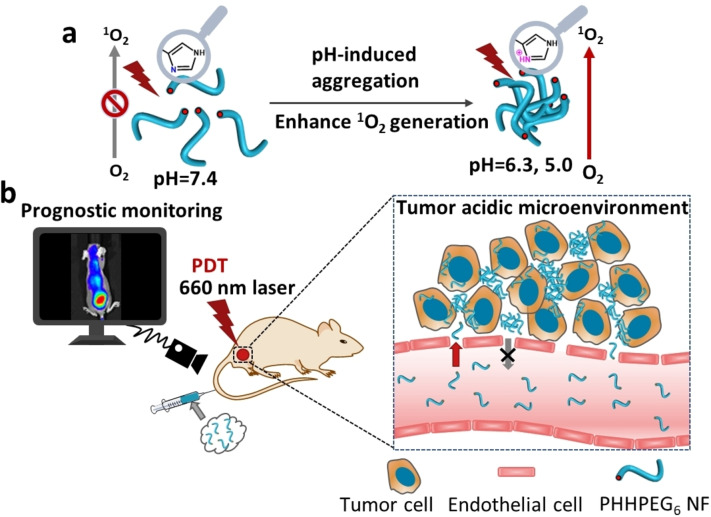
Several porphyrin‐peptide conjugates have been applied in PDT but many of them suffer from the poor accumulation or short tumor retention, which interferes with their application in in vivo tumor imaging and therapy. [36] In this paper, we designed and synthesized a novel pH‐responsive PEGylated porphyrin‐peptide conjugate termed PHHPEG6 in which we have derivatized a porphyrin with histidine dipeptides and short PEG chains (Figure S1). The pK a of the imidazole group in histidine (pK a≈6.0) is closer to the acidic tumor microenvironment (pH 6.0–7.0) than that of the pH‐responsive carboxylate group (pK a=2.85) in our previous work, strongly improving their pH‐responsive aggregation. [21] The PHHPEG6 self‐assembled into small nanofibers with high aspect ratio, exhibiting fast and efficient tumor accumulation, long‐term tumor retention, which can be applied in pre‐imaging and post‐treatment imaging of the tumor in PDT (Scheme 1). To the best of our knowledge, this is the first time a multifunctional porphyrin‐peptide based nanomaterial has been developed that can not only be used for effective PDT but also for prognostic monitoring.
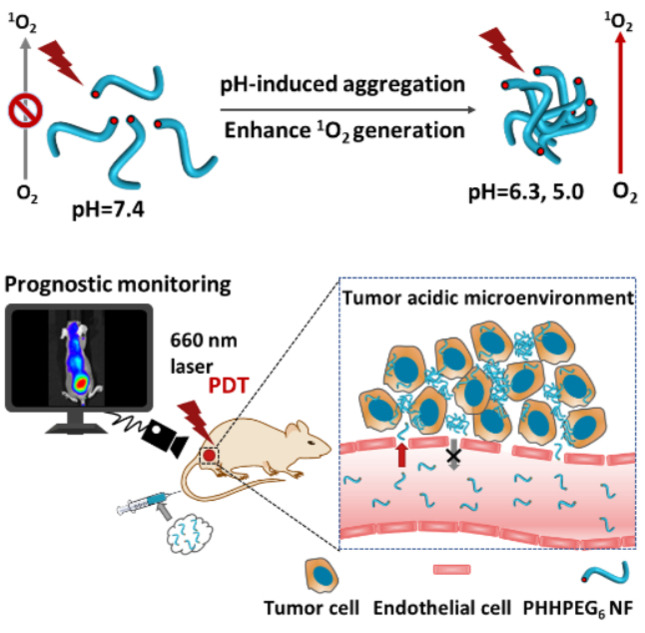
Scheme 1.
Overview of the construction and features of pH‐responsive porphyrin‐peptide nanofibers (PHHPEG6 NFs) for enhanced photodynamic therapy and prognostic monitoring. a) In presence of the acidic tumor microenvironment, self‐assembled PHHPEG6 NFs form aggregates and sediment on the cancer cell surface, leading to enhanced cellular uptake. The pH‐induced aggregation of PHHPEG6 NFs also results in enhanced 1O2 generation efficiency. b) Because of the prolonged tumor retention, the PHHPEG6 NFs can not only be used for tumor imaging and effective PDT but also for prognostic monitoring in vivo.
Results and Discussion
The PEGylated porphyrin‐peptide conjugate PHHPEG6 was synthesized by solid phase peptide synthesis. LC‐MS, MALDI‐ToF MS and 1H NMR spectroscopy results showed the successful synthesis of PHHPEH6 (Figure S1–S3). As depicted in Figure 1a, PHHPEG6 self‐assembled into small nanostructures in aqueous solution with an average size of 30 nm as measured by DLS. Cryo‐TEM analysis showed that the self‐assembled PHHPEG6 nanostructures were coiled nanofibers (NFs) (Figure 1b). The stability was investigated by diluting PHHPEG6 NFs in several buffers. As shown in Figure 1c, the size of these PHHPEG6 NFs did not significantly change in PBS, DMEM, 10 % FBS and DMEM+10 % FBS after 24 h incubation, indicating their good stability under physiological conditions. Next, the pH‐responsiveness of these PHHPEG6 NFs was investigated by varying the pH of PHHPEG6 NFs in PBS from 7.4, 6.3 to 5.0, mimicking the pH values of healthy tissue, tumor tissue and intracellular lysosomes, respectively. As shown in Figure 1d, in contrast to the stable size of NFs at neutral pH, the size of PHHPEG6 NFs increased from 26 nm to 1206 nm at pH 6.3, and 1464 nm in PBS pH 5.0 after 1 h incubation, showing the strong response to pH. Cryo‐TEM analysis indicated that PHHPEG6 NFs transformed into large aggregates at these two acidic conditions (Figure 1e). Also, the size of the aggregates was concentration‐dependent. PHHPEG6 NFs formed larger aggregates upon increasing concentration (Figure S4). Furthermore, the aggregation of PHHPEG6 NFs at even lower pH was also investigated. As shown in Figure S5, PHHPEG6 NFs also formed large aggregates at pH of 4.0. However, when the pH was decreased to 3.0, 2.0 and 1.0, small peaks appeared in the DLS measurements, indicating the disassembly of PHHPEG6 nanostructures, which can be attributed to protonation of the pyrrole group of the porphyrin, leading to an increased solubility. [37] Importantly, the size of the PHHPEG6 aggregates did not decrease again when the pH of the solution was adjusted to pH 7.4, showing that the pH‐induced aggregation of PHHPEG6 NFs is irreversible and the formed aggregates are stable (Figure S6). We hypothesized that this could benefit PHHPEG6 nanofiber accumulation after they reached the tumor tissue by the enhanced permeability and retention (EPR) effect, as they would transform into large aggregates in the tumor acidic microenvironment. The formation of large PHHPEG6 aggregates would also promote their cell uptake, and, furthermore, when the PHHPEG6 aggregates were internalized into cells via the lysosomal pathway, the aggregates in the acidic lysosomes could also diminish their exocytosis, enhancing the PDT efficacy.
Figure 1.
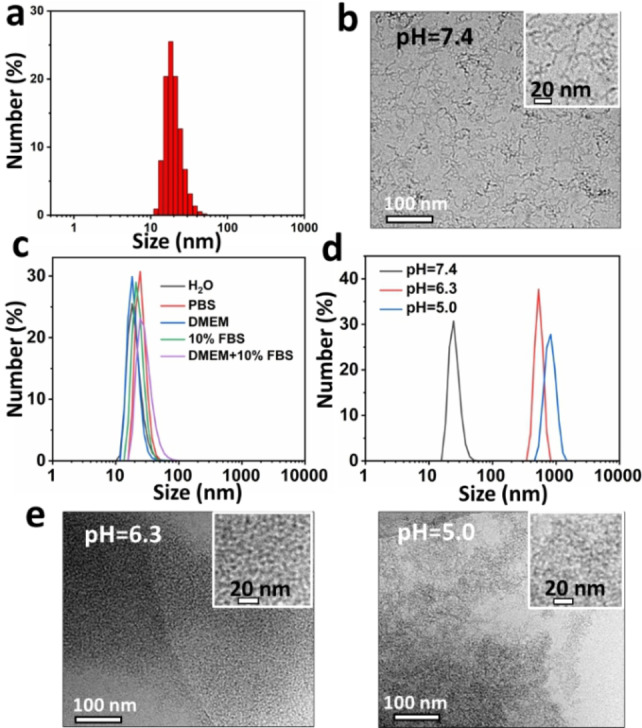
a) Size distribution of PHHPEG6 NFs measured by DLS. b) Cryo‐TEM analysis of PHHPEG6 NFs. c) Stability of 0.2 mg mL−1 PHHPEG6 NFs in H2O, PBS, DMEM, 10 % FBS and DMEM+10 % FBS solutions at pH 7.4 for 24 h. d) Size distribution of 0.2 mg mL−1 PHHPEG6 NFs in phosphate buffer solution at pH 7.4, 6.3 and 5.0 after 1 h, measured by DLS. e) Cryo‐TEM image of PHHPEG6 NFs in phosphate buffered solution at pH 6.3 and 5.0 after 24 h incubation.
To investigate the effect of the PEG6 chains on the porphyrin‐peptide materials, non‐PEGylated porphyrin‐histidine‐histidine (PHH) was also synthesized (Figure S7). In Figure S8–S10, LC‐MS, MALDI‐ToF MS and 1H NMR spectroscopy results showed the successful synthesis of PHH. From the DLS data shown in Figure S11, PHH self‐assembled into nanostructures with average size of around 100 nm in aqueous solution. SEM analysis showed a spherical morphology for these PHH nanoparticles (NPs) (Figure S12). However, after dilution in PBS at pH 7.4, the size of the non‐PEGylated PHH NPs significantly increased, from 100 nm to around 800 nm, which means that these PHH NPs were not stable in a physiological environment (Figure S13). The above results show the key role of the PEG6 chains in forming stable porphyrin‐histidine nanofiber structures. The improved stability of PHHPEG6 NFs can be attributed to the increased hydrophilicity and steric repulsion between the aggregates induced by the PEG chains. [30]
To gain a better understanding on the mechanism of pH‐responsiveness, we measured the pK R of PHHPEG6 through pH titration. In Figure S14, the pK a of the imidazole group in PHHPEG6 was calculated to be 5.7, which is consistent with that reported in literature. [38] We next measured the zeta potential of PHHPEG6 NFs at the pH values of 7.4, 6.3 and 5.0. As shown in Figure 2a, the zeta potential of PHHPEG6 NFs increased from −15.2 mV to −9.6 mV with the pH going down because of the protonation of the imidazole group of PHHPEG6. [39] At high pH, PHHPEG6 NFs were stabilized in solution due to electrostatic repulsion because of the negative charge on the particle surface. When the pH decreased, the imidazole group started to become protonated, which diminished the electrostatic repulsion, leading to the aggregation of the PHHPEG6 NFs.
Figure 2.
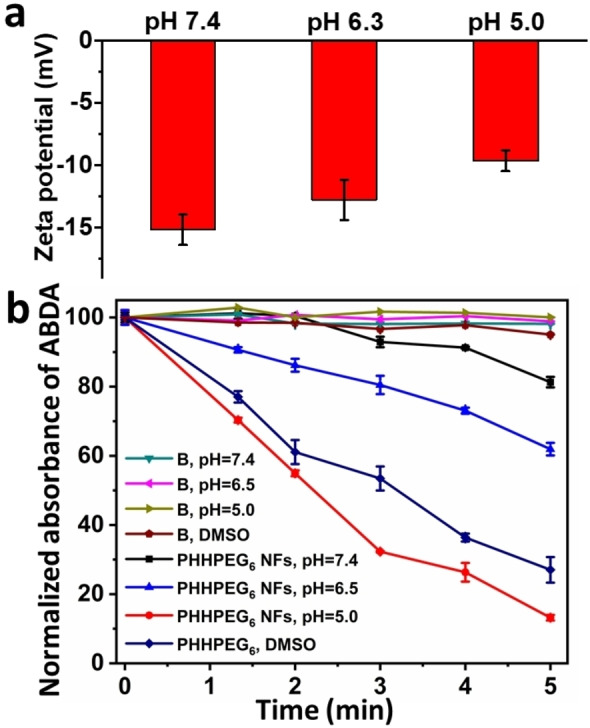
a) Zeta‐potential of PHHPEG6 NFs at pH 7.4, 6.3 and 5.0. b) The decreased absorption of ABDA at 380 nm as a function of time by irradiating PHHPEG6 NF aqueous solutions at pH 7.4, 6.3, 5.0 and the molecularly dissolved porphyrin‐peptide in DMSO. Pure phosphate buffer solutions and DMSO were used as control groups.
The applicability of photosensitizer‐based nanomaterials depends on their photostability. [40] The photostability of PHHPEG6 NFs were investigated by irradiation with light for 30 min. During light irradiation, the absorption spectrum was monitored. As shown in Figure S15, a negligible change was observed compared to the initial absorbance value of PHHPEG6 NFs, showing their good stability. To evaluate the singlet oxygen (1O2) generation efficiency of PHHPEG6 nanostructures at different pH, 9,10‐anthracenediyl‐bis(methylene)dimalonic acid (ABDA) was used as 1O2 indicator. PHHPEG6 NFs solutions were diluted in DMSO and PBS solution at different pH. As shown in Figure 2b, the absorbance of ABDA decreased gradually in all PHHPEG6 solutions over time under 660 nm laser irradiation (0.12 W cm−2), showing that ABDA was degraded by the generated 1O2. The 1O2 generation of PHHPEG6 nanostructures was greatly enhanced as the pH decreased from 7.4 to 5.0. This enhanced 1O2 generation at lower pH could result from enhanced intersystem crossing after nanostructure aggregation.[ 21 , 41 ] When the photosensitizer absorbs a photon, an electron will be promoted from the ground state to an electronically excited singlet state. Then, this excited singlet state decays back to an excited triplet state via three competitive relaxation processes, such as emission of a photon via fluorescence, intersystem crossing and nonradiative relaxation (heat generation). [41] Based on our previous study, the fluorescence and heat generation of peptide‐porphyrin nanostructures decreased during acid‐induced aggregation. As a result, the intersystem crossing mechanism would be promoted and consequently lead to the improvement of 1O2 generation. Surprisingly, the 1O2 generation of PHHPEG6 nanostructures at pH 5.0 was even higher than that produced by free PHHPEG6 in DMSO, indicating their effective 1O2‐generation capacity in acidic conditions.
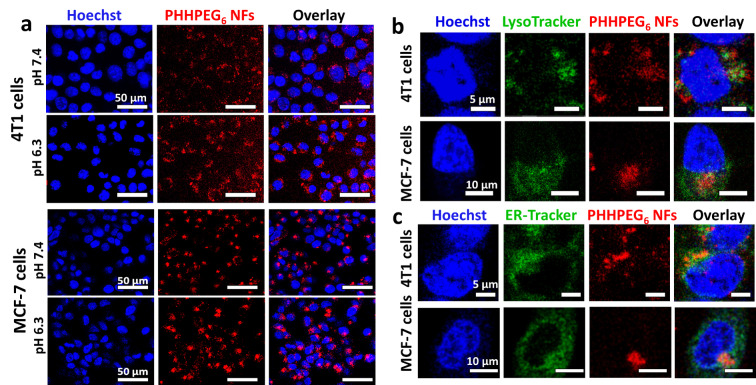
When NF aggregation can be controllably induced at the tumor site, this could enhance retention efficiency and cellular uptake of the nanoparticles in tumors, facilitating diagnosis and therapy.[ 21 , 30 ] To investigate in vitro cell uptake behavior of pH‐sensitive PHHPEG6 NFs in a tumor‐like acidic environment, mouse breast cancer 4T1 cells and human breast cancer MCF‐7 cells were incubated with PHHPEG6 NFs at both neutral pH 7.4 and pH 6.3, and analyzed using confocal fluorescence microscopy (CLSM) and fluorescence activated cell sorting (FACS). As shown in Figure 3, the PHHPEG6 NFs displayed a strong red fluorescent signal, which allowed the visualization of uptake and intracellular localization. After the incubation of 4T1 cells and MCF‐7 cells with PHHPEG6 NFs for 24 h, remarkably enhanced cellular uptake was observed at pH 6.3 in comparison with pH 7.4 (Figure 3a). Similar results were observed with the FACS analysis of PHHPEG6 NFs treated cells at pH 7.4 and 6.3 (Figure S16). The enhancement of cellular uptake at pH 6.3 is mainly attributed to the pH‐induced aggregation of PHHPEG6 NFs. The fast aggregation of PHHPEG6 NFs in culture medium at pH 6.3 made the large aggregates subsequently sediment on the cells, resulting in a high local concentration of NPs on the cell surface and an increase in cellular uptake.[ 30 , 42 ] Moreover, the proteolysis of PHHPEG6 NFs inside 4T1 cells and MCF‐7 cells was investigated. As shown in Figure S17, after washing the NFs from 4T1 cells and MCF‐7 cells after 24 h co‐culturing and culturing the cells in medium for another 24 h, the fluorescence of PHHPEG6 NFs decreased at 48 h compared with that at 24 h, indicating the hydrolysis of NFs in cells. To evaluate cellular localization of PHHPEG6 NFs, the 4T1 cells and MCF‐7 cells were stained with LysoTracker green, endoplasmic reticulum (ER)‐Tracker green, MitoTracker green and GolgiTracker green, and the localization of PHHPEG6 NFs was determined using high resolution CLSM. As shown in Figure 3b, the red fluorescence of PHHPEG6 NFs partially colocalized with the green fluorescence in lysosomes. Lysosomes have a low pH, facilitating the pH‐responsiveness of PHHPEG6 NFs. Meanwhile, PHHPEG6 NFs were also partially colocalized with the endoplasmic reticulum (Figure 3c). The Pearson correlation coefficient in both 4T1 cells and MCF‐7 cells showed a high value for lysosomes (0.40 and 0.48, respectively), and a high value for the endoplasmic reticulum (0.49 and 0.47, respectively) as well, indicating that the PHHPEG6 mainly localized in these organelles. As shown in Figure S18 and S19, PHHPEG6 NFs did not show co‐localization with mitochondria and the Golgi apparatus. The above results confirmed that these PHHPEG6 NFs exhibited enhanced cellular uptake at acidic conditions in vitro, and distributed to lysosomes and the endoplasmic reticulum.
Figure 3.
a) Confocal microscope images of 4T1 cells and MCF‐7 cells co‐cultured with 200 μg mL−1 PHHPEG6 NFs for 24 h at pH 7.4 and 6.3 and stained with Hoechst 33342. Confocal microscope images of 4T1 cells and MCF‐7 cells treated with 200 μg mL−1 PHHPEG6 NFs for 24 h and stained with Hoechst 33342, b) LysoTracker green and c) ERTracker green, respectively.
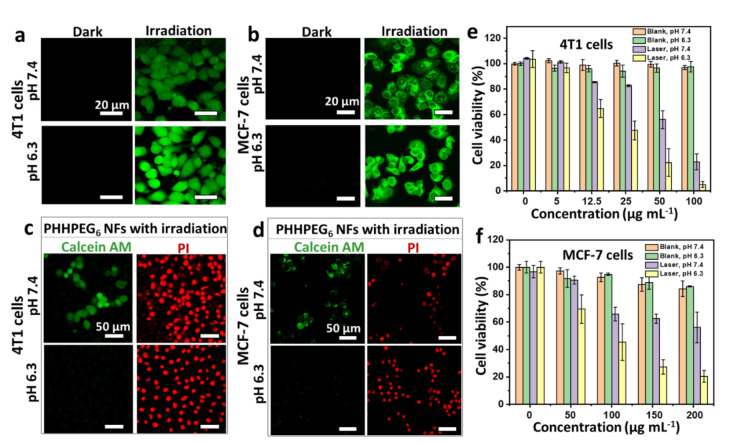
The intracellular photoactivity of the PHHPEG6 NFs to 4T1 cells and MCF‐7 cells was also examined by CLSM using the ROS indicator 2,7‐dichlorodihydrofluorescein diacetate (DCFH‐DA) for the detection of generated singlet oxygen under irradiation with a 660 nm laser. As shown in Figure 4a and 4b, all cells in the two groups (PHHPEG6 NFs at 7.4 and 6.3) consistently revealed a low fluorescence emission without light irradiation. In Figure 4a and 4b, 4T1 cells and MCF‐7 cells treated with PHHPEG6 NFs exhibited strong green fluorescence after irradiation by a 660 nm laser (0.12 W cm−2) for 10 min, but fluorescence was more pronounced at pH 6.3 than at pH 7.4. This might be a result of the enhanced uptake of PHHPEG6 NFs under acidic conditions. Next, 4T1 cells and MCF‐7 cells were incubated with PHHPEG6 NFs at 7.4 and 6.3 for 24 h and irradiated with or without the 660 nm laser for 10 min. These cells were stained with calcein‐AM and PI staining solution for a live/dead assay. As shown Figure S20, all the cells were alive (green) without laser irradiation, even when treated with PHHPEG6 NFs at pH 7.4 and 6.3, showing their good biocompatibility. After laser irradiation, it was clearly observed that cell killing (red) was more efficient at pH 6.3 than that at pH 7.4 in 4T1 cells and MCF‐7 cells (Figure 4c and 4d); these results were consistent with the MTT assay (Figure 4e and 4f). The viability of 4T1 cells and MCF‐7 cells decreased with the increase of NF concentration at the two pH values (Figure 4e and 4f) under laser irradiation. Clearly, the PHHPEG6 NFs showed a higher cell phototoxicity at the more acidic conditions. These results suggest that the improved therapeutic efficiency of PHHPEG6 NFs can be attributed to the enhanced cellular uptake.
Figure 4.
CLSM images of intracellular 1O2 generation in a) 4T1 cells and b) MCF‐7 cells measured by DCFH‐DA after treatment of the cells with PHHPEG6 NFs at pH 7.4 and 6.3 with and without 660 nm laser irradiation (0.12 W cm−2, 10 min). CLSM images of c) 4T1 cells and d) MCF‐7 cells stained with calcein‐AM/PI, incubated with PHHPEG6 NFs at pH 7.4 and 6.3 with 660 nm laser irradiation (0.12 W cm−2, 10 min). The concentration of PHHPEG6 NFs used for 4T1 cells was 50 μg mL−1, and for MCF‐7 cells 200 μg mL−1 in a‐d. MTT assay of cell viability of e) 4T1 cells) and f) MCF‐7 cells with PHHPEG6 NFs at different concentrations at pH 7.4 and 6.3, with and without 660 nm laser irradiation (0.12 W cm−2, 10 min).
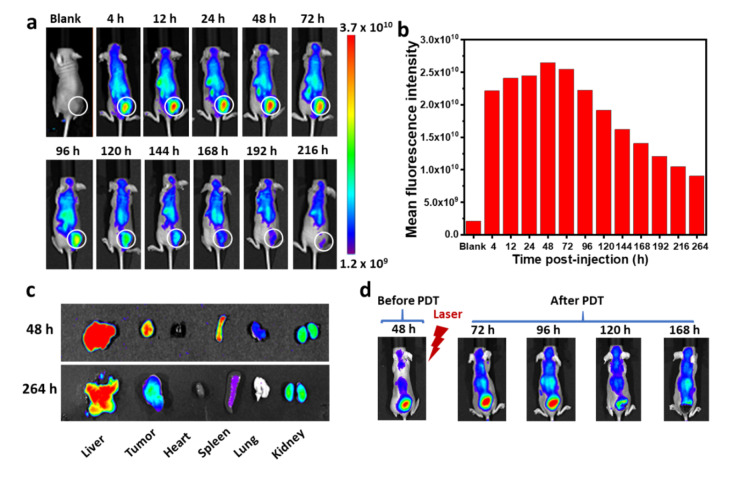
To evaluate the biodistribution and therapeutic efficacy of PHHPEG6 NFs in tumor‐bearing mice, mouse breast cancer 4T1 cell tumors were established in athymic nude mice. The biodistribution of PHHPEG6 NFs in these 4T1 tumor‐bearing mice was investigated by in vivo fluorescence imaging. As shown in Figure 5a, strong red fluorescence appeared at the tumor site 4 h post injection, indicating the fast accumulation of PHHPEG6 NFs, which might attribute to their quick responsiveness to low pH in tumor tissue. Furthermore, the fluorescence signal of PHHPEG6 NFs increased over time at the tumor site and reached a maximum at 48 h, exhibiting large tumor accumulation. Remarkably, the fluorescence signal remained strong for 216 h (9 days) and more than 53 % of the maximum average fluorescence intensity was still retained in the tumor after intravenous administration up to 168 h, showing the long‐term tumor retention of PHHPEG6 NFs (Figure 5b). Moreover, ex vivo fluorescence imaging of the tumor and main organs also showed a strong fluorescence signal at the tumor site and the liver 48 h post injection (Figure 5c). Remarkably, the fluorescence signal at tumor site could be even detected 264 h post injection. These results indicate the effective accumulation and long‐term retention behavior of PHHPEG6 NFs at the tumor site, which might be attributed to the PEGylated nature of the fibers nanostructure, the good penetration capacity because of their small size, and the fast pH‐induced aggregation at the acidic tumor microenvironment.[ 21 , 30 , 32 ]
Figure 5.
a) Fluorescence imaging of 4T1 tumor‐bearing mice at varying time points after intravenous injection of PHHPEG6 NFs over a period of 216 h. b) Quantified total fluorescence intensity in the tumor region marked by the white circle of (a). c) Ex vivo fluorescence images of main organs of tumor‐bearing mice at 48 and 264 h post injection of PHHPEG6 NFs. d) Fluorescence imaging and photographs of mice before PDT at 48 h post injection, and after PDT at 72, 96, 120 and 168 h post injection.
The long‐term retention of PHHPEG6 NFs at the tumor site made it possible to monitor the process of PDT by comparing fluorescence images of tumor tissue before and after PDT for evidence of necrosis and apoptosis. Firstly, the PHHPEG6 NFs were injected intravenously in mice. In Figure 5d, strong fluorescence appeared at the tumor site 48 h post injection, which is consistent with the in vivo imaging results of Figure 5a. Subsequently, the tumor was irradiated with a 660 nm laser for 10 min to induce PDT, and the fluorescence was monitored continuously in real time. Interestingly, different from the decreasing trend of fluorescence after 48 h post injection without PDT (Figure 5a), the fluorescence at the tumor site increased continuously after PDT and the area of fluorescence was enlarged from 48 h to 72 h post injection (Figure 5d). Furthermore, the fluorescence even increased further after PDT for 2 days (96 h post injection); meanwhile, a part of the tumor started to scab (Figure S21). This enhanced fluorescence after PDT might result from the necrosis and apoptosis of tumor cells leading to release and diffusion of PHHPEG6 NFs. The fluorescence at the tumor site almost disappeared after PDT for 3 and 5 days (120 h and 168 h post injection) and thick scabs were formed at the tumor sites (Figure S21). The sudden disappearance of the fluorescent signal might be due to the clearance of free PHHPEG6 NFs from the tumor tissue or be attributed to inhibited fluorescence imaging by the typical black scab formed at the tumor site after PDT, showing the high PDT efficacy of PHHPEG6 NFs. Benefiting from the long‐term tumor fluorescence retention of PHHPEG6 NFs, the abnormal increase and sudden disappearance of fluorescence after PDT can be used to monitor the process of necrosis and apoptosis of tumor cells to guide the PDT treatment.
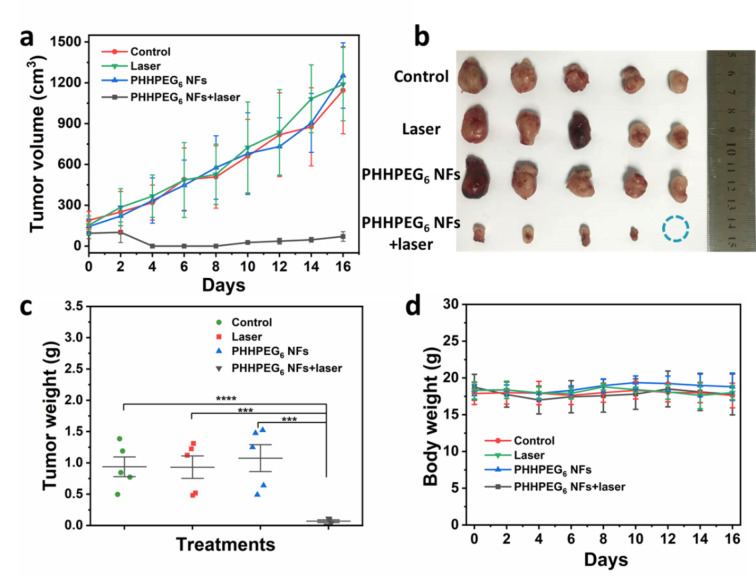
Twenty 4T1 tumor‐bearing mice were divided into four groups, labeled: Control, Laser, PHHPEG6 NFs and PHHPEG6 NFs+laser groups. At the highest fluorescence time point (48 h post‐injection), the mice of the Laser and PHHPEG6 NFs+laser groups were irradiated by a 660 nm laser for 10 min, and the other two groups were treated without laser. Then, the tumor volumes and body weights were monitored (Figure 6). As shown in Figure 6a, the tumor growth profiles showed that the PHHPEG6 NFs+laser group displayed strong antitumor efficacy compared with the other three groups over the period of 16 days. The tumor size and weight at day 16 also confirmed the effectiveness of PHHPEG6 NFs for PDT (Figure 6b and 6c). Figure 6d showed that the body weights of the mice in all groups were not significantly different and remained stable during treatment, indicating the high biocompatibility of this PDT system. Moreover, as shown in Figure S22, the hematoxylin and eosin (H&E) staining of major organs from the mice in the four groups exhibited no pathological changes, showing the excellent biocompatibility of the PHHPEG6 NFs for in vivo PDT.
Figure 6.
a) The relative tumor volume growth profiles of 4T1 tumor‐bearing mice in different groups treated with Control, Laser, PHHPEG6 NFs, PHHPEG6 NFs+laser. Mean: s.d., n=5. b) Tumors taken at the end of the studies (16 days). c) Tumor weight and d) body weight change of the mice in the different groups.
Conclusion
We have synthesized a novel PEGylated porphyrin‐peptide PHHPEG6 building block which self‐assembles into small nanofibers. The presence of the PEG6 chains was key in providing stability of the nanofiber structures. These PHHPEG6 NFs exhibited fast pH‐responsive aggregation at low pH values, reminiscent of tumor tissue and the lysosomal microenvironment, which improved their singlet oxygen generation, cellular uptake, and PDT efficacy in vitro. PHHPEG6 NFs showed fast and effective tumor accumulation, which enabled both prolonged tumor imaging and effective PDT in vivo. Moreover, based on the different fluorescent signals of PHHPEG6 NFs at the tumor tissue with or without PDT treatment, these NFs could be used to monitor the process of PDT and potentially guide cancer treatment. These multifunctional nanomaterials therefore allow control over the entire PDT process, from visualization of photosensitizer accumulation, via actual PDT to the assessment of the efficacy of the treatment. As such, these particles could have a potential advantage over currently applied PDT systems.
Experimental Section
The data that support the findings of this study are available in the Supporting Information of this article.
Conflict of interest
The authors declare no conflict of interest.
1.
Supporting information
As a service to our authors and readers, this journal provides supporting information supplied by the authors. Such materials are peer reviewed and may be re‐organized for online delivery, but are not copy‐edited or typeset. Technical support issues arising from supporting information (other than missing files) should be addressed to the authors.
Supporting Information
Acknowledgements
We acknowledge financial support from NWO (Spinoza award SPI 71‐259) and the Eurotech Postdoc Programme, under the Marie Skłodowska‐Curie grant agreement No 754462. All animal experiments were performed in accordance with the Guide for the Care and Use of Laboratory Animals and were approved by the Animal Care & Welfare Committee of Guangxi Medical University in compliance with Chinese law for experimental animals with an approval number of 202111007.
B. Sun, X. Guo, M. Feng, S. Cao, H. Yang, H. Wu, M. H. M. E. van Stevendaal, R. A. J. F. Oerlemans, J. Liang, Y. Ouyang, J. C. M. van Hest, Angew. Chem. Int. Ed. 2022, 61, e202208732; Angew. Chem. 2022, 134, e202208732.
Contributor Information
Prof. Yiqiang Ouyang, Email: ouyangyiqiang@stu.gxmu.edu.cn.
Prof. Jan C. M. van Hest, Email: J.C.M.v.Hest@tue.nl.
Data Availability Statement
The data that support the findings of this study are available from the corresponding author upon reasonable request.
References
- 1. Dolmans D. E., Fukumura D., Jain R. K., Nat. Rev. Cancer 2003, 3, 380–387. [DOI] [PubMed] [Google Scholar]
- 2. Pham T. C., Nguyen V. N., Choi Y., Lee S., Yoon J., Chem. Rev. 2021, 121, 13454–13619. [DOI] [PubMed] [Google Scholar]
- 3. Cao H., Qi Y., Gao X., Wei Z. J., Xia J., Wang L., Wang H., Yang Y., Li J., Chem. Commun. 2021, 57, 2245–2248. [DOI] [PubMed] [Google Scholar]
- 4. Sun B., Tao K., Jia Y., Yan X., Zou Q., Gazit E., Li J., Chem. Soc. Rev. 2019, 48, 4387–4400. [DOI] [PMC free article] [PubMed] [Google Scholar]
- 5. Nguyen V. N., Zhao Z., Tang B. Z., Yoon J., Chem. Soc. Rev. 2022, 51, 3324–3340. [DOI] [PubMed] [Google Scholar]
- 6. Zhao X., Liu J., Fan J., Chao H., Peng X., Chem. Soc. Rev. 2021, 50, 4185–4219. [DOI] [PubMed] [Google Scholar]
- 7. He S., Liu J., Zhang C., Wang J., Pu K., Angew. Chem. Int. Ed. 2022, 61, e202116669; [DOI] [PubMed] [Google Scholar]; Angew. Chem. 2022, 134, e202116669. [DOI] [PubMed] [Google Scholar]
- 8. Cao S., Shao J., Wu H., Song S., De Martino M. T., Pijpers I. A. B., Friedrich H., Abdelmohsen L. K. E. A., Williams D. S., van Hest J., Nat. Commun. 2021, 12, 2077. [DOI] [PMC free article] [PubMed] [Google Scholar]
- 9. Calixto G. M. F., Bernegossi J., De Freitas L. M., Fontana C. R., Chorilli M., Molecules 2016, 21, 342. [DOI] [PMC free article] [PubMed] [Google Scholar]
- 10. Lo P. C., Rodríguez-Morgade M. S., Pandey R. K., Ng D. K. P., Torres T., Dumoulin F., Chem. Soc. Rev. 2020, 49, 1041–1056. [DOI] [PubMed] [Google Scholar]
- 11. Li X., Lee S., Yoon J., Chem. Soc. Rev. 2018, 47, 1174–1188. [DOI] [PubMed] [Google Scholar]
- 12. Xie J., Wang Y., Choi W., Jangili P., Ge Y., Xu Y., Kang J., Liu L., Zhang B., Xie Z., Chem. Soc. Rev. 2021, 50, 9152–9201. [DOI] [PubMed] [Google Scholar]
- 13. Allison R. R., Mota H. C., Bagnato V. S., Sibata C. H., Photodiagn. Photodyn. Ther. 2008, 5, 19–28. [DOI] [PubMed] [Google Scholar]
- 14. Li X., Lovell J. F., Yoon J., Chen X., Nat. Rev. Clin. Oncol. 2020, 17, 657–674. [DOI] [PubMed] [Google Scholar]
- 15. Liu Y., Zhang L., Chang R., Yan X., Chem. Commun. 2022, 58, 2247–2258. [DOI] [PubMed] [Google Scholar]
- 16.
- 16a. Xie C., Zhen X., Lyu Y., Pu K., Adv. Mater. 2017, 29, 1703693; [DOI] [PubMed] [Google Scholar]
- 16b. Zhang C., Zeng Z., Cui D., He S., Jiang Y., Li J., Huang J., Pu K., Nat. Commun. 2021, 12, 2934; [DOI] [PMC free article] [PubMed] [Google Scholar]
- 16c. Jiang Y., Li J., Zeng Z., Xie C., Lyu Y., Pu K., Angew. Chem. Int. Ed. 2019, 58, 8161–8165; [DOI] [PubMed] [Google Scholar]; Angew. Chem. 2019, 131, 8245–8249; [Google Scholar]
- 16d. Wei X., Zhang C., He S., Huang J., Huang J., Liew S. S., Zeng Z., Pu K., Angew. Chem. Int. Ed. 2022, 61, e202202966; [DOI] [PubMed] [Google Scholar]; Angew. Chem. 2022, 134, e202202966. [DOI] [PubMed] [Google Scholar]
- 17. Delfi M., Sartorius R., Ashrafizadeh M., Sharifi E., Zhang Y., De Berardinis P., Zarrabi A., Varma R. S., Tay F. R., Smith B. R., Nano Today 2021, 38, 101119. [DOI] [PMC free article] [PubMed] [Google Scholar]
- 18. Makam P., Gazit E., Chem. Soc. Rev. 2018, 47, 3406–3420. [DOI] [PMC free article] [PubMed] [Google Scholar]
- 19. Chakroun R. W., Sneider A., Anderson C. F., Wang F., Wu P., Wirtz D., Cui H., Angew. Chem. Int. Ed. 2020, 59, 4434–4442; [DOI] [PubMed] [Google Scholar]; Angew. Chem. 2020, 132, 4464–4472. [Google Scholar]
- 20. Wang F., Su H., Lin R., Chakroun R. W., Monroe M. K., Wang Z., Porter M., Cui H., ACS Nano 2020, 14, 10083–10094. [DOI] [PubMed] [Google Scholar]
- 21. Sun B., Chang R., Cao S., Yuan C., Zhao L., Yang H., Li J., Yan X., van Hest J. C. M., Angew. Chem. Int. Ed. 2020, 59, 20582–20588; [DOI] [PMC free article] [PubMed] [Google Scholar]; Angew. Chem. 2020, 132, 20763–20769. [Google Scholar]
- 22. Kelley E. G., Albert J. N. L., Sullivan M. O., T. H. Epps III , Chem. Soc. Rev. 2013, 42, 7057–7071. [DOI] [PMC free article] [PubMed] [Google Scholar]
- 23. Li S., Zou Q., Li Y., Yuan C., Xing R., Yan X., J. Am. Chem. Soc. 2018, 140, 10794–10802. [DOI] [PubMed] [Google Scholar]
- 24. Celli J. P., Spring B. Q., Rizvi I., Evans C. L., Samkoe K. S., Verma S., Pogue B. W., Hasan T., Chem. Rev. 2010, 110, 2795–2838. [DOI] [PMC free article] [PubMed] [Google Scholar]
- 25. Lee S., Galbally-Kinney K. L., Murphy B. A., Davis S. J., Hasan T., Spring B., Tu Y. P., Pogue B. W., Isabelle M. E., O'Hara J. A. in Optical Methods for Tumor Treatment and Detection: Mechanisms and Techniques in Photodynamic Therapy XIX, SPIE Proceedings Vol. 7551 (Ed.: Kessel D. H.), SPIE, Bellingham, 2010. [Google Scholar]
- 26. Shen Y., Liang F. Q., Niu Y. H., Lin H. Y., Gu Y., Wilson B. C., Li B. H. in Biophotonics and Immune Responses XIV, SPIE Proceedings Vol. 10879 (Ed.: Chen W. R.), SPIE, Bellingham, 2019. [Google Scholar]
- 27. Simões J. C. S., Sarpaki S., Papadimitroulas P., Therrien B., Loudos G., J. Med. Chem. 2020, 63, 14119–14150. [DOI] [PubMed] [Google Scholar]
- 28. Petri A., Alexandratou E., Yova D., Lasers Surg. Med. 2022, 54, 311–319. [DOI] [PubMed] [Google Scholar]
- 29. He P. P., Li X. D., Wang L., Wang H., Acc. Chem. Res. 2019, 52, 367–378. [DOI] [PubMed] [Google Scholar]
- 30. Liu X., Chen Y., Li H., Huang N., Jin Q., Ren K., Ji J., ACS Nano 2013, 7, 6244–6257. [DOI] [PubMed] [Google Scholar]
- 31. Jia W. F., Wang Y. S., Liu R., Yu X. R., Gao H. L., Adv. Funct. Mater. 2021, 31, 2008130. [Google Scholar]
- 32. Geng Y., Dalhaimer P., Cai S. S., Tsai R., Tewari M., Minko T., Discher D. E., Nat. Nanotechnol. 2007, 2, 249–255. [DOI] [PMC free article] [PubMed] [Google Scholar]
- 33. Liu S., Zhou G., Liu D., Xie Z., Huang Y., Wang X., Wu W., Jing X., J. Mater. Chem. B 2013, 1, 101–109. [DOI] [PubMed] [Google Scholar]
- 34. Norouzi M., Drug Discovery Today 2018, 23, 912–919. [DOI] [PubMed] [Google Scholar]
- 35.
- 35a. Arnida M. M., Ray A., Peterson C. M., Ghandehari H., Eur. J. Pharm. Biopharm. 2011, 77, 417–423; [DOI] [PMC free article] [PubMed] [Google Scholar]
- 35b. Wei Y., Quan L., Zhou C., Zhan Q., Nanomedicine 2018, 13, 1495–1512. [DOI] [PubMed] [Google Scholar]
- 36.
- 36a. Tian J., Huang B., Nawaz M. H., Zhang W., Coord. Chem. Rev. 2020, 420, 213410; [Google Scholar]
- 36b. Biscaglia F., Gobbo M., Pept. Sci. 2018, 110, e24038. [Google Scholar]
- 37.
- 37a. Zhang X. L., Chen X. D., Li X. C., Ying C. F., Liu Z. B., Tian J. G., J. Opt. 2013, 15, 055206; [Google Scholar]
- 37b. Fukuzumi S., Honda T., Kojima T., Coord. Chem. Rev. 2012, 256, 2488–2502; [Google Scholar]
- 37c. Fujimura T., Aoyama Y., Sasai R., Tetrahedron Lett. 2019, 60, 150912. [Google Scholar]
- 38. Makovitzki A., Fink A., Shai Y., Cancer Res. 2009, 69, 3458–3463. [DOI] [PubMed] [Google Scholar]
- 39. Zhao J., Zheng D., Tao Y., Li Y., Wang L., Liu J., He J., Lei J., Biochem. Eng. J. 2020, 156, 107526. [Google Scholar]
- 40.
- 40a. Mahajan P. G., Dige N. C., Vanjare B. D., Phull A. R., Kim S. J., Hong S. K., Lee K. H., J. Fluoresc. 2018, 28, 871–882; [DOI] [PubMed] [Google Scholar]
- 40b. Mahajan P. G., Dige N. C., Vanjare B. D., Eo S. H., Seo S. Y., Kim S. J., Hong S. K., Choi C. S., Lee K. H., J. Photochem. Photobiol. A 2019, 377, 26–35; [Google Scholar]
- 40c. Rojkiewicz M., Kuś P., Kozub P., Kempa M., Dyes Pigm. 2013, 99, 627–635. [Google Scholar]
- 41. Zhao L., Liu Y., Chang R., Xing R., Yan X., Adv. Funct. Mater. 2019, 29, 1806877. [Google Scholar]
- 42.
- 42a. Albanese A., Chan W. C. W., ACS Nano 2011, 5, 5478–5489; [DOI] [PubMed] [Google Scholar]
- 42b. Cho E. C., Zhang Q., Xia Y., Nat. Nanotechnol. 2011, 6, 385–391. [DOI] [PMC free article] [PubMed] [Google Scholar]
Associated Data
This section collects any data citations, data availability statements, or supplementary materials included in this article.
Supplementary Materials
As a service to our authors and readers, this journal provides supporting information supplied by the authors. Such materials are peer reviewed and may be re‐organized for online delivery, but are not copy‐edited or typeset. Technical support issues arising from supporting information (other than missing files) should be addressed to the authors.
Supporting Information
Data Availability Statement
The data that support the findings of this study are available from the corresponding author upon reasonable request.


