

Summary
Background
Low‐quality evidence suggests that pre‐operative exclusive enteral nutrition (E/EN) can improve postoperative outcomes in patients with Crohn's disease (CD). It is not standard practice in most centres.
Aims
To test the hypothesis that pre‐operative EN in patients undergoing ileal/ileocolonic surgery for CD is associated with improved postoperative outcome.
Methods
We performed a single centre retrospective observational study comparing surgical outcomes in patients receiving pre‐operative EN (≥600 kcal/day for ≥2 weeks) with those who received no nutritional optimisation. Consecutive adult patients undergoing ileal/ileocolonic resection from 2008 to 2020 were included. The primary outcome was postoperative complications <30 days. Secondary outcomes included EN tolerance, specific surgical complications, unplanned stoma formation, length of stay, length of bowel resected, readmission and biochemical/anthropometric changes.
Results
300 surgeries were included comprising 96 without nutritional optimisation and 204 optimised cases: oral EN n = 173, additional PN n = 31 (4 of whom had received nasogastric/nasojejunal EN). 142/204 (69.6%) tolerated EN. 125/204 (61.3%) initiated EN in clinic. Patients in the optimised cohort were younger at operation and diagnosis, with an increased frequency of penetrating disease and exposure to antibiotics or biologics, and were more likely to undergo laparoscopic surgery. The optimised cohort had favourable outcomes on multivariate analysis: all complications [OR 0.29; 0.15–0.57, p < 0.001], surgical complications [OR 0.41; 95% CI 0.20–0.87, p = 0.02], non‐surgical complications [OR 0.24 95% CI 0.11–0.52, p < 0.001], infective complications [OR 0.32; 95% CI 0.16–0.66, p = 0.001].
Conclusions
Oral EN was reasonably well tolerated and associated with a reduction in 30‐day postoperative complications. Randomised controlled trials are required to confirm these findings.
Keywords: Crohn’s disease, enteral nutrition, surgery
Low‐quality evidence suggests that pre‐operative exclusive enteral nutrition (E/EN) can improve postoperative outcomes in patients with Crohn's disease (CD). It is not standard practice in most centres. We performed a retrospective observational study to test the hypothesis that pre‐operative EN in patients undergoing ileal/ileocolonic surgery for CD is associated with improved postoperative outcome. Consecutive adult patients undergoing ileal/ileocolonic resection from 2008 to 2020 were included. The primary outcome was postoperative complications within 30‐days. Secondary outcomes included EN tolerance, specific surgical complications, unplanned stoma formation, length of stay, length of bowel resected, readmission and biochemical/anthropometric changes. We have demonstrated that oral EN was reasonably well tolerated (69.6% achieved EN and 61.3% achieved EEN) and its use was associated with a reduction in 30‐day postoperative complications. Prospective randomised controlled trials are required to confirm these findings.

1. INTRODUCTION
Despite advances in medical therapy for Crohn's disease (CD), up to 80% of patients require surgery during their lifetime with 20% requiring re‐operation after 5 years. 1 Patients with CD are more likely to experience postoperative complications when compared to non‐CD patients undergoing abdominal surgery. 2 The reasons are multifactorial. Complex anatomy and the presence of disease complication (particularly intra‐abdominal abscess), 3 higher likelihood of needing emergency surgery 4 and poor pre‐operative nutritional state are associated with worse postoperative outcomes. 5 Malnutrition is present in up to 85% of patients undergoing surgery for CD. 6 Nutritional deficiency in patients with CD undergoing surgery is similarly multifactorial; symptoms cause reduced oral intake and active inflammation reduces micronutrient absorption and increases catabolism. 7
Exclusive enteral nutrition (EEN), entails provision of a patient's daily nutritional requirements with a liquid formula whilst excluding all other food and drink other than water. In addition to providing nutrition, it has been shown to induce and maintain remission in CD. 8 , 9 Potential benefits of therapy are broad and include improved nutritional status, 10 altered microbiome composition, 11 induction of mucosal healing, 12 altered levels of inflammatory proteins and pro‐inflammatory cytokines, 12 , 13 and corticosteroid withdrawal. 9 , 14
Previous studies have investigated the use of EEN in the pre‐operative setting. EEN has been shown to enable deferment or, occasionally, complete avoidance of surgery, as well as a reduction in complications and stoma formation. Most such studies are, however, small. 15 , 16 , 17 , 18 , 19 , 20 , 21 , 22 , 23 Larger studies, where EEN has predominantly been delivered nasogastrically, show a reduction in the need for urgent surgery and re‐operation along with reduced postoperative complications. 14 , 24
Using our large cohort of patients undergoing surgery for CD, many of whom are treated with EEN or partial enteral nutrition (PEN) as standard care, we aimed to understand the tolerability of oral enteral nutrition (EN) and test the hypothesis that it is associated with reduced postoperative complications within 30‐days.
2. MATERIALS AND METHODS
2.1. Study design
We conducted a retrospective observational cohort study in a single tertiary IBD centre to evaluate the associations between pre‐operative oral EN and postoperative complications. Adult patients with CD undergoing ileal or ileocolic resection or strictureplasty between September 2008 and March 2020 were included. Exclusion criteria included patients requiring emergency surgery for free gastrointestinal perforation or complete bowel obstruction, patients requiring parenteral nutrition (PN) from the outset or those with concomitant eating disorders.
Consecutive patients were identified from IBD‐dietetic and surgical databases, as well as from digital records. For the latter, operation codes for the relevant procedures were cross‐referenced with patients with a diagnosis of CD using a custom‐built package (EndoMineR®) in R 3.6.1 [R Foundation for Statistical Computing, Vienna, Austria]. All variables and outcome data were extracted manually from electronic patient records.
2.2. Definitions and data collection
All patients meeting the inclusion criteria and commencing pre‐operative EN were assigned to the optimised group and included in an intention‐to‐treat (ITT) analysis (ITT cohort). Patients were defined as ‘EN tolerant’ if they achieved ≥600 kcal/day for ≥2 weeks and did not require PN (henceforth described as the per protocol [PP] cohort), comprising both patients receiving EEN or PEN. EEN was defined as EN constituting at least 75% of the calculated nutritional requirements in the lead up to surgery. Any intake from a habitual diet was discouraged. PEN was defined as at least 600 kcal/day of EN and up to 75% of the calculated nutritional requirements of EN and supplemented with any form of the normal diet. All patients in the EN group were reviewed by a specialist IBD dietitian and had their nutritional requirements calculated based on Parenteral and Enteral Nutrition Group (PENG) handbook guidance using Henry or Schofield equations with a stress factor or 25‐35 kcal/kg/day and up to an additional 500 kcal/day where malnutrition was present. 25 One or more of the following products was prescribed for oral use: Modulen IBD® [Nestle Health Science, UK]; Fortisip®, Complan®, Scandishake®, Elemental 028 [Nutricia, UK]; Vital® [Abbott Nutrition, UK]. Patients who had completed the course of EEN, or where EEN was poorly tolerated, transitioned on to PEN prior to surgery. Patients failing oral EN were either given enteral feeding via nasogastric or nasojejunal (NG/J) tube or transferred onto parenteral nutrition (PN). Patients intolerant of EN, or where EN tolerance was not documented, were excluded from the PP analysis. All other patients comprised the non‐optimised cohort and if they received any oral nutritional support it was less than 600 kcal/day of EN. The malnutrition universal screening tool (MUST) score was used to assess the risk of malnutrition at baseline. In‐patients were regularly reviewed for tolerance and calorie intake. After discharge or where EN was initiated in out‐patient clinics, patients were monitored in the IBD dietitian telephone clinic. Patients reported their weight and any issues with EN tolerance and compliance with prescribed EN volume were discussed and addressed. Any continuing issues with EN intake meant weekly review in the IBD dietitian telephone clinic and patients of concern were discussed in the weekly multidisciplinary team (MDT) meeting. Tolerance data was collected from clinic documentation or retrospectively at surgical admission.
Irrespective of nutritional management, patients receiving corticosteroids were weaned to the lowest possible dose pre‐operatively. Micronutrient deficiencies were corrected. Patients with a phlegmon, abscess or where there was clinical concern with regards to CD‐related infection, received antibiotics for 2–6 weeks with abscess drainage if amenable. Patients were recorded as receiving pre‐operative biologic or immunomodulator therapy if these drugs were prescribed within 8 weeks of surgery. Pre‐operative steroids (prednisolone ≥10 mg or equivalent) or antibiotics (prescribed for the indication of CD) are referred to a prescription within 4 weeks of surgery.
Data collected included demographics, disease location and phenotype (Montreal classification), smoking status, pre‐operative medical therapy, nutritional optimisation, procedure data (procedure performed, approach, time to procedure from acute hospital admission if relevant), and imaging findings (degree of pre‐stenotic dilatation [PSD], presence of phlegmon or drainable/non‐drainable abscess). Biochemical and anthropometric measurements before and after optimisation collected as part of routine care were also recorded.
2.3. Outcomes
The primary outcome measure was 30‐day postoperative complications including all complications, surgical complications, non‐surgical complications (any medical complication occurring within 30‐days postoperatively) and infective complications. Severity of postoperative complication was classified as per the Clavien–Dindo classification. 26 Infections were clinically defined as any complication treated with antibiotics or Clavien–Dindo grade 1 wound infections. Where a patient experienced more than one complication, the most severe grade was selected for that patient.
Secondary outcomes included frequency of specific complications including prolonged ileus, wound infection and anastomotic complication (intra‐abdominal septic complication, anastomotic leak or bleed or re‐operation). In addition, the need for unplanned stoma formation, length of stay, readmission rates and length of small bowel resected were recorded.
Prolonged ileus was defined clinically as bowels not open and not tolerating oral diet ≥7 days +/− vomiting and the need for nasogastric decompression after excluding other intra‐abdominal causes of symptoms. Anastomotic leak was suspected by the radiologist on cross‐sectional imaging in the early postoperative period (day 1–10) when: (i) significant volume of extraluminal fluid and/or gas was seen adjacent to the surgical anastomosis; (ii) extraluminal contrast was seen (in cases where oral contrast had been administered prior to the scan) or (iii) large volume pneumoperitoneum was seen in excess to that expected. Suspected anastomotic leaks proceeding to re‐operation, where anastomotic leak was not found intra‐operatively, were classed as re‐operations. Postoperative abscess was defined as a rim enhancing fluid/gas containing collection within the abdomen/pelvis in the early postoperative period.
The project was considered a review of clinical practice and ethical approval was not required according to the guidelines of the UK Health Research Authority. 27
2.4. Statistical analysis
Chi‐squared tests were used for comparing categorical variables, with Mann–Whitney U test or Student’s t‐test used where applicable for continuous variables. Wilcoxon signed‐rank test was used to compare continuous paired variables. All continuous variables were analysed as such, except for: PSD which was categorised as a binary variable (<3 cm or ≥3 cm), as this has been identified as a clinically relevant cut‐off for likelihood of requiring surgical intervention 28 ; and MUST score (<2 or ≥2), where a score of ≥2 defines patients at high risk of malnutrition. 29 Multivariate analysis (MVA) with binary logistic regression was performed to identify variables associated with primary and secondary outcome measures. Variables included in the MVA comprised those with p ≤ 0.10 on univariate analysis (UVA) or were predetermined variables with a proposed mechanistic association. Where data were missing, these cases were excluded from MVA. The odds ratio (OR) and 95% confidence intervals (CI) were calculated for each variable. Hypothesis testing was two‐sided and a p‐value ≤0.05 was considered significant. Statistical analysis was performed using SPSS 25.0 software (SPSS, Inc.).
3. RESULTS
Three hundred procedures (ileal or ileocolic resection and/or strictureplasty) performed in 293 patients between 2008 and 2020 were included (Figure 1). Five cases refused EN from the outset and were allocated to the non‐optimised group (one allergy concern, three prior experience and declined, one not documented). EN was prescribed in 204 cases for a median 55 (42–77) days (ITT cohort); 142/204 (69.6%) cases were confirmed to have tolerated ≥600 kcal/day for ≥2 weeks without requiring PN (PP cohort). Seven cases received <2 weeks EN and proceeded straight to surgery, 3 cases received <600 kcal/day for ≥2 weeks, 21 cases received median 49 (40–58) days EN but tolerance was not documented. The remaining 31 cases commenced PN for median 25 (11–29, 32–37) days after a period of EN. Baseline characteristics of the PN group are shown in Supporting Information 1 and suggest a more severe phenotype. The PN group comprised 4 cases who tolerated less than 2 weeks EN (range 8–13 days) and 27 cases who received ≥2 weeks (range 20–224 days). Two cases requiring PN were transferred from other units for tertiary assessment after a period of EN. Four cases trialling NG/NJ feeding after oral EN failure all subsequently received PN. All cases received PN in hospital because the average delay in arranging home PN within our service is 1 month by which time the majority of patients had either undergone, or were soon to undergo, surgery. Cases who received ≥30 days of PN (13/31), compared with those who received a shorter duration (18/31), were more likely to have an abscess at baseline (8/13 [61.5%] vs 3/18 [16.7%], p = 0.01) and to have lost ≥10% of their body weight in the preceding 3–6 months (13/13 [100%] vs 9/18 [50.0%], p = 0.002). The majority of patients in the ITT cohort (155/204, 76.0%) received ≥6 weeks of nutritional optimisation. 31/204 (15.2%) cases trialled two or more different nutritional drinks to maintain tolerance.
FIGURE 1.
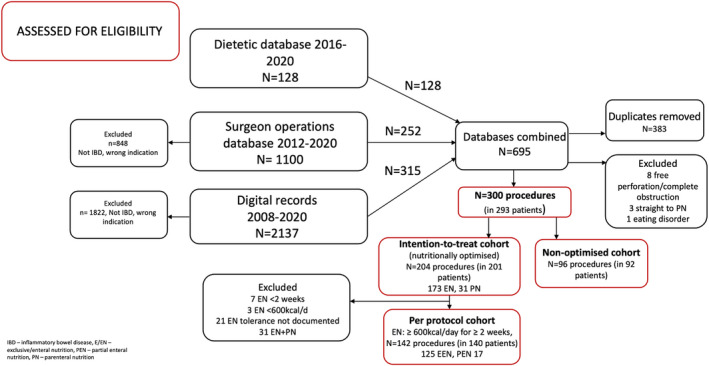
Patient disposition.
PP cases were optimised for median 59 (42–80) days. Amongst the PP cohort, 125 cases received EEN for a median 55 (42–72) days, accounting for 88.0% and 61.3% of PP and ITT cohorts, respectively. Twenty of these transitioned to PEN (for median 56 [42–68] days) after completing the course of EEN (median 51 [38–75] days). Seventeen cases received PEN for median 34 (20–58) days. Four of these cases had intended PEN at the outset. These data were combined in the PP analysis. The majority of cases in the PP cohort received EN ≥6 weeks (115/142, 81.0%). The non‐optimised cohort comprised 96 cases. Three hundred cases were therefore included in the ITT analysis and 238 cases were included in the PP analysis. Table 1 shows the baseline characteristics within each group. The frequency of missing data is shown in Supporting Information 2.
TABLE 1.
Baseline characteristics
| Baseline characteristic | Intention‐to treat (ITT) cohort [any duration EN +/− PN] (n = 204) | Per‐protocol (PP) cohort [EN ≥2 weeks] (n = 142) | Non‐optimised cohort (n = 96) |
p‐value ITT vs non‐optimised |
p‐value PP vs non‐optimised |
|---|---|---|---|---|---|
| Patient characteristics | |||||
| Median age at operation in years (IQR) | 34.9 (27.8–44.2) | 34.2 (27.8–42.4) | 41.3 (32.5–54.4) | <0.01 | <0.001 |
| Sex‐ female (n, %) | 96 (47.1) | 66 (46.5) | 59 (61.5) | 0.02 | 0.02 |
| Median age at diagnosis in years (IQR) | 23.8 (18.2–31.6) | 23.8 (18.4–30.7) | 28.2 (18.8–38.5) | 0.002 | 0.001 |
| Median disease duration years (IQR) | 8.4 (2.7–17.1) | 7.5 (2.3–17.1) | 10.9 (3.5–19.5) | 0.17 | 0.06 |
| Penetrating phenotype (n, %) | 115 (56.4) | 78 (54.9) | 38 (39.6) | 0.007 | 0.02 |
| L1‐ileal (n, %) | 60 (29.4) | 45 (31.7) | 32 (33.3) | 0.49 | 0.79 |
| L3‐ileocolonic (n, %) | 144 (70.6) | 97 (68.3) | 64 (667) | 0.49 | 0.79 |
| +L4 – UGI (n, %) | 9 (4.4) | 8 (5.6) | 4 (4.2) | 0.92 | 0.61 |
| +p‐ perianal (n, %) | 54 (26.5) | 35 (24.6) | 19 (19.8) | 0.21 | 0.38 |
| Prior CD resection (n, %) | 89 (43.6) | 62 (43.7) | 50 (52.1) | 0.17 | 0.20 |
| Index presentation (n, %) | 9 (4.4) | 6 (4.2) | 4 (4.2) | 0.92 | 0.98 |
| Disease activity requiring admission within 90 days pre‐operatively | 83 (40.7) | 41 (28.9) | 22 (22.9) | 0.003 | 0.31 |
| Preoperative medications | |||||
| Immunomodulator (n, %) | 110 (53.9) | 80 (56.3) | 57 (59.4) | 0.38 | 0.64 |
| Biologic (n, %) | 112 (54.9) | 79 (55.6) | 24 (25.0) | <0.001 | <0.001 |
| ≥2 prior biologics | 59 (28,9) | 44 (31.0) | 6 (6.3) | <0.001 | <0.001 |
| Anti‐TNF | 84 (41.2) | 61 (43.0) | 22 (22.9) | 0.002 | 0.001 |
| Ustekinumab/Vedolizumab | 28 (13.7) | 18 (12.7) | 2 (2.1) | 0.002 | 0.004 |
| Steroids <4 weeks pre‐operatively (n, %) | 29 (14.2) | 18 (12.7) | 13 (13.5) | 0.45 | 0.85 |
| ≥10 mg prednisolone at surgical admission (n, %) | 7 (3.4) | 2 (1.4) | 9 (9.4) | 0.03 | 0.004 |
| Antibiotics (n, %) | 83 (40.7) | 53 (37.3) | 20 (20.8) | <0.01 | 0.007 |
| Radiology | |||||
| Abscess (n, %) | 42 (20.6) | 27 (19.0) | 10 (10.4) | 0.03 | 0.07 |
| IR guided drainage pre‐operatively (n, %) | 6 (2.9) | 3 (2.1) | 6 (6.3) | 0.17 | 0.10 |
| Median PSD, cm (IQR) | 3.0 (0.0–4.0) | 2.8 (0.0–3.8) | 2.0 (0.0–3.6) | 0.06 | 0.14 |
| PSD ≥3.0 cm | 100/196 (51.0) | 65/137 (47.4) | 35/90 (38.9) | 0.06 | 0.20 |
| Surgical procedure | |||||
| Performed within 4 weeks of acute admission | 32 (15.7) | 11 (7.7) | 18 (18.8) | 0.51 | 0.01 |
| Laparoscopy (n, %) | 69 (33.8) | 55 (38.7) | 20 (20.8) | 0.02 | 0.004 |
| Ileocaecal (n, %) | 87 (42.6) | 59 (41.5) | 40 (41.7) | 0.87 | 0.99 |
| Right hemicolectomy (n, %) | 57 (27.9) | 41 (28.9) | 32 (33.3) | 0.39 | 0.46 |
| Ileocolic and SB/SP (n, %) | 19 (9.3) | 15 (10.6) | 9 (9.4) | 0.99 | 0.77 |
| SB resection or SP only (n, %) | 41 (20.1) | 27 (19.0) | 15 (15.6) | 0.41 | 0.50 |
| Additional left colic resection (n, %) | 9 (4.4) | 8 (5.6) | 6 (6.3) | 0.50 | 0.84 |
| Additional fistula excision outside resection margin (n, %) | 35 (17.2) | 23 (16.2) | 14 (14.6) | 0.69 | 0.74 |
| Intra‐operative abscess drainage (n, %) | 4 (2.0) | 3 (2.1) | 1 (1.0) | 0.56 | 0.53 |
| Baseline haematological/biochemical markers and BMI | |||||
| Haemoglobin (g/L) | 126.0 (112.5–137.0) | 126.0 (114.0–138.0) | 129.0 (117.5–134.0) | 0.59 | 0.98 |
| Albumin (g/L) | 40.5 (36.0–44.0) | 40.0 (37.0–45.0) | 42.0 (39.0–45.0) | 0.03 | 0.10 |
| C‐reactive protein (mg/L) | 12.0 (3.0–40.0) | 10.0 (2.0–38.5) | 7.0 (4.0–23.0) | 0.38 | 0.79 |
| Median days of nutrition (IQR, Range) | 55.0 (42.0–77.0) | 59.5 (42.0–80.0) | NA | NA | NA |
| Baseline BMI kg/m2(%) | 22.0 (19.7–24.9) | 22.5 (20.1–25.1) | 23.6 (20.6–27.3) | 0.15 | 0.18 |
| BMI category | N = 196 | N = 140 | N = 51 | ||
| ≥25.0 | 48 (24.5) | 35 (25.0) | 19 (37.3) | 0.07 | 0.10 |
| ≥20.0 | 140 (71.4) | 106 (75.7) | 40 (78.4) | 0.32 | 0.69 |
| 18.5 < 20.0 | 33 (16.8) | 23 (16.4) | 7 (13.7) | 0.59 | 0.65 |
| <18.5 | 23 (11.7) | 11 (7.9) | 4 (7.8) | 0.43 | 0.99 |
| Baseline weight loss category (%) | N = 194 | N = 138 | N = 48 | ||
| Weight loss <5% | 82 (42.3) | 68 (49.3) | 28 (58.3) | 0.05 | 0.28 |
| Weight loss 5–10% | 52 (26.8) | 38 (27.5) | 12 (25.0) | 0.80 | 0.73 |
| Weight loss >10% | 60 (30.9) | 32 (23.2) | 8 (16.7) | 0.05 | 0.34 |
| Median baseline MUST score | 1 (0–2) | 0 (0–2) | 0 (0–2) | 0.13 | 0.91 |
| Baseline MUST ≥2 | 70 (35.7) | 36 (25.9) | 15 (29.4) | 0.39 | 0.63 |
Bold value indicates statistical significance of p ≤ 0.05.
Investigation results are compared at baseline (i.e. pre‐EEN in the optimised cohort versus pre‐operatively in the non‐optimised cohort).
Abbreviations: BMI, body mass index; CD, Crohn’s; disease; IQR, interquartile range; IR, interventional radiology; ITT, intention‐to‐treat; MUST, malnutrition universal screening tool; PP, per‐protocol; PSD, pre‐stenotic dilatation; SB, small bowel; SP, stricturoplasty; TNF, tumour necrosis factor; UGI, upper gastrointestinal disease.
3.1. Cohort comparisons
All operations were performed by one of four experienced IBD surgeons. The EN cohort underwent surgery on average 5 years later than the non‐optimised cohort, reflecting a change in clinical practice in our centre.
Compared with the non‐optimised cohort, the ITT cohort were younger at operation (median age [IQR] 34.9 [27.8–44.2] years vs 41.3 [32.5–54.4] years, p 0.01) and were younger at diagnosis (23.8 [18.2–31.6] years vs 28.2 [18.8–38.5] years, p = 0.002). The ITT cohort included fewer females (96/204, 47.1% vs 59/96, 61.5%, p = 0.02) and had an increased frequency of penetrating disease (115/204 [56.4%] vs 38/96 [39.6%], p = 0.007) and pre‐operative abscess (41/204 [20.6%] vs (10/96 [10.4%], p = 0.03). They were also more likely to be receiving biologic therapy (112/204, 54.9% vs 24/96, 25.0%, p < 0.001) and antibiotics (83/204 [40.7%] vs 20/96 [20.8%], p 0.01) and had a lower baseline serum albumin (ITT: 41.0 [36.0–44.0] g/L vs non‐optimised 42.0 [39.0–45.0] g/L).
Compared to the non‐optimised cohort, patients in the ITT cohort were less likely to undergo open surgery (135/204, 66.2% vs 76/96, 79.2.%, p = 0.02), despite no differences seen in the surgical procedure performed. A greater frequency of cases in the ITT cohort was admitted acutely to the hospital within 90‐days of their procedure due to symptomatic surgical disease (ITT cohort 83/204 [40.7%] vs non‐optimised cohort 22/96 [22.9], p = 0.003). Despite this, a similar proportion proceeded to surgery within 4 weeks of an acute admission (ITT cohort 32/204 [15.7%] vs non‐optimised cohort 18/96 [18.8%], p = 0.43). When this occurred, laparotomy was the most common approach and similar between the cohorts (ITT cohort 25/32 [78.1%] vs non‐optimised 17/18 [94.4%] p = 0.13). For procedures performed beyond this time frame the overall frequency of laparotomy was reduced and did not differ significantly (ITT cohort 110/172, 64.0% vs non‐optimised cohort 59/78, 75.6%, p = 0.07).
The ITT and non‐optimised groups had similar baseline biochemical parameters, body mass index (BMI) and baseline MUST score, although ITT cases were more likely to have lost ≥10% of their body weight 3–6 months pre‐operatively compared to the non‐optimised cohort (60/194 [30.9%] vs 8/48 [16.7%], respectively, p = 0.05). However, nearly 50% of the non‐optimised cohort had missing data for this outcome. The proportion of cases taking steroids within 4 weeks of surgery was similar (29/204, 14.2% vs 13/96, 13.5%, p = 0.45). However, ITT cases were more likely to have withdrawn steroids by the time of their operation (ongoing corticosteroids at surgical admission: ITT: 7/204, 3.4% vs non‐optimised: 9/96, 9.4%, p = 0.03).
3.2. Association between EN and postoperative complications
3.2.1. Intention‐to‐treat analysis
The summary of outcome data is shown in Table 2. In the ITT univariate analysis, the frequency of complications within 30 days postoperatively was lower in the ITT cohort vs non‐optimised group: all complications (49/204 [24.0%] vs 52/96 [54.2%]; p < 0.001), surgical complications (37/204 [18.1%] vs 36/96 [37.5%], p < 0.001), non‐surgical complications (24/204 [11.8%] vs 31/96 [32.3%], p < 0.001) and infective complications (27/204 [13.2%] vs 33 [34.4%], p < 0.001). Specific non‐surgical complications are shown in Supporting Information 3.
TABLE 2.
Summary of primary and secondary outcome data
| Outcome variable |
Intention‐to‐treat cohort (n = 204) |
Per‐protocol cohort (n = 142) |
Non‐optimised cohort (n = 6) |
Univariate and multivariate analyses comparing ITT cohort and PP cohort vs non‐optimised cohort | |||
|---|---|---|---|---|---|---|---|
| Univariate analysis | Multivariate analysis | ||||||
| OR (95%CI) | p‐value | OR (95%CI) | p‐value | ||||
| Primary outcome | Number of surgeries with outcome variable, % | ||||||
| All complications | 49 (24.0) | 0.27 (0.16–0.45) | <0.001 | 0.29 (0.15–0.57) | <0.001 | ||
| 31 (21.8) | 52 (54.2) | 0.23 (0.13–0.42) | <0.001 | 0.29 (0.13–0.63) | 0.002 | ||
| Surgical complications | 37 (18.1) | 0.37 (0.21–0.64) | <0.001 | 0.41 (0.20–0.87) | 0.02 | ||
| 25 (17.6) | 36 (37.5) | 0.36 (0.20–0.65) | <0.001 | 0.46 (0.21–1.02) | 0.055 | ||
| Non‐surgical complications | 24 (11.8) | 0.28 (0.15–0.51) | <0.001 | 0.24 (0.11–0.52) | <0.001 | ||
| 13 (9.2) | 31 (32.3) | 0.21 (0.10–0.43) | <0.001 | 0.21 (0.08–0.51) | <0.001 | ||
| Infective complications | 27 (13.2) | 0.29 (0.16–0.52) | <0.001 | 0.32 (0.16–0.66) | 0.002 | ||
| 16 (11.3) | 33 (34.4) | 0.24 (0.12–0.47) | <0.001 | 0.27 (0.11–0.60) | 0.001 | ||
| Secondary outcome | |||||||
| Wound Infection | 10 (4.9) | 0.30 (0.13–0.71) | 0.002 | 0.22 (0.07–0.74) | 0.02 | ||
| 6 (4.2) | 14 (14.6) | 0.26 (0.10–0.70) | 0.005 | 0.25 (0.07–0.92) | 0.04 | ||
| Prolonged ileus | 13 (6.3) | 0.34 (0.16–0.74) | 0.005 | 0.33 (0.12–0.90) | 0.03 | ||
| 11 (7.7) | 16 (16.6) | 0.38 (0.13–1.09) | 0.07 | 0.29 (0.09–0.91) | 0.03 | ||
| Abdominal collection | 14 (6.9) | 0.45 (0.20–1.03) | 0.18 | ||||
| 7 (4.9) | 11 (11.5) | 0.40 (0.15–1.07) | 0.06 | ||||
| Anastomotic leak | 1 (0.5) | 0.26 (0.02–2.89) | 0.24 | ||||
| 0 (0.0) | 1 (1.0) | 0.99 (0.97–1.01) | 0.22 | ||||
| Anastomotic bleed | 1 (0.5) | 1.01 (0.99–1.02) | 0.49 | ||||
| 1 (0.7) | 0 (0.0) | 1.01 (0.99–1.02) | 0.49 | ||||
| Re‐operation | 4 (2.0) | 0.46 (0.11–2.89) | 0.27 | ||||
| 3 (2.1) | 4 (4.2) | 0.49 (0.11–2.27) | 0.36 | ||||
| Intra‐abdominal septic or anastomotic complication (collection, anastomotic leak, re‐operation) | 17 (8.3) | 0.53 (0.25–1.13) | 0.13 | ||||
| 10 (7.0) | 14 (14.6) | 0.44 (0.9–1.05) | 0.06 | ||||
| Unplanned stoma |
56/183 (30.6) |
1.03 (0.59–1.78) | 0.91 | ||||
| 30/128 (23.4) | 27/90 (30.0) | 0.71 (0.39–1.31) | 0.28 | ||||
| Readmission | 11 (5.4) | 0.33 (0.15–0.77) | 0.007 | 0.32 (0.11–0.92) | 0.03 | ||
| 7 (5.5) | 14 (14.6) | 0.30 (0.12–0.78) | 0.01 | 0.21 (0.05–0.91) | 0.04 | ||
| UVA B unstandardised B coefficient (95% CI), p value | MVA B unstandardised B coefficient (95% CI), p value | 95% CI | p value | ||||
| Length of small bowel resected (cm) | 14.0 (7.3–22.6) | 0.10 (−3.32 to 3.69), p = 0.92 | |||||
| 13.0 (7.0–23.0) | 14.0 (7.5–21.0) |
0.21 (−3.79 to 4.23), p = 0.91 |
|||||
| Length of stay (days) | 8.0 (6.0–14.8) | 1.93 (−0.08 to 7.43), p = 0.06 | |||||
| 7.0 (5.0–11.0) | 10.0 (7.0–13.0) |
−1.51 (−4.24 to 1.22), p=0.28 |
|||||
Bold value indicates statistical significance of p ≤ 0.05.
Abbreviations: CI, confidence interval; ITT, intention‐to‐treat; MVA, multivariable analysis; OR, odds ratio; PP, per‐protocol; UVA, univariate analysis.
On UVA of secondary outcome measures comparing ITT and non‐optimised cohorts, respectively, there were lower rates of wound infection (10/204 [4.9%] vs 14/96 [14.6%], p = 0.002) and prolonged ileus (13/204 [6.3%] vs 16/96 [16.6%], p = 0.005) but not anastomotic complications (p = 0.13). Reasons for re‐operation are shown in Supporting Information 4. All patients requiring re‐operation in the ITT cohort had received ≥6 weeks nutritional optimisation. There was no difference in the frequency of anastomotic leak, bleed or re‐operation, nor were there differences in the frequency of overall (77/204 [37.7%] vs 33/96 [34.4%], p = 0.57) or unplanned stoma formation (ITT: 56/183 [30.6%] vs non‐optimised: 27/90 [30.0%], p = 0.91) or length of small bowel resected (p = 0.92). Length of stay was similar (p = 0.06) but non‐optimised patients were more likely to be re‐admitted to hospital within 30 days postoperatively (11/204 [5.4%] vs 14/96 [14.6%], p = 0.007).
Supporting Information 5 summarises the frequency of complications as per the Clavien–Dindo classification. There were fewer grade 1 and 2 complications in the ITT cohort (grade 1; 6/204 [2.9%] vs 12/96 [12.5%], p = 0.001 and grade 2; 33/204 [16.2%] vs 32/96 [33.3%], p < 0.001). The frequency of complications grade 3 or greater was numerically higher in the ITT cohort but not statistically significant (10/204 [4.9%] vs 8/96 [8.3%], p = 0.24).
MVA were performed for all factors contributing to the primary outcome measure demonstrating a significant reduction in all outcomes in the ITT cohort with similar odds ratios as seen in the univariate analyses (Tables 2, 3, 4, 5, 6: all complications [OR 0.29; 95% CI 0.15–0.57, p < 0.001], surgical complications [OR 0.41; 95% CI 0.20–0.87, p = 0.02], non‐surgical complications [OR 0.24; 95% CI 0.11–0.52, p < 0.001] and infective complications [OR 0.32 95% CI 0.16–0.66, p = 0.002]).
TABLE 3.
All complications – univariate and multivariate intention‐to‐treat analysis
| ITT analysis: All complications | ITT vs non‐optimised cohort | |||||
|---|---|---|---|---|---|---|
| Independent variables | Univariate analysis | Multivariate analysis |
Multivariate analysis (Adjustment for MUST/BMI) |
|||
| OR (95% CI) | p‐value | OR (95% CI) | p‐value | OR (95% CI) | p‐value | |
| Female | 0.93 (0.58–1.50) | 0.77 | ||||
| Age at operation | 0.01 (0.008–0.02) | <0.001 | 1.03 (1.01–1.06) | 0.008 | 1.04 (1.01–1.07) | 0.02 |
| Disease duration | 0.01 (0.006–0.02) | <0.001 | 1.05 91.01–1.09) | 0.02 | 1.06 (1.01–1.11) | 0.01 |
| L1 disease | 0.87 (0.52–1.47) | 0.60 | ||||
| Penetrating disease | 0.72 (0.45–1.16) | 0.18 | 1.24 (0.64–2.37) | 0.53 | 1.14 (0.51–2.56) | 0.75 |
| Perianal disease | 0.52 (0.28–0.95) | 0.03 | 0.41 (0.20–0.88) | 0.02 | 0.26 (0.10–0.71) | 0.008 |
| UGI disease | 1.24 (0.40–3.90) | 0.71 | ||||
| Index presentation | 0.87 (0.26–2.90) | 0.82 | ||||
| Prior resection | 1.74 (1.07–2.82) | 0.02 | 1.30 (0.67–2.53) | 0.44 | 0.91 (0.40–2.10) | 0.83 |
| Disease requiring acute admission within 90 days pre‐operatively | 0.92 (0.55–1.52) | 0.73 | 1.04 (0.51–2.13) | 0.92 | 0.89 (0.36–2.17) | 0.79 |
| Immunomodulator | 0.82 (0.51–1.33) | 0.43 | 1.15 (0.62–2.12) | 0.66 | 1.42 (0.67–3.03) | 0.36 |
| Biologic therapy | 0.70 (0.43–1.14) | 0.16 | 1.29 (0.69–2.42) | 0.43 | 1.64 (0.77–3.48) | 0.20 |
| ≥2 prior biological therapies | 0.64 (0.34–1.18) | 0.15 | ||||
| Corticosteroids <4 weeks | 1.77 (0.92–3.44) | 0.09 | 2.01 (0.91–4.42) | 0.08 | 2.10 (0.86–5.13) | 0.10 |
| Antibiotics | 0.73 (0.44–1.22) | 0.23 | 1.16 (0.54–2.47) | 0.71 | 0.99 (0.40–2.43) | 0.97 |
| Nutritional optimisation | 0.27 (0.16–0.45) | <0.001 | 0.29 (0.15–0.57) | <0.001 | 0.19 (0.07–0.45) | <0.001 |
| Laparoscopic | 0.39 (0.21–0.70) | 0.001 | 0.81 (0.38–1.73) | 0.59 | 0.61 (0.25–1.52) | 0.29 |
| Operation scheduled within four weeks of acute presentation | 1.02 (0.54–1.93) | 0.96 | ||||
| PSD ≥3 cm | 0.69 (0.42–1.13) | 0.14 | ||||
| Abscess | 1.17 (0.63–2.17) | 0.63 | ||||
| IR drainage preoperatively | 0.99 (0.29–3.35) | 0.98 | ||||
| Abscess drainage intra‐operatively | 8.17 (0.90–74.04) | 0.03 | 19.13 (1.71–214.29) | 0.02 | 19.07 (1.47–248.26) | 0.02 |
| Surgeon 1 | 0.86 (0.49–1.50) | 0.60 | ||||
| Surgeon 2 | 0.85 (0.45–1.58) | 0.60 | ||||
| Surgeon 3 | 0.90 (0.55–1.48) | 0.68 | ||||
| Surgeon 4 | 2.12 (1.02–4.40) | 0.04 | 1.36 (0.55–3.39) | 0.50 | 0.51 (0.11–2.34) | 0.39 |
| Ileocaecal resection | 0.85 (0.52–1.37) | 0.49 | 0.88 (0.25–3.12) | 0.85 | 2.17 (0.50–9.41) | 0.30 |
| Right hemicolectomy | 1.11 (0.68–1.83) | 0.68 | 1.23 (0.38–4.03) | 0.73 | 2.59 (0.63–10.72) | 0.19 |
| SB resection/SP | 1.22 (0.72–2.07) | 0.46 | 1.28 (0.45–3.64) | 0.65 | 3.25 (0.95–11.13) | 0.06 |
| Additional left colic resection | 1.78 (0.63–5.05) | 0.27 | 1.83 (0.57–5.90) | 0.31 | 1.55 (0.34–7.08) | 0.58 |
| Additional fistula excision | 1.31 (0.69–2.46) | 0.41 | ||||
| Baseline MUST score ≥2 | 1.67 (0.96–2.90) | 0.07 | 3.22 (1.38–7.53) | 0.007 | ||
| BMI ≥25 (kg/m2) | 1.48 (0.82–2.66) | 0.19 | 1.68 (0.75–3.73) | 0.21 | ||
Bold value indicates statistical significance of p ≤ 0.05.
Abbreviations: BMI, body mass index; CI, confidence interval; IR drainage, interventional radiology guided drainage; ITT, intention‐to‐treat; MUST, malnutrition universal screening tool; OR, odds ratio; PSD, pre‐stenotic dilatation; SB, small bowel; SP, stricturoplasty; UGI, upper gastrointestinal disease.
TABLE 4.
Surgical Complications – univariate and multivariate intention‐to‐treat analysis
| ITT analysis: Surgical complications | ITT vs non‐optimised cohort | |||||
|---|---|---|---|---|---|---|
| Independent variables | Univariate analysis | Multivariate analysis |
Multivariate analysis (Adjustment for MUST/BMI) |
|||
| OR (95% CI) | p‐value | OR (95% CI) | p‐value | OR (95% CI) | p‐value | |
| Female | 0.95 (0.56–1.61) | 0.85 | ||||
| Age at operation | 0.005 (0.002–0.008) | 0.004 | 1.01 (0.99–1.04) | 0.30 | 1.001 (0.98–1.04) | 0.40 |
| Disease duration | 0.007 (0.002–0.01) | 0.006 | 1.04 (0.99–1.08) | 0.07 | 1.05 (0.99–1.10) | 0.07 |
| L1 disease | 0.74 (0.41–1.34) | 0.32 | ||||
| Penetrating disease | 0.74 (0.43–1.25) | 0.26 | 1.06 (0.51–2.22) | 0.87 | 1.13 (0.48–2.66) | 0.77 |
| Perianal disease | 0.47 (0.23–0.96) | 0.03 | 0.36 (0.15–0.89) | 0.03 | 0.25 (0.008–0.79) | 0.02 |
| UGI disease | 2.01 (0.64–6.36) | 0.23 | ||||
| Index presentation | 0.55 (0.12–2.56) | 0.44 | ||||
| Prior resection | 1.46 (0.86–2.47) | 0.16 | 1.30 (0.62–2.71) | 0.49 | 1.11 (0.45–2.74) | 0.81 |
| Disease requiring acute admission within 90 days pre‐operatively | 0.75 (0.42–1.32) | 0.32 | 0.86 (0.37–1.98) | 0.72 | 0.78 (0.30–2.06) | 0.62 |
| Immunomodulator | 0.77 (0.45–1.30) | 0.33 | 0.89 (0.45–1.76) | 0.73 | 0.93 (0.43–2.03) | 0.86 |
| Biologic therapy | 0.61 (0.35–1.05) | 0.07 | 1.08 (0.54–2.15) | 0.83 | 1.34 90.61–2.95) | 0.46 |
| ≥2 prior biological therapies | 0.65 (0.32–1.29) | 0.21 | ||||
| Corticosteroids | 2.45 (1.24–4.86) | 0.009 | 3.21 (1.39–7.44) | 0.007 | 3.58 (1.43–8.98) | 0.006 |
| Antibiotics | 0.66 (0.37–1.17) | 0.15 | 0.81 (0.34–1.90) | 0.62 | 0.67 (0.25–1.76) | 0.41 |
| Nutritional optimisation | 0.37 (0.21–0.64) | <0.001 | 0.41 (0.20–0.87) | 0.02 | 0.33 (0.13–0.84) | 0.02 |
| Laparoscopic | 0.65 90.36–1.20) | 0.17 | 1.24 (0.53–2.90) | 0.62 | 1.03 90.40–2.70) | 0.95 |
| Operation scheduled within four weeks of acute presentation | 0.74 (0.35–1.57) | 0.43 | ||||
| PSD ≥3 cm | 0.49 (0.28–0.87) | 0.01 | 1.02 (0.99–1.05) | 0.25 | 0.46 (0.20–1.05) | 0.07 |
| Abscess | 1.32 (0.68–2.59) | 0.40 | ||||
| IR drainage pre‐operatively | 0.61 (0.13–2.86) | 0.53 | ||||
| Abscess drainage intra‐operatively | 13.10 (1.44–119.17) | 0.003 | 21.74 (1.82–259.95) | 0.02 | 20.89 (1.59–274.61) | 0.02 |
| Surgeon 1 | 0.83 (0.45–1.55) | 0.56 | ||||
| Surgeon 2 | 0.54 (0.25–1.16) | 0.11 | ||||
| Surgeon 3 | 1.20 (0.70–2.06) | 0.51 | ||||
| Surgeon 4 | 1.99 (0.92–4.29) | 0.07 | 1.48 (0.55–3.99) | 0.44 | 0.73 (0.17–3.12) | 0.67 |
| Ileocaecal resection | 0.80 (0.47–1.36) | 0.40 | 0.71 (0.18–2.83) | 0.63 | 1.34 (0.28–6.33) | 0.71 |
| Right hemicolectomy | 1.24 (0.72–2.12) | 0.45 | 1.03 (0.29–3.70) | 0.96 | 1.64 (0.38–7.13) | 0.51 |
| SB resection/SP | 1.15 (0.64–2.05) | 0.64 | 1.52 (0.50–4.64) | 0.46 | 2.81 (0.77–10.32) | 0.12 |
| Additional left colic resection | 2.90 (1.02–8.31) | 0.04 | 2.68 (0.77–9.33) | 0.12 | 2.66 (0.58–12.22) | 0.21 |
| Additional fistula excision | 1.30 (0.66–2.58) | 0.45 | ||||
| Baseline MUST score ≥2 | 1.34 (0.73–2.45) | 0.35 | 2.63 (1.03–6.67) | 0.04 | ||
| BMI ≥25 (kg/m2) | 1.96 (1.04–3.66) | 0.03 | 2.27 (0.98–5.27) | 0.06 | ||
Bold value indicates statistical significance of p ≤ 0.05.
Abbreviations: BMI, body mass index; CI, confidence interval; IR drainage, interventional radiology guided drainage; ITT, intention‐to‐treat; MUST, malnutrition universal screening tool; OR, odds ratio; PSD, pre‐stenotic dilatation; SB, small bowel; SP, stricturoplasty; UGI, upper gastrointestinal disease.
TABLE 5.
Non‐surgical complications – univariate and multivariate intention‐to‐treat analysis
| ITT analysis: Non‐surgical complications | ITT vs non‐optimised | |||||
|---|---|---|---|---|---|---|
| Independent variables | Univariate analysis | Multivariate analysis |
Multivariate analysis (Adjustment for MUST/BMI) |
|||
| OR (95% CI) | p‐value | OR (95% CI) | p‐value | OR (95% CI) | p‐value | |
| Female | 0.15 (0.83–2.74) | 0.17 | ||||
| Age at operation | 0.008 (0.005–0.01) | 0.001 | 1.04 (1.01–1.07) | 0.008 | 1.05 (1.02–1.08) | 0.003 |
| Disease duration | 0.009 (0.004–0.01) | <0.001 | 1.02 (0.99–1.06) | 0.23 | 1.02 (0.97–1.06) | 0.49 |
| Disease distribution (ileal) | 1.01 (0.54–1.91) | 0.97 | ||||
| Penetrating disease | 0.99 (0.56–1.89) | 0.99 | 1.69 (0.78–3.69) | 0.19 | 1.38 (0.57–3.36) | 0.48 |
| Perianal disease | 0.55 (0.26–1.19) | 0.13 | 0.32 (0.12–0.85) | 0.02 | 0.33 (0.11–1.01) | 0.052 |
| UGI disease | 0.36 (0.05–2.83) | 0.31 | ||||
| Index presentation | 1.36 (0.36–5.10) | 0.65 | ||||
| Prior resection | 2.61 (1.42–4.81) | 0.002 | 2.10 (0.96–4.57) | 0.06 | 1.96 (0.77–5.00) | 0.16 |
| Disease requiring acute admission within 90 days pre‐operatively | 1.18 (0.65–2.17) | 0.58 | 1.13 (0.49–2.61) | 0.78 | 1.26 (0.55–2.85) | 0.59 |
| Immunomodulator | 0.87 (0.48–1.56) | 0.63 | 0.99 (0.48–2.04) | 0.99 | 2.40 (0.99–5.81) | 0.053 |
| Biologic therapy | 0.84 (0.47–1.52) | 0.56 | 1.95 (0.92–4.13) | 0.08 | 0.64 (0.22–1.90) | 0.42 |
| ≥2 prior biological therapies | 0.56 (0.25–1.26) | 0.16 | ||||
| Corticosteroids | 0.88 (0.37–2.09) | 0.76 | 0.58 (0.21–1.63) | 0.30 | 1.12 (0.42–2.98) | 0.82 |
| Antibiotics | 1.01 (0.55–1.87) | 0.97 | 1.43 (0.60–3.41) | 0.42 | 1.12 (0.42–2.98) | 0.82 |
| Nutritional optimisation | 0.28 (0.15–0.51) | <0.001 | 0.24 (0.11–0.52) | <0.001 | 0.21 (0.08–0.51) | <0.001 |
| Laparoscopic | 0.29 (0.13–9.67) | 0.002 | 0.70 (0.26–1.85) | 0.47 | 0.73 (0.25–2.09) | 0.55 |
| Operation scheduled within four weeks of acute presentation | 1.14 (0.53–2.45) | 0.74 | ||||
| PSD ≥3 cm | 0.99 (0.55–1.82) | 0.99 | ||||
| Abscess | 1.43 (0.69–2.95) | 0.33 | ||||
| IR drainage pre‐operatively | 1.51 (0.40–5.78) | 0.54 | ||||
| Abscess drainage intra‐operatively | 3.04 (0.50–18.67) | 0.21 | ||||
| Surgeon 1 | 1.09 (0.56–2.11) | 0.81 | ||||
| Surgeon 2 | 0.69 (0.31–1.57) | 0.38 | ||||
| Surgeon 3 | 0.96 (0.53–1.76) | 0.90 | ||||
| Surgeon 4 | 1.53 (0.65–3.61) | 0.33 | ||||
| Ileocaecal resection | 1.10 (0.61–1.98) | 0.75 | ||||
| Right hemicolectomy | 0.84 (0.45–1.56) | 0.58 | ||||
| SB resection/SP | 1.32 (0.70–2.48) | 0.39 | ||||
| Additional left colic resection | 0.67 (0.15–3.07) | 0.61 | ||||
| Additional fistula excision | 1.80 (0.88–3.68) | 0.11 | ||||
| Stoma formed | 2.48 (1.37–4.48) | 0.002 | 2.47 (1.16–5.26) | 0.02 | 2.25 (0.92–5.48) | 0.08 |
| Baseline MUST score ≥2 | 2.33 (1.19–4.54) | 0.01 | 2.39 (0.92–5.43) | 0.08 | ||
| BMI ≥25 (kg/m2) | 0.53 (0.21–1.38) | 0.19 | 0.62 (0.24–1.61) | 0.33 | ||
Bold value indicates statistical significance of p ≤ 0.05
Abbreviations: BMI, body mass index; CI, confidence interval; IR drainage, interventional radiology guided drainage; ITT, intention‐to‐treat; MUST, malnutrition universal screening tool; OR, odds ratio; PSD, pre‐stenotic dilatation; SB, small bowel; SP, stricturoplasty; UGI, upper gastrointestinal disease.
TABLE 6.
Infective complications – Univariate and multivariate intention‐to‐treat analysis
| ITT analysis; Infective complications | ITT vs non‐optimised | |||||
|---|---|---|---|---|---|---|
| Independent variables | Univariate analysis | Multivariate analysis |
Multivariate analysis (Adjustment for MUST/BMI) |
|||
| OR (95% CI) | p‐value | OR (95% CI) | p‐value | OR (95% CI) | p‐value | |
| Female | 1.53 90.86–2.71) | 0.15 | ||||
| Age at operation | 0.004 (0.001–0.007) | 0.02 | 1.01 (0.99–1.04) | 0.28 | 1.02 (0.99–1.04) | 0.31 |
| Disease duration | 0.004 (–0.001 to 0.08) | 0.09 | 1.01 (0.97–1.05) | 0.58 | 1.01 (0.97–1.05) | 0.73 |
| L1 disease | 0.79 (0.42–1.480) | 0.45 | ||||
| Penetrating disease | 0.68 (0.39–1.20) | 0.18 | 0.68 (0.33–1.43) | 0.31 | 0.76 (0.33–1.76) | 0.53 |
| Perianal disease | 0.73 (0.37–1.47) | 0.38 | 0.69 (0.28–1.67) | 0.40 | 0.71 (0.25–1.99) | 0.52 |
| UGI disease | 2.64 (0.83–8.37) | 0.09 | 3.57 (0.86–14.91) | 0.08 | 7.41 (1.52–36.17) | 0.01 |
| Index presentation | 0.72 (0.16–3.33) | 0.67 | ||||
| Prior resection | 1.55 90.88–2.73) | 0.13 | 1.23 (0.58–2.62) | 0.59 | 1.25 (0.51–3.08) | 0.62 |
| Disease requiring acute admission within 90 days pre‐operatively | 0.83 (0.45–1.52) | 0.55 | 0.87 (0.38–1.97) | 0.74 | 0.81 (0.32–2.04) | 0.66 |
| Immunomodulator | 0.82 (0.46–1.44) | 0.49 | 0.83 (0.42–1.67) | 0.60 | 0.93 (0.43–2.03) | 0.86 |
| Biologic therapy | 0.64 (0.36–1.15) | 0.13 | 1.02 (0.50–2.06) | 0.96 | 1.26 (0.56–2.83) | 0.59 |
| ≥2 prior biological therapies | 0.67 (0.32–1.41) | 0.29 | ||||
| Corticosteroids | 2.30 (1.13–4.72) | 0.02 | 2.53 (1.11–5.77) | 0.03 | 2.79 (1.16–6.70) | 0.02 |
| Antibiotics | 0.86 (0.47–1.58) | 0.63 | 1.27 (0.56–2.92) | 0.57 | 1.10 (0.43–2.79) | 0.84 |
| Nutritional optimisation | 0.29 (0.16–0.52) | <0.001 | 0.32 (0.16–0.66) | 0.002 | 0.26 (0.11–0.60) | 0.002 |
| Laparoscopic | 0.53 (0.27–1.05) | 0.07 | 0.77 (0.32–1.86) | 0.56 | 0.54 (0.20–1.47) | 0.23 |
| Operation scheduled within four weeks of acute presentation | 0.85 (0.39–1.88) | 0.70 | ||||
| PSD ≥3cm | 0.60 (0.33–1.08) | 0.09 | 0.70 (0.34–1.44) | 0.33 | 0.74 (0.33–1.68) | 0.47 |
| Abscess | 1.62 (0.81–3.23) | 0.17 | ||||
| IR drainage pre‐operatively | 0.79 90.17–3.72) | 0.76 | ||||
| Abscess drainage intra‐operatively | 6.26 (1.02–38.36) | 0.02 | 8.47 (1.07–66.85) | 0.04 | 8.21 (0.94–71.72) | 0.06 |
| Surgeon 1 | 1.07 (0.56–2.04) | 0.83 | ||||
| Surgeon 2 | 0.52 (0.22–1.22) | 0.13 | ||||
| Surgeon 3 | 1.08 (0.60–1.94) | 0.79 | ||||
| Surgeon 4 | 1.66 (0.72–3.79) | 0.23 | ||||
| Ileocaecal resection | 0.90 (0.51–1.60) | 0.73 | 1.10 (0.26–4.59) | 0.90 | 1.41 (0.29–6.79) | 0.67 |
| Right hemicolectomy | 1.13 (0.63–2.03) | 0.67 | 1.15 (0.31–4.27) | 0.84 | 1.08 (0.24–4.80) | 0.92 |
| SB resection/SP | 1.13 (0.61–2.10) | 0.70 | 1.26 (0.41–3.92) | 0.69 | 1.75 (0.48–6.39) | 0.40 |
| Additional left colic resection | 2.09 (0.69–6.36) | 0.19 | 1.98 (0.54–7.19) | 0.30 | 1.38 (0.28–6.78) | 0.70 |
| Additional fistula excision | 1.19 (0.57–2.50) | 0.64 | ||||
| Baseline MUST score ≥2 | 1.53 (0.80–2.92) | 0.20 | 1.66 (0.71–3.90) | 0.24 | ||
| BMI ≥25 (kg/m2) | 1.57 (0.73–3.39) | 0.25 | 1.33 (0.57–3.08) | 0.51 | ||
Bold value indicates statistical significance of p ≤ 0.05.
Abbreviations: BMI, body mass index; CI, confidence interval; IR drainage, interventional radiology guided drainage; ITT, intention‐to‐treat; MUST, malnutrition universal screening tool; OR, odds ratio; PSD, pre‐stenotic dilatation; SB, small bowel; SP, stricturoplasty; UGI, upper gastrointestinal disease.
MVA was also performed on secondary outcome measures that were significant on UVA and demonstrated significant reductions in the rates of wound infection (OR 0.22; 95% CI 0.07–0.74, p = 0.02), prolonged ileus (OR 0.33; 95% CI 0.12–0.90, p = 0.03) and readmission (OR 0.32; 95% CI 0.11–0.92, p = 0.03) [Supporting information 6–8].
Given the high frequency of missing data in the non‐optimised cohort with regards to baseline MUST score and raised BMI (≥25 kg/m2), separate MVAs were performed to adjust for these variables. Associations with factors contributing to the primary outcome (Tables 3, 4, 5, 6), wound infection and prolonged ileus were similar. However, readmission rates were non‐significant (p = 0.20) [Supporting information 6–8]. A baseline MUST score ≥2 was associated with increased rates of overall complications and surgical complications, whilst raised BMI ≥25 kg/m2 was associated with increased rates of wound infection (p = 0.02).
3.2.2. Per‐protocol analysis
Per‐protocol univariate analysis of all factors contributing to the primary outcome measure demonstrated similar results to the ITT analysis (Table 2). With regards to secondary outcomes, EN was associated with a reduced frequency of wound infection (p = 0.005), prolonged ileus (p = 0.03) and readmission (p = 0.01). Similar to the ITT analysis, no differences were seen with regards to unplanned stoma formation (p = 0.32), length of bowel resected (p = 0.96) or length of stay (p = 0.17). There was a numerical reduction in rates of abdominal collection and anastomotic complications but these were non‐significance (both p = 0.06). Associations with the Clavien–Dindo complication grade were also similar to the ITT analysis (Supporting Information 5).
MVAs were performed for all factors contributing to the primary outcome measure demonstrating similar findings as in the ITT analysis except associations with surgical complications were non‐significant (p = 0.055)[Supporting Information 9–12]. With regards to the secondary outcomes (Supporting Information 13–15), the PP cohort experienced fewer wound infections (OR 0.25 95% CI 0.07–0.92, p = 0.04) and rates of readmission (OR 0.21; 95% CI 0.05–0.91, p = 0.04) but rates of prolonged ileus were non‐significant (p = 0.07).
Additional MVAs were again performed to adjust for baseline MUST score and raised BMI (Supporting information 9–15). Associations with factors contributing to the primary outcome were similar. Rates of prolonged ileus were reduced (p = 0.03) whilst rates of wound infection (p = 0.06) and readmission (p = 0.22) were non‐significant. Baseline MUST score was not associated with outcomes in this cohort but a BMI ≥25 kg/m2 was associated with increased rates of surgical complications and wound infection.
3.2.3. Postoperative complications in the PN cohort
There were fewer complications in the PN cohort when compared to the non‐optimised cohort (non‐significant). Rates of non‐surgical complications, infective complications and unplanned stoma formation were significantly higher in the PN cohort when compared to the per‐protocol cohort. (Supporting information 16).
3.3. Nutritional assessment
Compared to the non‐optimised cohort, there were no differences in baseline BMI or MUST score in either the ITT or PP cohorts (Table 1). No changes in BMI were demonstrated after optimisation. In both optimised cohorts a significant proportion of patients had a reduction in their pre‐operative MUST score after nutritional intervention (ITT cohort: p < 0.0001). Comparison of BMI and MUST score between the cohorts was limited by significant missing data in the non‐optimised cohort (Supporting Information 2).
Specific micronutrient deficiencies (when measured; approximately 40%–50% of cases) occurred frequently across both cohorts; 79/131 (60.8%) iron deficiency, 29/120 (24.2%) folate deficiency and 30/124 (24.2%) B12 deficiency. No differences were observed between the cohorts (Supporting Information 17).
3.4. Associations with postoperative biochemical parameters
Nutritional optimisation was associated with a significant increase in serum albumin (p < 0.001) and a reduction in serum CRP (p < 0.001) in both the ITT and PP cohorts. Optimised patients had a significantly lower serum CRP than non‐optimised patients pre‐operatively (ITT 4.0 [1.0–17.0] mg/L vs non‐optimised 7.0 [4.0–23.0] mg/L; p < 0.001.) Pre‐operative serum albumin was similar in the ITT and non‐optimised cohorts (p = 0.95). These trends persisted after excluding patients treated with antibiotics pre‐operatively. Although serum albumin was similar at baseline in the PP and non‐optimised cohorts, higher serum albumin levels were noted pre‐operatively in the PP cohort (p = 0.05) (Table 7).
TABLE 7.
Biochemical and body mass index assessments.
| Variable | ITT cohort | PP cohort | Non‐optimised cohort |
ITT cohort vs non‐optimised Pre‐operative values |
PP cohort vs non‐optimised Pre‐operative values |
||||
|---|---|---|---|---|---|---|---|---|---|
| Pre‐optimisation | Pre‐operative | p‐value | Pre‐optimisation | Pre‐operative | p‐value | Pre‐operative | p‐value | p‐value | |
|
n White cell count (×109) |
169 | 154 | 0.02 | 123 | 102 | 0.03 | 89 | 0.17 | 0.11 |
| 7.2 (5.7–9.6) | 6.7 (5.5–8.7) | 6.9 (5.7–9.7) | 6.4 (5.4–8.7) | 7.5 (5.6–9.2) | |||||
|
n Haemoglobin (g/L) |
169 | 154 | 0.04 | 123 | 97 | 0.009 | 89 | 0.79 | 0.45 |
| 126.0 (112.5–137.0) | 125.5 (114.8–138.3) | 126.0 (114.0–138.0) | 128.0 (118.3–140.0) | 129.0 (117.5–134.0) | |||||
|
n Albumin (g/L) |
166 | 149 | <0.001 | 121 | 97 | <0.001 | 87 | 0.95 | 0.05 |
| 40.5 (36.0–44.0) | 42.0 (38.5–46.0) | 40.0 (37.0–45.0) | 44.0 (40.0–46.0) | 42.0 (39.0–45.0) | |||||
|
n CRP (mg/L) |
163 | 137 | <0.001 | 118 | 85 | <0.001 | 73 | 0.001 | <0.001 |
| 12.0 (3.0–40.0) | 4.0 (1.0–17.0) | 10.0 (2.0–38.5) | 4.0 (1.0–9.0) | 7.0 (4.0–23.0) | |||||
|
n BMI (kg/m2) |
196 | 180 | 0.22 | 140 | 127 | 0.20 | 51 | 0.38 | 0.78 |
| 22.0 (19.7–24.9) | 22.2 (20.3–25.7) | 22.5 (20.1–25.1) | 22.5 (20.6–25.80) | 23.6 (20.6–27.3) | |||||
|
n Baseline MUST score 2 |
195 | 158 | <0.0001 | 139 | 117 | 0.0003 | 51 | 0.01 | 0.002 |
| 70 (35.9) | 21 (13.3) | 36 (25.9) | 10 (8.5) | 15 (29.4) | |||||
| Subgroup analysis: patients who did not receive pre‐operative antibiotics | |||||||||
|
n Albumin (g/L) |
95 | 79 | 0.003 | 73 | 56 | <0.001 | 69 | 0.60 | 0.32 |
| 42.0 (38.0–45.0) | 42.0 (40.0–46.0) | 42.0 (38.0–45.0) | 43.0 (40.0–46.0) | 42.0 (39.5–46.0) | |||||
|
n CRP (mg/L) |
93 | 71 | 0.01 | 71 | 48 | 0.054 | 73 | 0.005 | 0.01 |
| 5.0 (1.5–16.5) | 4.0 (1.0–8.0) | 5.5 (1.0–18.0) | 3.5 (1.0–7.8) | 6.0 (3.0–12.0) | |||||
Bold value indicates statistical significance of p ≤ 0.05.
Table comparing changes in serological tests and BMI between the two cohorts and also within the nutritionally optimised cohorts pre‐ and post‐optimisation. Continuous variables reported a median and IQR.
Abbreviations: BMI, body mass index; CRP, C‐reactive protein; ITT, intention‐to‐treat; MUST, malnutrition universal screening tool; PP, per‐protocol.
3.5. EN duration and location of initiation
No differences were seen in the frequency of complications when comparing cases who received EEN (29/125, 21.6%) versus PEN (4/17, 23.5%), p = 0.99. The majority of cases were initiated in the out‐patient setting (125/204, 61.3%). There was no association between place of initiation and frequency of the primary outcome (all complications; in‐patient initiation 20/79 [25.3%] vs out‐patient initiation 29/125 [23.2%], p = 0.73). In addition, we demonstrated no association between the complication rates and a specified duration of EN versus not meeting that duration target (≥2 weeks [p = 0.99], ≥4 weeks [p = 055] or ≥6 weeks [p = 0.82]; Supporting information 18).
3.6. Predictors of EN intolerance
Thirty‐nine (19.1%) cases met our criteria for EN intolerance: 31 cases required PN, three tolerated <600 kcal/day and five tolerated 2 weeks (two cases receiving <2 weeks EN were only initiated within 2 weeks of surgery due to late appointment scheduling and were therefore excluded from the tolerance data). Baseline characteristics of patients tolerating EN, versus those who did not, were compared to identify predictors of EN failure and are shown in Table 8.
TABLE 8.
Predictors of EN intolerance
| Predictors of EN intolerance | ||||||
|---|---|---|---|---|---|---|
| Independent variables | Tolerance (n = 142) | Intolerance (n = 39) | Univariate analysis | Multivariate analysis | ||
| OR (95% CI) | p‐value | OR (95% CI) | p‐value | |||
| Female | 66 (46.5) | 18 (46.2) | 0.99 (0.49–2.01) | 0.97 | ||
| Age at operation | 34.2 (27.8–42.3) | 34.5 (25.6–52.0) | 0.003 (–0.002 to 0.008) | 0.22 | ||
| Disease duration | 7.5 (2.3–17.1) | 9.5 (3.8–21.0) | 0.004 (–0.002 to 0.01) | 0.20 | ||
| Disease location (ileal) | 45 (31.7) | 7 (17.9) | 0.47 (0.19–1.15) | 0.09 | 0.52 (0.12–2.19) | 0.37 |
| Penetrating disease | 78 (54.9) | 27 (69.2) | 1.85 (0.87–3.93) | 0.11 | 1.70 (0.34–8.,53) | 0.52 |
| Perianal disease | 35 (24.6) | 12 (30.8) | 1.36 (0.62–2.96) | 0.44 | ||
| UGI disease | 8 (5.6) | 1 (2.6) | 0.44 (0.05–3.640) | 0.44 | ||
| Index presentation | 6 (4.2) | 2 (5.1) | 1.23 (0.24–6.32) | 0.81 | ||
| Abscess | 27 (19.0) | 13 (33.3) | 2.13 (0.97–4.68) | 0.06 | 0.84 (0.22–3.18) | 0.79 |
| Prior resection | 62 (43.7) | 21 (53.8) | 1.51 (0.74–3.07) | 0.26 | ||
| Disease requiring acute admission within 90 days pre‐operatively | 41 (28.9) | 36 (92.3) | 29.56 (8.62–101.38) | <0.001 | 78.03 (9.76–623.92) | <0.001 |
| Immunomodulator | 80 (56.3) | 16 (41.0) | 0.54 (0.26–1.11) | 0.09 | 1.01 (0.30–3.35) | 0.99 |
| Biologic therapy | 79 (55.6) | 20 (51.3) | 0.84 (0.41–1.71) | 0.63 | ||
| ≥2 prior biological therapies | 44 (31.0) | 11 (28.2) | 0.88 (0.40–1.91) | 0.74 | ||
| Corticosteroids | 18 (12.7) | 8 (20.5) | 1.78 (0.71–4.47) | 0.22 | ||
| Antibiotics | 53 (37.3) | 26 (66.7) | 3.36 (1.59–7.09) | 0.001 | 0.93 (0.19–4.55) | 0.93 |
| PSD (cm) | 2.8 (0.0–3.8) | 3.2 (0.0–4.4) | 0.01 (–0.02 to 0.04) | 0.43 | 0.91 (0.28–2.94) | 0.88 |
| IR drainage pre‐operatively | 3 92.1) | 2 (5.1) | 2.51 (0.40–15.54) | 0.31 | ||
| Baseline WCC (×109) | 7.0 (5.8–9.5) | 7.5 (5.3–9.6) | 0.001 (–0.02–0.02) | 0.95 | ||
| Baseline Hb (g/L) | 12.8 (117.0–138.0) | 119.0 (108.0–131.0) | –0.003 (–0.007 to 0.00) | 0.054 | 1.02 (0.98–1.06) | 0.30 |
| Baseline albumin (g/L) | 42.0 (37.0–45.0) | 36.0 (30.0–43.0) | –0.02 (–0.03 to –0.01) | <0.001 | 0.91 (0.83–1.01) | 0.07 |
| Baseline CRP (mg/L) | 9.0 (2.0–35.0) | 20.0 (9.0–48.0) | 0.002 (0.001 to 0.004) | 0.01 | 1.00 (0.99–1.02) | 0.64 |
| Baseline MUST score ≥2 | 0 (0–2) | 2.5 (1.0–4.0) | 0.12 (0.09–0.16) | <0.001 | 5.10 (1.44–18.11) | 0.01 |
| In‐patient initiation of EN | 49 (34.5) | 24 (61.5) | 3.04 (1.46–6.31) | 0.002 | 0.12 (0.02–0.68) | 0.02 |
Bold value indicates statistical significance of p ≤ 0.05.
Abbreviations: CI, confidence interval; CI, confidence interval; CRP, C‐reactive protein; EN, enteral nutrition; MUST, malnutrition universal screening tool; OR, odds ratio; OR, odds ratio; PN, parenteral nutrition; PSD, pre‐stenotic dilatation; WCC, white cell count.
On MVA, the need for an acute admission pre‐operatively (p < 0.001) and a baseline MUST score ≥2 (p = 0.01) were associated with EN failure; whilst initiation of EN as an in‐patient (0.02) was associated with EN tolerance.
4. DISCUSSION
We have demonstrated that pre‐operative optimisation in patients with CD requiring surgery is associated with a reduction in 30‐day postoperative complications and that oral EN can be achieved in a reasonable proportion of patients (69.6% EN, 61.3% EEN). Three systematic reviews have been published, all of which suggest the beneficial effect of nutritional optimisation pre‐operatively. Grass et al deemed studies too heterogeneous to perform a meta‐analysis 30 and Rocha et al performed a systematic review including four studies but only 72/1024 patients received EEN orally. Lastly, Brennan et al 31 included five studies, none received oral EEN and two of the included studies were published prior to 1990. The GETAID group have recently published data on the effects of pre‐operative EN, but despite including only patients with severe malnutrition (BMI < 18 kg/m2 or weight loss >10% body weight) the minimum requirement for nutrition was only 7 days. 15
Despite 40.7% of cases requiring hospitalisation for their symptoms pre‐operatively, only 15.2% required escalation to PN. Four patients trialling NG/NJ feeding all subsequently commenced PN, suggesting that in centres where specialist dietetic service provision is available, this strategy may have a low chance of success after failure of oral EN unless feeding distal to the surgical disease is feasible or where the main issue is palatability. Poor EEN adherence in the adult population is frequently reported. 32 However, unlike Li et al, 24 we have shown that NG/NJ tube insertion was not required in our cohort and that the majority of patients can be managed in the out‐patient setting. In addition, optimised patients were less likely to experience postoperative complications within 30‐days of surgery irrespective of whether they required a period of PN. These were predominantly Clavien–Dindo grade 1–2 complications. Associations of EN with length of stay and unplanned stoma formation were not demonstrated. We have also described changes in biochemical status after nutritional optimisation.
Based on our analysis of EN tolerance, patients requiring admission for their disease pre‐operatively, or those with a baseline MUST scores ≥2, should be carefully assessed and monitored for tolerance. Admission should be considered if EN has been initiated in the out‐patient setting and there is clinical concern with regards to tolerance and/or the need for PN. The value of 600 kcal/day is, of course, arbitrary for defining tolerance. However, this cut off has been identified by ESPEN as the threshold at which normal food intake is compromised. 33 In addition, evaluation of data for EN tolerance including all PEN cases as ‘failures’ yielded similar results (data not presented). Unfortunately, partial obstructive symptoms were difficult to define retrospectively; we, therefore, assessed for an association between PSD and EN failure which was found not to be significant. Amongst the biochemical parameters, a low serum albumin was most strongly correlated with EN intolerance but was non‐significant on MVA (0.07). Whilst one third of cases in the highest‐risk group (albumin<30 g/L) tolerated EN, 72.7% did not. In the context of malnutrition, continuous clinical reassessment is required to evaluate the need for PN. Interpreting the outcomes in the PN cohort is challenging due to their small number and the fact that they represent a cohort with more severe features at baseline. These data highlight the need for further studies examining the outcomes of patients with IBD who receive perioperative PN.
Data regarding the effects of EN on stoma formation and length of stay are conflicting. 16 , 19 , 34 Whilst we did not identify a reduction in the need for unplanned stoma formation and length of stay, we have demonstrated that EN is associated with steroid weaning and normalisation of biochemical parameters and enables deferment of surgery. These variables are inextricably linked to stoma formation and length of stay. Additionally, although overall rates of laparoscopy were lower in the ITT cohort which may confound our data, the avoidance of urgent surgery was associated with an increased frequency of a laparoscopic approach, thus likely improving outcomes indirectly. We believe that the benefit of EN, or lack thereof, with regards to these factors, should be investigated in a prospective trial. However, randomised‐controlled trial (RCT) design and feasibility are not without difficulty. For example, blinding is not possible and randomisation might only be considered ethical in patients with a normal nutritional assessment in whom complications are likely to be fewer.
In keeping with other studies, variables that were consistently associated with complications included age at operation, pre‐operative corticosteroid use, disease duration and the presence of an abscess requiring drainage (rather than penetrating disease per se). 3 , 34 , 35 We also found no clear association between postoperative complications and pre‐operative biological therapy. 19 , 36 Pre‐operative immunomodulator use was associated with increased rates of wound infection. Data are conflicting and a Cochrane review is currently underway. 37 , 38 Surprisingly, perianal disease was correlated with a reduced risk of complications which may reflect the benefits of more frequent biologic use in this cohort (63% [46/73] of cases with perianal disease were prescribed biological therapy versus 49.6% [90/227] of cases without perianal disease p = 0.003). The frequency of anastomotic leak (0.7%) and abdominal collection (8.3%) were very low in our cohort when compared with other studies (4–6% and 5–27%) which may partly explain why our effect sizes were not as large as those reported by Heerasing et al (also conducted in a tertiary IBD centre). 19 , 34 This may be related to how we defined anastomotic leak. The frequency of re‐operation was nearer 3%. There were more women in the non‐optimised cohort, the reasons for which are unclear. No consistent sex associations were noted.
The optimum duration of pre‐operative EEN is unclear. Available data demonstrate that objective improvement in disease activity occurs as early as 2 weeks, whereas 4–6 weeks may be optimal. 10 , 39 Although our PP cohort comprised patients who had received ≥2 weeks EN, the majority of patients (115/142, 81.0%) received ≥6 weeks. Other studies have prescribed EEN for between 1 and 12 weeks with non‐significant results demonstrated in two of three studies where the minimum duration of EN was <2 weeks. 15 , 16 , 19 , 23 , 24 Our study was not powered to detect differences in treatment duration, nor to compare outcomes between PEN and EEN cohorts.
Our data have several limitations. The data are subject to biases inherent to single centre, retrospective observational studies although data were collected uniformly from the same electronic patient records across both cohorts to reduce information bias. Major limitations include the imperfect matching between the cohorts and the frequency of missing data regarding baseline risk of malnutrition, particularly in the non‐optimised cohort, which reflects changing practices over time. We have performed MVA with subgroup analyses which demonstrate similar trends. However, some variables have not been adjusted for and need to be considered when interpreting our results: smoking status, which is known to be associated with postoperative morbidity, 40 was not included in the analysis due to inconsistent reporting; we also did not collect data regarding comorbidities or operating time which have been associated with worse outcomes. 4 , 41 Nevertheless, the median age in the ITT and non‐optimised cohorts was <45 years where the likelihood of multimorbidity is low. 42 The provision of pre‐operative EN as standard of care within our service was developed over time and therefore, at its inception, higher‐risk patients may have been selected for nutritional optimisation over lower‐risk patients introducing bias. Additionally, EN tolerance data is subject to recall bias. The ITT cohort aims (albeit imperfectly) to address confounding by severity with inclusion of patients who initiated EN but failed to reach nutritional targets.
Despite these limitations, to our knowledge, this is the largest reported cohort of patients with CD receiving oral pre‐operative EN. In addition, we performed PP and ITT analyses with multivariable regression to adjust for confounding. We have shown reasonable tolerability in a large (and mostly out‐patient) cohort and demonstrate an association with a reduction in postoperative complications. RCTs are needed to assess the true effect sizes, optimum duration of treatment and to clarify whether effects are universal or whether certain subgroups should be targeted for treatment.
AUTHOR CONTRIBUTIONS
Susanna Meade: Conceptualization (equal); data curation (equal); formal analysis (equal); investigation (equal); methodology (equal); project administration (equal); resources (equal); software (equal); validation (equal); visualization (equal); writing – original draft (equal); writing – review and editing (equal). Kamal Patel: Conceptualization (equal); data curation (equal); formal analysis (equal); investigation (equal); methodology (equal); project administration (equal); writing – review and editing (equal). Raphael Luber: Data curation (equal); formal analysis (equal); resources (equal); software (equal); supervision (equal); writing – original draft (equal); writing – review and editing (equal). Dearbhaile Hanlon: Conceptualization (equal); data curation (equal); methodology (equal); writing – review and editing (equal). Andra Caracostea: Data curation (equal); writing – review and editing (equal). Polychronis Pavlidis: Formal analysis (equal); methodology (equal); writing – review and editing (equal). Sailish Honap: Conceptualization (equal); writing – review and editing (equal). Cheran Anandarajah: Data curation (equal); writing – review and editing (equal). Nyree Griffin: Data curation (equal); writing – review and editing (equal). Sebastian Zeki: Data curation (equal); methodology (equal); resources (equal); software (equal); writing – review and editing (equal). Shuvra Ray: Conceptualization (equal); formal analysis (equal); investigation (equal); methodology (equal); supervision (equal); writing – review and editing (equal). Joel Mawdsley: Validation (equal); writing – review and editing (equal). Mark A Samaan: Validation (equal); writing – review and editing (equal). Simon Anderson: Validation (equal); writing – review and editing (equal). Katie Adams: Validation (equal); writing – review and editing (equal). Amir Darakhshan: Validation (equal); writing – review and editing (equal). Andrew Williams: Supervision (equal); validation (equal); writing – review and editing (equal). Jeremy D. Sanderson: Conceptualization (equal); investigation (equal); methodology (equal); supervision (equal); writing – review and editing (equal). Miranda Lomer: Conceptualization (equal); supervision (equal); validation (equal); writing – review and editing (equal). Peter Irving: Conceptualization (equal); formal analysis (equal); investigation (equal); methodology (equal); project administration (equal); supervision (equal); validation (equal); writing – review and editing (equal).
AUTHORSHIP
Guarantor of the article: Dr Susanna Meade.
CONFLICT OF INTEREST
SM has received speaker fees from FalkPharma and an educational grant from Pfizer. KP has received honoraria for educational meetings and speaker fees from Abbvie, Janssen, Takeda, DrFalk, PredictImmune and Ferring. KP has received Advisory Board fees from Abbvie, Galapagos and Janssen. RPL has received educational grants from Ferring, Pfizer and Vifor Pharma. PMI: AbbVie, Celgene, Falk Pharma, Ferring MSD, Janssen, Pfizer, Takeda, Tillotts, Sandoz, Shire, Warner Chilcott ‐ Speaking/education, intermittent (last 3 years). SH has received lecture fees from Pfizer, Janssen and Takeda. DOH, AC, PP, CA, NG, SZ, SR, JM, MAS, SHA, KA, AD, AW, JDS, ML none declared.
Supporting information
Data S1
ACKNOWLEDGEMENTS
Declaration of personal interests: None declared. Open access funding enabled and organized by ProjektDEAL.
Meade S, Patel KV, Luber RP, et al. A retrospective cohort study: Pre‐operative oral enteral nutritional optimisation for Crohn's disease in a UK tertiary IBD Centre. Aliment Pharmacol Ther. 2022;56:646–663. 10.1111/apt.17055
[Correction added on June 24, 2022, after first online publication: Nyree Griffin name has been updated]
The Handling Editor for this article was Dr Cynthia Seow, and it was accepted for publication after full peer‐review.
Funding informationNo funding was required for this project
REFERENCES
- 1. De Cruz P, Kamm MA, Hamilton AL, Ritchie KJ, Krejany EO, Gorelik A, et al. Crohn's disease management after intestinal resection: a randomised trial. Lancet (London, England). 2015;385:1406–17. [DOI] [PubMed] [Google Scholar]
- 2. Kirchhoff P, Clavien P‐A, Hahnloser D. Complications in colorectal surgery: risk factors and preventive strategies. Patient Saf Surg. 2010;4:5. [DOI] [PMC free article] [PubMed] [Google Scholar]
- 3. Zhang T, Yang J, Ding C, Li Y, Gu L, Wei Y, et al. Preoperative intra‐abdominal sepsis, not penetrating behavior itself, is associated with worse postoperative outcome after bowel resection for Crohn disease: a retrospective cohort study. Medicine. 2015;94:e1987. [DOI] [PMC free article] [PubMed] [Google Scholar]
- 4. Singh S, Al‐Darmaki A, Frolkis AD, Seow CH, Leung Y, Novak KL, et al. Postoperative mortality among patients with inflammatory bowel diseases: a systematic review and meta‐analysis of population‐based studies. Gastroenterology. 2015;149:928–37. [DOI] [PubMed] [Google Scholar]
- 5. Gillis C, Carli F. Promoting perioperative metabolic and nutritional care. Anesthesiology. 2015;123:1455–72. [DOI] [PubMed] [Google Scholar]
- 6. Donnellan CF, Yann LH, Lal S. Nutritional management of Crohn's disease. Therap Adv Gastroenterol. 2013;6:231–42. [DOI] [PMC free article] [PubMed] [Google Scholar]
- 7. Patel KV, Darakhshan AA, Griffin N, Williams AB, Sanderson JD, Irving PM. Patient optimization for surgery relating to Crohn's disease. Nat Rev Gastroenterol Hepatol. 2016;13:707–19. [DOI] [PubMed] [Google Scholar]
- 8. Day AS, Whitten KE, Lemberg DA, Clarkson C, Vitug‐Sales M, Jackson R, et al. Exclusive enteral feeding as primary therapy for Crohn's disease in Australian children and adolescents: a feasible and effective approach. J Gastroenterol Hepatol. 2006;21:1609–14. [DOI] [PubMed] [Google Scholar]
- 9. Yu Y, Chen KC, Chen J. Exclusive enteral nutrition versus corticosteroids for treatment of pediatric Crohn's disease: a meta‐analysis. World J Pediatr. 2019;15:26–36. [DOI] [PMC free article] [PubMed] [Google Scholar]
- 10. Adamina M, Gerasimidis K, Sigall‐Boneh R, Zmora O, de Buck van Overstraeten A, Campmans‐Kuijpers M, et al. Perioperative dietary therapy in inflammatory bowel disease. J Crohns Colitis. 2020;14:431–44. [DOI] [PubMed] [Google Scholar]
- 11. MacLellan A, Moore‐Connors J, Grant S, Cahill L, Langille MGI, Van Limbergen J. The impact of exclusive enteral nutrition (EEN) on the gut microbiome in Crohn's disease: a review. Nutrients. 2017;9:447. [DOI] [PMC free article] [PubMed] [Google Scholar]
- 12. Fell JM, Paintin M, Arnaud‐Battandier F, Beattie RM, Hollis A, Kitching P, et al. Mucosal healing and a fall in mucosal pro‐inflammatory cytokine mRNA induced by a specific oral polymeric diet in paediatric Crohn's disease. Aliment Pharmacol Ther. 2000;14:281–9. [DOI] [PubMed] [Google Scholar]
- 13. Berntson L, Hedlund‐Treutiger I, Alving K. Anti‐inflammatory effect of exclusive enteral nutrition in patients with juvenile idiopathic arthritis. Clin Exp Rheumatol. 2016;34:941–5. [PubMed] [Google Scholar]
- 14. Zhu F, Li Y, Guo Z, Cao L, Feng D, Zhang T, et al. Nomogram to predict postoperative intra‐abdominal septic complications after bowel resection and primary anastomosis for Crohn's disease. Dis Colon Rectum. 2020;63:629–38. [DOI] [PubMed] [Google Scholar]
- 15. Abdalla S, Benoist S, Maggiori L, Zerbib P, Lefevre JH, Denost Q, et al. Impact of preoperative enteral nutritional support on postoperative outcome in patients with Crohn's disease complicated by malnutrition. Results of a subgroup analysis of the nationwide cohort registry from the GETAID Chirurgie group. Colorectal Dis. 2021;23:1451–62. [DOI] [PubMed] [Google Scholar]
- 16. El‐Hussuna A, Iesalnieks I, Horesh N, Hadi S, Dreznik Y, Zmora O. The effect of pre‐operative optimization on post‐operative outcome in Crohn's disease resections. Int J Colorectal Dis. 2017;32:49–56. [DOI] [PubMed] [Google Scholar]
- 17. Ge X, Tang S, Yang X, Liu W, Ye L, Yu W, et al. The role of exclusive enteral nutrition in the preoperative optimization of laparoscopic surgery for patients with Crohn's disease: a cohort study. Int J Surg (London, England). 2019;65:39–44. [DOI] [PubMed] [Google Scholar]
- 18. Guo Z, Guo D, Gong J, Zhu W, Zuo L, Sun J, et al. Preoperative nutritional therapy reduces the risk of anastomotic leakage in patients with Crohn's disease requiring resections. Gastroenterol Res Pract. 2016;2016:5017856. [DOI] [PMC free article] [PubMed] [Google Scholar]
- 19. Heerasing N, Thompson B, Hendy P, Heap GA, Walker G, Bethune R, et al. Exclusive enteral nutrition provides an effective bridge to safer interval elective surgery for adults with Crohn's disease. Aliment Pharmacol Ther. 2017;45:660–9. [DOI] [PubMed] [Google Scholar]
- 20. Li G, Ren J, Wang G, Hu D, Gu G, Liu S, et al. Preoperative exclusive enteral nutrition reduces the postoperative septic complications of fistulizing Crohn's disease. Eur J Clin Nutr. 2014;68:441–6. [DOI] [PubMed] [Google Scholar]
- 21. Zheng XB, Peng X, Xie XY, Lian L, Wu XR, Hu JC, et al. Enteral nutrition is associated with a decreased risk of surgical intervention in Crohn's disease patients with spontaneous intra‐abdominal abscess. Revista espanola de enfermedades digestivas: organo oficial de la Sociedad Espanola de Patologia Digestiva. 2017;109:834–42. [DOI] [PubMed] [Google Scholar]
- 22. Zhu Y, Xu L, Liu W, Qi W, Cao Q, Zhou W. Safety and efficacy of exclusive enteral nutrition for percutaneously undrainable abdominal abscesses in Crohn's disease. Gastroenterol Res Pract. 2017;2017:6360319. [DOI] [PMC free article] [PubMed] [Google Scholar]
- 23. Guo K, Ren J, Li G, Hu Q, Wu X, Wang Z, et al. Risk factors of surgical site infections in patients with Crohn's disease complicated with gastrointestinal fistula. Int J Colorectal Dis. 2017;32:635–43. [DOI] [PubMed] [Google Scholar]
- 24. Li Y, Zuo L, Zhu W, Gong J, Zhang W, Gu L, et al. Role of exclusive enteral nutrition in the preoperative optimization of patients with Crohn's disease following immunosuppressive therapy. Medicine. 2015;94:e478‐e. [DOI] [PMC free article] [PubMed] [Google Scholar]
- 25. PENG Parenteral and Enteral Nutrition Specialist Group . A pocket guide to clinical nutrition. 5th ed. Birmingham: The Association of UK Dietitians, PENG; 2018. [Google Scholar]
- 26. Dindo D, Demartines N, Clavien P‐A. Classification of surgical complications: a new proposal with evaluation in a cohort of 6336 patients and results of a survey. Ann Surg. 2004;240:205–13. [DOI] [PMC free article] [PubMed] [Google Scholar]
- 27. Health Research Authority . Defining research, 2017. Accessed 3/9/19, http://www.hra‐decisiontools.org.uk/research/docs/DefiningResearchTable_Oct2017‐1.pdf.
- 28. Bouhnik Y, Carbonnel F, Laharie D, Stefanescu C, Hébuterne X, Abitbol V, et al. Efficacy of adalimumab in patients with Crohn's disease and symptomatic small bowel stricture: a multicentre, prospective, observational cohort (CREOLE) study. Gut. 2018;67:53. [DOI] [PMC free article] [PubMed] [Google Scholar]
- 29. M E. Screening for malnutrition: a multidisciplinary responsibility. Development and use of the malnutrition universal screening tool (‘MUST’) for adults. Redditch: BAPEN; 2003. [Google Scholar]
- 30. Grass F, Pache B, Martin D, Hahnloser D, Demartines N, Hübner M. Preoperative nutritional conditioning of Crohn's patients‐systematic review of current evidence and practice. Nutrients. 2017;9:562. [DOI] [PMC free article] [PubMed] [Google Scholar]
- 31. Brennan GT, Ha I, Hogan C, Nguyen E, Jamal MM, Bechtold ML, et al. Does preoperative enteral or parenteral nutrition reduce postoperative complications in Crohn's disease patients: a meta‐analysis. Eur J Gastroenterol Hepatol. 2018;30:997–1002. [DOI] [PubMed] [Google Scholar]
- 32. Wall CL, Day AS, Gearry RB. Use of exclusive enteral nutrition in adults with Crohn's disease: a review. World J Gastroenterol. 2013;19:7652–60. [DOI] [PMC free article] [PubMed] [Google Scholar]
- 33. Bischoff SC, Escher J, Hébuterne X, Kłęk S, Krznaric Z, Schneider S, et al. ESPEN practical guideline: clinical nutrition in inflammatory bowel disease. Clin Nutr. 2020;39:632–53. [DOI] [PubMed] [Google Scholar]
- 34. Rocha A, Bessa I, Lago P, Santos MD, Leite J, Castro‐Poças F. Preoperative enteral nutrition and surgical outcomes in adults with Crohn's disease: a systematic review. GE Port J Gastroenterol. 2019;26:184–95. [DOI] [PMC free article] [PubMed] [Google Scholar]
- 35. Toh JWT, Wang N, Young CJ, Rickard MJFX, Keshava A, Stewart P, et al. Major abdominal and perianal surgery in Crohn's disease: long‐term follow‐up of Australian patients with Crohn's disease. Dis Colon Rectum. 2018;61:67–76. [DOI] [PubMed] [Google Scholar]
- 36. Alsaleh A, Gaidos JK, Kang L, Kuemmerle JF. Timing of last preoperative dose of infliximab does not increase postoperative complications in inflammatory bowel disease patients. Dig Dis Sci. 2016;61:2602–7. [DOI] [PMC free article] [PubMed] [Google Scholar]
- 37. Law CCY, Koh D, Bao Y, Jairath V, Narula N. Risk of postoperative infectious complications from medical therapies in inflammatory bowel disease. Cochrane Database Syst Rev. 2020;10(10):1–69. [DOI] [PMC free article] [PubMed] [Google Scholar]
- 38. Kienle P. Impact of modern drug therapy on surgery: Crohn's disease. Visceral Medicine. 2018;34:422–5. [DOI] [PMC free article] [PubMed] [Google Scholar]
- 39. Wall CL, Gearry RB, Day AS. Treatment of active Crohn's disease with exclusive and partial enteral nutrition: a pilot study in adults. Inflamm Intest Dis. 2017;2:219–27. [DOI] [PMC free article] [PubMed] [Google Scholar]
- 40. Kulaylat AN, Hollenbeak CS, Sangster W, Stewart DB Sr. Impact of smoking on the surgical outcome of Crohn's disease: a propensity‐score matched National Surgical Quality Improvement Program analysis. Colorectal Dis. 2015;17:891–902. [DOI] [PubMed] [Google Scholar]
- 41. Cheng H, Clymer JW, Po‐Han Chen B, Sadeghirad B, Ferko NC, Cameron CG, et al. Prolonged operative duration is associated with complications: a systematic review and meta‐analysis. J Surg Res. 2018;229:134–44. [DOI] [PubMed] [Google Scholar]
- 42. Divo MJ, Martinez CH, Mannino DM. Ageing and the epidemiology of multimorbidity. Eur Respir J. 2014;44:1055–68. [DOI] [PMC free article] [PubMed] [Google Scholar]
Associated Data
This section collects any data citations, data availability statements, or supplementary materials included in this article.
Supplementary Materials
Data S1