

Abstract
Objective
To evaluate the potential benefit of the use of a bone substitute material in the reconstructive surgical therapy of peri‐implantitis.
Methods
In this multicenter randomized clinical trial, 138 patients (147 implants) with peri‐implantitis were treated surgically, randomized by coin toss to either a control (access flap surgery) or a test group (reconstructive surgery using bone substitute material). Clinical assessments, including probing pocket depth (PPD), bleeding and suppuration on probing (BOP & SOP) as well as soft tissue recession (REC), were recorded at baseline, 6 and 12 months. Marginal bone levels (MBL), measured on intra‐oral radiographs, and patient‐reported outcomes (PROs) were recorded at baseline and 12 months. No blinding to group allocation was performed. The primary outcome at 12 months was a composite measure including (i) implant not lost, (ii) absence of BOP/SOP at all aspects, (iii) PPD ≤5 mm at all aspects and (iv) ≤1 mm recession of mucosal margin on the buccal aspect of the implant. Secondary outcomes included (i) changes of MBL, (ii) changes of PPD, BOP%, and buccal KM, (iii) buccal REC and (iv) patient‐reported outcomes.
Results
During follow‐up, four implants (one in the test group, three in the control group) in four patients were removed due to disease progression. At 12 months, a total of 69 implants in the test and 68 implants in the control group were examined. Thus, 16.4% and 13.5% of implants in the test and control group, respectively, met all predefined criteria of the composite outcome. PPD reduction and MBL gain were 3.7 mm and about 1.0 mm in both groups. Reduction in mean BOP% varied between 45% (test) and 50% (control), without significant differences between groups. Buccal REC was less pronounced in the test group (M = 0.7, SD = 0.9 mm) when compared to controls (M = 1.1, SD = 1.5 mm). PROs were favorable in both groups without significant differences. One case of allergic reaction to the antibiotic therapy was recorded. No other adverse events were noted.
Conclusions
Surgical therapy of peri‐implantitis effectively improved the clinical and radiographic status at 12 months. While the use of a bone substitute material did not improve reductions of PPD and BOP, buccal REC was less pronounced in the test group. Patient satisfaction was high in both groups.
Keywords: bone graft, dental implant, peri‐implantitis, reconstructive therapy, surgical therapy
1. INTRODUCTION
Peri‐implantitis is characterized by bleeding/suppuration on probing together with loss of supporting bone and affects about 15% of implant‐carrying patients (Derks et al., 2016). The primary goal of the treatment of peri‐implantitis is to resolve the inflammatory lesion in peri‐implant tissues, which was shown to be possible in preclinical in vivo experiments (Albouy et al., 2011; Carcuac et al., 2015). Successful management of peri‐implantitis, as indicated by the reduction in bleeding on probing and/or absence of further bone loss, has also been demonstrated both in observational studies (e.g., Berglundh et al., 2018; Roccuzzo et al., 2017; Schwarz et al., 2017) and in randomized controlled trials (e.g., Carcuac et al., 2016; Carcuac et al., 2017; Hentenaar et al., 2022).
In addition to the resolution of the peri‐implantitis lesion, a desirable outcome is the regeneration of supporting tissues lost during disease progression. The use of reconstructive procedures in the surgical treatment of periodontitis has been extensively evaluated (Nibali et al., 2020), and the technique is an established option for the management of angular defects around teeth (Sanz et al., 2020). A similar approach in the treatment of peri‐implantitis‐associated defects may be relevant not only for the longevity of the implant but also for the esthetic appearance post‐therapy.
In a systematic review on reconstructive measures as part of surgical treatment of peri‐implantitis, it was reported that evidence from controlled trials is limited (Tomasi et al., 2019). While no clinical benefits of reconstructive measures over access flap alone were observed, the use of bone substitute materials resulted in improved radiographic bone levels and defect fill (K. Jepsen et al., 2016; Wohlfahrt et al., 2012). Interpretation of such findings, however, is complex due to the difficulty in distinguishing graft material from newly formed bone on radiographs. In a consensus report from the 15th European Workshop on Periodontology on bone regeneration, the importance of including outcomes related to soft tissue dimensions and esthetics in studies on reconstructive techniques used at peri‐implantitis‐associated bony defects was highlighted (S. Jepsen et al., 2019). While some studies (Isehed et al., 2016; Jepsen et al., 2016; Wohlfahrt et al., 2012) did not consider esthetic parameters in their clinical evaluations, two publications (Renvert et al., 2018; Renvert et al., 2021) found no differences in soft tissue recession between test and control groups. Furthermore, the degree of patient satisfaction was not dependent on treatment modality (Renvert et al., 2021).
Thus, the limited evidence, specifically in terms of soft tissue recession and patient‐reported outcomes, calls for further investigation. The aim of the present randomized controlled trial was to evaluate the potential benefit of the use of a bone substitute material in the reconstructive surgical therapy of peri‐implantitis. Hence, the null hypothesis was the absence of any difference between access flap alone and access flap combined with a bone substitute material.
2. MATERIALS AND METHODS
The study was designed as a multicenter, parallel group, randomized, controlled trial conducted at 6 centers located in Sweden, Italy, Spain, and Germany. The protocol was approved by the responsible authorities in the respective countries (Gothenburg: 1192–16; Bilbao: 06/2017; Málaga: 27/09/2017; Perugia: 3173/18; Trento: 21390; Munich: 17028) and registered at clinicaltrials.gov (NCT03077061). Interim analyses for efficacy/futility were carried out. No changes to the study protocol were performed after trial commencement. CONSORT guidelines were followed (Schulz et al., 2010).
2.1. Study population
Eligible participants were subjects aged 18 years or over, presenting with peri‐implantitis at ≥1 implant (≥1 year of function). Target sites presented with peri‐implant probing pocket depth (PPD) of ≥7 mm, bleeding and/or suppuration on probing (BOP/SOP) and radiographically confirmed bone loss of ≥3 mm. For cases lacking reference radiographs, bone levels ≥3 mm were considered. Peri‐implant osseous defects were circumferential and ≥3 mm deep, as confirmed during surgery. No minimum number of bony walls was required. Exclusion criteria were (i) surgical therapy of peri‐implantitis and/or use of systemic/local antibiotics during the previous 6 months, (ii) untreated periodontitis, (iii) systemic conditions/medication affecting peri‐implant tissues and/or impeding surgical intervention (e.g., uncontrolled diabetes, immunosuppressive medication).
In all, 165 subjects were invited and a total of 138, presenting with 147 target implants, were eventually included in the study (Figure 1). Patient and implant/site characteristics are illustrated in Table 1.
FIGURE 1.

Flow‐chart illustrating the process of enrollment, treatment allocation and follow‐up
TABLE 1.
Patient and implant/site characteristics at baseline by group
| Test | Control | Total | ||||||||
|---|---|---|---|---|---|---|---|---|---|---|
| n | %/mean (SD) | Min to max | n | %/mean (SD) | Min to max | n | %/mean (SD) | Min to max | ||
| Gender | Female | 41 | 59.4% | 47 | 68.1% | 88 | 63.8% | |||
| Male | 28 | 40.6% | 22 | 31.9% | 50 | 36.2% | ||||
| Current smoker (self‐reported) | No | 53 | 76.8% | 48 | 69.6% | 101 | 73.2% | |||
| Yes | 16 | 23.2% | 21 | 30.4% | 37 | 26.8% | ||||
| History of periodontitis | No | 23 | 33.3% | 24 | 34.8% | 47 | 34.1% | |||
| Yes | 46 | 66.7% | 45 | 65.2% | 91 | 65.9% | ||||
| Diabetes | No | 67 | 97.1% | 66 | 95.7% | 133 | 96.4% | |||
| Yes | 2 | 2.9% | 3 | 4.3% | 5 | 3.6% | ||||
| Age at surgery (years) | 69 | 62.4 (11.3) | 34 to 88 | 69 | 59.3 (11.5) | 24 to 79 | 138 | 60.8 (11.5) | 24 to 88 | |
| Implant years | 68 | 10.1 (5.1) | 2 to 22 | 68 | 10.5 (5.8) | 1 to 30 | 136 | 10.3 (5.5) | 1 to 30 | |
| Number of implants included per patient | 69 | 1.1 (0.2) | 1 to 2 | 69 | 1.1 (0.3) | 1 to 2 | 138 | 1.1 (0.2) | 1 to 2 a | |
| Jaw | Maxilla | 36 | 33 | 44.6% | 69 | 46.9% | ||||
| Mandible | 37 | 41 | 55.4% | 78 | 53.1% | |||||
| Location | Anterior (canine to canine) | 15 | 14 | 18.9% | 29 | 19.7% | ||||
| Posterior | 58 | 49.3% | 60 | 81.1% | 118 | 80.3% | ||||
| Implant brand | Nobel Biocare | 10 | 50.7% | 16 | 21.6% | 26 | 17.7% | |||
| Astra Tech | 35 | 20.5% | 28 | 37.8% | 63 | 42.9% | ||||
| Straumann | 14 | 79.5% | 17 | 23.0% | 31 | 21.1% | ||||
| Other | 9 | 13.7% | 9 | 12.2% | 18 | 12.2% | ||||
| Unclear | 5 | 47.9% | 4 | 5.4% | 9 | 6.1% | ||||
| Surface characteristics | Modified | 72 | 19.2% | 71 | 95.9% | 143 | 97.3% | |||
| Nonmodified | 1 | 12.3% | 3 | 4.1% | 4 | 2.7% | ||||
| Retention | Cemented | 31 | 6.8% | 32 | 43.2% | 63 | 42.9% | |||
| Conometric | 1 | 98.6% | 4 | 5.4% | 5 | 3.4% | ||||
| Screw‐retained | 41 | 1.4% | 38 | 51.4% | 79 | 53.7% | ||||
| PPD (mm) | 73 | 42.5% | 7.0 to 13.0 | 74 | 8.5 (1.6) | 7.0 to 13.0 | 147 | 8.6 (1.6) | 7.0 to 13.0 | |
| BOP (%) | 73 | 1.4% | 25.0 to 100.0 | 74 | 91.9 (19.5) | 25.0 to 100.0 | 147 | 90.0 (20.8) | 25.0 to 100.0 | |
| SOP (%) | 73 | 56.2% | 0.0 to 100.0 | 74 | 31.1 (38.3) | 0.0 to 100.0 | 147 | 34.9 (40.4) | 0.0 to 100.0 | |
| Plaque (%) | 73 | 20.2 (37.0) | 0.0 to 100.0 | 74 | 17.2 (29.5) | 0.0 to 00.0 | 147 | 18.7 (33.3) | 0.0 to 100.0 | |
| Buccal soft tissue level (mm) | 73 | 0.4 (1.4) | −3.0 to 5.0 | 74 | 0.5 (1.3) | −2.0 to 6.0 | 147 | 0.5 (1.3) | −3.0 to 6.0 | |
| Buccal KM (mm) | 73 | 2.3 (1.8) | 0.0 to 6.0 | 74 | 2.3 (1.9) | 0.0 to 7.0 | 147 | 2.3 (1.8) | 0.0 to 6.0 | |
| MBL (mm) | 73 | 5.9 (1.9) | 2.3 to 10.2 | 74 | 6.2 (2.0) | 2.7 to 12.9 | 147 | 6.1 (2.0) | 2.3 to 12.9 | |
Note: N = 138 patients; n = 147 implants/sites.
Abbreviations: BOP, bleeding on probing; KM, keratinized mucosa; MBL, marginal bone level; PPD, probing pocket depth (deepest site); SD, standard deviation; SOP, suppuration on probing.
Nine patients contributed with two implants.
2.2. Setting
The study took place at 6 clinical centers. All study‐related procedures were performed by experienced clinicians with specialty degrees in periodontics (JD, AOV, AG, MD, DS, CT, KK, IA & TB), oral surgery (PG), or orthodontics (EB). All clinicians met for discussion of the study protocol and calibration purposes at the primary study center (Gothenburg) prior to study initiation.
Patients meeting the inclusion criteria were invited on a consecutive basis. Upon signed consent, participants were enrolled and assigned a unique identification number. At the time of surgical intervention, subjects were randomly allocated to either the test or control group. In case of multiple implants per patient, all implants were allocated to the same group. Randomization sequence was determined by coin toss and was stratified by smoking with a 1:1 allocation using a block size of 4. Smokers were those subjects reporting daily tobacco smoking. Randomization lists were prepared at the primary study center and distributed together with clinical record forms. Allocation was concealed through the use of sealed, opaque envelopes. During follow‐up, neither clinicians nor participants were blinded to group allocation. Surgical interventions were performed between July 2017 and February 2021.
2.3. Interventions
Patients first received tailored, non‐surgical peri‐implantitis therapy including oral hygiene instructions, possible adjustments to implant‐borne prostheses and instrumentation performed with titanium curettes and polishing cups. Once demonstrating adequate self‐performed infection control (full‐mouth plaque score ≤20%), patients underwent surgical therapy at peri‐implantitis sites. A 10‐day antibiotic regimen (Amoxicillin 2 × 750 mg daily) was initiated 3 days prior to surgery. When feasible, prostheses were disconnected. Following local anesthesia, full‐thickness access flaps were carefully elevated and inflamed tissue was removed from the peri‐implant defect(s). Implant surfaces were cleaned by titanium curettes and a rotating titanium brush (Nano NiTi Brush, HANS KOREA CO. Ltd) used at ≤1200 rpm under continuous irrigation with saline. Upon surface decontamination, allocation to test or control was revealed. In controls, flaps were simply replaced at their initial position and sutured. At test sites, peri‐implant bony defects were filled with a bone substitute material (Bio‐Oss Collagen®, Geistlich, Lucerne, Switzerland) to the level of the bone crest prior to suturing. In both groups, the aim was to achieve primary closure through careful adaptation of tissue margins (Figure 2). Prostheses were reconnected and patients were advised to abstain from mechanical plaque control measures and rinse with a 0.2% solution of chlorhexidine digluconate until suture removal at 2 weeks. For additional details on the surgical procedures, see Table A1. Follow‐up visits including oral hygiene reinforcement and polishing by rubber cup (targeting the whole dentition) were scheduled at 6 weeks and at 6 and 12 months (Figure A1).
FIGURE 2.

Images illustrating interventions by group allocation
2.4. Clinical examination
Clinical assessments were carried out at baseline (prior to surgery) and at 6 and 12 months. Assessments included measurements of PPD, BOP, SOP, soft tissue levels and presence of plaque at 4 aspects per implant using a metal periodontal probe. The width of keratinized mucosa (KM) and the distance between the mucosal margin and a reference landmark (the shoulder of the implant or the prosthetic margin) were evaluated on the buccal aspect. PPD, soft tissue levels and KM were recorded to the nearest millimeter, while BOP, SOP (within 15 s following probing) and plaque were scored dichotomously (yes/no). Clinical examinations were performed with prostheses in place and intraoral photographs were obtained at baseline and follow‐up visits.
During surgery, dimensions of the peri‐implant bony defect(s) were measured by probe. Thus, defect depth (bony crest to the bottom of defect) and width as well as bone levels relative to implant shoulder were evaluated at four aspects per implant. Defects were categorized according to (i) defect geometry and (ii) presence/absence of the buccal bony wall (Table A2).
2.5. Radiographic examination
Intra‐ radiographic images were obtained by long‐cone parallel technique prior to surgery (≤4 weeks) and at 12 months. Marginal bone levels (MBL) were assessed by two trained and blinded investigators (JD & YI) using an image analysis software (ImageJ 2.0.0‐rc‐69/1.52n; National Institutes of Health). Pictures were calibrated either by the known inter‐thread distance or the implant length/diameter. MBLs were measured on the mesial and distal aspect relative to a fixed landmark and expressed in mm (Figure A2).
For 34 implant sites, MBL assessments were repeated. The absolute difference between two assessments was used to express the measurement error. Intra‐ and inter‐rater comparisons revealed mean measurement errors of 0.33 ± 0.37 mm (±: standard deviation) and 0.49 ± 0.46 mm. A two‐way mixed‐effect model with consistency agreement reported intraclass correlation coefficients of 0.97 (95% CI 0.96/0.98; CI: confidence interval) and 0.95 (95% CI 0.92/0.97), respectively.
2.6. Patient‐reported outcomes
Participants completed a written questionnaire prior to surgery, at 2 weeks and at 12 months. Responses were scored on a visual analog scale (VAS, 100 mm, Figure A3). Questions were translated into respective languages. Adverse events were recorded. In addition to an overall comparison by group allocation, we performed a sub‐analysis of satisfaction at 12 months considering only subjects treated at implant sites located in the esthetic zone (second premolar to second premolar in the maxilla).
2.7. Data analysis
According to an a priori power calculation, a total of 122 patients (61 per group) were required to detect (power 0.8; alpha 0.05) a difference of 1 mm in PPD change between groups, considering a standard deviation of 1.97 (Carcuac et al., 2016). To compensate for possible drop‐out, the enrollment of 140 study participants was planned. At the time of study planning, no relevant data on composite outcomes were available for appropriate power analysis.
The unit of analysis for clinical and radiographic evaluations was the implant. For MBL and PPD, the deepest measurement at each evaluation point was chosen, while for soft tissue level and KM, the buccal aspect was representative of the implant. For BOP and SOP, the percentage of positive aspects (out of four sites) per implant was calculated.
The primary outcome at 12 months was a composite measure including all of the following features: (i) implant not lost, (ii) absence of BOP/SOP at all aspects, (iii) PPD ≤5 mm at all aspects and (iv) ≤1 mm recession of mucosal margin on the buccal aspect (buccal REC) of the implant. Secondary outcomes included (i) changes (i.e., from baseline to 12 months) of MBL, (ii) changes of PPD, BOP%, buccal KM, (iii) buccal REC and (iv) patient‐reported outcomes.
We used logistic (for the primary outcome) and linear regression analyses to assess differences between test and control groups. Results of the logistic regression were expressed as odds ratio (OR). For continuous data, group allocation and time points (baseline, 6 and 12 months) were entered as main effects and interaction terms to the respective models (STATA 17.0, StataCorp). We predicted outcomes including 95% CIs and analyzed potential differences through pairwise comparisons (α: 0.05). We used Bonferroni correction for multiple comparisons. To address the potential clustering effect of multiple implants within patients, we confirmed initial estimates through multilevel modeling.
Analyses were performed according to the intention‐to‐treat principle. In case of missing data, the last available observation was carried forward under the assumption of “missing completely at random.” An evaluation of missingness was performed. Patient‐reported outcomes demonstrated skewed distributions and were analyzed per‐protocol using the Mann–Whitney U test. Finally, the potential effect of center on the composite outcome and on changes of PPD and MBL was evaluated by adding “Center” as an independent parameter to both the logistic and the respective linear regression analyses.
3. RESULTS
Out of the initially included 138 participants (147 implants), five subjects (six implants) were lost to follow‐up prior to the 12‐month evaluation (Figure 1). A total of four implants (one in the test group, three in the control group) in four patients were removed prior to the final examination due to continuous loss of MBL. One case of allergic reaction to the antibiotic therapy was recorded. No other adverse events related to any study intervention were noted.
At 12 months, the different components of the composite outcome were met at varying degrees. In all, the majority of implants presented with shallow PPD (≤5 mm; 68.5%) and minor buccal REC (≤1 mm; 68.5%). In contrast, the complete absence of BOP/SOP was achieved only for a minority of implants (25.9%). Accordingly, a composite outcome for all predefined criteria (implant not lost, absence of BOP/SOP, PPD ≤5 mm and buccal REC ≤1 mm) was noted for 16.4% and 13.5% of implants in the test and control group, respectively (Figure 3 & Table A3). Differences between groups were not statistically significant (OR 0.79; 95% CI 0.32/1.97; p = .62; Table A4). PPD reduction and MBL gain were 3.7 mm and about 1.0 mm in both groups. The reduction in mean BOP% varied between 45% and 50%. No statistically significant differences between groups were observed. Test implants demonstrated less buccal REC (mean difference: 0.40 mm, 95% CI 0.06/0.73; p = .02) and less buccal KM change (mean difference: 0.34 mm, 95% CI 0.01/0.67; p = .05) than controls (Table 2, Figure 4, Table A5 and Figure A4).
FIGURE 3.
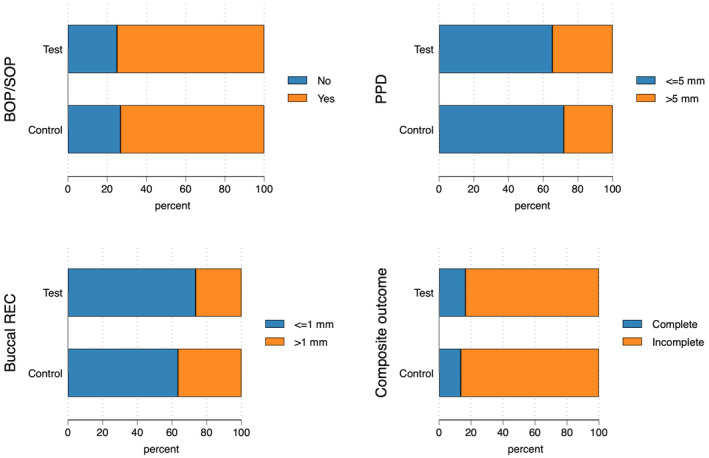
Threshold and composite outcomes at 12 months. N = 147 implants, the four implants lost due to disease progression are considered. Composite outcome defined as implant not lost, no bleeding on probing (BOP), no suppuration on probing (SOP), probing pocket depth (PPD) ≤5 mm and buccal recession (REC) ≤1 mm. For further details, see Table A3.
TABLE 2.
Continuous outcomes at 12 months by group (intention to treat)
| Test | Control | Total | |||||||
|---|---|---|---|---|---|---|---|---|---|
| n | Mean (SD) | Min to max | n | Mean (SD) | Min to max | n | Mean (SD) | Min to max | |
| PPD Change (mm) | 72 | −3.7 (2.1) | −8.0 to 3.0 | 71 | −3.7 (2.3) | −9.0 to 6.0 | 143 | −3.7 (2.2) | −9.0 to 6.0 |
| BOP% Change | 72 | −44.8 (36.6) | −100.0 to 50.0 | 71 | −49.6 (41.1) | −100.0 to 75.0 | 143 | −47.2 (38.8) | −100.0 to 75.0 |
| Buccal REC (mm) | 72 | 0.7 (0.9) | −1.0 to 3.0 | 71 | 1.1 (1.5) | −3.0 to 7.0 | 143 | 0.9 (1.2) | −3.0 to 7.0 |
| Buccal KM Change (mm) | 72 | −0.1 (1.3) | −5.0 to 4.0 | 71 | −0.5 (1.1) | −4.0 to 3.0 | 143 | −0.3 (1.2) | −5.0 to 4.0 |
| MBL Change (mm) | 72 | 1.1 (1.4) | −4.4 to 5.2 | 71 | 1.1 (1.0) | −2.3 to 3.9 | 143 | 1.1 (1.2) | −4.4 to 5.2 |
| Plaque (%) – per protocol | 69 | 20.3 (33.8) | 0.0 to 100.0 | 68 | 19.9 (31.6) | 0.0 to 100.0 | 137 | 20.1 (32.6) | 0.0 to 100.0 |
Note: N = 143 implants. The four implants lost due to disease progression are not considered. For statistical testing, see Table A5.
Abbreviations: BOP, bleeding on probing; KM, keratinized mucosa; MBL, marginal bone level; PPD, probing pocket depth; REC, recession; SD, standard deviation.
FIGURE 4.

Changes of probing pocket depth (PPD), bleeding on probing% (BOP%), buccal keratinized mucosa (KM), marginal bone level (MBL) and buccal recession (REC) following the surgical intervention. N = 143 implants, the 4 implants lost due to disease progression are not considered. Results are based on regressions analyses also illustrated in Table A5. Whiskers indicate 95% CIs.
Pronounced MBL gain of >2 mm was noted at 22.2% of test and at 18.3% of control implants. In all, 3 implants (2.1%), in addition to the four implants that were removed, demonstrated MBL loss >1 mm between surgery and the 12‐month evaluation (Table A3).
Responses to the questionnaires were not normally distributed (Figure 5 & Table A6).
FIGURE 5.

Patient‐reported outcomes at baseline, at 2 weeks and at 12 months by group. Outcomes were scored on a VAS (100 mm). More details are reported in Table A6.
At 12 months, the overall satisfaction with treatment outcomes (median and interquartile range) was rated at 97.5 (20.0) and 91.5 (20.0) in the test and control groups, respectively. Corresponding satisfaction with the esthetic outcome was 95.0 (24.0) and 95.0 (30.0). Postsurgical pain at 2 weeks was scored as 10.0 (20.0) and 10.0 (21.0). Differences between test and control groups were not statistically significant.
Clinical and radiographic outcomes at the 51 implants located in the esthetic zone revealed no statistically significant differences when compared to other sites (Table A7). In addition, differences between treatment groups in terms of buccal REC in the esthetic zone were consistent with overall findings (Table A8). No statistically significant differences in patient satisfaction were observed (Figure A5). No association between the degree of “satisfaction with therapy” and “satisfaction with esthetic outcome” and buccal REC was found (Figure A6).
The analysis of a potential center effect revealed no statistically significant differences in terms of composite outcome and PPD change between centers. Differences in MBL change by center were observed (Figure A7 & Tables A9, A10, A11, A12).
Details of the number of missing values (nonattendance) by time point are illustrated in Table A13.
4. DISCUSSION
In the present study, the potential benefit of the use of a bone substitute material in the reconstructive surgical therapy of peri‐implantitis was evaluated. Treatment resulted in pronounced improvements at 12 months as illustrated by reductions of PPD and BOP as well as by marginal bone level gain. For these parameters, no differences between groups were observed. Complete absence of BOP/SOP was observed at about 25% of implants, which limited the proportion of implants matching all predefined criteria for the composite outcome, irrespective of treatment group. Buccal soft tissue recession, however, was less pronounced in the test group when compared to controls. Patient‐reported outcomes were favorable in both groups without significant differences.
The results of the present study provide relevant information on the management of peri‐implantitis‐associated osseous defects. The currently available evidence in the field is limited not only due to the small number of controlled studies but also due to the heterogeneity in the choice of reconstructive technique. Thus, Wohlfahrt et al. (2012) and Jepsen et al. (2016) used a bone substitute material consisting of titanium granules, while Renvert et al. (2021; 2018) filled the bony defects at test sites with a xenograft. Isehed et al. (2016, 2018), on the other hand, applied a biological agent. Irrespective of technique, no differences in reduction of PPD or BOP scores were observed between test and control groups. Although this observation is in agreement with our results, the overall magnitude of PPD reduction in the present study was greater than in the aforementioned studies. This difference may be explained by the severity of peri‐implantitis in the presently included patient sample, illustrated by a PPD of 8.6 mm and an osseous defect depth of 6.0 mm prior to therapy. This explanation is supported by data presented by Tapia et al. (2019), who reported a similarly marked PPD reduction following reconstructive surgical therapy of peri‐implantitis at sites with a pre‐surgical PPD of 8.5 mm.
While the lack of differences in reduction of PPD and BOP scores between test and control sites in the current trial was consistent with findings from previous controlled studies, our data on MBL changes were more ambiguous. The MBL improvement at 12 months was about 1 mm in both groups, which corresponds well with previously described observations at control sites but not with data reported from test sites. Thus, Jepsen et al. (2016) and Renvert et al. (2021) reported an MBL improvement at test sites varying between 2.7 and 3.5 mm, while corresponding data for control sites were 0.9–1.4 mm. The reasons for the different results on MBL changes at test sites are not fully understood but may be related to variations in choice of reconstructive techniques/materials and in morphology of the peri‐implantitis‐associated bony defects. As already pointed out, difficulties in distinguishing a bone filler material from newly formed bone may influence the interpretation of bone levels on radiographs. In addition, peri‐implant osseous defects may present with configurations ranging from fully contained to “open,” i.e., absence of buccal and lingual bony walls. In the present study, the inclusion criteria allowed for cases with peri‐implant defects lacking buccal and/or lingual bone walls. In fact, almost 40% of all defects were classified as “open.” This figure may be considered as high, as the corresponding proportion in an observational study on reconstructive surgical therapy of peri‐implantitis was 18% (Roccuzzo et al., 2016). In the study by Renvert et al. (2021), 62% of sites had a fully contained defect configuration, whereas similar conditions in the present study were identified in 24% of cases.
Although a substantial reduction in BOP was observed after treatment in the present study, a complete resolution of inflammation, as indicated by the complete absence of BOP, was not achieved. This finding is not unique for the current investigation. Indeed, previous studies on surgical treatment of peri‐implantitis have reported persisting BOP at follow‐up (Carcuac et al., 2016; Carcuac et al., 2017; Carcuac et al., 2020; Heitz‐Mayfield et al., 2012; Heitz‐Mayfield et al., 2018). Persisting BOP may be explained by the difficulties for patients to achieve proper access during home care coupled with the complex anatomy of exposed implant components following treatment. In the present study, residual BOP scores had a critical influence on the composite outcome. Difficulties in obtaining high composite outcome scores were also reported elsewhere (Carcuac et al., 2016; Jepsen et al., 2016).
There are limited data on the alterations of the soft tissue margin in previous controlled studies on reconstructive surgical therapy of peri‐implantitis. While Renvert et al. (2021; 2018) did not observe differences in soft tissue recession between test and control sites, the results in the present study pointed to more favorable outcomes at test sites. The mean difference between groups was 0.4 mm and pronounced soft tissue recession of >1 mm occurred in a larger proportion of control than test sites (37% vs. 26%). Although the reason for the difference in soft tissue recession between groups is not fully understood, the potential influence of the graft material on the tissue volume in the bucco‐lingual dimension after therapy should be considered. In this context, it should be pointed out, however, that the clinical relevance of this finding at 12 months may be limited, as patient satisfaction in terms of esthetic appearance after treatment was high, irrespective of allocation to test or control procedures. This general observation is in agreement with data presented by Renvert et al. (2021). We further confirmed the lack of association between patient satisfaction and soft tissue recession in our sub‐analysis on implants in the esthetic zone.
The multicenter design and the large sample size are strengths of the present study. No critical center effects were observed. When interpreting the findings, the reader should also consider some limitations. The relevance of persisting, albeit reduced, BOP and PPD, and the importance of soft tissue recession on long‐term outcomes and patient satisfaction require evaluations beyond the current time frame of 12 months. The lack of blinding of investigators and patients may have introduced a risk of bias. In addition, the power calculation was based on changes of PPD rather than our primary outcome, due to a lack of relevant data on composite outcomes at the time of study design. Further, evaluations of MBL after the use of bone substitute materials are challenging and may have influenced the accuracy of radiographic assessments. Results from a preclinical in vivo study, however, indicated that the identification of marginal bone levels on conventional radiographic images is a reliable method, also after reconstructive therapy of peri‐implantitis (Almohandes et al., 2022).
5. CONCLUSIONS
Surgical therapy of peri‐implantitis effectively improved the clinical and radiographic status at 12 months. While the use of a bone substitute material did not improve reductions of PPD and BOP, buccal REC was less pronounced in the test group. Patient satisfaction was high in both groups.
AUTHOR CONTRIBUTIONS
JD and TB contributed to study conception and design. All authors contributed to data collection. ER, YI, and CD acted as study monitors and were responsible for data management. JD, CT, and TB contributed to data analysis and interpretation. All authors contributed to drafting and revision of the manuscript.
FUNDING INFORMATION
The project (15–013) was supported by a Large Clinical Grant from the Osteology Foundation, Switzerland.
CONFLICT OF INTEREST
Dr. Derks reports speakers honoraria from Osteology Foundation, Dentsply Sirona Implants, Straumann Group and received research grants from Eklund Foundation and Electro Medical Systems. Dr. Ortiz‐Vigón reports speakers honoraria from Straumann Group and Arrow Development research and financial support from Thinking Perio research. Dr. Guerrero reports honoraria from Inibsa and Dentsply Sirona Implants. Dr. Donati reports speakers honoraria from Dentsply Sirona Implants and received research grants from Dentsply Sirona Implants. Dr. Bressan reports speakers honoraria from Dentsply Sirona Implants and Sweden & Martina. Dr. Ghensi reports speakers honoraria from Geistlich Pharma AG and BioHorizons Camlog. Dr. Schaller reports speakers honoraria from Zimmer Biomet. Dr. Tomasi reports speakers honoraria from Dentsply Sirona Implants, Straumann Group, Geistlich Pharma AG and Sweden & Martina. Dr. Karlsson reports speakers honoraria from Dentsply Sirona Implants. Dr. Abrahamsson received research grants from Dentsply Sirona Implants. Dr. Berglundh reports honoraria from Dentsply Sirona Implants, speakers honoraria from Osteology Foundation and received research grants from Dentsply Sirona Implants and Geistlich Pharma AG.
ACKNOWLEDGEMENT
The authors acknowledge Professor Max Petzold for his support during data analysis.
APPENDIX A.
TABLE A1.
Details regarding surgical interventions by group. N = 138 patients
| Test | Control | Total | ||||||||
|---|---|---|---|---|---|---|---|---|---|---|
| n | % mean (SD) | Min‐max | n | % mean (SD) | Min‐max | n | % Mean (SD) | Min‐max | ||
| Prosthesis | Not removed | 22 | 31.9% | 21 | 30.4% | 43 | 31.2% | |||
| Removed | 47 | 68.1% | 48 | 69.6% | 95 | 68.8% | ||||
| Surgical access | Limited access | 1 | 1.4% | 1 | 1.4% | 2 | 1.4% | |||
| Full access | 68 | 98.6% | 68 | 98.6% | 136 | 98.6% | ||||
| Surgical assessment | Not fully satisfied | 0 | 0% | 0 | 0% | 0 | 0% | |||
| Fully satisfied | 69 | 100.0% | 69 | 100.0% | 138 | 100.0% | ||||
| Surgery duration (min) | 69 | 53.0 (12.8) | 25–105 | 69 | 49.6 (16.3) | 10–145 | 138 | 51.3 (14.7) | 10–145 | |
TABLE A2.
Characteristics of peri‐implant defects assessed intrasurgically by group
| Test | Control | Total | ||||||||
| n | % mean (SD) | Min‐max | n | % mean (SD) | Min‐max | n | % Mean (SD) | Min‐max | ||
| Bone crest to bottom of defect (mm) | 73 | 6.0 (1.9) | 3–13 | 74 | 6.0 (2.1) | 3–14 | 147 | 6.0 (2.0) | 3–14 | |
| Implant shoulder to bottom of defect (mm) | 73 | 6.7 (2.1) | 3–14 | 74 | 6.7 (2.4) | 3–15 | 147 | 6.7 (2.3) | 3–15 | |
| Defect width (mm) | 73 | 3.1 (1.0) | 1–7 | 74 | 3.1 (1.0) | 2–9 | 147 | 3.1 (1.0) | 1–9 | |
| Defect configuration | Open a at buccal and lingual aspect | 27 | 37.0% | 30 | 40.5% | 57 | 38.8% | |||
| Open a at either buccal or lingual aspect | 32 | 43.8% | 22 | 29.7% | 54 | 36.7% | ||||
| Contained | 14 | 19.2% | 22 | 29.7% | 36 | 24.5% | ||||
| Buccal bone wall | Intact | 36 | 49.3% | 35 | 47.3% | 71 | 48.3% | |||
| Partially missing b | 20 | 27.4% | 12 | 16.2% | 32 | 21.8% | ||||
| Missing b | 17 | 23.3% | 27 | 36.5% | 44 | 29.9% | ||||
Note: N = 147 implants.
Defect configuration: “Open” is defined as implant exposure >2 mm (Implant shoulder to bottom of defect ‐ Crest to bottom of defect >2 mm).
Buccal bone wall: “Partially missing” is defined as buccal implant exposure >2 and ≤4 mm. “Missing” is defined as buccal implant exposure >4 mm.
TABLE A3.
Threshold and composite outcomes at 12 months by group (intention to treat)
| Test | Control | Total | |||||
|---|---|---|---|---|---|---|---|
| n | % | n | % | n | % | ||
| Implant loss | No | 72 | 98.6% | 71 | 95.9% | 143 | 97.3% |
| Yes | 1 | 1.4% | 3 | 4.1% | 4 | 2.7% | |
| BOP | No | 18 | 25.0% | 19 | 26.8% | 37 | 25.9% |
| Yes | 54 | 75.0% | 52 | 73.2% | 106 | 74.1% | |
| SOP | No | 64 | 88.9% | 62 | 87.3% | 126 | 88.1% |
| Yes | 8 | 11.1% | 9 | 12.7% | 17 | 11.9% | |
| PPD | ≤5 mm | 47 | 65.3% | 51 | 71.8% | 98 | 68.5% |
| >5 mm | 25 | 34.7% | 20 | 28.2% | 45 | 31.5% | |
| Buccal REC | ≤1 mm | 53 | 73.6% | 45 | 63.4% | 98 | 68.5% |
| >1 mm | 19 | 26.4% | 26 | 36.6% | 45 | 31.5% | |
| Composite outcome | Complete a | 12 | 16.4% | 10 | 13.5% | 22 | 15.0% |
| Incomplete | 61 | 83.6% | 64 | 86.5% | 125 | 85.0% | |
| MBL Change ≥0 mm | No | 9 | 12.5% | 7 | 9.9% | 16 | 11.2% |
| Yes | 63 | 87.5% | 64 | 90.1% | 127 | 88.8% | |
| MBL Gain >1 mm | No | 36 | 50.0% | 35 | 49.3% | 71 | 49.7% |
| Yes | 36 | 50.0% | 36 | 50.7% | 72 | 50.3% | |
| MBL Gain >2 mm | No | 56 | 77.8% | 58 | 81.7% | 114 | 79.7% |
| Yes | 16 | 22.2% | 13 | 18.3% | 29 | 20.3% | |
| MBL Loss >1 mm | No | 71 | 98.6% | 69 | 97.2% | 140 | 97.9% |
| Yes | 1 | 1.4% | 2 | 2.8% | 3 | 2.1% | |
Note: N = 147 implants.
Abbreviations: BOP, bleeding on probing;KM, keratinized mucosa; MBL, marginal bone level; PPD, probing pocket depth; REC, recession; SOP, suppuration on probing.
Complete defined as implant not lost; no BOP, no SOP, PPD ≤5 mm and buccal REC ≤1 mm.
TABLE A4.
Logistic regression: Composite outcome at 12 months (intention to treat)
| Odds ratio | 95% Confidence interval | p‐Value | |
|---|---|---|---|
| Test | 1 | ‐ | ‐ |
| Control | 0.79 | 0.32/1.97 | .620 |
| Intercept | 0.30 | 0.11/0.37 | <.001 |
Note: N = 147 implants.
TABLE A5.
Results of the regression analysis: Continuous outcomes (intention to treat)
| Test | Control | p‐Value | ||||
|---|---|---|---|---|---|---|
| Predicted value | 95% Confidence interval | Predicted value | 95% Confidence interval | |||
| PPD Change (mm) | 6 months | −3.74 | −4.15/−3.33 | −3.60 | −4.01/−3.18 | ‐ |
| 12 months | −3.71 | −4.13/−3.29 | −3.68 | −4.10/−3.26 | .91 | |
| BOP% Change | 6 months | −52.06 | −59.34/−44.77 | −51.35 | −58.59/−44.11 | ‐ |
| 12 months | −44.79 | −52.13/−37.45 | −49.65 | −57.04/−42.26 | .36 | |
| MBL Change (mm) | 12 months | 1.11 | 0.91/1.31 | 1.06 | 0.86/1.27 | .73 |
| Buccal REC (mm) | 6 months | 0.79 | 0.56/1.02 | 1.03 | 0.80/1.26 | ‐ |
| 12 months | 0.71 | 0.47/0.94 | 1.11 | 0.87/1.34 | .02 | |
| Buccal KM Change (mm) | 6 months | 0.03 | −0.21/0.26 | −0.53 | −0.76/−0.30 | ‐ |
| 12 months | −0.15 | −0.39/0.09 | −0.49 | −0.72/−0.25 | .05 | |
Note: N = 143 implants. The four implants lost due to disease progression are not considered.
Abbreviations: BOP, bleeding on probing; KM, keratinized mucosa; MBL, marginal bone level; PPD, probing pocket depth; REC, recession.
TABLE A6.
Patient‐reported outcomes at baseline, 2 weeks, and 12 months by group (per protocol)
| Test | Control | Total | ||||||||||||||||||||
|---|---|---|---|---|---|---|---|---|---|---|---|---|---|---|---|---|---|---|---|---|---|---|
| n | Med | IQR | Mean | SD | Min | Max | n | Med | IQR | Mean | SD | Min | Max | n | Med | IQR | Mean | SD | Min | Max | ||
| Baseline | Pain | 69 | 0.0 | 13.0 | 9.1 | 15.5 | 0 | 70 | 69 | 6.0 | 27.0 | 17.3 | 23.7 | 0 | 80 | 138 | 2.0 | 20.0 | 13.2 | 20.4 | 0 | 80 |
| Bad smell/taste | 69 | 0.0 | 14.0 | 11.9 | 21.9 | 0 | 100 | 69 | 3.0 | 20.0 | 15.4 | 22.6 | 0 | 90 | 138 | 0.0 | 20.0 | 13.7 | 22.3 | 0 | 100 | |
| Pain on brushing | 69 | 0.0 | 26.0 | 13.5 | 20.1 | 0 | 80 | 69 | 10.0 | 33.0 | 20.3 | 25.5 | 0 | 90 | 138 | 5.0 | 30.0 | 16.9 | 23.1 | 0 | 90 | |
| Pain on chewing | 69 | 0.0 | 0.0 | 3.8 | 12.0 | 0 | 80 | 69 | 0.0 | 10.0 | 9.4 | 17.5 | 0 | 77 | 138 | 0.0 | 5.0 | 6.6 | 15.2 | 0 | 80 | |
| Satisfied with esthetics | 69 | 97.0 | 26.0 | 76.7 | 34.8 | 0 | 100 | 68 | 90.0 | 28.0 | 80.1 | 27.5 | 0 | 100 | 137 | 92.0 | 26.0 | 78.4 | 31.3 | 0 | 100 | |
| 1 year | Pain | 65 | 0.0 | 3.0 | 4.6 | 12.9 | 0 | 80 | 65 | 0.0 | 4.0 | 6.0 | 14.2 | 0 | 83 | 130 | 0.0 | 3.0 | 5.3 | 13.5 | 0 | 83 |
| Bad smell/taste | 65 | 0.0 | 0.0 | 4.1 | 13.5 | 0 | 80 | 65 | 0.0 | 3.0 | 3.5 | 8.4 | 0 | 50 | 130 | 0.0 | 2.0 | 3.8 | 11.2 | 0 | 80 | |
| Pain on brushing | 65 | 0.0 | 5.0 | 7.5 | 15.0 | 0 | 63 | 65 | 0.0 | 8.0 | 6.0 | 11.0 | 0 | 50 | 130 | 0.0 | 7.0 | 6.7 | 13.1 | 0 | 63 | |
| Pain on chewing | 64 | 0.0 | 0.0 | 1.0 | 3.3 | 0 | 23 | 65 | 0.0 | 3.0 | 4.3 | 13.3 | 0 | 90 | 129 | 0.0 | 0.0 | 2.7 | 9.8 | 0 | 90 | |
| Satisfied with esthetics | 63 | 95.0 | 24.0 | 79.1 | 31.5 | 0 | 100 | 65 | 95.0 | 30.0 | 79.8 | 29.6 | 0 | 100 | 128 | 95.0 | 28.5 | 79.5 | 30.4 | 0 | 100 | |
| Satisfaction with therapy | 64 | 97.5 | 20.0 | 87.3 | 19.5 | 0 | 100 | 64 | 91.5 | 20.0 | 85.0 | 21.9 | 10 | 100 | 128 | 95.0 | 20.0 | 86.2 | 20.7 | 0 | 100 | |
| 2 weeks | Surgery unpleasant | 69 | 10.0 | 30.0 | 20.0 | 25.2 | 0 | 90 | 68 | 13.0 | 30.0 | 19.6 | 21.3 | 0 | 75 | 137 | 11.0 | 30.0 | 19.8 | 23.3 | 0 | 90 |
| Postsurgical pain | 69 | 10.0 | 20.0 | 13.2 | 17.1 | 0 | 70 | 68 | 10.0 | 21.0 | 14.6 | 17.6 | 0 | 70 | 137 | 10.0 | 20.0 | 13.9 | 17.3 | 0 | 70 | |
| Pain today | 69 | 0.0 | 3.0 | 5.3 | 12.9 | 0 | 70 | 68 | 0.0 | 4.0 | 3.2 | 6.2 | 0 | 23 | 137 | 0.0 | 3.0 | 4.3 | 10.2 | 0 | 70 | |
Note: N = 138 patients. Results are graphically illustrated in Figure 5
TABLE A7.
Clinical and radiographic outcomes at 12 months by location (intention to treat)
| Esthetic zone | Other | Total | |||||||||||||
|---|---|---|---|---|---|---|---|---|---|---|---|---|---|---|---|
| n | Mean | SD | Min | Max | n | Mean | SD | Min | Max | n | Mean | SD | Min | Max | |
| PPD Change (mm) | 51 | −3.9 | (2.1) | −9.0 | 0.0 | 92 | −3.6 | (2.3) | −8.0 | 6.0 | 143 | −3.7 | (2.2) | −9.0 | 6.0 |
| BOP% Change | 51 | −51.0 | (36.4) | −100.0 | 50.0 | 92 | −45.1 | (40.1) | −100.0 | 75.0 | 143 | −47.2 | (38.8) | −100.0 | 75.0 |
| Buccal REC (mm) | 51 | 1.0 | (1.0) | −1.0 | 4.0 | 92 | 0.9 | (1.4) | −3.0 | 7.0 | 143 | 0.9 | (1.2) | −3.0 | 7.0 |
| Buccal KM Change (mm) | 51 | −0.4 | (1.1) | −2.0 | 3.0 | 92 | −0.3 | (1.3) | −5.0 | 4.0 | 143 | −0.3 | (1.2) | −5.0 | 4.0 |
| MBL Change (mm) | 51 | 1.1 | (1.1) | −1.0 | 3.5 | 92 | 1.1 | (1.3) | −4.4 | 5.2 | 143 | 1.1 | (1.2) | −4.4 | 5.2 |
Note: N = 143 implants. Maxillary sites in the area from second premolar to second premolar were considered to be located in the esthetic zone.
Abbreviations: BOP, bleeding on probing; KM, keratinized mucosa; MBL, marginal bone level; PPD, probing pocket depth; REC, recession.
TABLE A8.
Buccal REC in the esthetic zone by the treatment group (intention to treat)
| Test | Control | Total | |||||||||||||
|---|---|---|---|---|---|---|---|---|---|---|---|---|---|---|---|
| n | Mean | SD | Min | Max | n | Mean | SD | Min | Max | n | Mean | SD | Min | Max | |
| Buccal REC (mm) | 27 | 0.8 | (1.0) | −1.0 | 3.0 | 24 | 1.2 | (1.0) | 0.0 | 4.0 | 51 | 1.0 | (1.0) | −1.0 | 4.0 |
Note: N = 51 implants.
Abbreviation: REC, recession.
TABLE A9.
Evaluation of center effect. (A) Continuous parameters at baseline by center. N = 147 implants. (B) Continuous outcomes at 12 months by center (intention to treat). N = 143 implants
| Bilbao | Gothenburg | Malaga | Munich | Perugia | Trento | Total | |||||||||||||||
|---|---|---|---|---|---|---|---|---|---|---|---|---|---|---|---|---|---|---|---|---|---|
| n | Mean | SD | n | Mean | SD | n | Mean | SD | n | Mean | SD | n | Mean | SD | n | Mean | SD | n | Mean | SD | |
| (A) | |||||||||||||||||||||
| PPD (mm) | 32 | 8.7 | (1.4) | 49 | 8.1 | (1.2) | 19 | 10.1 | (1.8) | 7 | 8.3 | (2.0) | 10 | 8.0 | (1.2) | 30 | 8.9 | (1.8) | 147 | 8.6 | (1.6) |
| BOP (%) | 32 | 83.6 | (27.4) | 49 | 94.9 | (12.5) | 19 | 98.7 | (5.7) | 7 | 92.9 | (18.9) | 10 | 95.0 | (15.8) | 30 | 80.8 | (26.8) | 147 | 90.0 | (20.8) |
| SOP (%) | 32 | 31.2 | (42.1) | 49 | 54.1 | (43.7) | 19 | 26.3 | (28.2) | 7 | 28.6 | (36.6) | 10 | 15.0 | (33.7) | 30 | 20.8 | (31.5) | 147 | 34.9 | (40.4) |
| Plaque (%) | 32 | 29.7 | (39.9) | 49 | 4.1 | (17.9) | 19 | 18.4 | (21.8) | 7 | 25.0 | (38.2) | 10 | 70.0 | (48.3) | 30 | 12.5 | (24.3) | 147 | 18.7 | (33.3) |
| Buccal soft tissue level (mm) | 32 | 1.0 | (1.4) | 49 | 0.2 | (1.7) | 19 | 0.5 | (0.8) | 7 | 0.6 | (0.8) | 10 | 0.5 | (1.2) | 30 | 0.3 | (1.0) | 147 | 0.5 | (1.3) |
| Buccal KM (mm) | 32 | 1.5 | (1.7) | 49 | 2.4 | (1.8) | 19 | 3.0 | (2.3) | 7 | 3.0 | (2.8) | 10 | 2.8 | (1.2) | 30 | 2.3 | (1.4) | 147 | 2.3 | (1.8) |
| MBL (mm) | 32 | 6.5 | (2.2) | 49 | 5.9 | (1.8) | 19 | 7.3 | (1.4) | 7 | 5.7 | (1.9) | 10 | 5.8 | (2.3) | 30 | 5.4 | (1.9) | 147 | 6.1 | (2.0) |
| (B) | |||||||||||||||||||||
| PPD Change (mm) | 32 | −3.4 | (2.4) | 48 | −4.1 | (1.5) | 18 | −4.2 | (2.8) | 6 | −2.7 | (2.3) | 9 | −3.9 | (1.7) | 30 | −3.1 | (2.6) | 143 | −3.7 | (2.2) |
| BOP% Change | 32 | −48.4 | (46.6) | 48 | −54.2 | (36.2) | 18 | −55.6 | (35.9) | 6 | 0.0 | 0.0 | 9 | −61.1 | (39.7) | 30 | −35.0 | (30.5) | 143 | −47.2 | (38.8) |
| Buccal REC (mm) | 32 | 0.7 | (1.5) | 48 | 1.2 | (0.9) | 18 | 0.7 | (1.0) | 6 | 0.3 | (0.8) | 9 | 1.3 | (1.3) | 30 | 0.7 | (1.5) | 143 | 0.9 | (1.2) |
| Buccal KM Change (mm) | 32 | 0.0 | (1.9) | 48 | −0.3 | (0.9) | 18 | −0.6 | (0.9) | 6 | 0.0 | (1.3) | 9 | −0.8 | (0.8) | 30 | −0.5 | (0.9) | 143 | −0.3 | (1.2) |
| MBL Change (mm) | 32 | 0.9 | (0.9) | 48 | 1.4 | (1.3) | 18 | 1.1 | (1.4) | 6 | 1.6 | (2.0) | 9 | 0.5 | (0.8) | 30 | 0.8 | (1.2) | 143 | 1.1 | (1.2) |
| Plaque at 12 months – pp a | 32 | 27.3 | (33.2) | 47 | 4.8 | (14.4) | 17 | 30.9 | (40.0) | 4 | 43.8 | (42.7) | 9 | 38.9 | (48.6) | 28 | 21.4 | (33.8) | 137 | 20.1 | (32.6) |
Abbreviations: BOP, bleeding on probing; KM, keratinized mucosa; MBL, marginal bone level; REC—recession; PPD, probing pocket depth; REC, recession.
Plaque at 12 months is reported per protocol.
TABLE A10.
Composite outcome at 12 months by center (intention to treat)
| Bilbao | Gothenburg | Malaga | Munich | Perugia | Trento | Total | |||||||||
|---|---|---|---|---|---|---|---|---|---|---|---|---|---|---|---|
| n | % | n | % | n | % | n | % | n | % | n | % | n | % | ||
| Composite outcome | Complete a | 6 | 18.8% | 6 | 12.2% | 2 | 10.55 | 0 | 0.0% | 2 | 20.0% | 6 | 20.0% | 22 | 15.0% |
| Incomplete | 26 | 81.2% | 43 | 87.8% | 17 | 89.5% | 7 | 100.0% | 8 | 80.0% | 24 | 80.0% | 125 | 85.0% | |
Note: N = 147 implants.
Complete defined as implant not lost, no bleeding on probing, no suppuration on probing, probing pocket depth ≤5 mm, and buccal recession ≤1 mm.
TABLE A11.
Logistic regression: Composite outcome at 12 months comparing centers (intention to treat)
| Odds ratio | 95% Confidence interval | p‐Value | |
|---|---|---|---|
| Bilbao | 1.00 | ‐ | ‐ |
| Gothenburg | 0.60 | 0.18/2.07 | .423 |
| Malaga | 0.51 | 0.09/2.83 | .441 |
| Munich | a | ||
| Perugia | 1.08 | 0.18/6.46 | .930 |
| Trento | 1.08 | 0.31/3.82 | .901 |
| Intercept | 0.23 | 0.09/0.56 | .001 |
Note: N = 147 implants.
One cell with 0 observations.
TABLE A12.
Regression analysis of continuous outcomes comparing centers, adjusted for multiple comparisons (Bonferroni) (intention to treat)
| Contrast | Standard error | t‐Value | p‐Value | |
|---|---|---|---|---|
| PPD change | ||||
| Gothenburg versus Bilbao | −0.69 | 0.40 | −1.70 | 1.00 |
| Malaga versus Bilbao | −0.78 | 0.52 | −1.51 | 1.00 |
| Munich versus Bilbao | 0.77 | 0.79 | 0.98 | 1.00 |
| Perugia versus Bilbao | −0.45 | 0.67 | −0.68 | 1.00 |
| Trento versus Bilbao | 0.34 | 0.45 | 0.75 | 1.00 |
| Malaga versus Gothenburg | −0.10 | 0.49 | −0.20 | 1.00 |
| Munich versus Gothenburg | 1.46 | 0.77 | 1.90 | .86 |
| Perugia versus Gothenburg | 0.24 | 0.64 | 0.37 | 1.00 |
| Trento versus Gothenburg | 1.03 | 0.41 | 2.49 | .20 |
| Munich versus Malaga | 1.56 | 0.83 | 1.87 | .94 |
| Perugia versus Malaga | 0.33 | 0.72 | 0.46 | 1.00 |
| Trento versus Malaga | 1.12 | 0.53 | 2.13 | .51 |
| Perugia versus Munich | −1.22 | 0.93 | −1.31 | 1.00 |
| Trento versus Munich | −0.43 | 0.79 | −0.55 | 1.00 |
| Trento versus Perugia | 0.79 | 0.67 | 1.17 | 1.00 |
| MBL change | ||||
| Gothenburg versus Bilbao | 0.48 | 0.20 | 2.42 | .24 |
| Malaga versus Bilbao | 0.12 | 0.25 | 0.48 | 1.00 |
| Munich versus Bilbao | 0.68 | 0.38 | 1.78 | 1.00 |
| Perugia versus Bilbao | −0.45 | 0.32 | −1.37 | 1.00 |
| Trento versus Bilbao | −0.11 | 0.22 | −0.52 | 1.00 |
| Malaga versus Gothenburg | −0.35 | 0.24 | −1.49 | 1.00 |
| Munich versus Gothenburg | 0.21 | 0.37 | 0.56 | 1.00 |
| Perugia versus Gothenburg | −0.92 | 0.31 | −2.94 | .05 |
| Trento versus Gothenburg | −0.59 | 0.20 | −2.94 | .05 |
| Munich versus Malaga | 0.56 | 0.41 | 1.39 | 1.00 |
| Perugia versus Malaga | −0.57 | 0.35 | −1.61 | 1.00 |
| Trento versus Malaga | −0.23 | 0.26 | −0.91 | 1.00 |
| Perugia versus Munich | −1.13 | 0.45 | −2.49 | .20 |
| Trento versus Munich | −0.80 | 0.39 | −2.07 | .59 |
| Trento versus Perugia | 0.33 | 0.33 | 1.01 | 1.00 |
Note: N = 143 implants. Outcomes are graphically illustrated in Figure A7.
TABLE A13.
Missing values for the different parameters by time point
| Test | Control | Total | |||||||
|---|---|---|---|---|---|---|---|---|---|
| Baseline | 6 months | 12 months | Baseline | 6 months | 12 months | Baseline | 6 months | 12 months | |
| PPD | 0 | 4 | 3 | 0 | 5 | 3 | 0 | 9 | 6 a |
| BOP | 0 | 4 | 3 | 0 | 5 | 3 | 0 | 9 | 6 a |
| Buccal Soft Tissue Level | 0 | 4 | 3 | 0 | 5 | 3 | 0 | 9 | 6 a |
| Buccal KM | 0 | 4 | 3 | 0 | 5 | 3 | 0 | 9 | 6 a |
| MBL | 0 | ‐ | 3 | 0 | ‐ | 3 | 0 | ‐ | 6 a |
Note: Unit of analysis: Implant.
Abbreviations: BOP, bleeding on probing; KM, keratinized mucosa; MBL, marginal bone level; PPD, probing pocket depth.
Six implants in five patients.
FIGURE A1.

Flowchart illustrating the study outline
FIGURE A2.

Illustration of radiographic evaluation of marginal bone levels at baseline and at 1 year. Images were calibrated by known distances (green line).
FIGURE A3.

Questionnaires provided to study participants at baseline, at 2 weeks and at 12 months
FIGURE A4.

Cumulative curves of continuous outcomes at 12 months by group. N = 143 implants. KM, keratinized mucosa; MBL, marginal bone level; PPD, probing pocket depth; REC, recession.
FIGURE A5.

Patient‐reported outcomes at 12 months by group considering only subjects with treated implant sites in the esthetic zone (second premolar to second premolar in the maxilla). Outcomes were scored on a VAS (100 mm). N = 47 patients
FIGURE A6.

Patient satisfaction by soft tissue recession considering only subjects with treated implant sites in the esthetic zone (second premolar to second premolar in the maxilla). N = 47 patients. VAS, visual analog scale
FIGURE A7.

Illustration of potential center effect: Probing pocket depth change and marginal bone level change by center. N = 143 implants. Results of the statistical testing are illustrated in Table A12. MBL, marginal bone level; PPD, probing pocket depth.
Derks, J. , Ortiz‐Vigón, A. , Guerrero, A. , Donati, M. , Bressan, E. , Ghensi, P. , Schaller, D. , Tomasi, C. , Karlsson, K. , Abrahamsson, I. , Ichioka, Y. , Dionigi, C. , Regidor, E. , & Berglundh, T. (2022). Reconstructive surgical therapy of peri‐implantitis: A multicenter randomized controlled clinical trial. Clinical Oral Implants Research, 33, 921–944. 10.1111/clr.13972
DATA AVAILABILITY STATEMENT
Data are available upon reasonable request made to the corresponding author.
REFERENCES
- Albouy, J. P. , Abrahamsson, I. , Persson, L. G. , & Berglundh, T. (2011). Implant surface characteristics influence the outcome of treatment of peri‐implantitis: An experimental study in dogs. Journal of Clinical Periodontology, 38(1), 58–64. 10.1111/j.1600-051X.2010.01631.x [DOI] [PubMed] [Google Scholar]
- Almohandes, A. , Lund, H. , Carcuac, O. , Petzold, M. , Berglundh, T. , & Abrahamsson, I. (2022). Accuracy of bone‐level assessments following reconstructive surgical treatment of experimental peri‐implantitis. Clinical Oral Implants Research, 33, 433–440. 10.1111/clr.13903 [DOI] [PMC free article] [PubMed] [Google Scholar]
- Berglundh, T. , Wennström, J. L. , & Lindhe, J. (2018). Long‐term outcome of surgical treatment of peri‐implantitis. A 2‐11‐year retrospective study. Clinical Oral Implants Research, 38(1), 58–57. 10.1111/clr.13138 [DOI] [PubMed] [Google Scholar]
- Carcuac, O. , Abrahamsson, I. , Charalampakis, G. , & Berglundh, T. (2015). The effect of the local use of chlorhexidine in surgical treatment of experimental peri‐implantitis in dogs. Journal of Clinical Periodontology, 42(2), 196–203. 10.1111/jcpe.12332 [DOI] [PubMed] [Google Scholar]
- Carcuac, O. , Derks, J. , Abrahamsson, I. , Wennström, J. L. , & Berglundh, T. (2020). Risk for recurrence of disease following surgical therapy of peri‐implantitis‐a prospective longitudinal study. Clinical Oral Implants Research, 31(11), 1072–1077. 10.1111/clr.13653 [DOI] [PubMed] [Google Scholar]
- Carcuac, O. , Derks, J. , Abrahamsson, I. , Wennström, J. L. , Petzold, M. , & Berglundh, T. (2017). Surgical treatment of peri‐implantitis: 3‐year results from a randomized controlled clinical trial. Journal of Clinical Periodontology, 44(12), 1294–1303. 10.1111/jcpe.12813 [DOI] [PubMed] [Google Scholar]
- Carcuac, O. , Derks, J. , Charalampakis, G. , Abrahamsson, I. , Wennström, J. , & Berglundh, T. (2016). Adjunctive systemic and local antimicrobial therapy in the surgical treatment of peri‐implantitis. Journal of Dental Research, 95(1), 50–57. 10.1177/0022034515601961 [DOI] [PubMed] [Google Scholar]
- Derks, J. , Schaller, D. , Håkansson, J. , Wennström, J. L. , Tomasi, C. , & Berglundh, T. (2016). Effectiveness of implant therapy analyzed in a Swedish population: Prevalence of peri‐implantitis. Journal of Dental Research, 95(1), 43–49. 10.1177/0022034515608832 [DOI] [PubMed] [Google Scholar]
- Heitz‐Mayfield, L. J. A. , Salvi, G. E. , Mombelli, A. , Faddy, M. , & Lang, N. P. (2012). Anti‐infective surgical therapy of peri‐implantitis. A 12‐month prospective clinical study. Clinical Oral Implants Research, 23(2), 205–210. 10.1111/j.1600-0501.2011.02276.x [DOI] [PubMed] [Google Scholar]
- Heitz‐Mayfield, L. J. A. , Salvi, G. E. , Mombelli, A. , Loup, P.‐J. , Heitz, F. , Kruger, E. , & Lang, N. P. (2018). Supportive peri‐implant therapy following anti‐infective surgical peri‐implantitis treatment: 5‐year survival and success. Clinical Oral Implants Research, 29(1), 1–6. 10.1111/clr.12910 [DOI] [PubMed] [Google Scholar]
- Hentenaar, D. F. M. , Waal, Y. C. M. D. , Stewart, R. E. , Winkelhoff, A. J. V. , Meijer, H. J. A. , & Raghoebar, G. M. (2022). Erythritol air polishing in the surgical treatment of peri‐implantitis: A randomized controlled trial. Clinical Oral Implants Research, 33(2), 184–196. 10.1111/clr.13881 [DOI] [PMC free article] [PubMed] [Google Scholar]
- Isehed, C. , Holmlund, A. , Renvert, S. , Svenson, B. , Johansson, I. , & Lundberg, P. (2016). Effectiveness of enamel matrix derivative on the clinical and microbiological outcomes following surgical regenerative treatment of peri‐implantitis. A randomized controlled trial. Journal of Clinical Periodontology, 43(10), 863–873. 10.1111/jcpe.12583 [DOI] [PubMed] [Google Scholar]
- Isehed, C. , Svenson, B. , Lundberg, P. , & Holmlund, A. (2018). Surgical treatment of peri‐implantitis using enamel matrix derivative, an RCT: 3‐ and 5‐year follow‐up. Journal of Clinical Periodontology, 830(Suppl 16), 69–10. 10.1111/jcpe.12894 [DOI] [PubMed] [Google Scholar]
- Jepsen, K. , Jepsen, S. , Laine, M. L. , Anssari Moin, D. , Pilloni, A. , Zeza, B. , Sanz, M. , Ortiz‐Vigon, A. , Roos‐Jansåker, A. M. , & Renvert, S. (2016). Reconstruction of peri‐implant osseous defects: A multicenter randomized trial. Journal of Dental Research, 95(1), 58–66. 10.1177/0022034515610056 [DOI] [PubMed] [Google Scholar]
- Jepsen, S. , Schwarz, F. , Cordaro, L. , Derks, J. , Hämmerle, C. H. , Heitz‐Mayfield, L. J. , Hernández‐Alfaro, F. , Meijer, H. J. , Naenni, N. , Ortiz‐Vigón, A. , & Pjetursson, B. (2019). Regeneration of alveolar ridge defects. Consensus report of group 4 of the 15th European workshop on periodontology on bone regeneration. Journal of Clinical Periodontology, 46, 277–286. 10.1111/jcpe.13121 [DOI] [PubMed] [Google Scholar]
- Nibali, L. , Koidou, V. P. , Nieri, M. , Barbato, L. , Pagliaro, U. , & Cairo, F. (2020). Regenerative surgery versus access flap for the treatment of intra‐bony periodontal defects: A systematic review and meta‐analysis. Journal of Clinical Periodontology, 47(Suppl 22), 320–351. 10.1111/jcpe.13237 [DOI] [PubMed] [Google Scholar]
- Renvert, S. , Giovannoli, J. L. , Roos‐Jansåker, A. M. , & Rinke, S. (2021). Surgical treatment of peri‐implantitis with or without a deproteinized bovine bone mineral and a native bilayer collagen membrane: A randomized clinical trial. Journal of Clinical Periodontology, 48(10), 1312–1321. 10.1111/jcpe.13513 [DOI] [PubMed] [Google Scholar]
- Renvert, S. , Roos‐Jansåker, A.‐M. , & Persson, G. R. (2018). Surgical treatment of peri‐implantitis lesions with or without the use of a bone substitute‐a randomized clinical trial. Journal of Clinical Periodontology, 45(10), 1266–1274. 10.1111/jcpe.12986 [DOI] [PubMed] [Google Scholar]
- Roccuzzo, M. , Gaudioso, L. , Lungo, M. , & Dalmasso, P. (2016). Surgical therapy of single peri‐implantitis intrabony defects, by means of deproteinized bovine bone mineral with 10% collagen. Journal of Clinical Periodontology, 43(3), 311–318. 10.1111/jcpe.12516 [DOI] [PubMed] [Google Scholar]
- Roccuzzo, M. , Pittoni, D. , Roccuzzo, A. , Charrier, L. , & Dalmasso, P. (2017). Surgical treatment of peri‐implantitis intrabony lesions by means of deproteinized bovine bone mineral with 10% collagen: 7‐year‐results. Clinical Oral Implants Research, 28(12), 1577–1583. 10.1111/clr.13028 [DOI] [PubMed] [Google Scholar]
- Sanz, M. , Herrera, D. , Kebschull, M. , Chapple, I. , Jepsen, S. , Berglundh, T. , Sculean, A. , Tonetti, M. S. , EFP Workshop Participants, & Methodological Consultants , Aass, A. M. , & Aimetti, M. (2020). Treatment of stage I‐III periodontitis‐the EFP S3 level clinical practice guideline. Journal of Clinical Periodontology, 47(Suppl 22), 4–60. 10.1111/jcpe.13290 [DOI] [PMC free article] [PubMed] [Google Scholar]
- Schulz, K. F. , Altman, D. G. , Moher, D. , & Group, C . (2010). CONSORT 2010 statement: Updated guidelines for reporting parallel group randomised trials. BMJ, 340, c332. 10.1136/bmj.c332 [DOI] [PMC free article] [PubMed] [Google Scholar]
- Schwarz, F. , John, G. , Schmucker, A. , Sahm, N. , & Becker, J. (2017). Combined surgical therapy of advanced peri‐implantitis evaluating two methods of surface decontamination: A 7‐year follow‐up observation. Journal of Clinical Periodontology, 44(3), 337–342. 10.1111/jcpe.12648 [DOI] [PubMed] [Google Scholar]
- Tapia, B. , Valles, C. , Ribeiro‐Amaral, T. , Mor, C. , Herrera, D. , Sanz, M. , & Nart, J. (2019). The adjunctive effect of a titanium brush in implant surface decontamination at peri‐implantitis surgical regenerative interventions: A randomized controlled clinical trial. Journal of Clinical Periodontology, 46(5), 586–596. 10.1111/jcpe.13095 [DOI] [PubMed] [Google Scholar]
- Tomasi, C. , Regidor, E. , Ortiz‐Vigón, A. , & Derks, J. (2019). Efficacy of reconstructive surgical therapy at peri‐implantitis‐related bone defects. A systematic review and meta‐analysis. Journal of Clinical Periodontology, 46, 340–356. 10.1111/jcpe.13070 [DOI] [PubMed] [Google Scholar]
- Wohlfahrt, J. C. , Lyngstadaas, S. P. , Rønold, H. J. , Saxegaard, E. , Ellingsen, J. E. , Karlsson, S. , & Aass, A. M. (2012). Porous titanium granules in the surgical treatment of peri‐implant osseous defects: A randomized clinical trial. International Journal of Oral & Maxillofacial Surgery, 27(2), 401–410. 10.1111/j.1600-0501.2009.01813.x [DOI] [PubMed] [Google Scholar]
Associated Data
This section collects any data citations, data availability statements, or supplementary materials included in this article.
Data Availability Statement
Data are available upon reasonable request made to the corresponding author.