

Abstract
Chronic high salt intake is one of the leading causes of hypertension. Salt activates the release of the key neurotransmitters in the hypothalamus such as vasopressin to increase blood pressure, and neuropepetide Y (NPY) has been implicated in the modulation of vasopressin levels. NPY in the hypothalamic arcuate nucleus (Arc) is best known for its control in appetite and energy homeostasis, but it is unclear whether it is also involved in the development of salt‐induced hypertension. Here, we demonstrate that wild‐type mice given 2% NaCl salt water for 8 weeks developed hypertension which was associated with marked downregulation of NPY expression in the hypothalamic Arc as demonstrated in NPY‐GFP reporter mice as well as by in situ hybridization analysis. Furthermore, salt intake activates neurons in the hypothalamic paraventricular nucleus (PVN) where mRNA expression of brain‐derived neurotrophic factor (BDNF) and vasopressin was found to be upregulated, leading to elevated serum vasopressin levels. This finding suggests an inverse correlation between the Arc NPY level and expression of vasopressin and BDNF in the PVN. Specific restoration of NPY by injecting AAV‐Cre recombinase into the Arc only of the NPY‐targeted mutant mice carrying a loxP‐flanked STOP cassette reversed effects of salt intake on vasopressin and BDNF expression, leading to a normalization of salt‐dependent blood pressure. In summary, our study uncovers an important Arc NPY‐originated neuronal circuitry that could sense and respond to peripheral electrolyte signals and thereby regulate hypertension via vasopressin and BDNF in the PVN.
Keywords: BDNF, hypertension, hypothalamic arcuate nucleus (Arc), neuropeptide Y (NPY), salt (NaCl), vasopressin
1. INTRODUCTION
Hypertension is a key contributor to major human health problems throughout the world and is associated with an increased risk of stroke, myocardial infarction, kidney failure, and mortality (Kong et al., 2016; McLaren et al., 2016). It is known that high levels of dietary salt (NaCl) intake are closely related to the prevalence of hypertension (Kim et al., 2011; Simmonds et al., 2014), and high salt intake is considered to be one of the major risk factors for the development of hypertension (He & MacGregor, 2012; F. J. He et al., 2013; Schmidlin et al., 2007). In recent years, the role of central regulation in salt‐sensitive hypertension has increasingly received attention, particularly the hypothalamus. For example, one recent study showed that chronic high salt consumption in rats excites the neurohypophysis to release more vasopressin via BDNF‐dependent pathways in the hypothalamic PVN and supraoptic nucleus (SON) of the rat, thereby blunting baroreflex‐induced reduction of blood pressure (Choe et al., 2015). This study highlights the important involvement of different hypothalamic nuclei in the regulation of salt‐induced hypertension; however, it remains elusive whether other hypothalamic regions, in particular, the hypothalamic arcuate nucleus (Arc) also participates in this critical fluid homeostasis regulation.
The Arc is located at the base of the hypothalamus with a notably semipermeable membrane that allows the neurons within the Arc to directly access peripheral nutritional signals (Loh et al., 2015). There are two populations of neurons within the Arc: neuropeptide Y (NPY)/agouti‐related peptide (AgRP)‐ergic neurons and proopiomelanocortin (POMC)/cocaine‐ and amphetamine‐regulated transcript (CART)‐ergic neurons that have opposing effects on food intake and energy homeostasis (Shi et al., 2013). NPY‐ergic neurons are orexigenic and activation of NPY neurons in the Arc under a negative energy balance (e.g., fasting) project to the PVN and promote the feeding via the Y1 receptors in the PVN (Loh et al., 2015). NPY is widely distributed in the central nervous system with the highest concentration found in the Arc (Lin et al., 2004). Overexpression of Arc NPY leads to obesity and a reduction in energy expenditure in mice (Nguyen et al., 2012; Shi et al., 2013; Vähätalo et al., 2015). In addition to feeding, NPY is also indicated in other important functions including the regulation of bone mass, stress responses, neuroendocrine secretion (Ip et al., 2019; Shi et al., 2010; Tatemoto et al., 1982), and blood pressure (Zhu, Sun, Zhang, Song, & Lin, 2016). Injection of NPY into the PVN or lateral ventricle decreases the activity of peripheral sympathetic nerves, heart rate, and blood pressure in rats (Morris et al., 2004) via an action mediated by vasopressin (Larsen et al., 1993; Urban et al., 2006). These data indicate a potential hypotensive effect of central NPY signaling. However, it is unclear as to whether NPY in the Arc, which has direct access to peripheral nutritional signals, is involved in this process, and if so, what the underlying mechanisms are.
In this study, we demonstrate that salt intake induces hypertension and blunts expression of NPY in the hypothalamic Arc of WT mice. The suppression of NPY expression occurs in concert with the upregulation of mRNA expression of vasopressin and BDNF in the hypothalamic PVN, leading to elevated serum vasopressin levels. Moreover, replenishment of Arc only‐NPY in NPY‐targeted mutant mice attenuated salt‐dependent hypertension via downregulation of vasopressin and BDNF expression in the PVN. Thus, our study provides the first demonstration that chronic salt intake decreases NPY expression in the hypothalamic Arc, leading to vasopressin‐dependent hypertension presumably via hypothalamic BDNF pathways, and emphasizes a novel and previously unexplored contribution of Arc NPY in the control of blood pressure independent of its traditional orexigenic effects.
2. MATERIALS AND METHODS
2.1. Animals
All experimental procedures were carried out in accordance with international ethical guidelines and the National Institutes of Health Guide for the Care and Use of Laboratory Animals and approved by The Third Military Medical University Animal Care and Use Committee. Male C57BL/6J mice were purchased from the Animal Center of The Third Military Medical University (Chongqing, China). The transgenic NPY‐GFP reporter mice expressing Green Fluorescent Protein (GFP) under the control of the NPY promoter, were obtained from Jackson Laboratories (NPY‐hrGFP mice, stock no. 00617, referred to as NPY‐GFP mice hereafter, ME, USA), which have been characterized previously (van den Pol et al., 2009). All the mice were housed under a condition of controlled temperature (23 ± 2°C) and light (12 h:12 h light/dark cycle), and fed a standard chow diet with ad libitum access to water.
2.2. Body weight and water intake measurements
Forty 8‐week‐old C57BL/6J and eight 8‐week‐old NPY‐GFP mice were administrated with either normal drinking water (NW) with <0.1% NaCl, or salt drinking water (SW) with 2% NaCl solution for 8 weeks. Body weight and water intake were measured weekly from 8 weeks of age onward. Urine production was measured. Body weight was always measured at the same time of the day to ensure consistency. Actual water intake was calculated as the water volume given minus the water volume that remained after 24 h.
2.3. Generation of NPY stop cassette knock‐in mice
The loxP‐stop‐loxP‐NPY knock‐in mouse line (NPY stop cassette knock‐in line, referred to as NPYLSL/LSL), in which a targeted allele of the stop cassette was cloned to upstream NPY coding sequences in all tissues, was obtained from Cyagen Biosciences Inc. In basal conditions, the presence of the stop codon blocks NPY expression in transgenic mice. However, the injection of adeno‐associated virus (AAV)‐Cre recombinase (AAV‐Cre) into specific tissues or regions can excise the loxP‐flanked stop cassette and restore the expression of NPY. Therefore, AAV‐Cre‐injected mice can conditionally activate the expression of NPY, whereas the vehicle‐injected mice, injected with vehicle solution carrying empty construct cannot modulate the expression of NPY.
2.4. Stereotaxic virus injection
Twenty NPYLSL/LSL mice were injected with either AAV‐Cre or AAV‐vehicle (n = 10 per group). After recovery from the surgery, each group of mice was divided into two groups. One group was given normal drinking water, and the other group was given 2% salt water for 8 weeks.
The NPYLSL/LSL mice were anesthetized with pentobarbital (80 mg/kg, IP) and placed in a temperature‐controlled stereotaxic holder. A small hole was made in the skull. To selectively re‐express NPY in the Arc, a total volume of 0.8 µl (0.4 µl each side) of AAV2‐CAG‐EGFP‐T2A‐Cre (OBiO Technology) was injected bilaterally into the Arc (coordinates relative to bregma were anteroposterior (AP)/dorsoventral (DV)/mediolateral (ML): –1.2/–5.8/ ± 0.2 mm, (Franklin & Paxinos, 2017)) at a rate of 0.1 µl/min using a 1‐µl Hamilton Syringe and syringe infusion pump (KDS 310 Plus, Kd Scientific). The needle was left in place for 10 min to allow sufficient diffusion. Animals were kept on a heating pad during surgery until the recovery period. Mice were housed individually and subsequently monitored for 2 weeks before any studies were performed.
2.5. Blood pressure measurement
The arterial pressure of the mice was measured weekly using the noninvasive Volume Pressure Recording System (CODA, Kent Scientific Corporation). To minimize the effects of stress, animals were trained using the tail‐cuff method for at least 7 days before the first measurement. Blood pressure was measured by the same person at the same time of the day until the euthanization of the mouse. A conscious mouse was held in an individual plastic container, and a cuff with a pneumatic pulse sensor was wrapped around its tail. After warming animals on a heating plate for 10 min at 35°C, the measurements of arterial systolic blood pressure (SBP) and diastolic blood pressure (DBP) were performed for at least 20 consecutive cycles for each animal, and the mean values of several accurate measurements were used for the analysis of systolic and DBP.
2.6. Determination of serum electrolytes
The concentration of serum Na+, Cl−, and K+ was determined at the Department of Clinical Chemistry at Southwest Hospital of the Third Military Medical University.
2.7. Determination of blood copeptin (CPP) by ELISA analysis
Venous blood was collected by cardiac puncture after euthanizing the animal. For serum collection, blood was maintained at room temperature for three hours in untreated collection tubes and then centrifuged for 15 min at 2000 rpm at 4°C. Serum samples were separated from the top phase and stored at −80°C. The circulating level of CPP was measured using a commercially available ELISA kit (USCN Life Science & Technology Company) according to the manufacturer's instructions. Briefly, standards or samples were dispensed into 96‐well plates coated with the CPP antibody and incubated. After extensive washing, horseradish peroxidase‐conjugated streptavidin was pipetted into the wells and incubated. When tetramethylbenzidine was added, the color developed in proportion to the concentration of measured protein. After 10 min, stop solution was added to stop the reaction, and color development was terminated. The optical density (OD) was measured at 450 nm using an ELISA plate reader (Spectramax 190, Molecular Devices Corporation). A set of standards was used to plot a standard curve.
2.8. Immunohistochemistry
For c‐fos detection in the brain 24 h after the start of treatment conditions, the animals were perfused with phosphate‐buffered solution (PBS) at a pH of 7.4 by a cannula inserted in the left ventricle after anesthesia, followed by 4% paraformaldehyde. After perfusion, the brains were immediately removed, kept in 4% paraformaldehyde, immersed in 30% sucrose, and then stored at −80°C until use. Immunohistochemistry (IHC) staining was performed on cryostat sections. Adjacent serial 30‐µm thick coronal brain sections were obtained with cryostat (Leica, CM 3000). The IHC staining was performed according to standard ABC protocol with rabbit polyclonal primary antibodies (anti‐c‐fos, 1:1,000, Cell Signaling Technology) and the signals were detected with a commercial ABC kit (ZsBio, Ltd.). The slides were photographed using an Olympus Imaging System (Olympus Corporation). The number of c‐fos‐positive cells was quantified using ImageJ software (NIH). To maintain consistency in the analysis of cell counts among groups, sections of hypothalamic PVN regions from the salt‐treated and control animals were matched based on the mouse brain atlas (Franklin & Paxinos, 2017).
2.9. NPY‐GFP positive cell counting
To assess the number of GFP positive cells in the Arc, NPY‐GFP mice were fed with NW or SW for 8 weeks and were then perfused after treatment with 4% formaldehyde in PBS. The perfused brains were cut at 35 µm covering the hypothalamic Arc relative to Bregma anteroposterior, −1.46 mm to −1.94 mm (Franklin & Paxinos, 2017). Every third section was used for counting NPY‐GFP positive neurons. Free‐floating sections were mounted on Superfrost slides (Menzel‐Glaser), cover slipped with fluorescence mounting medium (Dako), and photographed using DM 5500 fluorescent microscope (Leica). Fifteen sections from each brain corresponding to rostral‐, medial‐, and caudal‐ regions, were counted unilaterally from three different mice under a blinded condition. Two‐tailed t tests were used. Statistical significance was defined as p < 0.05.
2.10. RNA extraction and qPCR analysis
At the end of each experiment, a microdissection procedure was used to isolate PVN and Arc areas as previously described (Kang et al., 2011). For mRNA expression analysis, total RNA was extracted from brain tissue using Trizol reagent (Aidlab) and cDNA was synthesized using a TRUEscript First Strand cDNA Synthesis Kit (Aidlab). The quality and quantity of mRNA were assessed by spectrophotometer (Nanodrop 2000C, Thermo). The samples were stored at −80℃. qPCR was carried out with SYBR Green qPCR Mix (Aidlab) following the manufacturer's protocol. Twenty microliters of PCR mix containing 10 μl of SYBR Green mix, 0.8 μl of forward and reverse primers, 8.2 μl of nuclease‐free water, and 1 μl of cDNA obtained from the reverse transcription. Primers were designed by Primer Blast (NCBI) and synthesized by Sangon Biotech. The sequences of each primer are listed in Table 1. After PCR, a dissociation curve was added to confirm that no secondary products were formed. Standard curves were also performed to check the amplification efficiency. Relative quantification of mRNA was conducted using the 2‐∆∆Ct method and normalized respectively to the expression of β‐actin. Every sample was performed in triplicate.
Table 1.
Primer sequences for gene expression analyzed by qPCR
| Target Gene | Forward primer sequence | Reverse primer sequence |
|---|---|---|
| NPY | CCTCGCTCTATCTCTGCTCGT | ATCTGGCCATGTCCTCTGCT |
| BDNF | ACTCTGGAGAGCGTGAATGG | CGAACCTTCTGGTCCTCATC |
| Vasopressin | CGCCAGGATGCTCAACACTA | CTGTCTCAGCTCCATGTCAGAGA |
| KCC2 | TCTGGACAACCATCCACAGG | GACACACCATCACGCAGGTT |
2.11. In situ hybridization (ISH) by RNAscope technology
The brain samples were prepared as described above in IHC. The fixed frozen tissues were cryosectioned at 8 µm and stored at −80°C. Commercially available RNAscope brown reagent kit and RNAscope probes (Advanced Cell Diagnostics) were used for transcript detection. ISH was performed according to the manufacturer's instructions for fixed‐frozen tissue. The detection was operated in a hybridization oven (HybEZ, ACD) with RNAscope Probe‐mm‐NPY (ACD 313321), RNAscope Probe‐mm‐AgRP (ACD 400711), and RNAscope Probe‐mm‐vasopressin (ACD 401391). Ppib probe (ACD 313911), a mouse housekeeping gene, was used as the positive control probe, and bacterial dapB probe (ACD 310043) was used as the negative control probe. Each set of probes contained a tag that enabled target transcription to be visualized in a brown color. To compare the expression differences between the two groups, we quantified the integral optical density of positive NPY or vasopressin staining using ImageJ and normalized it by stained area. The mean intensities from three random areas of the same size in target areas were measured for each probe.
2.12. Tissue collection
Upon the completion of the experiments, animals were anesthetized by IP administration of pentobarbital and then euthanized to collect blood and brain tissue for enzyme‐linked immunosorbent assay (ELISA), quantitative polymerase chain reaction (qPCR), in situ hybridization (ISH), immunohistochemical (IHC), and molecular studies. The collected tissues were snap‐frozen and stored at −80°C until assayed.
2.13. Statistical analyses
The data were expressed as mean ± SEM. Statistical analyses were performed using GraphPad Prism software. The significance of the differences between the two groups was analyzed by Student's t test. To compare multiple time points, repeated measures ANOVA was used. Multiple comparisons were analyzed with a one‐way analysis of variance (ANOVA). A value of p < 0.05 was considered significant.
3. RESULTS
3.1. High salt water intake induced hypertension in WT mice
To generate salt water‐induced hypertensive mouse models, age‐matched WT mice were administrated either normal drinking water (NW) or 2% NaCl salt water (SW) for eight weeks (Devarajan et al., 2015; Henderson & Byron, 2007; Jaitovich & Bertorello, 2010). As expected, serum Na+ level in SW‐treated mice was significantly elevated at the end of the experimental period (p < 0.001, Figure 1a). Cl− level was unaltered by NaCl consumption (Figure 1b). On the other hand, serum K+ concentration was markedly lower in SW‐treated mice compared to control mice (Figure 1c). Consistent with elevated Na+ levels in the blood, water consumption in SW‐treated mice was significantly increased from the 2nd week onward throughout the rest of the experimental period compared to the water consumption of the control mice (p < 0.001, Figure 1d). Urine output measured at Week 4 was also concomitantly increased (Figure 1e), suggesting the increased sense of thirst was due to drinking SW. Despite increased water consumption, there was no difference with regard to body weight (Figure 1f ) and food intake measured at Weeks 1 and 4 (Figure 1g) between SW and NW mice over the entire experimental period. In line with increased blood Na+ concentration and water consumption in SW mice, from the third to the eighth week except for the fourth week, the systolic blood pressure (SBP) of SW‐treated mice was significantly increased, compared to the SBPs of NW‐treated mice in the same time period, and reached an average blood pressure of 143 ± 4 mmHg at the seventh and eighth week (Figure 1h). In contrast, NW mice displayed a stable SBP with an average of 127 ± 4 mmHg over the 8‐week period. Similarly, the DBP in the SW‐treated group was also markedly increased from the sixth week onwards over the same period of time (Figure 1i). Heart rate was measured and there was no difference between the two treatment groups (Figure S1). Together, these data demonstrate that high salt water intake induces hypertension.
Figure 1.
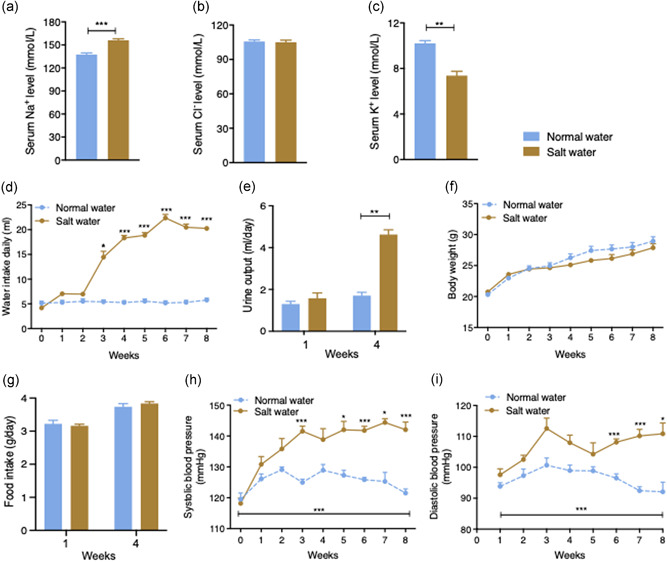
Salt water‐induced hypertension in C57BL/6 wild‐type (WT) mice. (a) Serum Na+ was significantly increased in salt water‐treated mice relative to normal water‐given mice at the end of the experiment. (b) Serum Cl‐ did not differ between the two groups at the end of the experiment. (c) Serum K+ was decreased in salt water‐treated mice. (d) Salt water‐treated mice showed a marked increase in water consumption compared to control mice which was significant after 3 weeks and every week from the 4th week to the end of the study (n = 5). (e) Daily urine output measured after 1 and 4 weeks. (f) There was no significant difference in body weight between the two groups at any point over the experimental period. (g) Daily food intake measured at the 1st week and the 4th week. (h) Weekly systolic blood pressure profile and (i) diastolic blood pressure of normal water‐ and salt water‐treated mice. The salt water‐treated mice had significantly higher systolic blood pressure after 3 weeks of stimulation through to the end of the experimental period. Values are expressed as means ± SEM (n = 5). (*p < 0.05, **p < 0.01, ***p < 0.001, salt water vs. normal water)
3.2. Salt intake suppressed the expression and activity of hypothalamic Arc NPY neurons
The central nervous system, particularly the hypothalamus, has been reported to be important in regulating blood pressure, especially playing a role in high salt overloading‐induced hypertension (de Wardener, 2001). However, molecular mechanisms and central circuitry underlying salt‐induced hypertension remain to be fully understood. The Arc is located at the base of the hypothalamus and has direct access to peripheral signals. It responds to changes in nutrient or electrolyte concentration, including NaCl level (Shi et al., 2010), and projects to second‐order neurons, particularly in the hypothalamic PVN, to control fluid and energy balance (Lizarbe et al., 2013; Loh et al., 2015). Since NPY neurons are one of the most abundant neurons in the Arc where they play a crucial role in energy homeostatic regulation (Loh et al., 2015), we tested whether NPY neurons in the Arc could also respond to a rise in circulating NaCl levels and whether they could potentially take part in the regulation of fluid homeostasis. We initially employed NPY‐GFP reporter mice, where GFP expression is under control of the npy promoter (van den Pol et al., 2009), and exposed them to the same experimental regimen as used in the WT mice for eight weeks. Well‐characterized NPY‐GFP reporter mice are not phenotypically different from wild‐type mice (van den Pol et al., 2009) and have been widely used to visualize the location of NPY expression in the brain (Farzi et al., 2018; Han et al., 2021; Ip et al., 2019). Brains from these SW‐ and NW‐administered NPY‐GFP mice were processed and sectioned, and NPY levels were determined by counting the number of GFP‐positive neurons in the Arc. In SW‐treated NPY‐GFP mice, lower numbers of GFP positive neurons were observed in the hypothalamic Arc compared to NW‐treated NPY‐GFP mice (p < 0.001, Figure 2a,b), suggesting a lower npy promoter activity in the salt‐treated mice. It is likely that high circulating Na+ levels could contribute to the lowered npy expression in the hypothalamic Arc.
Figure 2.
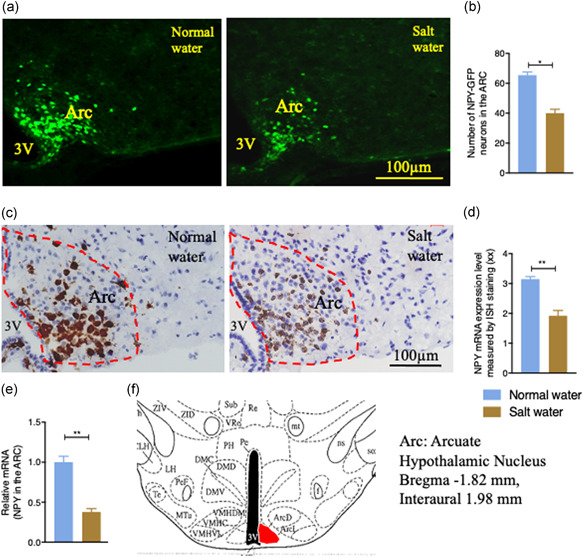
The effects of salt water drinking on NPY expression in the hypothalamic Arcuate nucleus (Arc) in the brain of WT mice. The number of positive NPY‐GFP neurons in the Arc of NPY‐GFP mice administered with normal water or 2% salt water was observed by representative images (a) and quantification (b). (a) Salt loading decreased the expression of Arc green fluorescent protein (GFP). (b) The number of NPY‐GFP neurons in the Arc of salt water‐treated mice was lower compared to normal water‐treated mice (n = 4). (c) Representative images of in situ hybridization (ISH) using RNAscope technology showing that salt water drinking decreased mRNA expression of NPY in the Arc. (d) The integral optical density (IOD) value of NPY ISH staining in salt water‐treated mice was significantly lower compared to normal water‐treated mice. (e) qPCR results of dissected Arc tissues showing that salt water drinking decreased the expression of NPY in the Arc of WT mice. (f) Schematic diagram of the arcuate nucleus (Arc) in the hypothalamus. Values are expressed as means ± SEM (n = 4). (*p < 0.05, **p < 0.01, salt water vs. normal water). 3V, third ventricle
To further determine whether Arc NPY expression is actually altered by high peripheral NaCl levels, we employed the RNAscope ISH technology in brain sections collected from SW‐ and NW‐treated WT mice after eight weeks of treatment. Consistent with the results in NPY‐GFP mice, we found that high salt loading significantly decreased the NPY mRNA expression in the Arc of SW‐treated mice compared to that in the Arc of NW‐treated mice (p = 0.001, Figure 2c,d). Furthermore, to quantitatively demonstrate that NPY mRNA expression was influenced by salt treatment, we dissected the hypothalamic Arc under a dissection microscope, extracted RNA, and performed real‐time quantitative reverse transcriptase PCR. We found that the NPY mRNA expression was substantially lower in the Arc of SW mice compared to that in control mice (p = 0.002, Figure 2e,f), confirming that salt intake suppresses NPY mRNA expression in the Arc. Together, these data suggest that NPY neurons in the Arc can sense and respond to changes in peripheral Na+ levels, and that NPY neurons in the Arc could be a direct target of elevated peripheral osmolarity and NaCl levels.
3.3. Enhanced c‐fos immunoreactivity in the hypothalamic PVN
Having demonstrated a link between peripheral elevation of NaCl levels and Arc NPY, we next attempted to identify the critical brain regions and the downstream targets of Arc NPY signaling to characterize the neuronal pathways and circuits initiated by Arc NPY signaling. To capture the early responses to high salt treatment and avoid the potential secondary effects associated with prolonged salt treatment, we investigated the expression of early neuronal activation marker c‐fos (Dragunow & Faull, 1989) in different brain regions of the hypothalamus at 24 h after salt intake by immunohistochemistry. Increases in c‐fos immunoreactivity were seen in the hypothalamic PVN of salt water‐treated mice compared to the levels in the control group (Figure 3a). The quantification of c‐fos‐positive neurons in the PVN in both NW‐ and SW‐treated mice is shown in Figure 3b and the location examined is shown in Figure 3c, where the number of c‐fos‐like immunoreactive neurons in the PVN of SW‐treated mice was nearly three times more than that in control mice. This data indicates that the neurons in the hypothalamic PVN are activated by salt intake.
Figure 3.
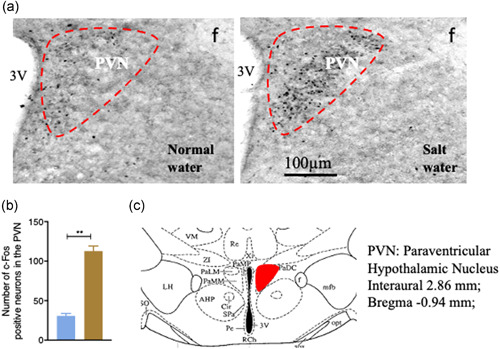
c‐fos expression in the PVN of WT mice detected by immunohistochemical analysis. (a) The number of c‐fos immunopositive neurons in salt water‐treated mice was higher than in normal water‐treated mice. (b) Salt water drinking increased c‐fos expression in the paraventricular nucleus (PVN.) (c) Schematic diagram of the PVN in the hypothalamus (red boxed area adapted from Franklin 2017. 3V, third ventricle. Values are expressed as means ± SEM (n = 4). (**p < 0.01, salt water vs. normal water)
3.4. Salt intake increased circulating vasopressin levels and vasopressin mRNA expression in the hypothalamic PVN
Vasopressin, also called arginine vasopressin or antidiuretic hormone (ADH), is a hormone that is produced in the hypothalamus of the brain and is stored in the neurohypophysis of the pituitary gland (Boone & Deen, 2008). It is released in response to increased blood osmolarity, including an increased Na+ level (Choe et al., 2015; Prager‐Khoutorsky et al., 2017). We, therefore, determined vasopressin concentration in the serum. However, due to its short circulatory half‐life, it is inaccessible for clinical routine determination at an accurate level. We used serum copeptin (CPP), a 39‐amino acid glycosylated peptide which is part of the original C‐terminal of arginine vasopressin, as a surrogate in determining vasopressin level due to its in vivo stability and readiness to be detected (Masajtis‐Zagajewska et al., 2015). As shown in Figure 4a, circulating CPP levels were significantly increased in SW mice (p < 0.0001), supporting the notion that high salt intake increases circulating vasopressin levels. Since vasopressin is primarily produced in the hypothalamic PVN, we collected and processed this brain section from SW‐ and NW‐treated mice and performed in‐situ hybridization for vasopressin using the RNAscope assays to assess the changes of vasopressin mRNA expression. Consistent with an elevated blood CPP level, the vasopressin mRNA in the PVN was markedly upregulated in SW mice (p < 0.001, Figure 4b) and quantification is shown in Figure 4c. To further validate the mRNA result identified from RNAscope, the PVN was dissected out under dissection microscope for quantitative RT‐PCR. The overall vasopressin mRNA expression in the PVN was higher in SW‐treated mice than in NW‐treated mice (Figure 4d), indicating that high salt intake stimulates vasopressin expression in the hypothalamic PVN, leading to an elevated vasopressin level in the blood.
Figure 4.
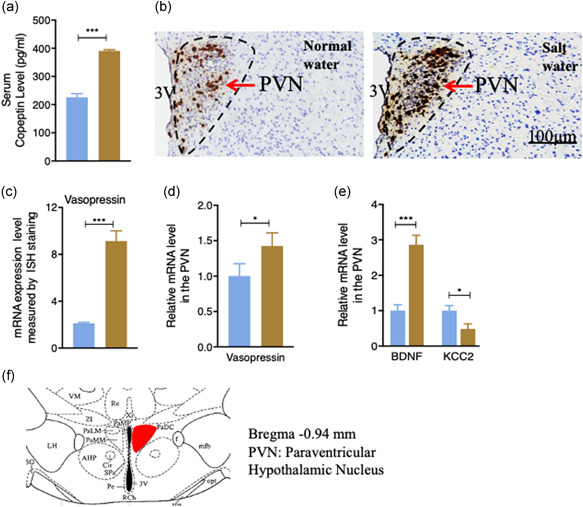
The effects of high salt intake on the level of circulating vasopressin and on vasopressin mRNA expression in the PVN. (a) Serum copeptin (CPP) was measured at the end of the experiment. High salt intake increased the circulating CPP level (n = 4). (b) The paraventricular nucleus (PVN) vasopressin mRNA expression level measured by in situ hybridization (ISH) using RNAscope technology. (c) Integral optical density (IOD) value comparison of amount of vasopressin observed in ISH. Salt water‐treated mice had a greater value of vasopressin mRNA observed. (d) Quantification of vasopressin mRNA level using qPCR. Salt water‐treated mice had a higher vasopressin mRNA expression level. (e) Salt intake increased the qPCR measured mRNA expression level of brain‐derived neurotrophic factor (BDNF) and decreased the mRNA level of K+/Cl‐ co‐transporter 2 (KCC2) in the PVN. (f) Schematic diagram of the PVN in the hypothalamus (red boxed area adapted from Franklin 2017). Values are expressed as means ± SEM (n = 4) (*p < 0.05, ***p < 0.001, salt water vs. normal water). 3V, third ventricle
3.5. Salt treatment altered BDNF and KCC2 mRNA expression in the PVN
Having confirmed the activation of key brain regions in the hypothalamic PVN by c‐fos, we wanted to further identify which proteins in the PVN were altered by salt intake. To achieve this, we used a candidate gene approach. Previous work has shown that brain‐derived neurotrophic factor (BDNF) neurons in the PVN are involved in high salt‐induced hypertension (Choe et al., 2015). Therefore, we assessed whether the expression of BDNF had been altered by high salt treatment. We dissected the hypothalamic PVN of SW‐ and NW‐treated WT mice post eight weeks treatment, extracted RNA, and performed qPCR to examine BDNF mRNA expression. As shown in Figure 4e, there were significant increases in BDNF mRNA expression in SW mice compared with NW mice (p‐value of BDNF < 0.001). In agreement with upregulated BDNF mRNA expression, the mRNA expression of K +/Cl ‐ co‐transporter 2 (KCC2), a molecule which is regulated by BDNF and principally maintains low levels of intracellular Cl−, was suppressed (p = 0.002, Figure 4e). The dissected region for immunohistochemical and mRNA analysis is shown in Figure 4f. Together with the upregulation of vasopressin mRNA (Figure 4b,d), these results support the critical involvement of vasopressin, BDNF, and KCC2 in salt intake‐induced hypertension.
3.6. Re‐expression of NPY in the Arc attenuated salt‐induced hypertension
To further determine the possible involvement of Arc NPY in the pathogenesis of salt‐induced hypertension, and examine the consequences of altered Arc NPY signaling more precisely, we generated an Arc‐specific NPY re‐expression mouse model employing NPYLSL/LSL mice and an AAV‐Cre vector. NPYLSL/LSL mice have a loxP‐flanked STOP cassette inserted before the NPY gene that prevents NPY from being expressed (Figure 5a). NPYLSL/LSL mice were bilaterally injected with AAV‐Cre vector into the Arc to remove the STOP cassette in front of the NPY gene, resulting in the expression of the NPY gene specifically in the Arc (Figure 5c). The AAV‐empty vector (AAV‐Empty) was also injected into the Arc of NPYLSL/LSL mice to be used as controls. Firstly, RNAscope in situ hybridization analysis was used to determine NPY mRNA expression in NPYLSL/LSL mice and WT control mice. As expected, mRNA expression of NPY in the hypothalamic Arc, cortex, and hippocampus was absent in NPYLSL/LSL mice compared to the control mice where there is intact NPY expression in these brain regions (brown staining, Figure 5b), confirming the successful generation of NPYLSL/LSL (NPY‐deficient) models. More importantly, the weekly body weight (Figure S2A), average daily water consumption (Figure S2B), and average daily food intake (Figure S2C) in the NPYLSL/LSL mice were not different from those in the WT mice described above.
Figure 5.
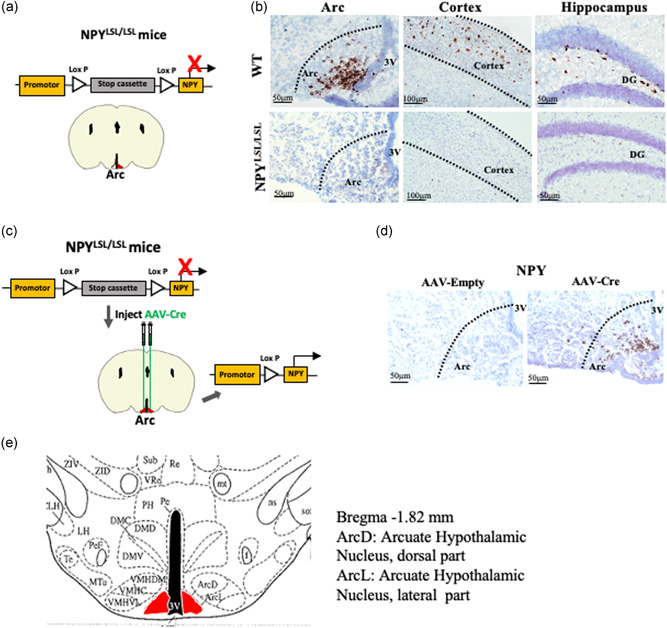
mRNA expression of Arc NPY in NPY targeted mutant NPYLSL/LSLmice. (a) Schematic diagram of a targeted allele of stop cassette was cloned to the upstream of NPY coding sequence in NPYLSL/LSL mice. Using Cre‐recombinase (Cre) can excise the stop cassette and restore NPY expression at a specific position. (b) The mRNA expression of NPY in the Arc of NPYLSL/LSL mice determined by RNAscope in situ hybridization analysis was absent compared to the control mice, n = 3. (c) Schematic drawing of procedure to induce NPY expression in the Arc in NPYLSL/LSL mice. For selective re‐expression of NPY in arcuate nucleus (Arc) neurons, AAV‐Cre was bilaterally injected into the Arc of NPYLSL/LSL mice. (d) The NPY mRNA level in AAV‐Cre‐injected NPYLSL/LSL mice determined by RNAscope in situ hybridization analysis was present in the hypothalamic Arc compared to the AAV‐Empty‐injected NPYLSL/LSL mice, n = 3. (e) Schematic diagram of the arcuate hypothalamic nucleus dorsal part (ArcD) and arcuate hypothalamic nucleus lateral part (ArcL) adapted from Franklin (2017)
After AAV‐Cre was introduced into the Arc, 2 weeks postinjection, brains from NPYLSL/LSL mice were collected to assess the mRNA expression of NPY using RNAscope in situ hybridization analysis. A significantly higher NPY mRNA expression was observed in the hypothalamus of AAV‐Cre injected NPYLSL/LSL mice compared to AAV‐Empty‐injected mice (Figure 5d). This result has confirmed the successful reintroduction of NPY specifically into the Arc.
For functional evaluation, NPYLSL/LSL mice injected with the AAV‐Cre vector or AAV‐Empty vector were allowed to recover from surgery for 10 days before being given either SW or NW for 8 weeks. Compared to normal‐water‐treated AAV‐Cre‐injected NPYLSL/LSL mice, mice treated with salt water for 24 h displayed a significant reduction in Arc NPY mRNA expression (Figure 6a), but no alteration in AgRP mRNA expression in the Arc. The SBP of AAV‐Empty‐injected and AAV‐Cre‐injected NPYLSL/LSL mice given either NW or SW were similar in the first week of treatments (Figure 6b). However, the SBP of AAV‐Empty‐injected NPYLSL/LSL SW mice was significantly increased compared to that in AAV‐Empty‐injected NW NPYLSL/LSL mice at the end of the experimental period (p < 0.001, Figure 6c), indicating the successful induction of hypertension by the eighth week of salt intake in NPYLSL/LSL mice. Importantly, in the presence of NPY specific to the Arc in otherwise NPY‐deficient mice, such as in the AAV‐Cre‐injected NPYLSL/LSL mice, the SBP of SW mice was dramatically blunted to a level similar to that of the AAV‐Empty‐injected NPYLSL/LSL mice with NW intake (Figure 6c). On the other hand, the SBP in NW‐given AAV‐Cre injected mice was not different from that in NW‐given AAV‐Empty injected mice (Figure 6b). These data reveal that the replenishment of NPY in the Arc could alleviate, at least partially, salt water‐induced hypertension. We also determined the mRNA levels of BDNF and vasopressin expression in the hypothalamic PVN of the four groups. We found that the mRNA expressions of both BDNF and vasopressin in SW groups were higher in comparison to the corresponding NW groups (Figure 6d,e). In addition, when AAV‐Cre was injected into the Arc under SW condition, we found that the mRNA levels of BDNF and vasopressin in PVN were significantly decreased (Figure 6d,e).
Figure 6.
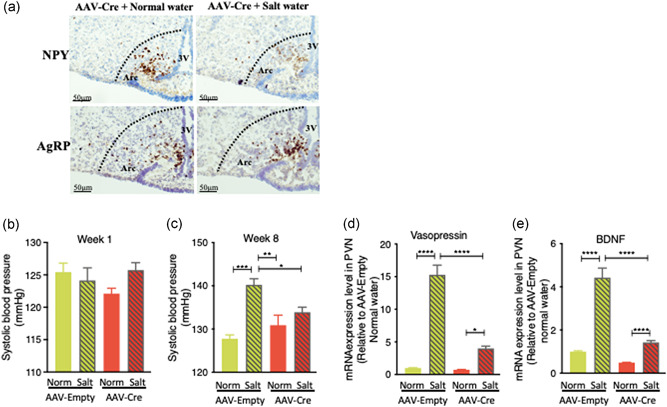
Effects of Arc NPY on the control of salt water drinking‐induced hypertension in NPYLSL/LSLmice. (a) The mRNA levels of NPY and AgRP in AAV‐Cre‐injected NPYLSL/LSL mice administered with normal water or salt water were determined by RNAscope in situ hybridization analysis, n = 3. (b) Systolic blood pressure (SBP) of Empty‐injected and Cre‐injected NPYLSL/LSL mice in response to normal water or 2% salt water administration. SBPs of the four groups were similar in the first week. (c) AAV‐Empty‐treated mice on salt water showed a higher blood pressure compared to the other three groups, while AAV‐Cre‐induced restoration of Arc NPY significantly attenuated salt water‐induced hypertension at the eighth week of the experiment. (d) qPCR results showed that the restoration of Arc NPY in AAV‐Cre‐injected mice blunted salt water drinking‐induced vasopressin mRNA expression in the hypothalamic paraventricular nucleus (PVN) compared to AAV‐Empty‐injected mice. (e) qPCR results showed that the restoration of Arc NPY in AAV‐Cre‐injected mice blunted salt water‐induced mRNA expression of brain‐derived neurotrophic factor (BDNF) in the hypothalamic paraventricular nucleus (PVN) compared to AAV‐Empty‐injected mice. Values are expressed as means ± SEM (n = 4–5). *p < 0.05, **p < 0.01, ***p < 0.001, ****p < 0.0001 relative to AAV‐Empty normal water or comparisons indicated
4. DISCUSSION
In this study, we demonstrated for the first time a critical involvement of hypothalamic Arc NPY in the regulation of fluid homeostasis and salt water‐induced hypertension. In the salt water‐induced hypertensive mouse model, Arc NPY mRNA expression was significantly reduced as evidenced by in situ hybridization and qPCR analysis as well as in NPY‐GFP reporter mice. By using c‐fos, a marker of neuronal activity response to external stimuli, we identified brain regions in the PVN that were activated by high Na+ treatment, where we found that vasopressin and BDNF mRNA were also upregulated. Importantly, by using unique NPYLSL/LSL mice where NPY expression is prevented by a loxP‐flanked STOP cassette, we demonstrated that specific reintroduction of NPY using AAV‐Cre into the Arc only in these NPY deficient mice reversed salt‐induced upregulation of vasopressin and BDNF mRNA expression, thereby blunting the increases in blood pressure in salt‐treated mice. This study has uncovered a crucial role of traditionally known orexigenic Arc‐NPY in the control of a NaCl‐triggered neuronal pathway.
It is well established that under the normal condition, elevated NPY in the hypothalamic Arc by a negative energy balance (e.g., fasting) stimulates feeding and inhibits energy expenditure to maintain energy homeostasis (Loh et al., 2015; Nguyen et al., 2012). This study unravels an important and previously uncharacterized role of Arc NPY in salt‐induced hypertension in addition to its effects on feeding behavior and energy balance. We found that peripheral rising NaCl levels markedly reduced Arc NPY expression, which triggered the changes in expression of several neurotransmitters in the PVN, thereby leading to hypertension. Vasopressin is critical for the regulation of blood osmolarity and blood volume (Choe et al., 2015; Prager‐Khoutorsky et al., 2017), and high plasma Na+ can induce hypothalamic magnocellular neurons to release vasopressin, consequently promoting vasoconstriction and water retention (Bourque, 2008; Danziger & Zeidel, 2015; Henderson & Byron, 2007). We found that salt intake suppresses the Arc NPY expression leading to augmentation of vasopressin in the PVN, and this is consistent with a previous report. The crucial role of Arc NPY in this mediation is further confirmed by employing a novel NPYLSL/LSL mouse model where NPY expression is reintroduced only in the Arc of otherwise NPY‐deficient mice. Salt‐induced elevation of vasopressin mRNA levels was dampened after the restoration of NPY only in the Arc, resulting in an alleviation of high blood pressure induced by salt water intake. This result demonstrates a strong association between Arc NPY and high‐salt induced hypertension, and corroborates previous studies which show that Arc NPY exerts a hypotensive effect in the central nervous system (Michalkiewicz et al., 2005; Morris et al., 2004). Further studies to overexpress NPY in the Arc AgRP neurons to increase NPY in the salt condition would reveal the direct causal relationship between peripheral NaCl level, Arc NPY activation, and salt‐induced hypertension. It is worth noting that Arc AgRP mRNA level was similar in salt water group compared to controls, indicating that Arc AgRP neurons do not seem to be as responsive to salt treatment as NPY neurons in the Arc. This finding is in agreement with previous reports showing that Arc NPY/AgRP neurons may control different physiological functions (Graebner et al., 2015; Lee et al., 2020). We also observed that SBP in WT mice was similar to that in AAV‐empty NPYLSL/LSL mice. While the exact mechanism underlying this phenomenon is unclear, we speculate that similar to germline NPY knockout mice that display normal metabolic phenotypes (Erickson et al., 1996), inactivated NPY in NPYLSL/LSL mice may lead to developmental compensation due to the functional redundancy of homeostatic control. More studies will be warranted to determine the alteration of other neurotransmitters (e.g., POMC/CART or GABA) secondary to the lack of NPY in the hypothalamus and other brain regions which are known to be important in the regulation of blood pressure. In addition, we have demonstrated that the hypothalamic PVN, the endocrine integration center that receives Arc NPY projections and is critical in relaying peripheral nutritional signals to maintain energy balance, also responds to changes in extracellular osmolality, thereby regulating fluid balance (Chu et al., 2010; Loh et al., 2015).
In this study, we also identified BDNF and KCC2, the two critical neurotransmitters in the PVN, could be potential mediators of the relationship between Arc NPY and PVN vasopressin secretion. Our study revealed that after 8 weeks of salt loading, commitant to a decrease in Arc NPY, the level of BDNF in the PVN was increased, while the expression of KCC2, a protein that maintains the Cl− gradient was reduced. This is in line with an early study showing that the BDNF and KCC2 in the PVN play a key role in the development of high salt‐induced hypertension, and BDNF inhibits KCC expression via its endogenous TrB receptor (Choe et al., 2015). More importantly, the expression of BDNF and KCC2 in the PVN was completely reversed by restoration of NPY in the Arc only, leading to the reversal of vasopressin expression in the PVN and alleviation of salt‐induced hypertension. This result highlights the fact that Arc NPY controls vasopressin expression in the PVN, presumably via the BDNF‐KCC2 neuronal pathway in the regulation of fluid balance. It is worth noting that the inverse relationship between Arc NPY and BDNF in the PVN has also been reported in the control of energy homeostasis. For example, exogenous NPY can reduce the concentration of BDNF in the hypothalamus (Gelfo et al., 2012), while administration of BDNF into the hypothalamic PVN blunts NPY expression in the Arc in response to a fasting state and decreased NPY‐induced feeding (Wang et al., 2007). Our data suggest that a reciprocal relationship between PVN BDNF and Arc NPY in the context of food intake is also present in the context of salt‐induced fluid balance and the development of hypertension, underlining the key involvement of Arc NPY‐BDNF neuronal pathway in integrating nutritional and electrolyte signals, thereby regulating both energy homeostasis as well as fluid balance.
An important finding of our study is that Arc NPY modulates salt‐induced hypertension independent of its traditional role in controlling food intake and energy expenditure. We found that salt treatment causes a decrease in Arc NPY expression, which is expected to lower food intake, however, reduced NPY expression in the Arc did not cause any change in body weight and feeding under current chow diet feeding conditions. Our results are supported by a previous study in rats where elevated central NPY reduced blood pressure without body weight changes (Michalkiewicz et al., 2003). The exact mechanism for this phenomenon is not clear, but it is possible that salt triggers other mechanisms or neurons in the hypothalamus that counteract the feeding effects of Arc NPY. For example, anorexigenic proopiomelanocortin (POMC) neurons and orexigenic agouti‐related peptide (AgRP) neurons have also been implicated in the salt loading‐involved energy homeostatic regulation (Elkabes & Loh, 1988; Zhang et al., 2018). In addition, vasopressin is synthesized in the SON of the hypothalamus (Vandesande & Dierickx, 1975), a nucleus that has also been explored very recently (Choe et al., 2015) and receives projections from the Arc to regulate vasopressin level (Pineda et al., 2016). The SON also expresses abundant melanocortin 4 (MC4) receptors that mediate Arc POMC effects on feeding (Mountjoy et al., 1994). It is possible that the NPY in the hypothalamic Arc projects to the hypothalamic nuclei including the PVN and the SON to collectively modulate and fine tune the response to salt. Nevertheless, together these data highlight the complexity of the central nervous system and the coordination of multiple neuronal pathways in the control of salt‐induced fluid balance.
Although we have identified a pathway by which NPY in the Arc affects vasopressin secretion and hence blood pressure, the precise mechanism(s) by which NPY expression is reduced in the Arc in response to salt treatment remains to be elucidated. One possibility is that high sodium levels can directly influence Arc NPY neurons considering the proximity of Arc to the third ventricle. The Na+/K+‐pump is essential for the transport of Na+ into neurons and has been shown to modulate the activity of neurotransmitter receptors as previously reviewed (Pivovarov et al., 2018), and thus may modulate electrolyte sensing of Arc NPY neurons. Another possibility is that circulating vasopressin could directly interact with Arc NPY neurons. While vasopressin receptors appear only to be expressed in the PVN and the SON (Dayanithi et al., 2018), some earlier studies in rat brains do suggest that vasopressin 1a receptor mRNA is present in the Arc (Ostrowski et al., 1994; Szot et al., 1994). It is unclear which population of neurons in the Arc express the vasopressin receptor. Likewise, there could be upstream signaling from the PVN to Arc controlling NPY expression, which has previously been demonstrated with PVN oxytocinergic neurons (Maejima et al., 2014). Further studies will be required to explore these possibilities.
In summary, our results highlight a previously unidentified role of central NPY from the Arc in controlling fluid balance via the BDNF‐KCC2‐vasopressin pathway in the PVN, beyond its known roles in the regulation of appetite and energy expenditure. This has important implications for our understanding of high salt intake‐induced hypertension and highlights a new potential therapeutic target for the treatment of hypertension.
CONFLICT OF INTEREST
The authors declare no conflict of interest.
AUTHOR CONTRIBUTIONS
Yan‐Chuan Shi and Shu Lin conceived and designed the project. Chen‐Liang Zhang and Yi‐Zhang Lin performed the majority of experiments including animal work, IHC/IF, qPCR, and analyzed the data. Qi Wu and Chenxu Yan performed RNAscope in situ hybridization analysis and monitored the mice. Chenxu Yan performed the AAV injection to the Arc. Fan Zeng and Ping Zhu participated in animal monitoring. Matthew Wai‐Kin Wong and Kelsey Bowes read and edited the manuscript. Kailun Lee and Xuan Zhang analyzed the data and edited the revised manuscript. Zhi‐Yuan Song provided critical comments on the experimental design. Chen‐Liang Zhang, Shu Lin, and Yan‐Chuan Shi wrote the initial draft. Yan‐Chuan Shi and Shu Lin reviewed, edited, and finalized the manuscript. All authors read and approved the final manuscript.
Supporting information
Figurementary Figure 1. Heart rate measured in C57BL/6 wild‐type mice treated with normal water and salt water for 8 weeks. Values are expressed as means ± SEM (n = 5).
Figurementary Figure 2. Body weight, daily food intake and water consumption measured in C57BL/6 wild type mice and NPYLSL/LSL mice. A. Body weight measured from 7 weeks of age onwards, B. Daily water consumption, C. Daily food intake of NPYLSL/LSL mice compared to C57BL/6 wild type mice. Values are expressed as means ± SEM (n = 5).
ACKNOWLEDGMENTS
This study was supported by the National Health & Medical Research Council, Australia (NH&MRC, #1162276) to Yan‐Chuan Shi, Science and Technology Bureau of Quanzhou (#2020CT003) to Shu Lin, and National Natural Science Foundation of China (#81801870) to Ping Zhu. Open access publishing facilitated by University of New South Wales, as part of the Wiley ‐ University of New South Wales agreement via the Council of Australian University Librarians.
Zhang, C.‐L. , Lin, Y.‐Z. , Wu, Q. , Yan, C. , Wong, M.‐K. , Zeng, F. , Zhu, P. , Bowes, K. , Lee, K. , Zhang, X. , Song, Z.‐Y. , Lin, S. , & Shi, Y.‐C. (2022). Arcuate NPY is involved in salt‐induced hypertension via modulation of paraventricular vasopressin and brain‐derived neurotrophic factor. Journal of Cellular Physiology, 237, 2574–2588. 10.1002/jcp.30719
Chen‐Liang Zhang and Yi‐Zhang Lin contributed equally to this study.
Shu Lin and Yan‐Chuan Shi contributed as senior authors.
Contributor Information
Shu Lin, Email: shulin1956@126.com.
Yan‐Chuan Shi, Email: y.shi@garvan.org.au.
DATA AVAILABILITY STATEMENT
The datasets generated during this study are available from the corresponding author on reasonable request.
REFERENCES
- Boone, M. , & Deen, P. M. (2008). Physiology and pathophysiology of the vasopressin‐regulated renal water reabsorption. Pflügers Archiv: European Journal of Physiology, 456(6), 1005–1024. 10.1007/s00424-008-0498-1 [DOI] [PMC free article] [PubMed] [Google Scholar]
- Bourque, C. W. (2008). Central mechanisms of osmosensation and systemic osmoregulation. Nature Reviews Neuroscience, 9(7), 519–531. 10.1038/nrn2400 [DOI] [PubMed] [Google Scholar]
- Choe, K. Y. , Han, S. Y. , Gaub, P. , Shell, B. , Voisin, D. L. , Knapp, B. A. , & Bourque, C. W. (2015). High salt intake increases blood pressure via BDNF‐mediated downregulation of KCC2 and impaired baroreflex inhibition of vasopressin neurons. Neuron, 85(3), 549–560. 10.1016/j.neuron.2014.12.048 [DOI] [PMC free article] [PubMed] [Google Scholar]
- Chu, C. P. , Kannan, H. , & Qiu, D. L. (2010). Effect of hypertonic saline on rat hypothalamic paraventricular nucleus parvocellular neurons in vitro. Neuroscience Letters, 482(2), 142–145. 10.1016/j.neulet.2010.07.019 [DOI] [PubMed] [Google Scholar]
- Danziger, J. , & Zeidel, M. L. (2015). Osmotic homeostasis. Clinical Journal of the American Society of Nephrology, 10(5), 852–862. 10.2215/cjn.10741013 [DOI] [PMC free article] [PubMed] [Google Scholar]
- Dayanithi, G. , Forostyak, O. , Forostyak, S. , Kayano, T. , Ueta, Y. , & Verkhratsky, A. (2018). Vasopressin and oxytocin in sensory neurones: Expression, exocytotic release and regulation by lactation. Scientific Reports, 8(1):13084. 10.1038/s41598-018-31361-1 [DOI] [PMC free article] [PubMed] [Google Scholar]
- Devarajan, S. , Yahiro, E. , Uehara, Y. , Habe, S. , Nishiyama, A. , Miura, S. , & Urata, H. (2015). Depressor effect of chymase inhibitor in mice with high salt‐induced moderate hypertension. American Journal of Physiology: Heart and Circulatory Physiology, 309(11), H1987–H1996. 10.1152/ajpheart.00721.2014 [DOI] [PubMed] [Google Scholar]
- de Wardener, H. E. (2001). The hypothalamus and hypertension. Physiological Reviews, 81(4), 1599–1658. 10.1152/physrev.2001.81.4.1599 [DOI] [PubMed] [Google Scholar]
- Dragunow, M. , & Faull, R. (1989). The use of c‐fos as a metabolic marker in neuronal pathway tracing. Journal of Neuroscience Methods, 29(3), 261–265. 10.1016/0165-0270(89)90150-7 [DOI] [PubMed] [Google Scholar]
- Elkabes, S. , & Loh, Y. P. (1988). Effect of salt loading on proopiomelanocortin (POMC) messenger ribonucleic acid levels, POMC biosynthesis, and secretion of POMC products in the mouse pituitary gland. Endocrinology, 123(4), 1754–1760. 10.1210/endo-123-4-1754 [DOI] [PubMed] [Google Scholar]
- Erickson, J. C. , Clegg, K. E. , & Palmiter, R. D. (1996). Sensitivity to leptin and susceptibility to seizures of mice lacking neuropeptide Y. Nature, 381(6581), 415–421. 10.1038/381415a0 [DOI] [PubMed] [Google Scholar]
- Farzi, A. , Lau, J. , Ip, C. K. , Qi, Y. , Shi, Y. C. , Zhang, L. , & Herzog, H. (2018). Arcuate nucleus and lateral hypothalamic CART neurons in the mouse brain exert opposing effects on energy expenditure. eLife, 7, e36494. 10.7554/eLife.36494 [DOI] [PMC free article] [PubMed] [Google Scholar]
- Franklin, K. B. J. , & Paxinos, G. (2017). The mouse brain in stereotaxic coordinates. Elsevier. [Google Scholar]
- Gelfo, F. , Tirassa, P. , De Bartolo, P. , Croce, N. , Bernardini, S. , Caltagirone, C. , & Angelucci, F. (2012). NPY intraperitoneal injections produce antidepressant‐like effects and downregulate BDNF in the rat hypothalamus. CNS Neuroscience & Therapeutics, 18(6), 487–492. 10.1111/j.1755-5949.2012.00314.x [DOI] [PMC free article] [PubMed] [Google Scholar]
- Graebner, A. K. , Iyer, M. , & Carter, M. E. (2015). Understanding how discrete populations of hypothalamic neurons orchestrate complicated behavioral states. Frontiers in Systems Neuroscience, 9, 111. 10.3389/fnsys.2015.00111 [DOI] [PMC free article] [PubMed] [Google Scholar]
- Han, Y. , Xia, G. , Srisai, D. , Meng, F. , He, Y. , Ran, Y. , & Wu, Q. (2021). Deciphering an AgRP‐serotoninergic neural circuit in distinct control of energy metabolism from feeding. Nature Communications, 12(1):3525. 10.1038/s41467-021-23846-x [DOI] [PMC free article] [PubMed] [Google Scholar]
- He, F. J. , & MacGregor, G. A. (2012). Cardiovascular disease: salt and cardiovascular risk. Nature Reviews Nephrology, 8, 134–136. 10.1038/nrneph.2011.220 [DOI] [PubMed] [Google Scholar]
- He, F. J. , Li, J. , & Macgregor, G. A. (2013). Effect of longer term modest salt reduction on blood pressure: Cochrane systematic review and meta‐analysis of randomised trials. BMJ, 346, f1325. 10.1136/bmj.f1325 [DOI] [PubMed] [Google Scholar]
- Henderson, K. K. , & Byron, K. L. (2007). Vasopressin‐induced vasoconstriction: two concentration‐dependent signaling pathways. Journal of Applied Physiology, 102(4), 1402–1409. 10.1152/japplphysiol.00825.2006 [DOI] [PMC free article] [PubMed] [Google Scholar]
- Ip, C. K. , Zhang, L. , Farzi, A. , Qi, Y. , Clarke, I. , Reed, F. , & Herzog, H. (2019). Amygdala NPY Circuits Promote the Development of Accelerated Obesity under Chronic Stress Conditions. Cell Metabolism, 30(1), 111–128. 10.1016/j.cmet.2019.04.001 [DOI] [PubMed] [Google Scholar]
- Jaitovich, A. , & Bertorello, A. M. (2010). Salt, Na+,K+‐ATPase and hypertension. Life Sciences, 86(3‐4), 73–78. 10.1016/j.lfs.2009.10.019 [DOI] [PubMed] [Google Scholar]
- Kang, Y. M. , Gao, F. , Li, H. H. , Cardinale, J. P. , Elks, C. , Zang, W. J. , & Francis, J. (2011). NF‐kappaB in the paraventricular nucleus modulates neurotransmitters and contributes to sympathoexcitation in heart failure. Basic Research in Cardiology, 106(6), 1087–1097. 10.1007/s00395-011-0215-7 [DOI] [PMC free article] [PubMed] [Google Scholar]
- Kim, J. S. , Kim, W. B. , Kim, Y. B. , Lee, Y. , Kim, Y. S. , Shen, F. Y. , & Kim, Y. I. (2011). Chronic hyperosmotic stress converts GABAergic inhibition into excitation in vasopressin and oxytocin neurons in the rat. Journal of Neuroscience, 31(37), 13312–13322. 10.1523/jneurosci.1440-11.2011 [DOI] [PMC free article] [PubMed] [Google Scholar]
- Kong, Y. W. , Baqar, S. , Jerums, G. , & Ekinci, E. I. (2016). Sodium and Its Role in Cardiovascular Disease ‐ The Debate Continues. Frontiers in Endocrinology, 7, 164. 10.3389/fendo.2016.00164 [DOI] [PMC free article] [PubMed] [Google Scholar]
- Larsen, P. J. , Mikkelsen, J. D. , Jessop, D. S. , Lightman, S. L. , & Chowdrey, H. S. (1993). Neuropeptide Y mRNA and immunoreactivity in hypothalamic neuroendocrine neurons: effects of adrenalectomy and chronic osmotic stimulation. Journal of Neuroscience, 13(3), 1138–1147. [DOI] [PMC free article] [PubMed] [Google Scholar]
- Lee, N. J. , Qi, Y. , Enriquez, R. F. , Clarke, I. , Ip, C. K. , Wee, N. , Baldock, P. A. , & Herzog, H. (2020). Energy partitioning between fat and bone mass is controlled via a hypothalamic leptin/NPY relay. International Journal of Obesity, 44(10), 2149–2164. 10.1038/s41366-020-0550-6 [DOI] [PubMed] [Google Scholar]
- Lin, S. , Boey, D. , & Herzog, H. (2004). NPY and Y receptors: lessons from transgenic and knockout models. Neuropeptides, 38(4), 189–200. 10.1016/j.npep.2004.05.005 [DOI] [PubMed] [Google Scholar]
- Lizarbe, B. , Benitez, A. , Pelaez Brioso, G. A. , Sanchez‐Montanes, M. , Lopez‐Larrubia, P. , Ballesteros, P. , & Cerdan, S. (2013). Hypothalamic metabolic compartmentation during appetite regulation as revealed by magnetic resonance imaging and spectroscopy methods. Frontiers in Neuroenergetics, 5, 6. 10.3389/fnene.2013.00006 [DOI] [PMC free article] [PubMed] [Google Scholar]
- Loh, K. , Herzog, H. , & Shi, Y. C. (2015). Regulation of energy homeostasis by the NPY system. Trends in Endocrinology and Metabolism, 26(3), 125–135. 10.1016/j.tem.2015.01.003 [DOI] [PubMed] [Google Scholar]
- Maejima, Y. , Sakuma, K. , Santoso, P. , Gantulga, D. , Katsurada, K. , Ueta, Y. , & Yada, T. (2014). Oxytocinergic circuit from paraventricular and supraoptic nuclei to arcuate POMC neurons in hypothalamus. FEBS Letters, 588(23), 4404–4412. 10.1016/j.febslet.2014.10.010 [DOI] [PubMed] [Google Scholar]
- Masajtis‐Zagajewska, A. , Kurnatowska, I. , Wajdlich, M. , & Nowicki, M. (2015). Utility of copeptin and standard inflammatory markers in the diagnostics of upper and lower urinary tract infections. BMC Urology, 15, 67. 10.1186/s12894-015-0061-2 [DOI] [PMC free article] [PubMed] [Google Scholar]
- McLaren, L. , Sumar, N. , Barberio, A. M. , Trieu, K. , Lorenzetti, D. L. , Tarasuk, V. , & Campbell, N. R. (2016). Population‐level interventions in government jurisdictions for dietary sodium reduction. Cochrane Database of Systematic Reviews, 9(9), Cd010166. 10.1002/14651858.CD010166.pub2 [DOI] [PMC free article] [PubMed] [Google Scholar]
- Michalkiewicz, M. , Knestaut, K. M. , Bytchkova, E. Y. , & Michalkiewicz, T. (2003). Hypotension and reduced catecholamines in neuropeptide Y transgenic rats. Hypertension, 41(5), 1056–1062. 10.1161/01.HYP.0000066623.64368.4E [DOI] [PubMed] [Google Scholar]
- Michalkiewicz, M. , Zhao, G. , Jia, Z. , Michalkiewicz, T. , & Racadio, M. J. (2005). Central neuropeptide Y signaling ameliorates N(omega)‐nitro‐L‐arginine methyl ester hypertension in the rat through a Y1 receptor mechanism. Hypertension, 45(4), 780–785. 10.1161/01.HYP.0000153953.69799.f2 [DOI] [PubMed] [Google Scholar]
- Morris, M. J. , Tortelli, C. F. , Hart, D. P. , & Delbridge, L. M. (2004). Vascular and brain neuropeptide Y in banded and spontaneously hypertensive rats. Peptides, 25(8), 1313–1319. 10.1016/j.peptides.2004.05.006 [DOI] [PubMed] [Google Scholar]
- Mountjoy, K. G. , Mortrud, M. T. , Low, M. J. , Simerly, R. B. , & Cone, R. D. (1994). Localization of the melanocortin‐4 receptor (MC4‐R) in neuroendocrine and autonomic control circuits in the brain. Molecular Endocrinology, 8(10), 1298–1308. 10.1210/mend.8.10.7854347 [DOI] [PubMed] [Google Scholar]
- Nguyen, A. D. , Mitchell, N. F. , Lin, S.M. , Laurence, Y. , Ernie, B. , Paul, A. , & Sainsbury, A. (2012). Y1 and Y5 receptors are both required for the regulation of food intake and energy homeostasis in mice. PLoS One, 7(6), e40191. 10.1371/journal.pone.0040191 [DOI] [PMC free article] [PubMed] [Google Scholar]
- Ostrowski, N. L. , Lolait, S. J. , Young, W. S. (1994). Cellular localization of vasopressin V1a receptor messenger ribonucleic acid in adult male rat brain, pineal, and brain vasculature. Endocrinology, 135(4), 1511–1528. 10.1210/endo.135.4.7925112 [DOI] [PubMed] [Google Scholar]
- Pineda, R. , Sabatier, N. , Ludwig, M. , Millar, R. P. , & Leng, G. (2016). A Direct Neurokinin B Projection from the Arcuate Nucleus Regulates Magnocellular Vasopressin Cells of the Supraoptic Nucleus. Journal of Neuroendocrinology, 28(4). 10.1111/jne.12342 [DOI] [PubMed] [Google Scholar]
- Pivovarov, A. S. , Calahorro, F. , & Walker, R. J. (2018). Na+/K+‐pump and neurotransmitter membrane receptors. Invertebrate Neuroscience, 19(1), 1. 10.1007/s10158-018-0221-7 [DOI] [PMC free article] [PubMed] [Google Scholar]
- Prager‐Khoutorsky, M. , Choe, K. Y. , Levi, D. I. , & Bourque, C. W. (2017). Role of Vasopressin in Rat Models of Salt‐Dependent Hypertension. Current Hypertension Reports, 19(5), 42. 10.1007/s11906-017-0741-2 [DOI] [PubMed] [Google Scholar]
- Schmidlin, O. , Forman, A. , Sebastian, A. , Morris, R. C. Jr. (2007). Sodium‐selective salt sensitivity: its occurrence in blacks. Hypertension, 50(6), 1085–1092. 10.1161/hypertensionaha.107.091694 [DOI] [PMC free article] [PubMed] [Google Scholar]
- Shi, Y. C. , Lau, J. , Lin, Z. , Zhang, H. , Zhai, L. , Sperk, G. , & Lin, S. (2013). Arcuate NPY controls sympathetic output and BAT function via a relay of tyrosine hydroxylase neurons in the PVN. Cell Metabolism, 17(2), 236–248. 10.1016/j.cmet.2013.01.006. [DOI] [PubMed] [Google Scholar]
- Shi, Y. C. , Lin, S. , Wong, I. P. , Baldock, P. A. , Aljanova, A. , Enriquez, R. F. , Castillo, L. , Mitchell, N. F. , Ye, J. M. , Zhang, L. , Macia, L. , Yulyaningsih, E. , Nguyen, A. D. , Riepler, S. J. , Herzog, H. , & Sainsbury, A. (2010). NPY neuron‐specific Y2 receptors regulate adipose tissue and trabecular bone but not cortical bone homeostasis in mice. PLoS One, 5(6), e11361. 10.1371/journal.pone.0011361. [DOI] [PMC free article] [PubMed] [Google Scholar]
- Simmonds, S. S. , Lay, J. , & Stocker, S. D. (2014). Dietary salt intake exaggerates sympathetic reflexes and increases blood pressure variability in normotensive rats. Hypertension, 64(3), 583–589. 10.1161/hypertensionaha.114.03250 [DOI] [PMC free article] [PubMed] [Google Scholar]
- Szot, P. , Bale, T. L. , & Dorsa, D. M. (1994). Distribution of messenger RNA for the vasopressin V1a receptor in the CNS of male and female rats. Molecular Brain Research, 24(1), 1–10. 10.1016/0169-328X(94)90111-2 [DOI] [PubMed] [Google Scholar]
- Tatemoto, K. , Carlquist, M. , & Mutt, V. (1982). Neuropeptide Y‐‐a novel brain peptide with structural similarities to peptide YY and pancreatic polypeptide. Nature, 296(5858), 659–660. 10.1038/296659a0 [DOI] [PubMed] [Google Scholar]
- Urban, J. H. , Leitermann, R. J. , DeJoseph, M. R. , Somponpun, S. J. , Wolak, M. L. , & Sladek, C. D. (2006). Influence of dehydration on the expression of neuropeptide Y Y1 receptors in hypothalamic magnocellular neurons. Endocrinology, 147(9), 4122–4131. 10.1210/en.2006-0377 [DOI] [PubMed] [Google Scholar]
- van den Pol, A. N. , Yao, Y. , Fu, L. Y. , Foo, K. , Huang, H. , Coppari, R. , & Broberger, C. (2009). Neuromedin B and gastrin‐releasing peptide excite arcuate nucleus neuropeptide Y neurons in a novel transgenic mouse expressing strong Renilla green fluorescent protein in NPY neurons. Journal of Neuroscience, 29(14), 4622–4639. 10.1523/JNEUROSCI.3249-08.2009 [DOI] [PMC free article] [PubMed] [Google Scholar]
- Vähätalo, L. H. , Ruohonen, S. T. , Mäkelä, S. , Kovalainen, M. , Huotari, A. , Mäkelä, K. A. , & Savontaus, E. (2015). Neuropeptide Y in the noradrenergic neurones induces obesity and inhibits sympathetic tone in mice. Acta Physiologica, 213(4), 902–919. 10.1111/apha.12436 [DOI] [PubMed] [Google Scholar]
- Vandesande, F. , & Dierickx, K. (1975). Identification of the vasopressin producing and of the oxytocin producing neurons in the hypothalamic magnocellular neurosecretroy system of the rat. Cell and Tissue Research, 164(2), 153–162. 10.1007/bf00218970 [DOI] [PubMed] [Google Scholar]
- Wang, C. , Bomberg, E. , Billington, C. , Levine, A. , & Kotz, C. M. (2007). Brain‐derived neurotrophic factor in the hypothalamic paraventricular nucleus reduces energy intake. American Journal of Physiology. Regulatory, Integrative and Comparative Physiology, 293(3), R1003–R1012. 10.1152/ajpregu.00011.2007 [DOI] [PubMed] [Google Scholar]
- Zhang, B. , Nakata, M. , Lu, M. , Nakae, J. , Okada, T. , Ogawa, W. , & Yada, T. (2018). Protective role of AgRP neuron's PDK1 against salt‐induced hypertension. Biochemical and Biophysical Research Communications, 500(4), 910–916. 10.1016/j.bbrc.2018.04.192 [DOI] [PubMed] [Google Scholar]
- Zhu, P. , Sun, W. , Zhang, C. , Song, Z. , & Lin, S. (2016). The role of neuropeptide Y in the pathophysiology of atherosclerotic cardiovascular disease. International Journal of Cardiology, 220, 235–241. 10.1016/j.ijcard.2016.06.138 [DOI] [PubMed] [Google Scholar]
Associated Data
This section collects any data citations, data availability statements, or supplementary materials included in this article.
Supplementary Materials
Figurementary Figure 1. Heart rate measured in C57BL/6 wild‐type mice treated with normal water and salt water for 8 weeks. Values are expressed as means ± SEM (n = 5).
Figurementary Figure 2. Body weight, daily food intake and water consumption measured in C57BL/6 wild type mice and NPYLSL/LSL mice. A. Body weight measured from 7 weeks of age onwards, B. Daily water consumption, C. Daily food intake of NPYLSL/LSL mice compared to C57BL/6 wild type mice. Values are expressed as means ± SEM (n = 5).
Data Availability Statement
The datasets generated during this study are available from the corresponding author on reasonable request.