

Abstract
Objective
Previous work has shown the chemosensory dysfunction item of the 22‐item Sinonasal Outcome Test (SNOT‐22) that assesses problems with “taste/smell” has poor psychometric performance compared with other items on the SNOT‐22, which we have hypothesized is due to the simultaneous assessment of two different senses. Our aim was to determine whether distinct smell and taste items in the SNOT‐22 would improve psychometric performance.
Methods
One hundred and eighty‐one CRS patients were recruited and completed the SNOT‐22. Additional items querying problems with the senses of “smell” and “taste,” using the same response scale and recall period were given to study participants. Item response theory (IRT) was used to determine IRT parameters, including item discrimination, difficulty, and information provided by each SNOT‐22 item.
Results
Confirming previous studies, the chemosensory item of the SNOT‐22 (reflecting “taste/smell”) had poor psychometric performance. Use of a distinct smell or taste item instead of the combined “taste/smell” item did not improve psychometric performance. However, a dedicated smell question resulted in a left shift of threshold parameters, showing that the dedicated smell item better captures moderate CRS disease burden than the original taste/smell item of the SNOT‐22, which by virtue of near‐identical IRT parameters appears to more greatly reflect problems with taste.
Conclusions
A dedicated smell‐ or taste‐specific item, rather than the combined “taste/smell” item currently in the SNOT‐22 does not provide significantly greater psychometric performance. However, a dedicated smell item may better capture moderate CRS disease burden compared with the current chemosensory item on the SNOT‐22. Laryngoscope, 132:1644–1651, 2022
Keywords: chronic rhinosinusitis, CRS, graded response model, IRT, olfaction, quality of life, smell, SNOT‐22, taste, item response theory
INTRODUCTION
Chronic sinonasal symptomatology defines chronic rhinosinusitis (CRS) and is one of the major drivers of decreased quality of life (QOL). 1 , 2 , 3 , 4 Nasal symptoms, in particular, are the symptoms of CRS that are most prominently perceived by patients with respect to the control of their condition as well as their treatment response. 5 , 6 , 7 Nasal symptoms associated with CRS include nasal obstruction, nasal drainage, and decreased sense of smell. 1 , 2 , 8 All of these nasal symptoms of CRS are reported to be associated with decreased QOL. 9 , 10 , 11 Chemosensory dysfunction—decreased sense of smell and decreased sense of taste—has been shown to be an important determinant of QOL and affects individuals through its impact on various areas in daily life. 12 , 13
The primary focus for the treatment of CRS is to improve patients' QOL. As a commonly experienced and cardinal symptom of CRS, decreased sense of smell is an important symptom that should be assessed by patient‐reported outcome measures (PROMs). The 22‐item Sinonasal Outcome Test (SNOT‐22) is a commonly utilized PROM that is widely recognized as a high‐quality tool for assessing CRS‐specific QOL. 14 , 15 The SNOT‐22 assesses four domains related to nasal symptoms, poor sleep quality, craniofacial discomfort, and emotional disturbance. Included in the nasal subdomain of the SNOT‐22 is the item that queries problems with “sense of taste/smell.” Although the psychometric performance of the overall SNOT‐22 is relatively high according to metrics of classical test theory, 14 our recent studies of the SNOT‐22 using item response theory (IRT) have shown that the performance of some individual items of the SNOT‐22 may be suboptimal. 16 , 17 Most prominently, the SNOT‐22 item reflecting problems with “sense of taste/smell” had arguably the poorest psychometric performance, conveying the least amount of information about CRS‐specific QOL. 16 , 17 This finding was consistent with prior studies, which found that although the taste/smell item of the SNOT‐22 was grouped into the nasal subdomain of the SNOT‐22, its correlations with other items related to nasal symptoms were disparately low. 18 , 19 , 20
We have previously hypothesized that the poor psychometric function of the taste/smell item of the SNOT‐22 was related to the fact that the item simultaneously queries the sense of taste and smell, rather than querying each sense separately. 16 , 17 Previous studies have shown that the impact of smell loss on taste is variable and that one sense can be affected without the other. 21 , 22 , 23 These conflicts may therefore confound how a patient scores the taste/smell item of the SNOT‐22. The objective of this study was to assess how the use of discrete, separate items for the senses of smell and taste would impact the psychometric function of the SNOT‐22. Specifically, we use IRT methodology to assess the degree of information—related to the ability to discriminate different levels of symptomatology at all levels of disease burden—imparted by the individual smell and taste items compared with the current combined taste/smell item. We believe that the results of this study may inform future revisions of the SNOT‐22 or the creation of new CRS‐specific QOL PROMs.
MATERIAL AND METHODS
Subjects
This was a prospective, observational study of patients aged 18 or older meeting diagnostic criteria and consensus guidelines for CRS who visited the Department of Otolaryngology–Head and Neck Surgery, University of Cincinnati College of Medicine between May 2021 and August 2021 and who provided informed consent to participate. 8 This study was approved by the University of Cincinnati Institutional Review Board. Patients with previous endoscopic sinus surgery within the last 3 months were excluded.
Study Design
This was a cross‐sectional study of patients meeting clinical consensus diagnostic criteria for CRS. 8 All data were collected at enrollment. Demographic information including age and gender was obtained. A smoker was defined as any participant who currently smoked or reported a history of tobacco use. 24 , 25 At enrollment, participants were assessed by the evaluating physician for a history of asthma, diagnosed based on consensus guidelines, as well as a history of allergy, which was determined through formal skin or serological testing. Participants were interviewed to identify a history of previous sinus surgery or a history of aspirin sensitivity. The presence of nasal polyps and the history of prior sinus surgery was confirmed on nasal endoscopy. A Lund‐Kennedy endoscopy score was also determined based on nasal endoscopy. 26 All participants completed a 22‐item Sinonasal Outcome Test (SNOT‐22) questionnaire, 14 which was supplemented with two additional items—one for “sense of smell” and one for “sense of taste.”
The 22‐Item Sinonasal Outcome Test (SNOT‐22)
The SNOT‐22 is a validated CRS‐specific QOL instrument. 14 Each of the 22 items, reflecting the burden of CRS‐associated symptoms, in the SNOT‐22 is rated on a 6‐point (range = 0–5) Likert scale (total SNOT‐22 score range = 0–110). We have previously explored and psychometrically validated the 4‐subdomain structure of the SNOT‐22. 18 , 27 In this study, we use the same four validated SNOT‐22 subdomains that we have previously described: the nasal subdomain score was calculated by summing SNOT‐22 items 1–6, 21, and 22. The otologic/facial pain subdomain score was calculated by summing SNOT‐22 items 7–10. The sleep subdomain score was calculated by summing SNOT‐22 items 11–18. The emotional subdomain score was calculated by summing SNOT‐22 items 19 and 20. Additionally, patients were given two additional items—“sense of smell” and “sense of taste”—to score on the same response scale and with the same 2‐week recall period as the SNOT‐22. These latter two items were provided on a physically separate questionnaire to decrease conflation with the SNOT‐22 and the participant's response to the chemosensory item on it.
Item Response Theory Modeling
IRT consists of a family of models that allows users to assess the relationship between an individual's “ability” or “trait” and their response to items on a scale. 28 , 29 , 30 Because SNOT‐22 items are ordered polytomous variables (i.e., 6‐point Likert scale) and based on our previously described application of IRT to the SNOT‐22, 16 , 17 we have used an unconstrained graded response model to analyze our data. Parameters from IRT models that directly translate to PROM performance are (i) item discrimination and (ii) item difficulty. The “item discrimination” parameter (also referred to as the slope parameter ), characterizes the ability of an item to discriminate between different latent trait levels (i.e., the severity of symptoms). A greater slope parameter indicates a greater ability of an individual item to discriminate between those with lower vs. higher levels of the symptom severity. A greater slope parameter also indicates higher reliability. We use a previously described classification scheme for the discrimination parameter values: none (0), very low (0.01–0.34), low (0.35–0.64), moderate (0.65–1.34), high (1.35–1.69), and very high (>1.70) discrimination. 30
The second group of IRT parameters is often referred to as “item difficulty” parameters or threshold parameters. As the SNOT‐22 utilizes a 6‐point Likert scale, five threshold parameters can be derived for each of the items. The threshold parameters are ordered and can be interpreted as a relative indicator of difficulty needed to reach the next response category. In other words, how much of a burden does the symptom have to be for a patient to score one level higher on the item. For example, is the burden of a symptom “j” at which point a patient may score it with the second response category “1 = Very mild problem,” whereas is the symptom burden needed to reach the third response category “2 = Mild or slight problem” from the second response category. The threshold parameter can also be defined as a “barrier” or point of the latent trait level (i.e., symptom severity) that leads to an equal probability of endorsing either of two of the adjacent response categories.
To visualize our IRT results, we plotted item response category characteristic curves (ICCs) for the smell/taste items. All models were implemented with the package “ltm” using the statistical software R (R Development Core Team, 2008; R Foundation for Statistical Computing, Vienna, Austria). 31
RESULTS
Participants
Baseline characteristics of the overall cohort of CRS patients are presented in Table I. We included a total of 181 patients. The overall cohort was 51.4% male and 48.6% female. Our CRS population consisted of 47% CRSwNP. Asthmatics comprised 50.3% of our CRS population, and 81.8% had a history of allergy. Our patients' mean ± SD total SNOT‐22 score was 42.2 ± 24.4, thus representing a CRS cohort with, on average, moderate disease severity. 32
TABLE I.
Characteristics of Study Participants.
| All Participants (N = 181) | |
|---|---|
| Demographics | |
| Age, mean in years, (SD) | 49.8 (15.6) |
| Gender | |
| Male | 51.4% |
| Female | 48.6% |
| Smoking | 34.8% |
| Comorbidities | |
| Allergy | 81.8% |
| Asthma | 50.3% |
| Aspirin sensitivity | 18.8% |
| CRS characteristics at enrollment | |
| Nasal polyps | 47.0% |
| Previous endoscopic sinus surgery | 37.6% |
| SNOT‐22 score, mean (SD) | 42.4 (24.4) |
| Lund‐Kennedy endoscopy score | 4.6 (3.8) |
IRT‐Parameter Estimates of the Original SNOT‐22 Items
We have previously shown that IRT parameters (i) item discrimination (slope parameter, ), (ii) threshold parameters , and (iii) total information contributed by each item (i.e., the importance of an individual item regarding the overall construct of CRS‐related QOL) differ considerably within each of the four SNOT‐22 subdomains. We therefore first calculated item discrimination, threshold parameters, and total information provided in our new cohort of CRS patients (Table II).
TABLE II.
SNOT‐22 Item Parameter Estimates Based on the Unconstrained Graded Response Model Stratified by Subdomain.*
|
|
|
|
|
|
|
|||||||
|---|---|---|---|---|---|---|---|---|---|---|---|---|
| Nasal subdomain | ||||||||||||
| Item 1: Need to blow nose | 2.890 | −1.145 | −0.614 | −0.001 | 0.678 | 1.453 | ||||||
| Item 2: Sneezing | 1.743 | −1.255 | −0.178 | 0.656 | 1.698 | 2.592 | ||||||
| Item 3: Runny nose | 2.767 | −0.948 | −0.273 | 0.262 | 1.052 | 1.640 | ||||||
| Item 4: Cough | 0.744 | −1.492 | −0.152 | 0.936 | 2.522 | 6.304 | ||||||
| Item 5: Post‐nasal discharge | 1.796 | −1.731 | −0.866 | −0.299 | 0.386 | 1.681 | ||||||
| Item 6: Thick nasal drainage | 2.002 | −0.938 | −0.254 | 0.191 | 0.875 | 1.539 | ||||||
| Item 21: Sense of taste/smell | 1.186 | −0.191 | 0.424 | 0.806 | 1.391 | 2.437 | ||||||
| Item 22: Blockage/congestion of nose | 2.030 | −1.580 | −0.855 | −0.408 | 0.199 | 1.095 | ||||||
| Otologic/facial pain subdomain | ||||||||||||
| Item 7: Ear fullness | 3.835 | −0.714 | −0.208 | 0.180 | 0.763 | 1.500 | ||||||
| Item 8: Dizziness | 1.769 | −0.020 | 0.439 | 0.995 | 1.776 | 2.462 | ||||||
| Item 9: Ear pain/pressure | 3.887 | −0.306 | 0.084 | 0.465 | 0.945 | 1.603 | ||||||
| Item 10: Facial pain/pressure | 1.957 | −0.976 | −0.162 | 0.363 | 0.895 | 1.711 | ||||||
| Sleep subdomain | ||||||||||||
| Item 11: Difficulty falling asleep | 2.097 | −0490 | 0.150 | 0.704 | 1.325 | 2.171 | ||||||
| Item 12: Waking up at night | 2.868 | −0.448 | 0.096 | 0.499 | 0.959 | 1.605 | ||||||
| Item 13: Lack of a good night's sleep | 3.449 | −0.413 | 0.216 | 0.603 | 1.313 | 1.937 | ||||||
| Item 14: Waking up tired | 3.990 | −0.388 | 0.003 | 0.351 | 0.791 | 1.359 | ||||||
| Item 15: Fatigue during the day | 3.745 | −0.474 | 0.098 | 0.471 | 1.101 | 1.666 | ||||||
| Item 16: Reduced productivity | 3.740 | −0104 | 0.395 | 0.648 | 1.262 | 1.734 | ||||||
| Item 17: Reduced concentration | 3.347 | −0.069 | 0.393 | 0.817 | 1.319 | 2.221 | ||||||
| Item 18: Frustrated/restless/irritatable | 3.444 | −0.105 | 0.429 | 0.777 | 1.433 | 1.808 | ||||||
| Emotional subdomain | ||||||||||||
| Item 19: Sad | 3.822 | 0.199 | 0.664 | 0.949 | 1.376 | 1.762 | ||||||
| Item 20: Embarrassed | 3.162 | 0.482 | 0.906 | 1.234 | 1.501 | 1.804 | ||||||
denote the threshold parameter, represents the discrimination parameter.
As expected, item discrimination parameters showed a large variability within each of the four subdomains. We found the greatest variability in the nasal subdomain, and the items related to cough (item 4) and smell/taste (item 21) showed the lowest item discrimination overall. Regarding item threshold parameters, we found that most items of the nasal subdomain spanned a large range of mild to severe CRS. Similarly, also the otologic/facial pain and the sleep subdomain items spanned a large range of mild to more severe CRS. Only the two emotional subdomain items showed threshold parameters reflecting the more severe range of CRS.
Analyzing item‐based information and percentage total information provided by each of the 22 items within their respective subdomain (Table III), we found that items 1 (need to blow nose) and 3 (runny nose) provided the largest amount of information. In contrast, items 4 (cough) and 21 (smell/taste) provided the least amount of information to the nasal subdomain. In the otologic/facial pain subdomain, we found that item 7 (ear fullness) provided the most information, whereas item 8 (dizziness) provided the least information. In the sleep subdomain, we found that items 14 (waking up tired) and 15 (fatigued during the day) provided the greatest information, whereas items 8 (dizziness) and 10 (facial pain/pressure) provided the least information. Finally, we found that item 19 (sad) provided more information than item 20 (embarrassed) in the emotional subdomain. These results are consistent with results we have previously reported using a larger cohort of 800 CRS patients recruited from clinics in the eastern and western United States. 16
TABLE III.
Item Based Information and Percentage Total Information of All SNOT‐22 Items within their Respective Subdomains.
| Total Information | Percentage Total Information (%) | |
|---|---|---|
| Nasal subdomain | ||
| Item 1: Need to blow nose | 9.91 | 22.5 |
| Item 3: Runny nose | 8.71 | 19.97 |
| Item 22: Blockage/congestion of nose | 5.46 | 12.41 |
| Item 2: Sneezing | 5.3 | 12.04 |
| Item 6: Thick nasal drainage | 5.14 | 11.68 |
| Item 5: Nasal secretion going to your throat | 5.13 | 11.66 |
| Item 21: Sense of taste/smell | 2.38 | 5.41 |
| Item 4: Cough | 1.97 | 4.47 |
| Total Information | 43.99 | |
| Otologic/facial pain subdomain | ||
| Item 7: Ear fullness | 13.13 | 37.56 |
| Item 9: Ear pain/pressure | 12.4 | 35.46 |
| Item 10: Facial pain/pressure | 5.18 | 14.82 |
| Item 8: Dizziness | 4.25 | 12.15 |
| Total information | 34.96 | |
| Sleep subdomain | ||
| Item 15: Fatigued during the day | 12.5 | 15.11 |
| Item 14: Waking up tired | 12.34 | 14.92 |
| Item 13: Lack of a good night's sleep | 11.6 | 14.03 |
| Item 16: Reduced productivity | 11.41 | 13.80 |
| Item 17: Reduced concentration | 10.74 | 12.99 |
| Item 18: Frustrated/restless/irritated | 10.28 | 12.44 |
| Item 12: Waking up at night | 8.08 | 9.77 |
| Item 11: Difficulty falling asleep | 5.74 | 6.94 |
| Total information | 82.7 | |
| Emotional subdomain | ||
| Item 19: Sad | 10.87 | 59.49 |
| Item 20: Embarrassed | 7.4 | 40.5 |
| Total information | 18.27 | |
Items are ordered according to percentage of total information provided within each of the four subdomains.
IRT‐Parameter Estimates for Separate Smell and Taste Items
We have previously hypothesized that the poor psychometric function of the combined taste/smell item of the SNOT‐22 was related to the fact that this item simultaneously queries the sense of taste and smell, rather than querying each sense separately. Therefore, we were interested in evaluating whether the use of discrete and separate items for the senses of smell and taste—instead of the combined smell/taste item—would impact the psychometric function of the SNOT‐22. To do so, we calculated IRT parameters (i) item discrimination, (ii) threshold parameters, and (iii) total information contributed by each item and compared our new results with those derived from the original nasal subdomain items (Table IV).
TABLE IV.
Nasal Subdomain Item Parameter Estimates for the Original Smell/Taste, and the Distinct Smell And Taste Items.
|
|
|
|
|
|
|
|||||||
|---|---|---|---|---|---|---|---|---|---|---|---|---|
| Original smell/taste item | ||||||||||||
| Item 1: Need to blow nose | 2.890 | −1.445 | −0.614 | −0.001 | 0.678 | 1.453 | ||||||
| Item 2: Sneezing | 1.743 | −1.255 | −0.178 | 0.656 | 1.698 | 2.592 | ||||||
| Item 3: Runny nose | 2.767 | −0.948 | −0.273 | 0.262 | 1.052 | 1.640 | ||||||
| Item 4: Cough | 0.744 | −1.492 | −0.152 | 0.936 | 2.522 | 6.304 | ||||||
| Item 5: Post‐nasal discharge | 1.796 | −1.731 | −0.866 | −0.299 | 0.386 | 1.681 | ||||||
| Item 6: Thick nasal drainage | 2.002 | −0.938 | −0.254 | 0.191 | 0.875 | 1.539 | ||||||
| Item 21: Sense of smell/taste | 1.186 | −0.191 | −0.424 | 0.806 | 1.391 | 2.437 | ||||||
| Item 22: Blockage/congestion of nose | 2.030 | −1.580 | −0.855 | −0.408 | 0.199 | 1.096 | ||||||
| Distinct smell item | ||||||||||||
| Item 1: Need to blow nose | 2.915 | −1.423 | −0.599 | 0.009 | 0.682 | 1.448 | ||||||
| Item 2: Sneezing | 1.773 | −1.231 | −0.168 | 0.655 | 1.689 | 2.585 | ||||||
| Item 3: Runny nose | 2.816 | −0.927 | −0.260 | 0.269 | 1.051 | 1.633 | ||||||
| Item 4: Cough | 0.745 | −1.480 | −0.144 | 0.941 | 2.524 | 6.298 | ||||||
| Item 5: Post‐nasal discharge | 1.796 | −1.712 | −0.852 | −0.288 | 0.393 | 1.688 | ||||||
| Item 6: Thick nasal drainage | 1.997 | −0.924 | −0.243 | 0.202 | 0.882 | 1.543 | ||||||
| Item 23: Sense of smell | 1.144 | −0.580 | 0.292 | 0.646 | 1.464 | 2.046 | ||||||
| Item 22: Blockage/congestion of nose | 2.032 | −1.566 | −0.844 | −0.398 | 0.206 | 1.096 | ||||||
| Distinct taste item | ||||||||||||
| Item 1: Need to blow nose | 2.880 | −1.437 | −0.606 | 0.006 | 0.685 | 1.460 | ||||||
| Item 2: Sneezing | 1.795 | −1.233 | −0.170 | 0.651 | 1.678 | 2.566 | ||||||
| Item 3: Runny nose | 2.818 | −0.935 | −0.266 | 0.263 | 1.051 | 1.637 | ||||||
| Item 4: Cough | 0.751 | −1.475 | −0.145 | 0.935 | 2.509 | 6.257 | ||||||
| Item 5: Post‐nasal discharge | 1.785 | −1.726 | −0.861 | −0.293 | 0.392 | 1.691 | ||||||
| Item 6: Thick nasal drainage | 1.958 | −0.940 | −0.249 | 0.200 | 0.889 | 1.559 | ||||||
| Item 24: Sense of taste | 1.182 | −0.182 | 0.555 | 1.113 | 1.710 | 2.446 | ||||||
| Item 22: Blockage/congestion of nose | 2.004 | −1.582 | −0.853 | −0.404 | 0.204 | 1.103 | ||||||
| Distinct smell and taste items | ||||||||||||
| Item 1: Need to blow nose | 2.773 | −1.458 | −0.644 | −0.050 | 0.666 | 1.493 | ||||||
| Item 2: Sneezing | 1.703 | −1.281 | −0.171 | 0.638 | 1.721 | 2.569 | ||||||
| Item 3: Runny nose | 2.551 | −0.961 | −0.291 | 0.225 | 1.035 | 1.662 | ||||||
| Item 4: Cough | 0.731 | −1.454 | −0.175 | 0.873 | 2.642 | 6.473 | ||||||
| Item 5: Post‐nasal discharge | 1.690 | −1.768 | −0.929 | −0.374 | 0.389 | 1.735 | ||||||
| Item 6: Thick nasal drainage | −0.937 | 0.269 | 0.151 | 0.896 | 1.580 | 2.006 | ||||||
| Item 22: Blockage/congestion of nose | 2.158 | −1.501 | −0.845 | −0.428 | 0.153 | 1.057 | ||||||
| Item 23: Sense of smell | 1.333 | −0.556 | 0.269 | 0.573 | 1.289 | 1.854 | ||||||
| Item 24: Sense of taste | 1.338 | −0.151 | 0.537 | 1.030 | 1.589 | 2.300 | ||||||
Item discrimination and information provided showed that use of a separate item for the sense of smell instead of a combined smell/taste item did not improve the psychometric function of the SNOT‐22 significantly. Interestingly, however, when looking at the threshold parameters, the sole evaluation of the sense of smell resulted in a left shift of threshold parameters (β range of −0.580–2.046)—that is, the item is more informative for milder forms of CRS—now spanning a range of lower disease severity than when using a combined smell/taste question (β range of −0.191 to 2.437). Similarly, we also found no significant improvement of psychometric properties of the SNOT‐22 when using a specific item for the sense of taste instead of the combined smell/taste item. However, in contrast to using a single item for the sense of smell, we found no left shift of threshold parameters but nearly identical threshold parameters when compared with the combined smell/taste (item 21) item (β range of −0.182 to 2.446) (Fig. 1).
Fig. 1.
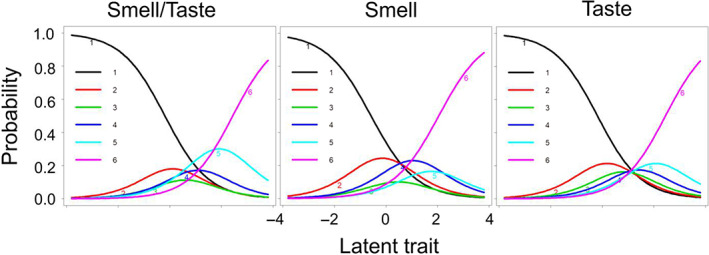
Item response category characteristic curves (ICCs) for the combined smell/taste, the distinct smell, and the distinct taste item. The curves represent each answer category, and the peaks denote the item discriminability [Color figure can be viewed in the online issue, which is available at www.laryngoscope.com.]
Lastly, we evaluated the psychometric properties of the nasal subdomain items when using a separate item for the sense of smell and a separate item for the sense of taste instead of the combined smell/taste item (Table V). Similar to our analysis using a separate item for the sense of smell or taste, we found that the item related to the sense of smell reflects a distinct breadth of CRS disease burden as reflected by lower threshold parameters as compared with the distinct taste or combined smell/taste question (Table V).
TABLE V.
Item Based Information and Percentage Total Information of Individual Smell and Taste Items Within the Nasal Subdomain.
| Total Information | Percentage Total Information (%) | |
|---|---|---|
| Distinct smell item | ||
| Item 1: Need to blow nose | 9.99 | 22.59 |
| Item 3: Runny nose | 8.9 | 20.12 |
| Item 22: Blockage/congestion of nose | 5.46 | 12.34 |
| Item 6: Thick nasal drainage | 5.11 | 11.55 |
| Item 5: Nasal secretion going to your throat | 5.12 | 11.58 |
| Item 2: Sneezing | 5.42 | 12.25 |
| Item 23: Sense of smell | 2.26 | 5.11 |
| Item 4: Cough | 1.97 | 4.46 |
| Total information | 44.22 | |
| Distinct taste item | ||
| Item 1: Need to blow nose | 9.85 | 22.35 |
| Item 3: Runny nose | 8.93 | 20.24 |
| Item 2: Sneezing | 5.51 | 12.49 |
| Item 22: Blockage/congestion of nose | 5.36 | 12.16 |
| Item 5: Nasal secretion going to your throat | 5.09 | 11.53 |
| Item 6: Thick nasal drainage | 4.99 | 11.31 |
| Item 24: Sense of taste | 2.38 | 5.40 |
| Item 4: Cough | 1.99 | 4.51 |
| Total information | 44.1 | |
| Distinct smell and taste items | ||
| Item 1: Need to blow nose | 9.39 | 20.67 |
| Item 3: Runny nose | 7.73 | 17.02 |
| Item 22: Blockage/congestion of nose | 5.85 | 12.88 |
| Item 6: Thick nasal drainage | 5.2 | 11.44 |
| Item 2: Sneezing | 5.11 | 11.25 |
| Item 5: Nasal secretion going to your throat | 4.74 | 10.42 |
| Item 24: Sense of taste | 2.77 | 6.09 |
| Item 23: Sense of smell | 2.72 | 5.99 |
| Item 4: Cough | 1.93 | 4.24 |
Items are ordered according to percentage of total information provided.
DISCUSSION
The most significant impact of CRS on a patient is to decrease QOL, which is primarily due to the symptomatology associated with CRS. 1 , 2 , 33 , 34 , 35 Of all symptoms associated with CRS, nasal symptoms are most prominently perceived by patients, 5 , 6 and it is the change in these nasal symptoms that most determines patients' beliefs in the success of their treatments. 7 , 36 It is therefore of utmost importance that adequate tools, in the form of PROMs, exist to accurately assess and quantify CRS symptom burden—in particular, the burden of nasal symptoms. The SNOT‐22 is widely used around the world—having been translated into over 10 languages—as a high‐quality PROM for assessing CRS symptom burden and CRS‐specific QOL. Although classical test theory methodologies have shown generally excellent psychometric properties for the overall SNOT‐22 as a valid, reliable, and a responsive measure of QOL, 14 , 15 , 37 more recent analysis of the SNOT‐22 using IRT has suggested that several items of the SNOT‐22 do not contribute significant information to reliably discriminate the burden of CRS‐specific QOL. 16 , 17 Surprisingly, the SNOT‐22 item related to problems with the “sense of taste/smell” exhibited quite poor psychometric performance, indicating it as a low‐quality and unreliable item to use toward measuring CRS‐specific QOL. 16 , 17 , 19 Similarly, some items, such as that for “cough” or “dizziness,” are uninformative and therefore unnecessary, whereas other items such as that for “embarrassment” may be redundant and similarly unnecessary. 17 We have hypothesized that this surprising finding related to the “sense of taste/smell” item, which is incongruent with the role of chemosensory dysfunction as a diagnostic criterion for CRS as well as an important driver of decreased QOL, could be partially related to the fact that this one item of the SNOT‐22 attempts to simultaneously assess the senses of smell and taste. In the current study, we tested this hypothesis by studying the psychometric performance of a SNOT‐22 questionnaire that was modified to include separate items for the senses of smell and taste. We found that distinct smell and taste questions did not improve the psychometric function of the SNOT‐22 significantly. However, a separate smell question resulted in a left shift of threshold parameters, covering a range of lower disease severity compared with when using a combined smell/taste question, which was in contrast to a separate taste question that showed similar psychometric properties compared with the combined smell/taste question.
Previous studies have shown that smell and taste, while related, have a complex relationship. 38 The simultaneous assessment of these senses by one item in the SNOT‐22 could very well be confounded by many variables that could introduce uncertainty, variability, and unreliability to its performance as a measure of CRS symptom burden. First, the sense of taste is frequently conflated with the construct of flavor, which is believed to be one of the most complex human behaviors. 38 , 39 Although the sense of flavor involves multiple senses such as the sense of smell, vision, and basic taste (i.e., sweet, sour, salty, and bitter), the olfactory system—and not the gustatory system—is believed to be the major contributor. 38 Second, how patients assess their “sense of taste” may be dynamic and inconsistent from one time point to another. 39 , 40 Moreover, the relation between the problems with the senses of smell and taste are not strictly linear, and problems with each of the senses may not always be perceptible to patients. Patients may experience quite severe problems with the sense of smell without necessarily experiencing problems with the sense of taste. 23 , 41 Indeed, we have previously also shown that patients with smell loss might experience normal flavor perception despite olfactory test results within the dysfunctional range. 22 Finally, it is also possible that the perceived sense of smell decreases linearly with disease severity in CRS while problems with the sense of taste or flavor perception might rather be perceived in a binary fashion (i.e., problems are only noticed in those suffering from the most severe forms of CRS). 41 , 42 All of these conflicts in the perceptions of taste and smell disturbance, as well as interpretations of the “sense of taste/smell” wording, may very well confound the performance of this SNOT‐22 item.
Our study has important implications for PROM design for CRS‐specific QOL. Although the SNOT‐22 is a high‐quality instrument, opportunities for improvement remain. 17 Our previous work has shown that the item for “sense of taste/smell” was among the worst for psychometric performance 16 despite the fact that chemosensory dysfunction is a fundamental (and diagnostic) element of CRS. Our results show that the problem with the chemosensory dysfunction item of the SNOT‐22 is at least in part related to the simultaneous assessment of taste with smell, and that assessment of just olfaction may better capture a more accurate breadth of CRS disease burden related to the sense of smell, which is one of the four major criteria for CRS. 1 , 2 , 43 Future work is necessary to continue to further elucidate the concept of self‐reported chemosensory dysfunction within the SNOT‐22. The extent to which olfactory‐specific PROMs 44 correlate with CRS‐specific outcome measures will be helpful in determining a conceptual framework for defining smell/taste dysfunction in CRS‐related QOL.
CONCLUSION
An olfaction‐ or taste‐specific item, rather than the combined “taste/smell” item currently in the SNOT‐22, does not provide significantly greater psychometric performance. However, a single item for the sense of smell instead of a distinct taste or the combined “taste/smell” item currently on the SNOT‐22 may better capture and reflect moderate CRS disease burden and CRS‐specific QOL. A future revision of the SNOT‐22 may consider utilizing an individual smell item rather than the current “taste/smell” item.
Editor's Note: This Manuscript was accepted for publication on March 16, 2022.
The authors have no funding, financial relationships, or conflicts of interest to disclose.
BIBLIOGRAPHY
- 1. Fokkens WJ, Lund VJ, Hopkins C, et al. European Position Paper on rhinosinusitis and nasal polyps 2020. Rhinology. 2020;58(Supplement 29):1‐464. [DOI] [PubMed] [Google Scholar]
- 2. Orlandi RR, Kingdom TT, Smith TL, et al. International consensus statement on allergy and rhinology: rhinosinusitis 2021. Int Forum Allergy Rhinol. 2021;11:213‐739. [DOI] [PubMed] [Google Scholar]
- 3. Speth MM, Hoehle LP, Phillips KM, Caradonna DS, Gray ST, Sedaghat AR. Changes in chronic rhinosinusitis symptoms differentially associate with improvement in general health‐related quality of life. Ann Allergy Asthma Immunol. 2018;121(2):195‐199. [DOI] [PubMed] [Google Scholar]
- 4. Phillips KM, Talat R, Caradonna DS, Gray ST, Sedaghat AR. Quality of life impairment due to chronic rhinosinusitis in asthmatics is mediated by asthma control. Rhinology. 2019;57(6):430‐435. [DOI] [PubMed] [Google Scholar]
- 5. Sedaghat AR, Hoehle LP, Gray ST. Chronic rhinosinusitis control from the patient and physician perspectives. Laryngoscope Investig Otolaryngol. 2018;3(6):419‐433. [DOI] [PMC free article] [PubMed] [Google Scholar]
- 6. Phillips KM, Hoehle LP, Caradonna DS, Gray ST, Sedaghat AR. Determinants of noticeable symptom improvement despite sub‐MCID change in SNOT‐22 score after treatment for chronic rhinosinusitis. Int Forum Allergy Rhinol. 2019;9(5):508‐513. [DOI] [PubMed] [Google Scholar]
- 7. Mattos JL, Rudmik L, Schlosser RJ, et al. Symptom importance, patient expectations, and satisfaction in chronic rhinosinusitis. Int Forum Allergy Rhinol. 2019;9(6):593‐600. [DOI] [PMC free article] [PubMed] [Google Scholar]
- 8. Rosenfeld RM, Piccirillo JF, Chandrasekhar SS, et al. Clinical practice guideline (update): adult sinusitis. Otolaryngol ‐ Head Neck Surg (United States). 2015;152(2 Suppl):S1‐S39. [DOI] [PubMed] [Google Scholar]
- 9. Hoehle LP, Philips KM, Bergmark RW, Caradonna DS, Gray ST, Sedaghat AR. Symptoms of chronic rhinosinusitis differentially impact general health‐related quality of life. Rhinology. 2016;54(4):316‐322. [DOI] [PubMed] [Google Scholar]
- 10. Talat R, Speth MM, Gengler I, et al. Chronic rhinosinusitis patients with and without polyps experience different symptom perception and quality of life burdens. Am J Rhinol Allergy. 2020;34(6):742‐750. [DOI] [PubMed] [Google Scholar]
- 11. Hoehle LP, Speth MM, Phillips KM, et al. Association between symptoms of allergic rhinitis with decreased general health‐related quality of life. Am J Rhinol Allergy. 2017;31(4):235‐239. [DOI] [PubMed] [Google Scholar]
- 12. Croy I, Nordin S, Hummel T. Olfactory disorders and quality of life‐an updated review. Chem Senses. 2014;39(3):185‐194. [DOI] [PubMed] [Google Scholar]
- 13. Keller A, Malaspina D. Hidden consequences of olfactory dysfunction: a patient report series. BMC Ear Nose Throat Disord. 2013;13:8. [DOI] [PMC free article] [PubMed] [Google Scholar]
- 14. Hopkins C, Gillett S, Slack R, Lund VJ, Browne JP. Psychometric validity of the 22‐item Sinonasal Outcome Test. Clin Otolaryngol. 2009;34(5):447‐454. [DOI] [PubMed] [Google Scholar]
- 15. Rudmik L, Hopkins C, Peters A, Smith TL, Schlosser RJ, Soler ZM. Patient‐reported outcome measures for adult chronic rhinosinusitis: a systematic review and quality assessment. J Allergy Clin Immunol. 2015;136(6):1532‐1540. [DOI] [PubMed] [Google Scholar]
- 16. Liu DT, Philips KM, Speth MM, Besser G, Mueller CA, Sedaghat AR. Item response theory for psychometric properties of the SNOT‐22 (22‐item Sino‐Nasal Outcome Test). Otolaryngol ‐ Head Neck Surg. 2022;166:580‐588. [DOI] [PubMed] [Google Scholar]
- 17. Liu DT, Phillips KM, Speth MM, Besser G, Mueller CA, Sedaghat AR. Exploring possibilities for shortening the 22‐item Sino‐Nasal Outcome Test (SNOT‐22) using item response theory. Int Forum Allergy Rhinol. Forthcoming. 2022;12(2):191‐199. [DOI] [PubMed] [Google Scholar]
- 18. Feng AL, Wesely NC, Hoehle LP, et al. A validated model for the 22‐item Sino‐Nasal Outcome Test subdomain structure in chronic rhinosinusitis. Int Forum Allergy Rhinol. 2017;7(12):1140‐1148. [DOI] [PubMed] [Google Scholar]
- 19. Crump RT, Liu G, Janjua A, Sutherland JM. Analyzing the 22‐item Sino‐Nasal Outcome Test using item response theory. Int Forum Allergy Rhinol. 2016;6(9):914‐920. [DOI] [PubMed] [Google Scholar]
- 20. DeConde AS, Bodner TE, Mace JC, Smith TL. Response shift in quality of life after endoscopic sinus surgery for chronic rhinosinusitis. JAMA Otolaryngol ‐ Head Neck Surg. 2014;140(8):712‐719. [DOI] [PMC free article] [PubMed] [Google Scholar]
- 21. Liu DT, Besser G, Prem B, et al. Association between orthonasal olfaction and chemosensory perception in patients with smell loss. Laryngoscope. 2020;130(9):2213‐2219. [DOI] [PMC free article] [PubMed] [Google Scholar]
- 22. Liu DT, Besser G, Renner B, Seyferth S, Hummel T, Mueller CA. Retronasal olfactory function in patients with smell loss but subjectively normal flavor perception. Laryngoscope. 2020;130(7):1629‐1633. [DOI] [PMC free article] [PubMed] [Google Scholar]
- 23. Stinton N, Atif MA, Barkat N, Doty RL. Influence of smell loss on taste function. Behav Neurosci. 2010;124(2):256‐264. [DOI] [PubMed] [Google Scholar]
- 24. Phillips KM, Hoehle L, Bergmark RW, Caradonna DS, Gray ST, Sedaghat AR. Reversal of smoking effects on chronic rhinosinusitis after smoking cessation. Otolaryngol ‐ Head Neck Surg (United States). 2017;157(4):737‐742. [DOI] [PubMed] [Google Scholar]
- 25. Hoehle LP, Phillips KM, Caradonna DS, Gray ST, Sedaghat AR. A contemporary analysis of clinical and demographic factors of chronic rhinosinusitis patients and their association with disease severity. Ir J Med Sci (1971 ‐). 2017. 1871 [Internet]. Cited September 25, 2021;187(1):215‐221. 10.1007/s11845-017-1639-3. [DOI] [PubMed] [Google Scholar]
- 26. Lund VJ, Kennedy DW. Quantification for staging sinusitis. The Staging and Therapy Group. Ann Otol Rhinol Laryngol Suppl. 1995;167:17‐21. [PubMed] [Google Scholar]
- 27. Sedaghat AR, Gray ST, Caradonna SD, Caradonna DS. Clustering of chronic rhinosinusitis symptomatology reveals novel associations with objective clinical and demographic characteristics. Am J Rhinol Allergy. 2015;29(2):100‐105. [DOI] [PubMed] [Google Scholar]
- 28. Hambleton RK, Jones RW. Comparison of classical test theory and item response theory and their applications to test development. Educ Meas Issues Pract. 1993;12(3):38‐47. [Google Scholar]
- 29. Embretson SE. The new rules of measurement. Psychol Assess. 1996;8(4):341‐349. [Google Scholar]
- 30. Baker FB. The Basics of Item Response Theory. 2nd ed. University of Maryland: ERIC Clearinghouse on Assessment and Evaluation; 2001:186. [Google Scholar]
- 31. Rizopoulos D. Itm: an R package for latent variable modeling and item response theory analyses. J Stat Softw. 2006;17(5):1‐25. [Google Scholar]
- 32. Toma S, Hopkins C. Stratification of SNOT‐22 scores into mild, moderate or severe and relationship with other subjective instruments. Rhinology. 2016;54(2):129‐133. [DOI] [PubMed] [Google Scholar]
- 33. Phillips KM, Hoehle LP, Bergmark RW, Caradonna DS, Gray ST, Sedaghat AR. Acute exacerbations mediate quality of life impairment in chronic rhinosinusitis. J Allergy Clin Immunol Pract. 2017;5(2):422‐426. [DOI] [PubMed] [Google Scholar]
- 34. Phillips KM, Speth MM, Shu ET, et al. Validity of systemic antibiotics and systemic corticosteroid usage for chronic rhinosinusitis as metrics of disease burden. Rhinology. 2020;58(3):194‐199. [DOI] [PubMed] [Google Scholar]
- 35. Speth MM, Gaudin RA, Hoehle LP, et al. Reciprocal predictive accuracy of sinonasal symptom severity, nasal endoscopy, and frequency of past chronic rhinosinusitis exacerbations. Otolaryngol ‐ Head Neck Surg. 2018;159(4):766‐773. [DOI] [PubMed] [Google Scholar]
- 36. Speth MM, Phillips KM, Hoehle LP, Caradonna DS, Gray ST, Sedaghat AR. Longitudinal improvement in nasal obstruction symptoms of chronic rhinosinusitis directly associates with improvement in mood. Eur Arch Oto‐Rhino‐Laryngol. 2019;276(10):2827‐2833. [DOI] [PubMed] [Google Scholar]
- 37. Phillips KM, Hoehle LP, Caradonna DS, Gray ST, Sedaghat AR. Minimal clinically important difference for the 22‐item Sinonasal Outcome Test in medically managed patients with chronic rhinosinusitis. Clin Otolaryngol. 2018;43(5):1328‐1334. [DOI] [PubMed] [Google Scholar]
- 38. Shepherd GM. Smell images and the flavour system in the human brain. Nature. 2006;444(7117):316‐321. [DOI] [PubMed] [Google Scholar]
- 39. Rozin P. “Taste‐smell confusions” and the duality of the olfactory sense. Percept Psychophys. 1982;31(4):397‐401. [DOI] [PubMed] [Google Scholar]
- 40. Osawa Y, Ellen R. The cultural cognition of taste term conflation. Senses Soc. 2014;9(1):72‐91. [Google Scholar]
- 41. Liu DT, Besser G, Prem B, et al. Self‐perceived taste and flavor perception: associations with quality of life in patients with olfactory loss. Otolaryngol ‐ Head Neck Surg. 2021;164(6):1330‐1336. [DOI] [PubMed] [Google Scholar]
- 42. Landis BN, Frasnelli J, Reden J, Lacroix JS, Hummel T. Differences between orthonasal and retronasal olfactory functions in patients with loss of the sense of smell. Arch Otolaryngol ‐ Head Neck Surg. 2005;131(11):977‐981. [DOI] [PubMed] [Google Scholar]
- 43. McCann AC, Trope M, Walker VL, et al. Olfactory dysfunction is not a determinant of patient‐reported chronic rhinosinusitis disease control characteristics of study participants. Laryngoscope. 2021;131(7):E2116‐E2120. [DOI] [PubMed] [Google Scholar]
- 44. Frasnelli J, Hummel T. Olfactory dysfunction and daily life. Eur Arch Oto‐Rhino‐Laryngol. 2005;262(3):231‐235. [DOI] [PubMed] [Google Scholar]