

Abstract
Objectives
To assess a new application of artificial intelligence for real‐time detection of laryngeal squamous cell carcinoma (LSCC) in both white light (WL) and narrow‐band imaging (NBI) videolaryngoscopies based on the You‐Only‐Look‐Once (YOLO) deep learning convolutional neural network (CNN).
Study Design
Experimental study with retrospective data.
Methods
Recorded videos of LSCC were retrospectively collected from in‐office transnasal videoendoscopies and intraoperative rigid endoscopies. LSCC videoframes were extracted for training, validation, and testing of various YOLO models. Different techniques were used to enhance the image analysis: contrast limited adaptive histogram equalization, data augmentation techniques, and test time augmentation (TTA). The best‐performing model was used to assess the automatic detection of LSCC in six videolaryngoscopies.
Results
Two hundred and nineteen patients were retrospectively enrolled. A total of 624 LSCC videoframes were extracted. The YOLO models were trained after random distribution of images into a training set (82.6%), validation set (8.2%), and testing set (9.2%). Among the various models, the ensemble algorithm (YOLOv5s with YOLOv5m—TTA) achieved the best LSCC detection results, with performance metrics in par with the results reported by other state‐of‐the‐art detection models: 0.66 Precision (positive predicted value), 0.62 Recall (sensitivity), and 0.63 mean Average Precision at 0.5 intersection over union. Tests on the six videolaryngoscopies demonstrated an average computation time per videoframe of 0.026 seconds. Three demonstration videos are provided.
Conclusion
This study identified a suitable CNN model for LSCC detection in WL and NBI videolaryngoscopies. Detection performances are highly promising. The limited complexity and quick computational times for LSCC detection make this model ideal for real‐time processing.
Level of Evidence
3 Laryngoscope, 132:1798–1806, 2022
Keywords: Larynx cancer, deep learning, narrow band imaging, computer‐assisted image interpretation, videolaryngoscopy
INTRODUCTION
Laryngeal squamous cell carcinoma (LSCC) is an epithelial cancer arising from the respiratory mucosal lining of the larynx. Early detection of LSCC is mandatory to increase survival rates and reduce the morbidity caused by treatments that are needed for advanced‐stage disease. Identification of LSCC usually starts in the otolaryngologist's office by flexible transnasal fiberoptic endoscopy. High‐definition (HD) videolaryngoscopy has recently replaced standard fiberoptic endoscopy, as it offers better accuracy in detection and videorecording of laryngeal lesions. 1 Nevertheless, the white light (WL) endoscopic appearance of LSCCs may be nonspecific, and preoperative clinical assessment is not always in agreement with the final histopathologic diagnosis. 2 Bioendoscopy can overcome such limitations, by aiding in the identification of tumoral neoangiogenesis associated with the development of malignant lesions. 3 In particular, narrow‐band imaging (NBI) is an established optical technique that improves diagnosis of malignant lesions by enhancing submucosal neoangiogenic changes, designing thick dark spots that can be observed within and surrounding the malignant lesion itself. 4 Consequently, the use of HD videolaryngoscopy in combination with NBI allows more effective and earlier detection of LSCC. 5 However, the current exploitation of this technology in less experienced centers is burdened by its operator‐dependent nature, being influenced by the frequency of its use and related expertise in endoscopy. Moreover, this technique suffers from a relatively long learning curve 6 and is hampered by intrinsic limitations such as subjectivity in interpretation, attention, and visual inspection capabilities.
Computer‐aided systems can exploit artificial intelligence (AI) through machine and deep learning (DL) techniques such as convolutional neural networks (CNNs) for automatic disease detection and diagnoses. In CNNs, a progression of network layers is trained to learn a hierarchy of features from data (input images), from which specific patterns are recognized and correlated with defined outcomes or parameters (output detection or diagnosis). Notably, CNNs have been demonstrated to be particularly suitable for computer vision, especially in image interpretation. 7 Consequently, computer‐aided detection (CADe) and diagnosis (CADx) of diseases powered by trustworthy CNNs could increase the future impact of videolaryngoscopy coupled with NBI in large‐scale LSCC screenings performed on populations living even at a distance from tertiary academic centers. In this article, we explore the possibility of applying DL for real‐time detection of LSCC on WL and NBI videolaryngoscopies. Specifically, we focused on evaluating the performance of trained CADe DL models, identifying an appropriate configuration, and assessing its feasibility in real‐time automatic detection of LSCC in videoendoscopy.
MATERIALS AND METHODS
Data Acquisition
A retrospective study was conducted under the approval of the IRCCS Ospedale Policlinico San Martino institutional ethics committee (CER Liguria: 230/2019) following the principles of the Declaration of Helsinki. It included patients treated between 2014 and 2019 at the Unit of Otorhinolaryngology–Head and Neck Surgery at the IRCSS Ospedale Policlinico San Martino, Genoa, Italy. Selection criteria included histologically proven diagnosis of LSCC and the presence of at least one recorded video of the original laryngoscopy at the time of diagnosis. All patients were first examined through transnasal videolaryngoscopy (HD Video Rhino‐laryngoscope Olympus ENF‐VH—Olympus Medical System Corporation, Tokyo, Japan) in the office before treatment. For those submitted to transoral laryngeal microsurgery, an adjunctive intraoperative evaluation by rigid endoscopy was performed using 0°, 30°, and 70° telescopes coupled to a CCD Camera Head connected to a Visera Elite CLV‐S190 light source (Olympus Medical System Corporation). In both settings, a thorough examination was conducted under HD WL videoendoscopy and then switching to NBI. For each patient enrolled, the available videolaryngoscopies were reviewed, and several frames were extracted. If accessible, one WL frame and one NBI frame were selected from the videos of each patient. These frames were carefully chosen to ensure the selection of good‐quality and steady images that provided a clear visualization of the tumor. Afterward, expert physicians segmented and labeled each frame using the VGG Image Annotator (VIA) 2.0 (https://www.robots.ox.ac.uk/~vgg/software/via/), an open‐source web‐based software. Each tumor image was marked with a bounding box (BB) encompassing the entire cancer visible surface extension and labeled as LSCC according to the histology: if multiple lesions were present, multiple BB were added. Lastly, six unedited preoperative videolaryngoscopies were selected for testing the real‐time LSCC detection performance of the trained model.
Preprocessing
Since the contrast under WL and NBI is sometimes suboptimal, in order to improve the texture detail of input images (and consequently the information given to the DL algorithm during the training phase) contrast limited adaptive histogram equalization (CLAHE) 8 methodology was applied to the original dataset of images. Figure 1 shows the output WL and NBI images obtained after CLAHE enhancement.
Fig 1.

Laryngeal cancer dataset sample images. The left column contains the original narrow‐band imaging (NBI) and white light (WL) laryngoscopy images, while in the right column the same frames are shown after applying the contrast limited adaptive histogram equalization. Case A is an in‐office WL view of an infrahyoid epiglottic cancer. Case B is an in‐office NBI videoframe of a left vocal fold cancer extending to the anterior commissure. Case C is an intraoperative WL videoframe of a right vocal fold cancer. Case D is an intraoperative NBI view of a left vocal fold cancer extending to the bottom of the ventricle.
Data Augmentation
Data augmentation is a standard methodology used in DL. It consists in modifying or mixing already existing images to artificially create new training data, which can help increasing the reliability of the model. The data augmentation techniques used include image contrast, hue, brightness, saturation, and noise adjustments, geometric transformation such as rotation, randomized scaling, cropping, and flipping of images. Finally, mosaic data augmentation, which superimposes different images to create a new one allowing the model to recognize objects in a variety of settings and sizes, was implemented. Data augmentation was directly performed with the selected DL architecture.
DL Model Development and Testing
The state‐of‐the‐art You Only Look Once (YOLO) DL detection model, 9 an open‐source software based on CNNs, was chosen as it offers optimal detection accuracy coupled with acceptable computational complexity. YOLO is a single‐stage DL object detector, which is capable of identifying objects by framing them in a BB and, at the same time, classifying them according to the probability to belong to a given class. The software architecture is summarized in Figure 2. The most recent release of YOLO, at the time of our analysis, was version 5.0 (YOLOv5). 10 The feature extractor that characterizes the backbone of YOLOv5 is CSP Darknet, 11 which is a reduced‐size CNN possessing high accuracy and superior inference speed. These characteristics led us to choose YOLOv5 over other DL approaches.
Fig 2.

YOLOv5 architecture representation.
YOLOv5 comprises four different models, differing in number of parameters, trainable weights size, and computation times. The models range from small to extra‐large versions (YOLOv5s, YOLOv5m, YOLOv5l, and YOLOv5x), and two released variants are available (YOLOv5s6 and YOLOv5m6). After the training phase with the image dataset, the models were tested to identify the most efficient one in terms of LSCC detection performance and computational time. Finally, the best performing model in this test phase was employed in six unseen and unedited videolaryngoscopies to evaluate its automatic LSCC detection performance and recording computation times.
The training, validation, and testing hardware environment consisted of a single Tesla T4 GPU with 16 GB of RAM, as well as an Intel(R) Xeon(R) CPU running at 2.20 GHz for DL. YOLOv5 was implemented using a torch 1.8.1 + cu101 CUDA, executed via 13 GB of memory. The hyperparameters used to train all the YOLO models are the following: number of epochs 100; batch size ranging from 8 to 64; input image 640 × 640 pixels and 1,280 × 1,280 pixels; initial and final learning rate l 0 = 0.01 and l f = 0.2, respectively; momentum 0.337; weight decay 0.0005; threshold level to show BB on video validation analysis 0.4.
Outcome Analysis
Statistics and metrics were calculated with the same software environment mentioned above. Precision‐Recall curves were used to assess detection performances. 12 , 13 As described in the literature, 14 a true positive (TP) was defined when the Intersection over Union (IoU) of the BBs (Figure 3) was greater or equal to 0.5:
where BBgroundTruth is the BB surrounding the segmented area provided by the expert physicians, and BBdetected is the BB detected by the algorithm. Results with IoU < 0.5 or duplicated BB were, therefore, classified as false positive (FP). False negatives (FN) were defined when no detection occurred in presence of a ground truth classified object. A true negative (TN) can be defined as every part of the image where there is no ground truth object and no prediction happens, but this metrics is not useful for the specific case of object detection. Therefore, TN values were ignored.
Fig 3.

Graphical representation of the Intersection over Union (IoU) calculation on a narrow‐band imaging videoframe. The light blue rectangle represents the ground truth bounding box, while the red rectangle represents the model prediction. The IoU is calculated by dividing the overlap area by the total area of union.
The Recall of a given class, which corresponds to the system's sensitivity, is expressed as:
The system's Precision in detecting a given feature, which corresponds to its positive predicted value, is calculated as:
For object detection applications, mean Average Precision (mAP) is a standard performance metric. The mAP is the area under the Precision‐Recall curve and is defined by the equation:
where Q is the number of queries in the set, and AveP(q) is the average precision for a given query, q. In our case, as we set the model threshold as 0.5 (at IoU = 0.5), mAP@.5 denotes that this value was achieved under the condition of IoU ≥ 0.5.
RESULTS
Two hundred and nineteen patients with a mean age of 67.9 years (SD ± 11.8 years) were enrolled. Among these, 196 (89.4%) were males and 23 (10.6%) females. A total of 657 frames representing LSCC were extracted from videolaryngoscopies. Of those, 172 were WL in‐office images, 146 WL intraoperative, 178 NBI in‐office, 128 NBI intraoperative, and 33 images not containing LSCC.
The YOLO CNNs models were trained after random distribution of the images into a training set, a validation set, and a test set. The training set consisted of 543 (82.6%) images, of which 256 were WL, 254 NBI, and 33 were from healthy tissues to help to reduce the false detection rate of the model. The validation set consisted of 54 (8.2%) images composed of 32 images in WL and 22 in NBI. Finally, the test set consisted of 60 randomly selected images (9.2% of total images), 30 in WL and 30 in NBI. In addition, six unedited and unsubmitted videos were used to simulate real‐time LSCC detection.
The comparison of YOLO results during training‐validation and testing are shown in Table I, while the evolution of their performance metrics during training are represented in Figure 4. The lightest CNNs models (with fewer parameters) performed very well on our dataset. On the other hand, the more complex models showed signs of overfitting the data, resulting in a higher number of FP.
TABLE I.
Performance Evaluation of Various YOLO Models During Training‐Validation and the Testing Phase.
| Training and Validation | ||||||
|---|---|---|---|---|---|---|
| Model | Batch Size (N° of Samples) | Image Resolution (Pixel) | Parameters of the Model (Millions) | Precision | Recall | mAP@.5 |
| YOLOv5s | 64 | 640 × 640 | 7.06 | 0.712 | 0.538 | 0.576 |
| YOLOv5m | 32 | 640 × 640 | 21.0 | 0.561 | 0.590 | 0.576 |
| YOLOv5l | 16 | 640 × 640 | 46.6 | 0.585 | 0.615 | 0.545 |
| YOLOv5x | 16 | 640 × 640 | 87.3 | 0.55 | 0.628 | 0.571 |
| YOLOv5s6 | 16 | 1280 × 1280 | 12.4 | 0.697 | 0.474 | 0.492 |
| YOLOv5m6 | 8 | 1280 × 1280 | 35.5 | 0.66 | 0.474 | 0.506 |
| Testing | ||||||
|---|---|---|---|---|---|---|
| Model | Trained Weight (Mbs) | TP% | FP% | Precision | Recall | mAP@.5 |
| YOLOv5s | 14.4 | 56 | 44 | 0.582 | 0.609 | 0.592 |
| YOLOv5m | 42.5 | 59 | 41 | 0.580 | 0.621 | 0.554 |
| YOLOv5l | 93.7 | 56 | 44 | 0.555 | 0.621 | 0.564 |
| YOLOv5x | 175 | 54 | 46 | 0.542 | 0.586 | 0.502 |
| YOLOv5s6 | 25.2 | 63 | 33 | 0.608 | 0.609 | 0.581 |
| YOLOv5m6 | 71.5 | 57 | 43 | 0.452 | 0.598 | 0.527 |
| YOLOv5s—TTA | 14.4 | 78 | 22 | 0.662 | 0.586 | 0.630 |
| YOLOv5m—TTA | 42.5 | 76 | 24 | 0.677 | 0.563 | 0.610 |
| Ensemble YOLOv5s with YOLOv5m—TTA | 14.4, 42.5 | 82 | 18 | 0.664 | 0.621 | 0.627 |
Values in bold denote the best results during testing.
mAP@.5 = mean Average Precision with an Intersection over Union threshold of 0.5; TP% = rate of true positive predicted bounding boxes among the total number of bounding boxes predicted; FP% = rate of false‐positive predicted bounding boxes among the total number of bounding boxes predicted; TTA = test time augmentation.
Fig 4.
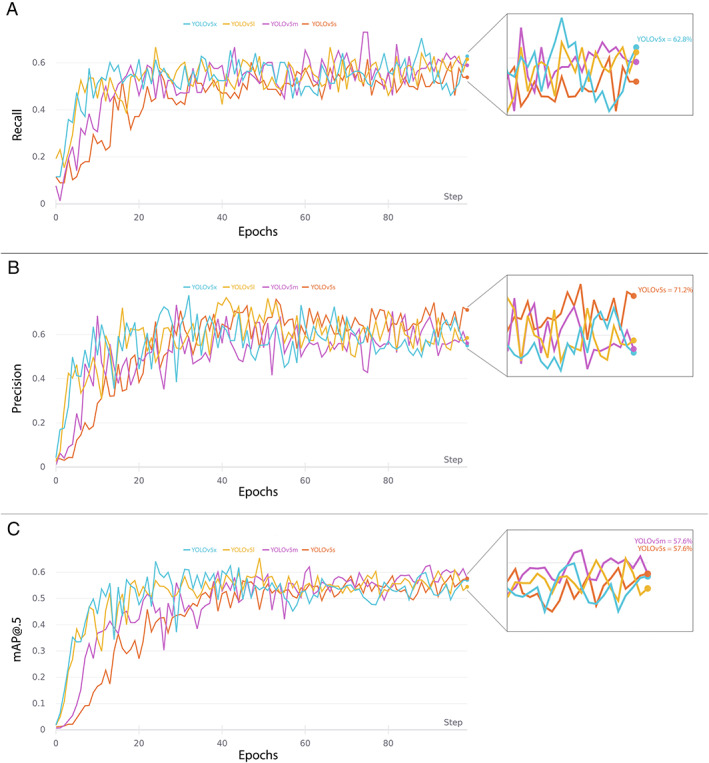
YOLO models performance metrics during training and validation. (A), (B), and (C), respectively, represent Recall, Precision, and mAP@0.5 (mean Average Precision at 0.5 intersection over union) curves trained up to 100 epochs.
This study also included an assessment of the test time augmentation (TTA) technique. This is a popular strategy used with DL models to increase detection performance. 15 TTA consists in performing inference on multiple altered versions of the same image, so that the predictions are subsequently aggregated to obtain higher detection performances. Here, this method was applied only on YOLOv5s and YOLOv5m as these models outperformed the others during training and validation. Finally, to further increase detection rates during testing, an ensemble model was implemented combining the two best‐performing models along with the TTA technique (YOLOv5s with YOLOv5m—TTA). As reported in Table I, this ensemble model increased the overall performances in testing compared to the other models, as it localized LSCC very close to the ground truth images: in particular, 82.0% of the predicted BB resulted to be TP, while only 18.0% were FN. Examples of BB indicating the location of LSCC according to the ground‐truth labeled images and the ensemble model predictions are shown in Figure 5.
Fig 5.

Examples of automatic laryngeal cancer prediction provided by the ensemble model (YOLOv5s with YOLOv5m—TTA). The first two columns on the left contain images with ground truth bounding boxes, while the two columns on the right contain the same images with YOLO‐predicted bounding boxes. Case A is a carcinoma of the infrahyoid epiglottis; case B is a carcinoma of the infrahyoid epiglottis; case C is a carcinoma of the left vocal fold; case D is a carcinoma of the right vocal fold involving the anterior commissure.
For the testing on video streams, the study focused only on computation times to understand if the DL model could be implemented for real‐time detection. The only CNN model used here was the TTA‐ensemble model, as it was the best performing model based on the results presented above. The model ran with an average processing time per frame of 0.026 seconds. The characteristics of each video and the respective DL model computation times are reported in Table II. For illustration purposes, selected frames from the original videos and the corresponding frames processed by the DL model are shown in Figure 6. In addition, the supplementary online material includes three examples of video streams processed by this model (Supporting Videos [Link], [Link], [Link]).
TABLE II.
Characteristics and Computation Times of the Testing Videos After Applying the Ensemble Model (YOLOv5s with YOLOv5m—TTA) for LSCC Detection.
| Video ID | Size (Mb) | Video Format | Video Resolution | Video Frame Rate (fps) | Total Frame Count | LSCC | Average Computation Time Per Frame (s) |
|---|---|---|---|---|---|---|---|
| 1 | 23.1 | avi | 768 × 576 | 30 | 1321 | Yes | 0.027 |
| 2 | 25.3 | mp4 | 778 × 480 | 25 | 1448 | Yes | 0.034 |
| 3 | 34.9 | avi | 768 × 576 | 30 | 1529 | Yes | 0.025 |
| 4 | 20.6 | mp4 | 778 × 480 | 25 | 1421 | Yes | 0.023 |
| 5 | 27.3 | mp4 | 860 × 480 | 25 | 1519 | Yes | 0.024 |
| 6 | 39.1 | mp4 | 1280 × 720 | 30 | 946 | No | 0.028 |
| Average computation time | 0.026 | ||||||
fps = frame per second; LSCC = laryngeal squamous cell carcinoma; Mb = megabytes; TTA = test time augmentation.
Fig 6.
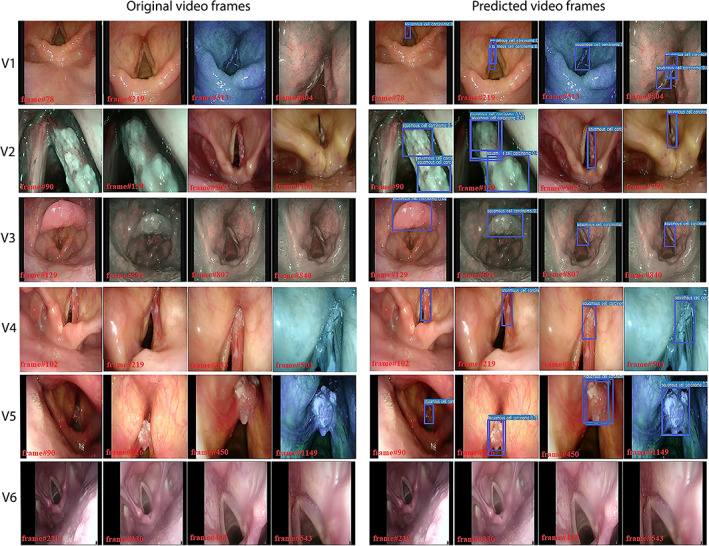
Panel of testing videoframes extracted from six videolaryngoscopies. Each row represents a different video: the first four pictures of every row are extracted from the original video, while the last four images are the same frames extracted after the prediction of the ensemble model (YOLOv5s with YOLOv5m—TTA). The first video (V1) shows a carcinoma of the left vocal fold; the second video (V2) shows a cancer of the right vocal fold; images extracted from the third video (V3) show a carcinoma affecting the laryngeal surface of the suprahyoid epiglottis and a severe dysplasia of the right vocal fold. Lastly, V4 shows a carcinoma of the right vocal fold extending to the anterior commissure, V5 shows a tumor of the left vocal fold, while V6 shows frames extracted from a healthy larynx.
DISCUSSION
In recent years, the use of AI in medicine has been rising exponentially. In particular, the application of CADe and CADx systems to videoendoscopy has been explored in the field of gastroenterology to detect areas of mucosal inflammation, polyps, precancerous, and cancerous lesions. 16 Conversely, to our knowledge, there are only a few reports in the present literature regarding cancers of the upper aerodigestive tract (UADT), making it an emerging field of research. 17 , 18 , 19 , 20 , 21 , 22 Among these, the most large reports regarding LSCC are those from Xiong et al. 21 and Ren et al., 22 who applied CADx to classify precancerous and cancerous laryngeal lesions, with both reporting very high values of sensitivity and specificity. Nevertheless, these studies investigate the use of DL models only with WL endoscopy. It is our belief, however, that modern laryngological workup should not be performed without a bioendoscopic approach such as that allowed by the use of NBI. This technology, in fact, has demonstrated a tremendous impact on LSCC diagnosis, intraoperative definition of excisional margins, and post‐treatment follow‐up. 23 , 24 In this context, our models were trained and tested with a mixed dataset of WL and NBI images to obtain a reliable algorithm that is capable of providing a fluid experience while switching between WL and NBI during real‐time videolaryngoscopy.
In this regard, to our knowledge, only three studies have explored NBI imaging applied to AI in the UADT. A promising pilot study by Mascharak et al. aimed to investigate if NBI imaging evaluation was feasible for machine learning CADx in oropharyngeal carcinoma. 17 Even with a very limited cohort (30 patients), they demonstrated the superiority of NBI compared to WL in detecting this type of neoplasm, reporting a specificity of 70.0% versus 52.4%, and a sensibility of 70.9% versus 47.0%, respectively. Paderno et al. more recently applied different CNNs to the automated segmentation of WL and NBI frames of the oral cavity and oropharyngeal neoplastic lesions, obtaining accuracy rates similar to those reported herein. 18 Finally, Inaba and colleagues reported rates of sensitivity, specificity, and accuracy of 95.5%, 98.4%, and 97.3%, respectively, in the diagnosis of very small cancerous lesions arising from the mucosa of the UADT while performing esophagogastroduodenoscopy. 25 However, they focused mainly on hypopharyngeal carcinoma using only NBI images, while the only laryngeal subsite examined (epiglottis) was the worst‐performing in terms of sensitivity (85.7%). Nevertheless, as stated, the implementation of NBI in the development of the DL algorithm led to an enhancement of tumor visibility, thus helping their model to better recognize neoplasms. This also explains the promising detection performance reached by our pilot CADe models, which will likely improve as our training dataset grows.
One of the main focuses of this work was to explore the feasibility of the CADe in real‐time videolaryngoscopy, a topic rarely investigated in the literature so far. Actually, the validation performed on video streams was possible, thanks to the low computational time required by the YOLO ensemble model, requiring only 26 milliseconds to analyze one videoframe. Considering that videolaryngoscopies typically range from 25 to 30 frame‐per‐second, with its average computing time of 38.5 frames‐per‐second, the model was capable of achieving real‐time processing performances. Differing from UADT, real‐time CADe technology has already been implemented in the detection of mucosal abnormalities in gastroenterology with similar computing times. 26 , 27 Of note, algorithms that are able to perform in real‐time necessarily require a reduction in terms of complexity. In fact, as shown by Cho et al., models characterized by a high number of parameters, even if performing remarkably (reported accuracy of 99.7%), failed to perform in real‐time, therefore, needing to limit the inference process to one image every five frames. 20
On the other hand, our model, even if it successfully identified LSCC in videos with good inference and reduced computation time, occasionally detected FP objects. This happened since LSCC comes in a variety of forms, colors, textures, and sizes, making the building of a solid DL detection model very demanding. This pilot study allowed us to identify a suitable detection model for real‐time endoscopy implementation while exploring several pre‐processing strategies that can enhance diagnostic performances. The shortcomings of the present study comprise the relatively small LSCC dataset and the exclusion of benign laryngeal lesions. The next phase of this research will be directed to build a solid and trustworthy algorithm by enriching the training dataset with thousands of LSCC frames and a comparable number of images from multiple and heterogeneous benign lesions (vocal polyps, cysts, nodules, papillomas, etc.) both sourced by a multicenter collaboration. Finally, the comparison of this model's detection accuracy with expert physicians will be of paramount importance for definitive validation. A comprehensive model suitable for clinical practice must be validated by rigorous research. We believe these preliminary findings will help other groups progress research in this field.
To our knowledge, this is the first report of AI‐aided UADT cancer detection using YOLO. This DL model proved to be suitable to detect LSCC on both images and videos with adequate performance in real‐time applications. Our ensemble model demonstrated the best LSCC detection performance in terms of precision, recall, and mAP@.5. From a technical point of view, we underline that pre‐processing techniques like CLAHE can be critical in fields like endoscopy where the quality of video images is often suboptimal. On the other hand, data augmentation processes should be used extensively to help the model to learn to identify heterogeneous lesions such as LSCCs. Indeed, implementing these techniques in the DL framework leads to higher accuracy performances. In addition, the TTA methodology assessed in this study also enhanced the inference power of the original YOLO model, leading to increased TP rate. Therefore, it represents another promising strategy for future algorithms.
CONCLUSION
The YOLO ensemble model proved to be efficient in detecting LSCC in videolaryngoscopies. The remarkable computational times could represent the keystone in employing the YOLO ensemble model for real‐time LSCC detection in the near future. The availability of NBI images to feed the algorithm represented a pivotal point to reach the detection performances observed, even considering the small training set used in this study. Our model represents a promising algorithm that is expected to reach even higher detection performances with the same short computational time if trained on an expanded image dataset.
Supporting information
Supporting Video 1. This in‐office videolaryngoscopy shows the YOLO ensemble model detecting a squamous cell carcinoma of the right vocal cord.
Supporting Video 2. This in‐office videolaryngoscopy shows the YOLO ensemble model detecting a squamous cell carcinoma of the epiglottis and a severe dysplasia/ carcinoma in situ of the right vocal cord.
Supporting Video 3. This in‐office videolaryngoscopy shows a healthy larynx during phonation (negative control) with the implementation of the YOLO model.
ACKNOWLEDGEMENT
Open Access Funding provided by Universita degli Studi di Genova within the CRUI‐CARE Agreement.
[Correction added on May 14, 2022, after first online publication: CRUI‐CARE funding statement has been added.]
Editor's Note: This Manuscript was accepted for publication on 15 November 2021.
m.a.a. and c.s. equally contributed to this work.
The authors have no conflicts of interest to disclose.
BIBLIOGRAPHY
- 1. Scholman C, Westra JM, Zwakenberg MA, et al. Differences in the diagnostic value between fiberoptic and high definition laryngoscopy for the characterisation of pharyngeal and laryngeal lesions: a multi‐observer paired analysis of videos. Clin Otolaryngol 2020;45:119–125. [DOI] [PMC free article] [PubMed] [Google Scholar]
- 2. Eckel HE, Simo R, Quer M, et al. European laryngological society position paper on laryngeal dysplasia part II: diagnosis, treatment, and follow‐up. Eur Arch Otorhinolaryngol 2020;278:1723–1732. [DOI] [PMC free article] [PubMed] [Google Scholar]
- 3. Cesare P, Francesca DB, Giorgio P, Piero N. “Biologic endoscopy”: optimization of upper aerodigestive tract cancer evaluation. Curr Opin Otolaryngol Head Neck Surg 2011;19:67–76. [DOI] [PubMed] [Google Scholar]
- 4. Arens C, Piazza C, Andrea M, et al. Proposal for a descriptive guideline of vascular changes in lesions of the vocal folds by the committee on endoscopic laryngeal imaging of the European laryngological society. Eur Arch Otorhinolaryngol 2016;273:1207–1214. [DOI] [PubMed] [Google Scholar]
- 5. Vilaseca I, Valls‐Mateus M, Nogués A, et al. Usefulness of office examination with narrow band imaging for the diagnosis of head and neck squamous cell carcinoma and follow‐up of premalignant lesions. Head Neck 2017;39:1854–1863. [DOI] [PubMed] [Google Scholar]
- 6. Irjala H, Matar N, Remacle M, Georges L. Pharyngo‐laryngeal examination with the narrow band imaging technology: early experience. Eur Arch Otorhinolaryngol 2011;268:801–806. [DOI] [PubMed] [Google Scholar]
- 7. Tama BA, Kim DH, Kim G, Kim SW, Lee S. Recent advances in the application of artificial intelligence in otorhinolaryngology‐head and neck surgery. Clin Exp Otorhinolaryngol 2020;13:326–339. [DOI] [PMC free article] [PubMed] [Google Scholar]
- 8. Yadav G, Maheshwari S, Agarwal A. Contrast limited adaptive histogram equalization based enhancement for real time video system. Paper presented at: Proc 2014 Int Conf Adv Comput Commun Informatics, ICACCI 2014. Published online November 2014:2392–2397.
- 9. Redmon J, Divvala S, Girshick R, Farhadi A. You only look once: unified, real‐time object detection. Paper presented at: Proc IEEE Comput Soc Conf Comput Vis Pattern Recognit. 2016;2016 December:779–788.
- 10.Ultralytics. YOLOv5. Accessed November 24, 2021. https://github.com/ultralytics/yolov5
- 11. Wang CY, Mark Liao HY, Wu YH, Chen PY, Hsieh JW, Yeh IH. CSPNet: a new backbone that can enhance learning capability of CNN. Paper presented at: IEEE Comput Soc Conf Comput Vis Pattern Recognit Work;2020 June:1571–1580.
- 12. Marie Schrynemackers RK. On protocols and measures for the validation of supervised methods for the inference of biological networks. Front Genet 2013;4:262. [DOI] [PMC free article] [PubMed] [Google Scholar]
- 13. Davis J, Goadrich M. The relationship between precision‐recall and ROC curves. ACM Int Conf Proceeding Ser 2006;148:233–240. [Google Scholar]
- 14. Everingham M, Van Gool L, CKI W, Winn J, Zisserman A. The Pascal visual object classes (VOC) challenge. Int J Comput Vis 2009;88:303–338. [Google Scholar]
- 15. Yap MH, Hachiuma R, Alavi A, et al. Deep learning in diabetic foot ulcers detection: a comprehensive evaluation. Comput Biol Med 2020;135:104596. [DOI] [PubMed] [Google Scholar]
- 16. Min JK, Kwak MS, Cha JM. Overview of deep learning in gastrointestinal endoscopy. Gut Liver 2019;13:388–393. [DOI] [PMC free article] [PubMed] [Google Scholar]
- 17. Mascharak S, Baird BJ, Holsinger FC. Detecting oropharyngeal carcinoma using multispectral, narrow‐band imaging and machine learning. Laryngoscope 2018;128:2514–2520. [DOI] [PubMed] [Google Scholar]
- 18. Paderno A, Piazza C, Del Bon F, et al. Deep learning for automatic segmentation of oral and oropharyngeal cancer using narrow band imaging: preliminary experience in a clinical perspective. Front Oncol 2021;11:1–12. [DOI] [PMC free article] [PubMed] [Google Scholar]
- 19. Esmaeili N, Illanes A, Boese A, et al. Laryngeal lesion classification based on vascular patterns in contact endoscopy and narrow band imaging: manual versus automatic approach. Sensors (Switzerland) 2020;20:1–12. [DOI] [PMC free article] [PubMed] [Google Scholar]
- 20. Cho WK, Choi SH. Comparison of convolutional neural network models for determination of vocal fold normality in laryngoscopic images. J Voice 2020;20:30292–30297. [DOI] [PubMed] [Google Scholar]
- 21. Xiong H, Lin P, Yu JG, et al. Computer‐aided diagnosis of laryngeal cancer via deep learning based on laryngoscopic images. EBioMedicine 2019;48:92–99. [DOI] [PMC free article] [PubMed] [Google Scholar]
- 22. Ren J, Jing X, Wang J, et al. Automatic recognition of laryngoscopic images using a deep‐learning technique. Laryngoscope 2020;130:E686–E693. [DOI] [PubMed] [Google Scholar]
- 23. Garofolo S, Piazza C, Del Bon F, et al. Intraoperative narrow band imaging better delineates superficial resection margins during transoral laser microsurgery for early glottic cancer. Ann Otol Rhinol Laryngol 2015;124:294–298. [DOI] [PubMed] [Google Scholar]
- 24. Piazza C, Cocco D, De Benedetto L, Del Bon F, Nicolai P, Peretti G. Narrow band imaging and high definition television in the assessment of laryngeal cancer: a prospective study on 279 patients. Eur Arch Otorhinolaryngol 2010;267:409–414. [DOI] [PubMed] [Google Scholar]
- 25. Inaba A, Hori K, Yoda Y, et al. Artificial intelligence system for detecting superficial laryngopharyngeal cancer with high efficiency of deep learning. Head Neck 2020;42:2581–2592. [DOI] [PubMed] [Google Scholar]
- 26. Yang XX, Li Z, Shao XJ, et al. Real‐time artificial intelligence for endoscopic diagnosis of early esophageal squamous cell cancer (with video). Dig Endosc 2020;33:1075–1084. [DOI] [PubMed] [Google Scholar]
- 27. Wang P, Xiao X, Glissen Brown JR, et al. Development and validation of a deep‐learning algorithm for the detection of polyps during colonoscopy. Nat Biomed Eng 2018;2:741–748. [DOI] [PubMed] [Google Scholar]
Associated Data
This section collects any data citations, data availability statements, or supplementary materials included in this article.
Supplementary Materials
Supporting Video 1. This in‐office videolaryngoscopy shows the YOLO ensemble model detecting a squamous cell carcinoma of the right vocal cord.
Supporting Video 2. This in‐office videolaryngoscopy shows the YOLO ensemble model detecting a squamous cell carcinoma of the epiglottis and a severe dysplasia/ carcinoma in situ of the right vocal cord.
Supporting Video 3. This in‐office videolaryngoscopy shows a healthy larynx during phonation (negative control) with the implementation of the YOLO model.