

Abstract
Glacial and interglacial periods throughout the Pleistocene have been substantial drivers of change in species distributions. Earlier analyses suggested that modern grey wolves (Canis lupus) trace their origin to a single Late Pleistocene Beringian population that expanded east and westwards, starting c. 25,000 years ago (ya). Here, we examined the demographic and phylogeographic histories of extant populations around the Bering Strait with wolves from two inland regions of the Russian Far East (RFE) and one coastal and two inland regions of North‐western North America (NNA), genotyped for 91,327 single nucleotide polymorphisms. Our results indicated that RFE and NNA wolves had a common ancestry until c. 34,400 ya, suggesting that these populations started to diverge before the previously proposed expansion out of Beringia. Coastal and inland NNA populations diverged c. 16,000 ya, concordant with the minimum proposed date for the ecological viability of the migration route along the Pacific Northwest coast. Demographic reconstructions for inland RFE and NNA populations reveal spatial and temporal synchrony, with large historical effective population sizes that declined throughout the Pleistocene, possibly reflecting the influence of broadscale climatic changes across continents. In contrast, coastal NNA wolves displayed a consistently lower effective population size than the inland populations. Differences between the demographic history of inland and coastal wolves may have been driven by multiple ecological factors, including historical gene flow patterns, natural landscape fragmentation, and more recent anthropogenic disturbance.
Keywords: Beringia, Canis lupus, climatic fluctuations, demography, Pleistocene, single nucleotide polymorphisms
1. INTRODUCTION
Climatic‐driven environmental changes and geological events profoundly influence species ranges and population demographic processes (Hewitt, 2000). During Pleistocene glacial periods, the expansion of ice sheets, coupled with a global drop in sea levels, led to a substantial increase in the exposure of the continental shelf, connecting previously isolated landmasses. One emblematic example with major consequences for Holarctic species was the exposure of the Bering Land Bridge (BLB), expanding the Beringia region from Eastern Siberia (Russia) to Western Yukon (Canada; Brigham‐Grette, 2001; Hopkins et al., 1982). The BLB remained predominantly ice‐free during glacial advances across its Eurasian and North American extensions, acting for many taxa as a glacial refugium and as an important source and route of post‐glacial colonization. Examples can be found among plants (Brubaker et al., 2005), insects (Elias & Crocker, 2008), fish (Campbell et al., 2015), and mammals (Anijalg et al., 2018; Heintzman et al., 2016), including humans (Watson, 2017). Yet, habitat and climate heterogeneity across the BLB shaped species ranges and promoted population structure (Dale Guthrie, 2001; Elias & Crocker, 2008; Kuzmina et al., 2011; Vershinina et al., 2021). The decline in sea level that exposed the BLB also reshaped the coastline of Pacific Northwest North America, connecting several islands to the mainland (Baichtal, 2010; Shugar et al., 2014). Studies combining phylogeography and reconstruction of Pleistocene habitats have suggested that South‐eastern Alaska (SEAk) may have supported a Pleistocene refugium, as synthesized in the Coastal Refugium Hypothesis (Carrara et al., 2007). This hypothesis highlights the diversity, divergence, and high levels of endemism of SEAk taxa, observed, for instance, in several species of mammals [e.g., Martes americana (Small et al., 2003), Mustela erminea (Colella et al., 2018) or Ursus americanus (Puckett et al., 2015)]. Following the Last Glacial Maximum (LGM), the Pacific Northwest coast may have provided an unglaciated and viable route connecting Beringia to central North America (Lesnek et al., 2018).
Whereas historical climate fluctuations have played a predominant role in shaping current phylogeographic patterns, the intensification of human‐related activities over the last centuries has increasingly influenced species distributions, abundance, and ecological interactions (Scheffers et al., 2016; Yackulic et al., 2011). Land use activities such as habitat conversion and harvesting are among the highest direct pressures on species (Newbold et al., 2015). The SEAk region is an example of how historical climatic fluctuations have produced major phylogenetic patterns (Sawyer et al., 2019; Stone et al., 2002), but recent anthropogenic changes to the landscape are promoting fine‐scale spatial shifts in species patterns. An example is the reported association between timber harvesting practices and local changes in the density of the Sitka black‐tailed deer (Odocoileus hemionus sitkensis) population (Albert & Schoen, 2013; Brinkman et al., 2011).
Grey wolves (Canis lupus) are among the few top predators that survived the Pleistocene's rapid environmental changes and the last centuries' intense anthropogenic pressures (Barnosky et al., 2004; Dufresnes et al., 2018). The species has a Holarctic distribution covering a wide range of environments, from tundra to deserts. Based on mitogenomes, Loog et al. (2020) suggested that extant wolf populations trace their origin to an expansion of the Beringian population starting c. 25 thousand years ago (ka) towards Eurasia and later, c. 15 ka, towards North America. This expansion led to the replacement of indigenous Pleistocene wolf populations (Loog et al., 2020). An alternative scenario for North America is that extant wolves on the continent descend from a pre‐LGM expansion out of Beringia followed by a post‐LGM northward expansion from a glacial refugium south of the Laurentide/Cordilleran ice sheet complex (Koblmüller et al., 2016; Meachen et al., 2020). Overall, mitochondrial signatures illustrate a complex phylogeographic history for extant North American and Eurasian populations and high genetic similarity between the wolves of Alaska and Eastern Russia (Ersmark et al., 2016; Koblmüller et al., 2016; Loog et al., 2020). Nuclear data, however, show two reciprocally monophyletic wolf clades (Fan et al., 2016; Pilot et al., 2019; Sinding et al., 2018), with signs of intercontinental admixture between East Siberian and Alaskan populations (Sinding et al., 2018), consistent with their higher geographic proximity to the area of common origin. Whereas nuclear data have been extensively explored for North American populations, few genetic studies have focused on wolves from the Russian Far East (hereafter RFE; but see Talala et al., 2020 and Vorobyevskaya & Baldina, 2011), limiting our understanding of demographic and phylogeographic patterns in this region. Similarly, inferences based on mitochondrial data by Loog et al. (2020) did not include modern RFE samples.
In contrast to the mitonuclear dichotomy between continents, a coherent pattern has emerged within North America. Both nuclear and mitochondrial data have indicated that wolves from the Pacific Northwest coast, including SEAk, represent a phylogeographic clade distinct from inland populations (Carmichael et al., 2001; Cronin et al., 2015; Schweizer et al., 2016; Weckworth et al., 2005, 2010, 2011). This differentiation was first hypothesized to represent the remnants of pre‐LGM colonization of North America that expanded into SEAk by the early Holocene, whereas wolves expanding from the Beringian refugium after the LGM would have contributed to the extant North‐western North American (hereafter NNA) populations (Weckworth et al., 2010). However, the recent study by Loog et al. (2020) comparing ancient and contemporary mitogenomes found that extant SEAk wolves carry the same mtDNA lineage as the wolves that expanded out of Beringia after the LGM. Additionally SEAk wolves have very low levels of genetic diversity compared with their inland counterparts, suggesting either reduced gene flow with the nearest inland populations or extensive genetic drift due to the small founding population size (Weckworth et al., 2011). However, previous demographic inferences based on microsatellite data showed no signs of recent or historic bottlenecks in the SEAk population (Weckworth et al., 2005).
In this study, we present a demographic and population genetic analysis of extant wolf populations from both sides of the Bering Strait. Our goal was to assess genetic diversity and structure patterns for these populations and understand the contribution of historical and contemporary processes shaping their demographic history. We hypothesized that (1) RFE and NNA populations diverged before the expansion out of Beringia (Loog et al., 2020), in accordance with the extensive climatic and geomorphological heterogeneity across Beringia during this period. Furthermore, we hypothesized that (2) the known differentiation between inland and coastal NNA wolves is more ancient than would be anticipated by their shared mitochondrial lineage (Loog et al., 2020), given the high molecular and ecological support for divergence (e.g., Weckworth et al., 2011). Finally, we hypothesized that (3) wolves from RFE, and inland NNA have higher genetic diversity than those from SEAk, which are geographically limited by and have probably suffered negative impacts from recent anthropogenic changes to landscapes. To test our hypotheses, we used a comprehensive sample of wolves from populations around the Bering Strait, and genome‐wide single nucleotide polymorphism (SNP) profiles, to (a) assess the structure and genetic diversity of these populations, (b) estimate divergence times among populations, (c) infer past and recent fluctuations in effective population size (N e), and (d) identify genetic signatures of recent demographic changes.
2. MATERIALS AND METHODS
2.1. Sampling and genotyping
We generated original data for 65 grey wolves from two regions of the RFE, 42 individuals from Yakutia and 23 from Chukotka (Figure 1; Table S1). Muscle tissue samples were collected from wolves found dead or legally harvested for purposes other than research in the study area, where the species is classified as a game animal. CIBIO/InBIO is a CITES certified institution (PT008). DNA extracts from these samples were obtained using the DNeasy Blood and Tissue Kit (Qiagen). Subsequently, samples were genotyped with the CanineHD BeadChip microarray (Illumina, Inc.) comprising more than 170,000 genome‐wide SNPs. Genotype calling was performed using GenomeStudio software (Illumina) following Illumina's guidelines (GenomeStudio, Genotyping Module version 2.0 Software Guide, 2016), and exported to plink format (Purcell et al., 2007) with a final total genotyping rate of 0.961. Additionally, genome‐wide profiles from 105 NNA wolves genotyped with the same SNP panel by Cronin et al. (2015) and Medrano et al. (2014) were included in our data set. Samples from NNA comprised two inland regions, Alaska (n = 37) and British Columbia (BC, n = 31), and the coastal region of SEAk (n = 37, coastal region plus Kopreanof Island, Figure 1; Table S1). The data sets were homogenized based on the “TOP/BOT” SNP calling method (Illumina, Inc., 2006), and merged using plink 1.9 (Purcell et al., 2007). Monomorphic loci and loci with greater than 5% missing data were excluded from the final merged data set. Relatedness among individuals within each of the five sampling regions was assessed using identity‐by‐descent distances calculated in plink 1.9. Individuals with pairwise relatedness higher than r = 0.30 and more than 10% missing genotypes were excluded. To ensure that wolves included in this study were genetically distinct from dogs, we also performed a preliminary principal component analyses (PCA) using the adegenet package (Jombart, 2008) in R 4.0.3 (R Core Team, 2020), including all wolves used in this study plus 36 mixed breed dog genotypes for the same SNP panel from Cronin et al. (2015) and Medrano et al. (2014) (Figure S1). The final data set included 147 wolves genotyped for 91,327 autosomal SNPs (henceforth 91K).
FIGURE 1.
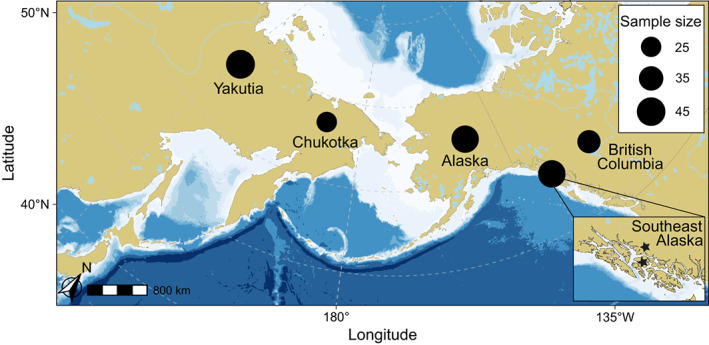
Map of the Bering Strait and contiguous areas in Eurasia and North America showing the approximate geographical locations of the samples and sample sizes of grey wolf populations used in this study: Yakutia (n = 42) and Chukotka (n = 23; Russian Far East; RFE); Alaska (n = 37) and British Columbia (n = 31; North‐western North America; NNA). The inset represents an enlargement of the study area in South‐eastern Alaska (n = 37; NNA), where the two stars represent the coastal region and Kopreanof Island. The pale blue indicates regions with sea levels shallow enough to have been exposed land during the Last Glacial Maximum (sea depth <120 m).
2.2. Population structure and differentiation
To determine the number and composition of the discrete populations present across our study area, we used a combination of likelihood clustering analyses and multivariate methods. For both approaches, we pruned the 91K data set for loci in high linkage disequilibrium (LD, r 2 ≥ .5) using plink with a 50 SNP sliding window and a step size of 10 SNPs, resulting in a final data set of 55,994 SNPs (henceforth 56K). We used the maximum likelihood approach implemented in admixture (Alexander et al., 2009) to evaluate distinct models for up to 10 populations (K) with a bootstrap of 5000 and 10 independent replicates per K‐value. To determine the best value of K, we performed 10 cross‐validations and selected the K‐value with the lowest validation error. The fit of the inferred model was assessed based on the estimated correlation of the residual difference between individuals using the software evaladmix (Garcia‐Erill & Albrechtsen, 2020). Additionally, we performed a PCA using the adegenet package (Jombart, 2008) in R 4.0.3 (R Core Team, 2020). Finally, the eigensoft software (Patterson et al., 2006) was used to estimate F ST between pairs of populations, and the average divergence between and within populations, estimated based on the normalized distance between each pair of individual eigenvectors.
2.3. Population genetic diversity
We used the 91K data set to calculate the observed (H o) and expected heterozygosity (H e) per population in plink and performed Wilcoxon–Mann–Whitney (WMW) tests comparing population heterozygosity between all population pairs, with statistical significance set at p < .05. The same software was used to estimate the LD decay for each population by calculating the genome‐wide pairwise genotype association coefficient (r 2) between all SNP pairs. Since this statistic is affected by the sample size, we randomly selected 10 individuals from each population. Additionally, we characterized the individual and population autozygosity (F HBD) using the R package RZooRoH (Bertrand et al., 2019). This package implements a model‐based approach to identify homozygosity‐by‐descent (HBD, obtained from runs of homozygosity; RoH) and non‐HBD segments across the genome. RZooRoH categorizes the length of HBD segments into generation classes, providing information on the timing of past inbreeding events. Longer segments correspond to recent inbreeding events (few generations ago) whereas shorter segments correspond to ancestral inbreeding events (many generations ago). Each class is associated with a rate (R k) equal to the size of the inbreeding loop in generations (Druet & Gautier, 2017). The rate of the class is approximately equal to twice the number of generations to the ancestor or inbreeding event. Based on the density of our SNP panel, we applied a MixKR model with 11 HBD classes (with R k equal to 2, 4, 8, 16, 32, 64, 128, 256, 512 and 1024) and 1 non‐HBD class. To convert from recombination distance to physical distance, we used the average recombination rate of 0.97 cM/Mb for the dog genome (Campbell et al., 2016). We performed WMW tests comparing population inbreeding coefficients between all population pairs, with statistical significance set at p < .05.
2.4. Phylogenetic relationships and divergence dating
We inferred the phylogenetic relationship among populations and associated divergence times in a coalescent framework using the snapp 1.3 package (Bryant et al., 2012) implemented in beast2 2.4 (Bryant et al., 2012), following Stange et al. (2018). To ensure independence among loci, only loci distanced by 100 kb (establish based on the LD decay pattern) were used, resulting in a data set of 15,340 SNPs. Due to computational constraints, each population was represented in this analysis by two individuals randomly selected among those satisfying the following three criteria: (1) highest assignment to the respective populations in the admixture analysis, to avoid violation in the species tree assumptions, namely the effect of gene flow; (2) lowest pairwise‐relatedness; and (3) lowest inbreeding coefficient, using the population average as a reference value. As a calibration point, we used the divergence between wolves from Europe and Asia previously estimated to c. 29 ka (Fan et al., 2016). To this end, we added two genotypes of Croatian wolves genotyped by Stronen et al. (2013) for the same SNP panel. We placed an age constraint on the node that separates the RFE and Croatian wolves using a lognormal distribution with an offset of 0, a mean of 29 ka, and a standard deviation (in real space) of 0.04 (Fan et al., 2016). We performed three independent runs in snapp each with a length of 10 million MCMC generations. Runs were assessed using tracer 1.6 (Rambaut et al., 2018) to examine convergence, and the tree topology and node heights were visualized using densitree (Bouckaert, 2010). We examined the effect of sample selection on the estimated phylogeny by repeating the analysis with a distinct set of individuals selected based on the same criteria.
2.5. Changes in effective population size over time
To infer the demographic history of the populations around the Bering strait, we used the model‐free approach implemented in stairway plot 2.1 (Liu & Fu, 2015; Liu & Fu, 2020) to reconstruct historical changes in the N e of each population. According to the software recommendations, potential confounding effects from linkage disequilibrium were minimized by performing an LD‐based variant pruning of the 91K data set using plink with 50 SNP sliding windows, a step size of 10 SNPs, and a threshold of r 2 = .8. For each population, the input folded site frequency spectrum (SFS) was estimated using the script easySFS.py (https://github.com/isaacovercast/easySFS; Figure S2). The output was scaled to time and population sizes assuming a mean generation time of 4.5 years (Mech et al., 2016) and a mutation rate of 4 × 10⁻⁹ per site per generation (Skoglund et al., 2015). Demographic changes were estimated using the median of simulations based on 200 bootstrap replicate analyses, and the precision of estimates was evaluated using 95% confidence intervals (CI).
To reconstruct the more recent demographic history (<1 ka) of these wolf populations, we used the software gone (Santiago et al., 2020). gone implements a genetic algorithm (Mitchell, 1998) to optimize the inference of the historical effective population size series that best fits the observed LD between pairs of SNPs with different recombination rates. Forty independent replicates of the gone analysis were run using standard input parameters, with the average recombination rate set to 0.90 cM/Mb (Campbell et al., 2016). N e estimates were obtained for each population individually using a data set with no missing data and no minor allele pruning. Notwithstanding, we note that the ascertainment scheme of the SNP chip used may affect estimates of the absolute N e, but not its trend (Lachance & Tishkoff, 2013). As the method does not generate parametric CIs of the estimated N e, and our sample size per population was not large enough to subsample individuals, we implemented a chromosome subsampling approach to calculate empirical CIs. For each individual, we took 50 random subsamples of half the number of chromosomes (only considering autosomes; n/2 = 19), to create genomic subsampled data sets of each population, containing the original number of individuals but half the number of chromosomes. All resulting subsampled data sets were analysed independently as described above.
3. RESULTS
3.1. Population inferences
The maximum‐likelihood clustering analysis based on 56K SNPs exhibited very similar low cross‐validation errors for the models with three, four and five populations. The model for K = 3 separated the RFE, inland NNA and SEAk populations. Models for K = 5 further subdivided the RFE and inland NNA into four distinct clusters, in accordance with the geographical distribution of the samples (Figures 1 and 2a). Results from evaladmix showed that the five‐population model had the lowest level of residuals (Figure S3). The PCA based on the same data set indicated a clear distinction between continents along the first axis while the second axis further differentiated populations within NNA (Figure 2b). Independent PCA for each continent corroborated the differentiation among the five populations, consistent with the admixture analysis (Figure 2c,d). Despite the partition of samples in different populations according to geographic origin, the results show a clear signature of gene flow between neighbouring populations within each continent, and residual signs of intercontinental shared ancestry. However, as downstream genetic inferences require the assumption of discrete populations, we hereafter considered the five most likely populations: Yakutia, Chukotka, Alaska, BC, and SEAk.
FIGURE 2.
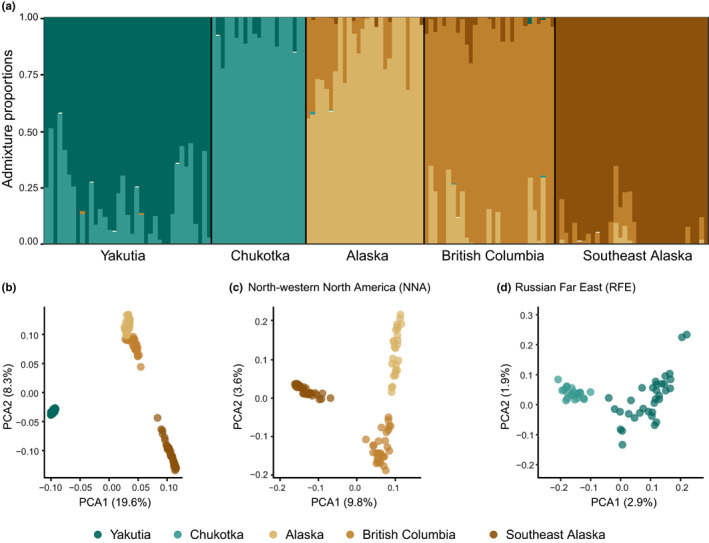
Analyses of population structure of grey wolves around the Bering Strait based on 56K SNPs. (a) admixture results for K = 5. (b) Principal component analysis (PCA) using all sampled individuals. (c) PCA using only North American individuals; (d) PCA using only Russian Far East individuals. SNP, single nucleotide polymorphism.
The highest pairwise F ST values were observed between RFE populations and SEAk, whereas comparisons within RFE and inland NNA populations showed the lowest values (Table 1). Pairwise estimates between RFE and inland NNA populations are very similar to the values observed between inland and coastal NNA populations. Average genetic divergence between populations showed the highest values between RFE and NNA populations and, unlike F ST estimates, similar pairwise values between the three NNA populations (Table 1). Average divergence statistics as estimated by eigensoft do not correct for intrapopulation divergence, which is probably the reason for the observed differences between these estimates and F ST. The highest average divergence within a population was observed in Yakutia, whereas the lowest was observed for the SEAk population (Table 1). The remaining populations showed intermediate values, closer to 1.
TABLE 1.
Pairwise genetic differentiation (F ST) and divergence between wolf populations calculated in EIGENSOFT for the five sampling regions
| Russian Far East | North‐western North America | ||||
|---|---|---|---|---|---|
| Yakutia | Chukotka | Alaska | British Columbia | Southeast Alaska | |
| Yakutia | 1.28 | 0.04 | 0.15 | 0.14 | 0.24 |
| Chukotka | 1.27 | 1.09 | 0.17 | 0.16 | 0.26 |
| Alaska | 1.42 | 1.36 | 0.95 | 0.05 | 0.17 |
| British Columbia | 1.43 | 1.37 | 1.06 | 0.99 | 0.14 |
| Southeast Alaska | 1.46 | 1.40 | 1.11 | 1.06 | 0.69 |
3.2. Genetic diversity
Individual observed heterozygosity ranged from 0.12 to 0.31 [SD]; Figure 3a), with the Yakutia population showing the highest values and the SEAk population the lowest. Wilcoxon‐Mann‐Whitney tests between population pairs were significant (p < .05) for all except for Alaska and BC. The four inland populations (Yakutia, Chukotka, Alaska, and BC) showed LD decay curves reaching r 2 = .3 after 25 kb, whereas the LD decay of SEAk was much slower, only reaching values of r 2 = .3 after 200 kb (Figure 3b).
FIGURE 3.
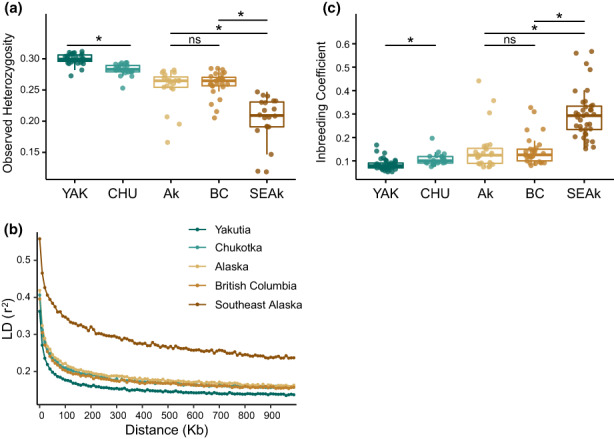
Genetic diversity patterns for the two Russian Far East (RFE): Yakutia (YAK) and Chukotka (CHU); and the three North‐western North American (NNA) wolf populations: Alaska (Ak), British Columbia (BC) and Southeast Alaska (SEAk). (a) Average and distribution of observed heterozygosity; (b) Extent of linkage disequilibrium, represented by the average genotypic association coefficient r 2 as a function of inter‐SNP distance; (c) Average and distribution of individual F HBD. Significance was calculated performing a Wilcoxon–Mann–Whitney test: ns, not significant, *significance at p < .05. HBD, homozygosity‐by‐descent; SNP, single nucleotide polymorphism.
SEAk wolves showed the highest average inbreeding coefficients (F HBD), significantly different from all other populations (Wilcoxon‐Mann‐Whitney test, p < .05), as well as the highest variance for this parameter, ranging from 0.15 to 0.57 (; Figure 3c). In contrast, the four inland populations showed very reduced levels of F HBD. To explore the influence of inbreeding (measured by F HBD values) on population differentiation in SEAk wolves, we compared the PCA coordinates of each individual with its respective F HBD value following Smeds et al. (2020). Some of the most divergent SEAk individuals exhibited high F HBD values, but there was no clear association between an individual's F HBD and its position on the PCA (Figure S4). This suggests that the observed population differentiation is not a direct result of genetic drift associated with high levels of inbreeding.
3.3. Phylogenetic relationships and divergence times
The phylogenetic relationship among populations inferred through Bayesian coalescent analysis showed a primary division between NNA and RFE populations (Figure 4; Figures S5 and S6). This divergence was dated to c. 34.4 ka (95% highest posterior densities [HPD] 31.4–37.7), around 10 ka prior to the LGM. The relationship among NNA populations showed a first divergence between coastal and inland populations, followed by the divergence between inland Alaska and BC. The split between SEAk and inland populations occurred around 16 ka, not long after the LGM (Clark et al., 2009). The time of divergence for mainland populations within NNA was very similar to that observed for populations in RFE, happening around 10 ka, and time estimates for the two events have overlapping CIs (Figure 4). For both NNA and RFE, this population divergence was also broadly consistent with the Pleistocene–Holocene transition (Figure 4).
FIGURE 4.
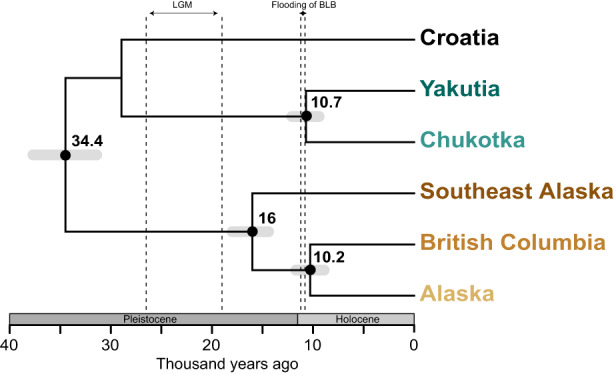
Chronogram of wolf populations from Bayesian coalescent analysis of SNP data using snapp. Median ages in thousand years ago are provided above nodes, with the 95% highest posterior densities (HPD) represented by grey bars in the nodes. The x‐axis corresponds to time before present in thousand years. The vertical dashed lines indicate the intervals of the last glacial maximum (LGM) and the estimated time of flooding of the Bering Land Bridge (BLB). SNP, single nucleotide polymorphism.
3.4. Demographic history
For RFE and inland NNA populations, stairway plot reconstructed continuous processes of demographic decline until the mid‐Holocene, shifting to a stable demographic trend with constant N e between 5 and 4 ka (Figure 5a; Figure S7). During the last thousand years, the four inland populations showed a signature of low N e (Figure 5a; Figure S7). For the SEAk population, stairway plot inferred consistently smaller N e values compared with the other four inland populations, and a stable demographic trend with constant N e until c. 15 ka when the population started to decline (Figure 5a; Figure S7).
FIGURE 5.
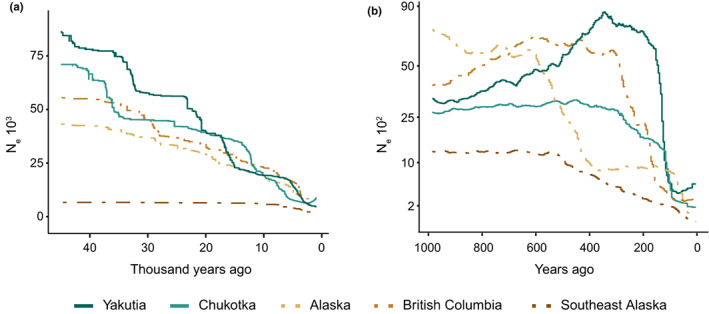
Reconstruction of demographic history for each wolf population with historic and recent estimates of effective population size (N e). (a) Historic estimates of temporal N e inferred using stairway plot and (b) recent (<1 ka) estimates of temporal N e inferred using gone. Lines indicate the median estimated N e, plotted from the past to the present. Full lines depict Russian Far East (RFE) populations and dashed lines North‐western North American (NNA) populations. The 95% confidence intervals associated with each temporal estimate are shown in Figures S7 and S8.
Results from the GONE analysis increased the resolution of the most recent (<1 ka) N e fluctuations, revealing an overall declining pattern across populations, particularly over the past 300 years (Figure 5b; Figure S8). Inferences for the two RFE populations showed that both suffered a sharp decline c. 150 years ago (ya). For Yakutia this decline was more pronounced, as this population had reached a considerably larger size than Chukotka in the preceding centuries. Among inland NNA populations, BC exhibited a more recent population decline, between 350 and 150 ya, than Alaska, which declined between 600 and 400 ya (Figure 5b; Figure S8). However, the latter exhibited a subsequent decline c. 100 ya. SEAk wolves showed a less sharp and more continuous population decline beginning c. 600 ya and lasting until the present (Figure 5b; Figure S8).
3.5. Characterization of individual levels of inbreeding
To further explore possible genetic consequences of the demographic history in these populations, we characterized the individual observed HBD segments based on segment lengths (Figure 6). This analysis revealed similar patterns between neighbouring populations (Yakutia/Chukotka and Alaska/BC), and a very different signature for SEAk. In RFE populations, average HBD segment length was 1.6 ± 3.3 Mb for Yakutia and 1.9 ± 3.1 Mb for Chukotka, with most fragments being smaller than 1 Mb (median of 7 and 9 kb respectively, Figure 6a). Accordingly, individual proportions of HBD segments were mostly associated with HBD classes with high rates, R k = 256 for Chukotka and R k = 512 for Yakutia (Figure 6b), meaning that most of the HBD segments observed in these populations trace to ancestors c. 128 and 256 generations ago for Chukotka and Yakutia, respectively.
FIGURE 6.
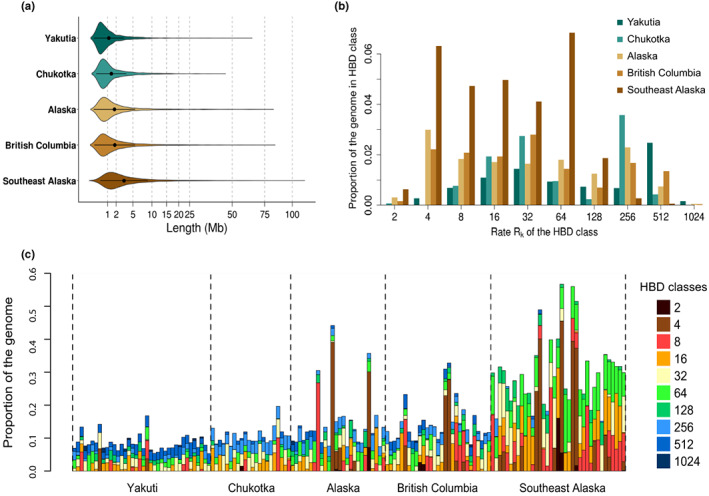
Characterization of grey wolf individual and population inbreeding levels. (a) Distribution of the length in Mb of the homozygosity‐by‐descent (HBD) segments in each population. The inner part of each violin plot represents the mean and the standard deviation of the distribution. (b) Genomic proportion of each population associated with different HBD classes. Each bar represents the average individual genomic proportion per population associated with a specific HBD class. The rate (R k) of a HBD class is approximately equal to twice the number of generations since the common ancestor. For instance, a class with a R k equal to eight correspond to ancestors living approximately four generations ago. (c) Partitioning of individual genomes in different HBD classes. Each bar represents an individual, and the height of the different stacks represents the proportion of the genome associated with each HBD class. The colours of the bars represent the rates (R k) associated with each HBD class.
In NNA, both Alaska and BC exhibited an average HBD length of 2.8 ± 5.4 Mb, but as for RFE populations, most of the segments were smaller than 1 Mb (median = 1 Mb, Figure 6a). However, unlike the RFE populations, both Alaska and BC showed a wider range of ancestral inbreeding events (Figure 6b,c). Most individuals showed evidence of inbreeding events occurring 128 or more generations ago (R k ≥ 256, Figure 6b), but a small number of individuals presented longer HBD fragments tracing their origin to ancestors 16 or fewer generations ago (R k ≤ 32). SEAk wolves showed the highest genome‐wide proportion of HBD segments, which reflects an average segment length of 4.5 Mb ± 2.1 and a median of 2.1 Mb (Figure 6a). Unlike the other populations, there were few signs of inbreeding events occurring more than 64 generations ago (R k = 128). Instead, all SEAk individuals presented a high proportion of longer HBD segments throughout the genome, originating from ancestors 32 or fewer generations ago (R k ≤ 64, Figure 6b,c).
4. DISCUSSION
The main goal of this study was to provide a comprehensive overview of the diversity, differentiation, and demographic history of the extant wolf populations around the Bering Strait and expand our knowledge about the RFE populations. By describing the past fluctuations in N e for each population, we found a temporal synchronism in the demography of inland populations from both continents. In contrast, the coastal population of SEAk showed a distinct demographic pattern with a consistently lower population size compared to its continental counterparts. Divergence time estimates showed that NNA and RFE populations split prior to the LGM (c. 34 ka). The oldest divergence event within the continents corresponded to the split between SEAk and inland NNA populations dating to c. 16 ka. This estimate indicates that an ancient divergence associated with multiple expansions out of Beringia may have contributed to the deep differentiation between inland and coastal NNA populations. We also found a reduction in genetic diversity across a geographical gradient from RFE towards NNA, with SEAk wolves showing the lowest genetic diversity and highest genome‐wide homozygosity, associated with a recent decline in population size.
4.1. The history of population divergence and demographic trends
Our results show that RFE and NNA populations shared a common ancestry up to 34.4 (95% HPD 31.4–37.7) ka, and that their divergence followed a demographic decline that started c. 60 ka and lasted until the mid‐Holocene. This is concordant with our first hypothesis stating that divergence between wolf populations in Asia and North America predates the suggested 20 to 15 ka expansion out of Beringia (Loog et al., 2020). The difference in divergence time estimates may suggest the existence of genetic structure in the Beringian population prior to expansion, a pattern that has also been suggested for the Beringian moose population (Alces alces, Dussex et al., 2020). Such a pattern could be driven by habitat and climate heterogeneity between Western and Eastern Beringia during the late Pleistocene, which over time shaped species ranges and densities across Beringia (Dale Guthrie, 2001; Elias & Crocker, 2008; Kuzmina et al., 2011). This landscape heterogeneity has also been associated with a decline in the migration rate between Western and Eastern Beringian populations of caballine horses (Equus spp.) during the Middle and Late Pleistocene (Vershinina et al., 2021). Our results seem to agree, as RFE and inland NNA populations exhibit continuous trends of population decline in the period before and after the LGM. Although wolves are highly mobile, genetic differentiation of subpopulations living in close proximity can occur owing to habitat features, prey specialization or other ecological and geographic interactions (Schweizer et al., 2016; Silva et al., 2018; Stronen et al., 2014). Notably, inferences based on stable isotope analysis of ancient Beringian wolves have suggested some level of individual specialization associated with local prey availability (Fox‐Dobbs et al., 2008; Leonard et al., 2007; Meachen et al., 2020). Therefore, fluctuations in prey availability and habitat heterogeneity could have triggered the observed decrease in N e through local extinctions and subsequent divergence between ancestral populations of RFE and NNA wolves within Beringia. Nevertheless, it is also possible that the observed divergence between RFE and NNA populations resulted from a pre‐LGM expansion out of Beringia through the still open Yukon corridor towards central North America (Batchelor et al., 2019). This scenario is in line with Koblmüller et al. (2016) findings based on mitochondrial data, which suggested that extant North American wolves descend from wolves that persisted south of the ice sheets during the LGM. Additionally, fossil records from Wyoming (USA) suggest that Beringian wolves were present in this area prior to the LGM (Meachen et al., 2016). We note, however, that this alternative hypothesis is difficult to reconcile with recent findings of mitochondrial divergence observed for extant wolves (Loog et al., 2020).
Following the divergence between continents, NNA wolves differentiated further into distinct coastal and continental populations, with their common ancestor dating to c. 16 (95% HPD 14.4–18) ka. In contrast to our second hypothesis, this estimate places the arrival of modern wolves into the SEAk coastal region after the LGM. Assuming a within‐Beringia divergence scenario, the estimated arrival is in synchrony with the previously suggested eastward expansion out of Beringia estimated to c. 16 ka based on mitogenomes (Loog et al., 2020). After the LGM, the continental route between the Laurentide and Cordilleran ice sheets connecting Beringia to continental unglaciated North America became ecologically viable c. 13 ka (Heintzman et al., 2016; Pedersen et al., 2016). However, the retraction of the eastern front of the Cordilleran ice sheet was much faster, creating an ecologically viable coastal corridor along the Pacific Northwest coast as early as 17 ka (Darvill et al., 2018; Lesnek et al., 2018). Archaeological and genetic evidence support the hypothesis that this coastal route was used by the first humans migrating into the Americas around 17 ka (Becerra‐Valdivia & Higham, 2020; Moreno‐Mayar et al., 2018; Pedersen et al., 2016). The same pattern is also being suggested for the early lineages of domesticated dogs, which diverged from the Eastern Siberian lineage c. 16 ka (da Silva Coelho et al., 2021). Other large carnivores, such as brown bears (U. arctos), could also have used this coastal route to reach the SEAk region c. 17 ka (Salis et al., 2021). Based on the similarity between our estimated divergence time for inland and coastal NNA populations and those previously described for other species, and the concordance with geomorphological evidence of a viable coastal route, wolves may also have taken such a route when expanding out of Beringia towards continental North America. Notwithstanding, assuming a northward expansion from a southern refugium, the same unglaciated coastal corridor could have been used prior to the opening of the continental route between the Laurentide and Cordilleran ice sheets (Lesnek et al., 2018; Weckworth et al., 2010).
Demographic inferences over the last millennium revealed a common negative trend across populations. For both RFE populations, we observed a synchronized decline c. 150 ya, which coincides with an increase in historical hunting records and the implementation of a country‐wide bounty system in the beginning of the 19th century aiming for a considerable reduction in wolf numbers (Baskin, 2016; Graves, 2007). In contrast, the earlier decline observed for NNA populations could have been associated with the climatic oscillations during the Little Ice Age, an unusual cold period that lasted from the early 14th century through the mid‐19th century (Forbes et al., 2020). During this period, expansion of the ice sheets and glaciers along with a decrease in temperatures most probably influenced species ranges, movements, and resource availability (e.g., caribou; Gigleux et al., 2019). Additionally, anthropogenic land use, such as fire practices by Indigenous communities, particularly along the coast (Hoffman et al., 2017), and extensive logging, agriculture, and livestock grazing associated with the arrival of Europeans into the region towards the end of the 18th and 19th centuries (Turner et al., 2013), could have contributed directly or indirectly to the observed population declines. However, the extent to which environmental and/or anthropogenic effects may have influenced wolf numbers in NNA populations is unclear and would require further investigation.
4.2. Genetic diversity and the consequences of population decline
RFE and inland NNA wolves exhibited similar heterozygosity and inbreeding coefficients, comparable with previously described values for other extant populations in Eastern Europe and North America (Pilot et al., 2014; vonHoldt et al., 2011). In accordance with our third hypothesis, SEAk wolves showed the lowest levels of genetic diversity and higher inbreeding coefficients, revealing a genetic signature of persistent decline in effective population size, particularly over the past 64 generations (c. 280 years). The same dichotomy between inland and coastal populations was observed for the LD decay patterns. Inland populations showed a rapid decay with physical distance, suggestive of a historically large N e comparable with the patterns described for wolf populations from Eastern Eurasia and the north‐western United States (Pilot et al., 2014, 2019). In contrast, the coastal population showed a much stronger LD and considerably slower LD decay, suggestive of a small and inbred population (Hedrick et al., 2014).
Observed differences in diversity and LD for inland and coastal populations may, at least partially, result from the landscape. Inland populations are not geographically isolated, and gene flow between neighbouring populations within each continent is not limited, as suggested by the low pairwise F ST values. In these populations, the presence of gene flow, along with a reduction in persecution over the last century (Bragina et al., 2015; Hayes & Harestad, 2000; Mech, 1970), may have buffered the effects of a past demographic decline (Hayes & Harestad, 2000) and promoted stabilization at a lower population size. In contrast, coastal SEAk wolves inhabit a naturally fragmented landscape, bordered to the east by the Coast Mountains, which limits gene flow with neighbouring populations (Person et al., 1996; Schweizer et al., 2016). Over the last decades, this region has also experienced severe changes due to human activities such as logging and road construction, reducing habitat and prey availability and limiting connectivity in an already naturally fragmented habitat (Albert & Schoen, 2013; Roffler et al., 2018). Unlike other populations, SEAk revealed a continuous population decline, starting c. 600 ya and lasting until the present. Together with landscape and ecological factors, this decline could have triggered the observed increase in inbreeding events over the past 280 years, resulting in increased homozygosity. Such trends of genetic erosion and reduced gene flow are associated with an increased risk of inbreeding depression (Newman & Pilson, 1997; Roelke et al., 1993), as earlier described for Scandinavian and Isle Royale wolves, where inbreeding depression threatens population persistence (Kardos et al., 2018; Robinson et al., 2019).
4.3. Conclusions and future perspectives
Large predators play a key role in structuring terrestrial ecosystems through an interplay of top‐down and bottom‐up forces along trophic associations. Such a role has been described across modern and historical ecosystems, from the regulation of Pleistocene megaherbivore population sizes preventing habitat destruction associated with extensive grazing (e.g., Van Valkenburgh et al., 2016) to the trophic cascade effect of wolf reintroduction in Yellowstone National Park at the end of the 20th century after a 70‐year absence (Ripple & Beschta, 2012). Illuminating the demographic history of large carnivore populations at different temporal and spatial scales can help infer past evolutionary changes in species, communities, and ecosystems and inform conservation and management actions.
Evaluations of demographic fluctuations of grey wolf populations have mainly been focused on global or broad‐scale regions and historical periods, making regional evaluations and more recent periods difficult to extrapolate. Our results offer a population‐level view of the evolutionary history of the extant wolves living around the Bering Strait. We observed similar demographic trends among the populations of NNA and RFE wolves throughout the Pleistocene and Holocene, probably reflecting ancient large‐scale climatic fluctuations and more recent anthropogenic factors. Furthermore, we ascertained the differentiation of SEAk wolves, which is concordant with the colonization of this region through the Pacifc North‐western coastal route post‐LGM. Finally, we demonstrated that SEAk wolves present signs of genetic erosion associated with high inbreeding and a continuous population decline in recent times.
Nevertheless, future studies, including more comprehensive geographical, temporal, and genomic sampling, would be required to further clarify the observed population trends. For instance, a broader temporal sampling of the Alaskan wolf population would be required to tease apart the relative role of different factors that may have contributed to the distinct demographic history that this population has exhibited over the last centuries. Additionally, as SNP chip data could be affected by the ascertainment scheme used in variant discovery, we acknowledge that expanding the genetic information through whole‐genome data would allow further exploration of the patterns described here by implementing other methodological approaches such as model‐driven demographic inferences. Lastly, a detailed study of the SEAk population, including genetic and ecological data, would be required to test the hypothesis of inbreeding depression and its impact on the persistence of this ecologically and genetically distinct evolutionary lineage adapted to the unique coastal habitat of the Pacific Northwest.
AUTHOR CONTRIBUTIONS
Raquel Godinho and Astrid Vik Stronen conceived the idea; Carolina Pacheco carried out the data analysis; Bogumiła Jędrzejewska, Kamila Plis, Innokentiy M. Okhlopkov, Nikolay V. Mamaev and Sergei V. Drovetski contributed samples or data; Carolina Pacheco wrote the manuscript with input from Raquel Godinho and Astrid Vik Stronen and other coauthors reviewed the text.
CONFLICT OF INTEREST
The authors declare no competing interests.
OPEN RESEARCH BADGES
This article has earned an Open Data Badge for making publicly available the digitally‐shareable data necessary to reproduce the reported results. The data is available at https://doi.org/10.17605/OSF.IO/3GTNM.
DATA AVAILABILITY AND BENEFIT‐SHARING STATEMENT
The wolf genotypes produced in this study can be accessed through The Open Science 515 Framework using the following link: https://doi.org/10.17605/OSF.IO/3GTNM.
Benefits Generated: A research collaboration was developed with the scientists who provided genetic samples, with all collaborators included as coauthors of this manuscript. Additionally, the results of this research have been shared with the provider and broader scientific community through public databases, as described above.
Supporting information
Data S1
ACKNOWLEDGEMENTS
We thank Rob Roy Ramey II and Romolo Caniglia for their assistance regarding the Cronin et al. (2015) data set, and we are grateful to Liisa Loog, four anonymous reviewers and the two editors Alana Alexander and Tara Pelletier for their time and valuable comments that improved our manuscript. This work was cofunded by the project NORTE‐01‐0246‐FEDER‐000063, supported by Norte Portugal Regional Operational Programme (NORTE2020), under the PORTUGAL 2020 Partnership Agreement, through the European Regional Development Fund (ERDF). C.P. and R.G. were supported by the Portuguese Foundation for Science and Technology, FCT (PD/BD/135026/2017 and 2021/00647/CEECIND, respectively). A.V.S. was supported by the Danish Natural Science Research Council (grant 1337‐00007) and a senior postdoctoral fellowship from Insubria University in Varese, Italy.
Pacheco, C. , Stronen, A. V. , Jędrzejewska, B. , Plis, K. , Okhlopkov, I. M. , Mamaev, N. V. , Drovetski, S. V. , & Godinho, R. (2022). Demography and evolutionary history of grey wolf populations around the Bering Strait. Molecular Ecology, 31, 4851–4865. 10.1111/mec.16613
Handling Editor: Alana Alexander
Contributor Information
Carolina Pacheco, Email: carolina.pacheco@cibio.up.pt.
Raquel Godinho, Email: rgodinho@cibio.up.pt.
REFERENCES
- Albert, D. M. , & Schoen, J. W. (2013). Use of historical logging patterns to identify disproportionately logged ecosystems within temperate rainforests of southeastern alaska. Conservation Biology, 27(4), 774–784. 10.1111/cobi.12109 [DOI] [PubMed] [Google Scholar]
- Alexander, D. H. , Novembre, J. , & Lange, K. (2009). Fast model‐based estimation of ancestry in unrelated individuals. Genome Research, 19(9), 1655–1664. 10.1101/gr.094052.109 [DOI] [PMC free article] [PubMed] [Google Scholar]
- Anijalg, P. , Ho, S. Y. W. , Davison, J. , Keis, M. , Tammeleht, E. , Bobowik, K. , Tumanov, I. , Saveljev, A. , Lyapunova, E. , Vorobiev, A. , Markov, N. I. , Kryukov, A. , Kojola, I. , Swenson, J. , Hagen, S. B. , Eiken, H. , Paule, L. , & Saarma, U. (2018). Large‐scale migrations of brown bears in Eurasia and to North America during the Late Pleistocene. Journal of Biogeography, 45(2), 394–405. 10.1111/jbi.13126 [DOI] [Google Scholar]
- Baichtal, J. F. (2010). Development of a model to predict the location of Early‐Holocene habitation sites along the western coast of Prince of Wales Island and the Outer Islands, Southeast Alaska. GSA Denver Annual Meeting (1985), 8220.
- Barnosky, A. D. , Koch, P. L. , Feranec, R. S. , Wing, S. L. , & Shabel, A. B. (2004). Assessing the causes of late pleistocene extinctions on the continents. Science, 306, 70–75. 10.1126/science.1101476 [DOI] [PubMed] [Google Scholar]
- Baskin, L. (2016). Hunting as sustainable wildlife management. Mammal Study, 41(4), 173–180. 10.3106/041.041.0402 [DOI] [Google Scholar]
- Batchelor, C. L. , Margold, M. , Krapp, M. , Murton, D. K. , Dalton, A. S. , Gibbard, P. L. , Stokes, C. R. , & Manica, A. (2019). The configuration of Northern Hemisphere ice sheets through the Quaternary. Nature Communications, 10(1), 3713. 10.1038/s41467-019-11601-2 [DOI] [PMC free article] [PubMed] [Google Scholar]
- Becerra‐Valdivia, L. , & Higham, T. (2020). The timing and effect of the earliest human arrivals in North America. Nature, 584(7819), 93–97. 10.1038/s41586-020-2491-6 [DOI] [PubMed] [Google Scholar]
- Bertrand, A. R. , Kadri, N. K. , Flori, L. , Gautier, M. , & Druet, T. (2019). RZooRoH: An R package to characterize individual genomic autozygosity and identify homozygous‐by‐descent segments. Methods in Ecology and Evolution, 10(6), 860–866. 10.1111/2041-210X.13167 [DOI] [Google Scholar]
- Bouckaert, R. R. (2010). DensiTree: Making sense of sets of phylogenetic trees. Bioinformatics, 26(10), 1372–1373. 10.1093/bioinformatics/btq110 [DOI] [PubMed] [Google Scholar]
- Bragina, E. V. , Ives, A. R. , Pidgeon, A. M. , Kuemmerle, T. , Baskin, L. M. , Gubar, Y. P. , Piquer‐Rodríguez, M. , Keuler, N. S. , Petrosyan, V. G. , & Radeloff, V. C. (2015). Rapid declines of large mammal populations after the collapse of the Soviet Union. Conservation Biology, 29(3), 844–853. 10.1111/cobi.12450 [DOI] [PubMed] [Google Scholar]
- Brigham‐Grette, J. (2001). New perspectives on Beringian Quaternary paleogeography, stratigraphy, and glacial history. Quaternary Science Reviews, 20(1–3), 15–24. 10.1016/S0277-3791(00)00134-7 [DOI] [Google Scholar]
- Brinkman, T. J. , Person, D. K. , Chapin, F. S. , Smith, W. , & Hundertmark, K. J. (2011). Estimating abundance of Sitka black‐tailed deer using DNA from fecal pellets. Journal of Wildlife Management, 75(1), 232–242. 10.1002/jwmg.22 [DOI] [Google Scholar]
- Brubaker, L. B. , Anderson, P. M. , Edwards, M. E. , & Lozhkin, A. V. (2005). Beringia as a glacial refugium for boreal trees and shrubs: New perspectives from mapped pollen data. Journal of Biogeography, 32(5), 833–848. 10.1111/j.1365-2699.2004.01203.x [DOI] [Google Scholar]
- Bryant, D. , Bouckaert, R. , Felsenstein, J. , Rosenberg, N. A. , & Roychoudhury, A. (2012). Inferring species trees directly from biallelic genetic markers: Bypassing gene trees in a full coalescent analysis. Molecular Biology and Evolution, 29(8), 1917–1932. 10.1093/molbev/mss086 [DOI] [PMC free article] [PubMed] [Google Scholar]
- Campbell, C. , Bhérer, C. , Morrow, B. E. , Boyko, A. R. , & Auton, A. (2016). A pedigree‐based map of recombination in the domestic dog genome. G3: Genes, Genomes, Genetics, 6(11), 3517–3524. 10.1534/g3.116.034678 [DOI] [PMC free article] [PubMed] [Google Scholar]
- Campbell, M. , Takebayashi, N. , & López, J. A. (2015). Beringian sub‐refugia revealed in blackfish (Dallia): Implications for understanding the effects of Pleistocene glaciations on Beringian taxa and other Arctic aquatic fauna. BMC Evolutionary Biology, 15(1), 1–16. 10.1186/s12862-015-0413-2 [DOI] [PMC free article] [PubMed] [Google Scholar]
- Carmichael, L. E. , Nagy, J. A. , Larter, N. C. , & Strobeck, C. (2001). Prey specialization may influence patterns of gene flow in wolves of the Canadian Northwest. Molecular Ecology, 10(12), 2787–2798. 10.1046/j.0962-1083.2001.01408.x [DOI] [PubMed] [Google Scholar]
- Carrara, P. E. , Ager, T. A. , & Baichtal, J. F. (2007). Possible refugia in the Alexander Archipelago of southeastern Alaska during the late Wisconsin glaciation. Canadian Journal of Earth Sciences, 44(2), 229–244. 10.1139/E06-081 [DOI] [Google Scholar]
- Clark, P. U. , Dyke, A. S. , Shakun, J. D. , Carlson, A. E. , Clark, J. , Wohlfarth, B. , Mitrovica, J. X. , Hostetler, S. W. , & McCabe, A. M. (2009). The last glacial maximum. Science, 325(5941), 710–714. 10.1126/science.1172873 [DOI] [PubMed] [Google Scholar]
- Colella, J. P. , Lan, T. , Schuster, S. C. , Talbot, S. L. , Cook, J. A. , & Lindqvist, C. (2018). Whole‐genome analysis of Mustela erminea finds that pulsed hybridization impacts evolution at high latitudes. Communications Biology, 1(1), 1–10. 10.1038/s42003-018-0058-y [DOI] [PMC free article] [PubMed] [Google Scholar]
- Cronin, M. A. , Cánovas, A. , Bannasch, D. L. , Oberbauer, A. M. , Medrano, J. F. , & Ostrander, E. (2015). Single nucleotide polymorphism (SNP) variation of wolves (Canis lupus) in Southeast Alaska and comparison with wolves, dogs, and Coyotes in North America. Journal of Heredity, 106(1), 26–36. 10.1093/jhered/esu075 [DOI] [PubMed] [Google Scholar]
- da Silva Coelho, F. A. , Gill, S. , Tomlin, C. M. , Heaton, T. H. , & Lindqvist, C. (2021). An early dog from southeast Alaska supports a coastal route for the first dog migration into the Americas. Proceedings of the Royal Society B: Biological Sciences, 288(1945), 20203103. 10.1098/rspb.2020.3103 [DOI] [PMC free article] [PubMed] [Google Scholar]
- Dale Guthrie, R. (2001). Origin and causes of the mammoth steppe: A story of cloud cover, woolly mammal tooth pits, buckles, and inside‐out Beringia. Quaternary Science Reviews, 20(1–3), 549–574. 10.1016/S0277-3791(00)00099-8 [DOI] [Google Scholar]
- Darvill, C. M. , Menounos, B. , Goehring, B. M. , Lian, O. B. , & Caffee, M. W. (2018). Retreat of the western Cordilleran ice sheet margin during the last deglaciation. Geophysical Research Letters, 45(18), 9710–9720. 10.1029/2018GL079419 [DOI] [Google Scholar]
- Druet, T. , & Gautier, M. (2017). A model‐based approach to characterize individual inbreeding at both global and local genomic scales. Molecular Ecology, 26(20), 5820–5841. 10.1111/mec.14324 [DOI] [PubMed] [Google Scholar]
- Dufresnes, C. , Miquel, C. , Remollino, N. , Biollaz, F. , Salamin, N. , Taberlet, P. , & Fumagalli, L. (2018). Howling from the past: Historical phylogeography and diversity losses in European grey wolves. Proceedings of the Royal Society B: Biological Sciences, 285(1884), 20181148. 10.1098/rspb.2018.1148 [DOI] [PMC free article] [PubMed] [Google Scholar]
- Dussex, N. , Alberti, F. , Heino, M. T. , Olsen, R.‐A. , van der Valk, T. , Ryman, N. , Laikre, L. , Ahlgren, H. , Askeyev, I. V. , Askeyev, O. V. , Shaymuratova, D. N. , Askeyev, A. O. , Döppes, D. , Friedrich, R. , Lindauer, S. , Rosendahl, W. , Aspi, J. , Hofreiter, M. , Lidén, K. , … Díez‐del‐Molino, D. (2020). Moose genomes reveal past glacial demography and the origin of modern lineages. BMC Genomics, 21(1), 854. 10.1186/s12864-020-07208-3 [DOI] [PMC free article] [PubMed] [Google Scholar]
- Elias, S. A. , & Crocker, B. (2008). The Bering Land Bridge: A moisture barrier to the dispersal of steppe‐tundra biota? Quaternary Science Reviews, 27(27–28), 2473–2483. 10.1016/j.quascirev.2008.09.011 [DOI] [Google Scholar]
- Ersmark, E. , Klütsch, C. F. C. , Chan, Y. L. , Sinding, M. H. S. , Fain, S. R. , Illarionova, N. A. , Oskarsson, M. , Uhlen, M. , Zhang, Y. P. , Dalen, L. , & Savolainen, P. (2016). From the past to the present: Wolf phylogeography and demographic history based on the mitochondrial control region. Frontiers in Ecology and Evolution, 4(DEC), 134. 10.3389/fevo.2016.00134 [DOI] [Google Scholar]
- Fan, Z. , Silva, P. , Gronau, I. , Wang, S. , Armero, A. S. , Schweizer, R. M. , Ramirez, O. , Pollinger, J. , Galaverni, M. , Ortega Del‐Vecchyo, D. , Du, L. , Zhang, W. , Zhang, Z. , Xing, J. , Vilà, C. , Marques‐Bonet, T. , Godinho, R. , Yue, B. , & Wayne, R. K. (2016). Worldwide patterns of genomic variation and admixture in gray wolves. Genome Research, 26(2), 163–173. 10.1101/gr.197517.115 [DOI] [PMC free article] [PubMed] [Google Scholar]
- Forbes, V. , Ledger, P. M. , Cretu, D. , & Elias, S. (2020). A sub‐centennial, Little Ice Age climate reconstruction using beetle subfossil data from Nunalleq, southwestern Alaska. Quaternary International, 549, 118–129. 10.1016/j.quaint.2019.07.011 [DOI] [Google Scholar]
- Fox‐Dobbs, K. , Leonard, J. A. , & Koch, P. L. (2008). Pleistocene megafauna from eastern Beringia: Paleoecological and paleoenvironmental interpretations of stable carbon and nitrogen isotope and radiocarbon records. Palaeogeography, Palaeoclimatology, Palaeoecology, 261(1–2), 30–46. 10.1016/j.palaeo.2007.12.011 [DOI] [Google Scholar]
- Garcia‐Erill, G. , & Albrechtsen, A. (2020). Evaluation of model fit of inferred admixture proportions. Molecular Ecology Resources, 20(4), 936–949. 10.1111/1755-0998.13171 [DOI] [PubMed] [Google Scholar]
- GenomeStudio . (2016). Genotyping module v2.0 software guide. Illumina, Inc.
- Gigleux, C. , Grimes, V. , Tütken, T. , Knecht, R. , & Britton, K. (2019). Reconstructing caribou seasonal biogeography in Little Ice Age (late Holocene) Western Alaska using intra‐tooth strontium and oxygen isotope analysis. Journal of Archaeological Science: Reports, 23, 1043–1054. 10.1016/J.JASREP.2017.10.043 [DOI] [Google Scholar]
- Graves, W. N. (2007). Wolves in Russia ‐ Anxiety through the ages. Brush Education. [Google Scholar]
- Hayes, R. D. , & Harestad, A. S. (2000). Demography of a recovering wolf population in the Yukon. Canadian Journal of Zoology, 78(1), 36–48. 10.1139/z99-186 [DOI] [Google Scholar]
- Hedrick, P. W. , Peterson, R. O. , Vucetich, L. M. , Adams, J. R. , & Vucetich, J. A. (2014). Genetic rescue in Isle Royale wolves: Genetic analysis and the collapse of the population. Conservation Genetics, 15(5), 1111–1121. 10.1007/s10592-014-0604-1 [DOI] [Google Scholar]
- Heintzman, P. D. , Froese, D. , Ives, J. W. , Soares, A. E. R. , Zazula, G. D. , Letts, B. , Andrews, T. D. , Driver, J. C. , Hall, E. , Hare, P. G. , Jass, C. N. , MacKay, G. , Southon, J. R. , Stiller, M. , Woywitka, R. , Suchard, M. A. , & Shapiro, B. (2016). Bison phylogeography constrains dispersal and viability of the Ice Free Corridor in western Canada. Proceedings of the National Academy of Sciences of the United States of America, 113(29), 8057–8063. 10.1073/pnas.1601077113 [DOI] [PMC free article] [PubMed] [Google Scholar]
- Hewitt, G. (2000). The genetic legacy of the Quaternary ice ages. Nature, 405(6789), 907–913. 10.1038/35016000 [DOI] [PubMed] [Google Scholar]
- Hoffman, K. M. , Lertzman, K. P. , & Starzomski, B. M. (2017). Ecological legacies of anthropogenic burning in a British Columbia coastal temperate rain forest. Journal of Biogeography, 44(12), 2903–2915. 10.1111/jbi.13096 [DOI] [Google Scholar]
- Hopkins, D. M. , Matthews, J. V. , & Schweger, C. E. (1982). Paleoecology of Beringia (1st ed.). Academic Press. [Google Scholar]
- Jombart, T. (2008). adegenet: A R package for the multivariate analysis of genetic markers. Bioinformatics, 24(11), 1403–1405. 10.1093/bioinformatics/btn129 [DOI] [PubMed] [Google Scholar]
- Kardos, M. , Åkesson, M. , Fountain, T. , Flagstad, Ø. , Liberg, O. , Olason, P. , Sand, H. , Wabakken, P. , Wikenros, C. , & Ellegren, H. (2018). Genomic consequences of intensive inbreeding in an isolated Wolf population. Nature Ecology and Evolution, 2(1), 124–131. 10.1038/s41559-017-0375-4 [DOI] [PubMed] [Google Scholar]
- Koblmüller, S. , Vilà, C. , Lorente‐Galdos, B. , Dabad, M. , Ramirez, O. , Marques‐Bonet, T. , Wayne, R. K. , & Leonard, J. A. (2016). Whole mitochondrial genomes illuminate ancient intercontinental dispersals of grey wolves (Canis lupus). Journal of Biogeography, 43, 1728–1738. 10.1111/jbi.12765 [DOI] [Google Scholar]
- Kuzmina, S. A. , Sher, A. V. , Edwards, M. E. , Haile, J. , Yan, E. V. , Kotov, A. V. , & Willerslev, E. (2011). The late Pleistocene environment of the Eastern West Beringia based on the principal section at the Main River, Chukotka. Quaternary Science Reviews, 30(17–18), 2091–2106. 10.1016/j.quascirev.2010.03.019 [DOI] [Google Scholar]
- Lachance, J. , & Tishkoff, S. A. (2013). SNP ascertainment bias in population genetic analyses: Why it is important, and how to correct it. BioEssays, 35(9), 780–786. 10.1002/bies.201300014 [DOI] [PMC free article] [PubMed] [Google Scholar]
- Leonard, J. A. , Vilà, C. , Fox‐Dobbs, K. , Koch, P. L. , Wayne, R. K. , & Van Valkenburgh, B. (2007). Megafaunal extinctions and the disappearance of a specialized wolf ecomorph. Current Biology, 17(13), 1146–1150. 10.1016/j.cub.2007.05.072 [DOI] [PubMed] [Google Scholar]
- Lesnek, A. J. , Briner, J. P. , Lindqvist, C. , Baichtal, J. F. , & Heaton, T. H. (2018). Deglaciation of the pacific coastal corridor directly preceded the human colonization of the Americas. Science Advances, 4(5), eaar5040. 10.1126/sciadv.aar5040 [DOI] [PMC free article] [PubMed] [Google Scholar]
- Liu, X. , & Fu, Y. X. (2015). Exploring population size changes using SNP frequency spectra. Nature Genetics, 47(5), 555–559. 10.1038/ng.3254 [DOI] [PMC free article] [PubMed] [Google Scholar]
- Liu, X. , & Fu, Y.‐X. (2020). Stairway Plot 2: Demographic history inference with folded SNP frequency spectra. Genome Biology, 21(1), 280. 10.1186/s13059-020-02196-9 [DOI] [PMC free article] [PubMed] [Google Scholar]
- Loog, L. , Thalmann, O. , Sinding, M. H. S. , Schuenemann, V. J. , Perri, A. , Germonpré, M. , Bocherens, H. , Witt, K. E. , Samaniego Castruita, J. A. , Velasco, M. S. , Lundstrøm, I. K. C. , Wales, N. , Sonet, G. , Frantz, L. , Schroeder, H. , Budd, J. , Jimenez, E. L. , Fedorov, S. , Gasparyan, B. , … Manica, A. (2020). Ancient DNA suggests modern wolves trace their origin to a Late Pleistocene expansion from Beringia. Molecular Ecology, 29(9), 1596–1610. 10.1111/mec.15329 [DOI] [PMC free article] [PubMed] [Google Scholar]
- Meachen, J. A. , Brannick, A. L. , & Fry, T. J. (2016). Extinct Beringian wolf morphotype found in the continental U.S. has implications for wolf migration and evolution. Ecology and Evolution, 6(10), 3430–3438. 10.1002/ece3.2141 [DOI] [PMC free article] [PubMed] [Google Scholar]
- Meachen, J. A. , Wooller, M. J. , Barst, B. D. , Funck, J. , Crann, C. , Heath, J. , Cassatt‐Johnstone, M. , Shapiro, B. , Hall, E. , Hewitson, S. , & Zazula, G. D. (2020). A mummified Pleistocene gray wolf pup. Current Biology, 30(24), 3–5. 10.1016/j.cub.2020.11.011 [DOI] [PubMed] [Google Scholar]
- Mech, L. D. (1970). The wolf: The ecology and behavior of an endangered species. Natural History Press. [Google Scholar]
- Mech, L. D. , Barber‐Meyer, S. M. , & Erb, J. (2016). Wolf (Canis lupus) generation time and proportion of current breeding females by age. PLoS One, 11(6), e0156682. 10.1371/journal.pone.0156682 [DOI] [PMC free article] [PubMed] [Google Scholar]
- Medrano, J. F. , Cronin, M. A. , Cánovas, A. , Oberbauer, A. M. , & Bannasch, D. L. (2014). Data from: Single nucleotide polymorphism (SNP) variation of wolves (Canis lupus) in Southeast Alaska and comparison with wolves, dogs, and coyotes in North America. Dryad website: https://datadryad.org/stash/dataset/doi:10.5061/dryad.284tf [DOI] [PubMed]
- Mitchell, M. (1998). An introduction to genetic algorithms. MIT press. [Google Scholar]
- Moreno‐Mayar, J. V. , Potter, B. A. , Vinner, L. , Steinrücken, M. , Rasmussen, S. , Terhorst, J. , Kamm, J. A. , Albrechtsen, A. , Malaspinas, A. S. , Sikora, M. , Reuther, J. D. , Irish, J. D. , Malhi, R. S. , Orlando, L. , Song, Y. S. , Nielsen, R. , Meltzer, D. J. , & Willerslev, E. (2018). Terminal Pleistocene Alaskan genome reveals first founding population of Native Americans. Nature, 553(7687), 203–207. 10.1038/nature25173 [DOI] [PubMed] [Google Scholar]
- Newbold, T. , Hudson, L. N. , Hill, S. L. L. , Contu, S. , Lysenko, I. , Senior, R. A. , Börger, L. , Bennett, D. J. , Choimes, A. , Collen, B. , Day, J. , De Palma, A. , Díaz, S. , Echeverria‐Londoño, S. , Edgar, M. J. , Feldman, A. , Garon, M. , Harrison, M. L. , Alhusseini, T. , … Purvis, A. (2015). Global effects of land use on local terrestrial biodiversity. Nature, 520(7545), 45–50. 10.1038/nature14324 [DOI] [PubMed] [Google Scholar]
- Newman, D. , & Pilson, D. (1997). Increased probability of extinction due to decreased genetic effective population size: Experimental populations of Clarkia pulchella . Evolution, 51(2), 354–362. 10.1111/j.1558-5646.1997.tb02422.x [DOI] [PubMed] [Google Scholar]
- Patterson, N. , Price, A. L. , & Reich, D. (2006). Population structure and Eigen analysis. PLoS Genetics, 2(12), e190. 10.1371/journal.pgen.0020190 [DOI] [PMC free article] [PubMed] [Google Scholar]
- Pedersen, M. W. , Ruter, A. , Schweger, C. , Friebe, H. , Staff, R. A. , Kjeldsen, K. K. , Mendoza, M. L. Z. , Beaudoin, A. B. , Zutter, C. , Larsen, N. K. , Potter, B. A. , Nielsen, R. , Rainville, R. A. , Orlando, L. , Meltzer, D. J. , Kjær, K. H. , & Willerslev, E. (2016). Postglacial viability and colonization in North America's ice‐free corridor. Nature, 537(7618), 45–49. 10.1038/nature19085 [DOI] [PubMed] [Google Scholar]
- Person, D. K. , Kirchhoff, M. , Van Ballenberghe, V. , Iverson, G. C. , & Grossman, E. (1996). The Alexander Archipelago wolf: A conservation assessment. USDA Forest Service ‐ General Technical Report PNW (Vol. 384). 10.2737/PNW-GTR-384 [DOI] [Google Scholar]
- Pilot, M. , Greco, C. , vonHoldt, B. M. , Jedrzejewska, B. , Randi, E. , Jedrzejewski, W. , Sidorovich, V. E. , Ostrander, E. A. , & Wayne, R. K. (2014). Genome‐wide signatures of population bottlenecks and diversifying selection in European wolves. Heredity, 112(4), 428–442. [DOI] [PMC free article] [PubMed] [Google Scholar]
- Pilot, M. , Moura, A. E. , Okhlopkov, I. M. , Mamaev, N. V. , Alagaili, A. N. , Mohammed, O. B. , Yavruyan, E. G. , Manaseryan, N. H. , Hayrapetyan, V. , Kopaliani, N. , Tsingarska, E. , Krofel, M. , Skoglund, P. , & Bogdanowicz, W. (2019). Global phylogeographic and admixture patterns in grey wolves and genetic legacy of an ancient Siberian lineage. Scientific Reports, 9(1), 17328. 10.1038/s41598-019-53492-9 [DOI] [PMC free article] [PubMed] [Google Scholar]
- Puckett, E. E. , Etter, P. D. , Johnson, E. A. , & Eggert, L. S. (2015). Phylogeographic analyses of American black bears (Ursus americanus) suggest four glacial refugia and complex patterns of postglacial admixture. Molecular Biology and Evolution, 32(9), 2338–2350. 10.1093/molbev/msv114 [DOI] [PubMed] [Google Scholar]
- Purcell, S. , Neale, B. , Todd‐Brown, K. , Thomas, L. , Ferreira, M. A. R. , Bender, D. , Maller, J. , Sklar, P. , de Bakker, P. I. , Daly, M. J. , & Sham, P. C. (2007). PLINK: A tool set for whole‐genome association and population‐based linkage analyses. The American Journal of Human Genetics, 81(3), 559–575. 10.1086/519795 [DOI] [PMC free article] [PubMed] [Google Scholar]
- R Core Team . (2020). R: A language and environment for statistical computing. R Foundation for Statistical Computing; https://www.r‐project.org/ [Google Scholar]
- Rambaut, A. , Drummond, A. J. , Xie, D. , Baele, G. , & Suchard, M. A. (2018). Posterior summarization in Bayesian phylogenetics using Tracer 1.7. Systematic Biology, 67(5), 901–904. 10.1093/sysbio/syy032 [DOI] [PMC free article] [PubMed] [Google Scholar]
- Ripple, W. J. , & Beschta, R. L. (2012). Trophic cascades in yellowstone: The first 15years after wolf reintroduction. Biological Conservation, 145(1), 205–213. 10.1016/j.biocon.2011.11.005 [DOI] [Google Scholar]
- Robinson, J. A. , Räikkönen, J. , Vucetich, L. M. , Vucetich, J. A. , Peterson, R. O. , Lohmueller, K. E. , & Wayne, R. K. (2019). Genomic signatures of extensive inbreeding in Isle Royale wolves, a population on the threshold of extinction. Science Advances, 5(5), 757–786. 10.1126/sciadv.aau0757 [DOI] [PMC free article] [PubMed] [Google Scholar]
- Roelke, M. E. , Martenson, J. S. , & O'Brien, S. J. (1993). The consequences of demographic reduction and genetic depletion in the endangered Florida panther. Current Biology, 3(6), 340–350. 10.1016/0960-9822(93)90197-V [DOI] [PubMed] [Google Scholar]
- Roffler, G. H. , Gregovich, D. P. , & Larson, K. R. (2018). Resource selection by coastal wolves reveals the seasonal importance of seral forest and suitable prey habitat. Forest Ecology and Management, 409, 190–201. 10.1016/j.foreco.2017.11.025 [DOI] [Google Scholar]
- Salis, A. T. , Bray, S. C. E. , Lee, M. S. Y. , Heiniger, H. , Barnett, R. , Burns, J. A. , Doronichev, V. , Fedje, D. , Golovanova, L. , Harington, C. R. , Hockett, B. , Kosintsev, P. , Lai, X. , Mackie, Q. , Vasiliev, S. , Weinstock, J. , Yamaguchi, N. , Meachen, J. A. , Cooper, A. , & Mitchell, K. J. (2021). Lions and brown bears colonized North America in multiple synchronous waves of dispersal across the Bering Land Bridge. Molecular Ecology, 1–15. 10.1111/mec.16267. [DOI] [PubMed] [Google Scholar]
- Santiago, E. , Novo, I. , Pardiñas, A. , Saura, M. , Wang, J. , & Caballero, A. (2020). Recent demographic history inferred by high‐resolution analysis of linkage disequilibrium. Molecular Biology and Evolution, 37, 3642–3653. 10.1093/molbev/msaa169 [DOI] [PubMed] [Google Scholar]
- Sawyer, Y. E. , MacDonald, S. O. , Lessa, E. P. , & Cook, J. A. (2019). Living on the edge: Exploring the role of coastal refugia in the Alexander Archipelago of Alaska. Ecology and Evolution, 9(4), 1777–1797. 10.1002/ece3.4861 [DOI] [PMC free article] [PubMed] [Google Scholar]
- Scheffers, B. R. , De Meester, L. , Bridge, T. C. L. , Hoffmann, A. A. , Pandolfi, J. M. , Corlett, R. T. , Butchart, S. H. , Pearce‐Kelly, P. , Kovacs, K. M. , Dudgeon, D. , Pacifici, M. , Rondinini, C. , Foden, W. B. , Martin, T. G. , Mora, C. , Bickford, D. , & Watson, J. E. M. (2016). The broad footprint of climate change from genes to biomes to people. Science, 354, aaf7671. 10.1126/science.aaf7671 [DOI] [PubMed] [Google Scholar]
- Schweizer, R. M. , vonHoldt, B. M. , Harrigan, R. , Knowles, J. C. , Musiani, M. , Coltman, D. , Novembre, J. , & Wayne, R. K. (2016). Genetic subdivision and candidate genes under selection in North American grey wolves. Molecular Ecology, 25(1), 380–402. 10.1111/mec.13364 [DOI] [PubMed] [Google Scholar]
- Shugar, D. H. , Walker, I. J. , Lian, O. B. , Eamer, J. B. R. , Neudorf, C. , McLaren, D. , & Fedje, D. (2014). Post‐glacial sea‐level change along the Pacific coast of North America. Quaternary Science Reviews, 97, 170–192. 10.1016/j.quascirev.2014.05.022 [DOI] [Google Scholar]
- Silva, P. , López‐Bao, J. V. , Llaneza, L. , Álvares, F. , Lopes, S. , Blanco, J. C. , Cortés, Y. , García, E. , Palacios, V. , Rio‐Maior, H. , Ferrand, N. , & Godinho, R. (2018). Cryptic population structure reveals low dispersal in Iberian wolves. Scientific Reports, 8(1), 14108. 10.1038/s41598-018-32369-3 [DOI] [PMC free article] [PubMed] [Google Scholar]
- Sinding, M. H. S. , Gopalakrishan, S. , Vieira, F. G. , Samaniego Castruita, J. A. , Raundrup, K. , Heide Jørgensen, M. P. , Meldgaard, M. , Bent, P. , Sicheritz‐Ponten, T. , Mikkelsen, J. B. , Marquard‐Petersen, U. , Dietz, R. , Sonne, C. , Dalén, L. , Bachmann, L. , Wiig, Ø. , Hansen, A. J. , & Gilbert, M. T. P. (2018). Population genomics of grey wolves and wolf‐like canids in North America. PLoS Genetics, 14(11), e1007745. 10.1371/journal.pgen.1007745 [DOI] [PMC free article] [PubMed] [Google Scholar]
- Skoglund, P. , Ersmark, E. , Palkopoulou, E. , & Dalén, L. (2015). Ancient wolf genome reveals an early divergence of domestic dog ancestors and admixture into high‐latitude breeds. Current Biology, 25(11), 1515–1519. 10.1016/j.cub.2015.04.019 [DOI] [PubMed] [Google Scholar]
- Small, M. P. , Stone, K. D. , & Cook, J. A. (2003). American marten (Martes americana) in the Pacific Northwest: Population differentiation across a landscape fragmented in time and space. Molecular Ecology, 12(1), 89–103. 10.1046/j.1365-294X.2003.01720.x [DOI] [PubMed] [Google Scholar]
- Smeds, L. , Aspi, J. , Berglund, J. , Kojola, I. , Tirronen, K. , & Ellegren, H. (2020). Whole‐genome analyses provide no evidence for dog introgression in Fennoscandian wolf populations. Evolutionary Applications, 14, 721–734. 10.1111/eva.13151 [DOI] [PMC free article] [PubMed] [Google Scholar]
- Stange, M. , Sánchez‐Villagra, M. R. , Salzburger, W. , & Matschiner, M. (2018). Bayesian divergence‐time estimation with genome‐wide single‐nucleotide polymorphism data of sea catfishes (Ariidae) supports Miocene closure of the Panamanian Isthmus. Systematic Biology, 67(4), 681–699. 10.1093/sysbio/syy006 [DOI] [PMC free article] [PubMed] [Google Scholar]
- Stone, K. D. , Flynn, R. W. , & Cook, J. A. (2002). Post‐glacial colonization of northwestern North America by the forest‐associated American marten (Martes americana, Mammalia: Carnivora: Mustelidae). Molecular Ecology, 11(10), 2049–2063. 10.1046/j.1365-294X.2002.01596.x [DOI] [PubMed] [Google Scholar]
- Stronen, A. V. , Jędrzejewska, B. , Pertoldi, C. , Demontis, D. , Randi, E. , Niedziałkowska, M. , Pilot, M. , Sidorovich, V. E. , Dykyy, I. , Kusak, J. , Tsingarska, E. , Kojola, I. , Karamanlidis, A. A. , Ornicans, A. , Lobkov, V. A. , Dumenko, V. , & Czarnomska, S. D. (2013). North‐south differentiation and a region of high diversity in European wolves (Canis lupus). PLoS One, 8(10), e76454. 10.1371/journal.pone.0076454 [DOI] [PMC free article] [PubMed] [Google Scholar]
- Stronen, A. V. , Navid, E. L. , Quinn, M. S. , Paquet, P. C. , Bryan, H. M. , & Darimont, C. T. (2014). Population genetic structure of gray wolves (Canis lupus) in a marine archipelago suggests Island‐mainland differentiation consistent with dietary niche. BMC Ecology, 14(1), 11. 10.1186/1472-6785-14-11 [DOI] [PMC free article] [PubMed] [Google Scholar]
- Talala, M. S. , Bondarev, A. Y. , Zakharov, E. S. , & Politov, D. V. (2020). Genetic differentiation of the wolf Canis lupus L. populations from siberia at microsatellite loci. Russian Journal of Genetics, 56(1), 59–68. 10.1134/S1022795420010123 [DOI] [Google Scholar]
- Turner, N. , Lepofsky, D. , & Deur, D. (2013). Plant management systems of British Columbia's first peoples. BC Studies: The British Columbian Quarterly, 179, 107–133. 10.14288/bcs.v0i179.184112 [DOI] [Google Scholar]
- Van Valkenburgh, B. , Hayward, M. W. , Ripple, W. J. , Meloro, C. , & Roth, V. L. (2016). The impact of large terrestrial carnivores on Pleistocene ecosystems. Proceedings of the National Academy of Sciences of the United States of America, 113(4), 862–867. 10.1073/PNAS.1502554112/-/DCSUPPLEMENTAL [DOI] [PMC free article] [PubMed] [Google Scholar]
- Vershinina, A. O. , Heintzman, P. D. , Froese, D. G. , Zazula, G. , Cassatt‐Johnstone, M. , Dalén, L. , Der Sarkissian, C. , Dunn, S. G. , Ermini, L. , Gamba, C. , Groves, P. , Kapp, J. D. , Mann, D. H. , Seguin‐Orlando, A. , Southon, J. , Stiller, M. , Wooller, M. J. , Baryshnikov, G. , Gimranov, D. , … Shapiro, B. (2021). Ancient horse genomes reveal the timing and extent of dispersals across the Bering Land Bridge. Molecular Ecology, 30(23), 6144–6161. 10.1111/mec.15977 [DOI] [PubMed] [Google Scholar]
- vonHoldt, B. M. , Pollinger, J. P. , Earl, D. A. , Knowles, J. C. , Boyko, A. R. , Parker, H. , Geffen, E. , Pilot, M. , Jedrzejewski, W. , Jedrzejewska, B. , Sidorovich, V. , Greco, C. , Randi, E. , Musiani, M. , Kays, R. , Bustamante, C. D. , Ostrander, E. A. , Novembre, J. , & Wayne, R. K. (2011). A genome‐wide perspective on the evolutionary history of enigmatic wolf‐like canids. Genome Research, 21(8), 1294–1305. 10.1101/gr.116301.110 [DOI] [PMC free article] [PubMed] [Google Scholar]
- Vorobyevskaya, E. A. , & Baldina, S. N. (2011). Altai wolf phylogeography (Canis lupus L.) studied by microsatellite markers. Moscow University Biological Sciences Bulletin, 66(2), 53–54. 10.3103/S0096392511020131 [DOI] [Google Scholar]
- Watson, T. (2017). Is theory about peopling of the Americas a bridge too far? Proceedings of the National Academy of Sciences of the United States of America, 114(22), 5554–5557. 10.1073/pnas.1705966114 [DOI] [PMC free article] [PubMed] [Google Scholar]
- Weckworth, B. , Talbot, S. , & Cook, J. (2010). Phylogeography of wolves (Canis lupus) in the Pacific Northwest. Journal of Mammalogy, 91, 363–375. 10.1644/09-mamm-a-036.1 [DOI] [Google Scholar]
- Weckworth, B. V. , Dawson, N. G. , Talbot, S. L. , Flamme, M. J. , & Cook, J. A. (2011). Going coastal: Shared evolutionary history between coastal British Columbia and Southeast Alaska wolves (Canis lupus). PLoS One, 6(5), e19582. 10.1371/journal.pone.0019582 [DOI] [PMC free article] [PubMed] [Google Scholar]
- Weckworth, B. V. , Talbot, S. , Sage, G. K. , Person, D. K. , & Cook, J. (2005). A signal for independent coastal and continental histories among North American wolves. Molecular Ecology, 14(4), 917–931. 10.1111/j.1365-294X.2005.02461.x [DOI] [PubMed] [Google Scholar]
- Yackulic, C. B. , Sanderson, E. W. , & Uriarte, M. (2011). Anthropogenic and environmental drivers of modern range loss in large mammals. Proceedings of the National Academy of Sciences of the United States of America, 108(10), 4024–4029. 10.1073/pnas.1015097108 [DOI] [PMC free article] [PubMed] [Google Scholar]
Associated Data
This section collects any data citations, data availability statements, or supplementary materials included in this article.
Supplementary Materials
Data S1
Data Availability Statement
The wolf genotypes produced in this study can be accessed through The Open Science 515 Framework using the following link: https://doi.org/10.17605/OSF.IO/3GTNM.
Benefits Generated: A research collaboration was developed with the scientists who provided genetic samples, with all collaborators included as coauthors of this manuscript. Additionally, the results of this research have been shared with the provider and broader scientific community through public databases, as described above.