

Abstract
Acute myeloid leukemia (AML) results from aberrant hematopoietic processes and these changes are frequently initiated by chromosomal translocations. One particular subtype, AML with translocation t(7;12)(q36;p13), is found in children diagnosed before 2 years of age. The mechanisms for leukemogenesis induced by t(7;12) is not understood, in part because of the lack of efficient methods to reconstruct the leukemia‐associated genetic aberration with correct genomic architecture and regulatory elements. We therefore created induced pluripotent stem cell (iPSC) lines that carry the translocation t(7;12) using CRISPR/Cas9. These t(7;12) iPSC showed propensity to differentiate into all three germ layers, confirming retained stem cell properties. The potential for differentiation into hematopoietic stem and progenitor cells (HSPC) was shown by expression of CD34, CD43 and CD45. Compared with the parental iPSC line, a significant decrease in cells expressing CD235a and CD41a was seen in the t(7;12) iPSC‐derived HSPC (iHSPC), suggesting a block in differentiation. Moreover, colony formation assay showed an accumulation of cells at the erythroid and myeloid progenitor stages. Gene expression analysis revealed significant down‐regulation of genes associated with megakaryocyte differentiation and up‐regulation of genes associated with myeloid pathways but also genes typically seen in AML cases with t(7;12). Thus, this iPSC t(7;12) leukemia model of the t(7;12) AML subtype constitutes a valuable tool for further studies of the mechanisms for leukemia development and to find new treatment options.
Keywords: AML, chromosome translocation, leukemia, pluripotency, stem cells
What's new?
Acute myeloid leukemia results from aberrant hematopoietic processes that are often initiated by chromosomal translocations. The mechanisms underlying leukemogenesis in pediatric patients with the t(7;12) translocation remain poorly understood. Here, the authors have created induced pluripotent stem cells (iPSC) with the t(7;12)(q36;p13) translocation using CRISPR/Cas9 technology. Characterization of these iPSC shows cell differentiation and growth properties as well as a gene expression signature similar to those seen in patients with t(7;12) acute myeloid leukemia. This model represents a valuable tool for further studies of the mechanisms behind the development of pediatric leukemia caused by this translocation.

Abbreviations
- AML
acute myeloid leukemia
- CFU
colony forming unit
- FISH
fluorescence in situ hybridization
- HSPC
hematopoietic stem and progenitor cells
- iHSPC
induced hematopoietic stem and progenitor cell
- iPSC
induced pluripotent stem cell
- PCA
principal component analysis
- SNP
single nucleotide polymorphism
1. INTRODUCTION
Acute myeloid leukemia (AML) is the result of aberrant hematopoietic processes, such as enhanced proliferation, blocked differentiation and dysregulated apoptosis of hematopoietic stem and progenitor cells (HSPC), frequently initiated by chromosomal translocations. In children, AML is associated with higher rates of relapse and death as compared with acute lymphoblastic leukemia. In the current study we have focused on a chromosomal alteration that is found in AML only in children diagnosed before 2 years of age, namely the chromosomal translocation t(7;12)(q36;p13). This AML subtype has been associated with poor prognosis and the reasons for this and potential targeted treatment strategies remain to be shown. 1 , 2 The position of the translocation breakpoints is typically localized in a breakpoint cluster region distal to MNX1 gene on chromosome 7 and within intron 1 or 2 of the ETV6 gene on chromosome 12. No difference in outcome has been seen between these two variants. 3 , 4 The ETV6 gene encodes a transcriptional repressor that plays a critical role in hematopoiesis and in embryonic development. 5 The MNX1 gene encodes a homeodomain protein that is highly conserved and functions as a transcription factor. It is expressed during embryogenesis and is essential for the formation of the dorsal pancreatic bud and B‐cell maturation. 6 , 7
The translocation t(7;12) suggests that a fusion gene between MNX1 and ETV6 can be generated and MNX1‐ETV6 gene transcripts can also be detected in leukemia cells from approximately half of AML patients with t(7;12). 1 Since the complete MNX1 coding region is typically translocated, a reciprocal fusion transcript is not detected. 1 All t(7;12) AML patients typically display an increased expression of the wild type MNX1 gene, which has been associated with a block in differentiation of HSPC, and therefore suggested to play a major role in leukemia development. 8 , 9 The mechanism behind this ectopic expression of MNX1 has not been established but enhancer high‐jacking and alternative splicing might explain this phenomenon. High expression of MNX1 has also been reported in other malignancies, such as prostate cancer, hepatocellular carcinoma and colon carcinoma. 10 , 11 , 12
The MNX1‐ETV6 fusion and/or the aberrant MNX1 expression and their respective role in leukemia transformation is presently not fully understood at the molecular level, mainly due to scarceness of available patient leukemia material and lack of suitable experimental models. Efficient methods for modeling leukemia and to recreate leukemia‐associated genetic aberrations, such as chromosome translocations, are crucial for investigating how leukemia is initiated. Today, most such models are murine and based on introduction of a gene or a gene fusion of interest under the control of a constitutive active or inducible promoter using lenti‐ or retroviral transduction rather than the chromosomal translocation itself. This might introduce unwanted off‐target effect by the viral integration into the genome. Also, the gene fusion may lack properties carried by the translocation itself, such as the genomic architecture with correct regulatory elements. The technique to generate induced human pluripotent stem cells (iPSC) from somatic cells of human origin has provided new tools for disease modeling. The iPSCs are relatively easy to manipulate genetically utilizing the CRISPR/Cas9 technology and can be differentiated into the relevant cell type of interest, in the case of leukemia HSPC. We have here modified a protocol for translocation formation using CRISPR/Cas9 13 to efficiently create iPSC with t(7;12). Characterization of these iPSC with t(7;12) showed cell differentiation and growth properties as well as a gene expression signature similar to leukemic cells from patients with t(7;12)AML. This model will therefore be a valuable tool for further studies of the mechanisms behind the leukemogenic effects of this translocation.
2. MATERIALS AND METHODS
2.1. Cell culture and reprogramming
Viable cells were available from one t(7;12)(q36;p13) AML patient, diagnosed at our department. Viable frozen bone marrow cells from the patient were thawed and recovered in StemPro medium (Gibco/ThermoFisher Scientific) for 48 h. Reprogramming was performed using CytoTune‐iPS 2.0 Sendai Reprogramming kit (Invitrogen/ThermoFisher Scientific) with slight modifications. The PBMC protocol was followed but with a feeder‐free approach; at day 3 posttransduction the cells were seeded on Coat‐1 from the DEF‐CS system (Cellartis/Takara Bio Europe) but in StemPro medium. At day 7 the transitioning into the DEF‐CS medium was started and followed by daily medium changes. Colonies were mechanically passaged to new Coat‐1 coated culture dishes in DEF‐CS medium. Later passages were done enzymatically as single cells with TrypLE Select (Gibco/ThermoFisher Scientific). A second reprogramming was done on CD34+ enriched cells from the bone marrow utilizing the CD34 MicroBead Kit UltraPure (Milteny Biotech) 48 h after thaw as above. The CD34+ cells were kept in StemPro medium for 24 h before reprogramming with the CytoTune‐iPS 2.0 Sendai Reprogramming kit, following the CD34+ protocol. From day 3, the same feeder‐free procedure as above was pursued. The resulting iPSC clones were tested for pluripotency with the BD Stemflow Human and Mouse Pluripotent Stem Cell Analysis Kit (BD Biosciences).
The human iPSC line ChiPSC22 (RRID:CVCL_RN02) (Cellartis/Takara Bio Europe) was maintained in the feeder‐free DEF‐CS culture system under standard conditions. The cells were transferred to Corning Matrigel (BD Biosciences) and mTeSR1 medium (StemCell Technologies Inc.) for 2 to 3 passages before differentiation to hematopoietic cells utilizing STEMdiff Hematopoietic kit (Stemcell Technologies Inc.) according to protocol. At day 12 of differentiation the hematopoietic cells were harvested and analyzed by immunophenotyping, RT‐qPCR and CFU assays. For flow cytometry, cells were recovered overnight in StemSpan SFEM II + CC100 (Stemcell Technologies Inc.) and the CD34 + CD43 + CD45+ cell pool was sorted on a FACS Aria IIu (BD Biosciences) before RNA preparations for RNAseq and RT‐qPCR. For continuous culture, unsorted cells were kept in StemSpan SFEM II + CC100 for up to 14 days. Cells were counted and diluted to 0.8 × 10⁶/ml every 48 h by centrifuging cells, saving 25% of the old medium and adding 75% fresh medium. Cell divisions were calculated from the formula where s = number of cells at start and p = number of cells at end (48 h later). All cell culture work was conducted under strictly controlled mycoplasma free conditions. The ChiPSC22 cell line has recently been authenticated using short tandem repeat profiling (August 2021).
2.2. CRISPR/Cas9 based translocation procedure
CRISPR RNAs were designed for chromosome 7 and 12, respectively, by “Custom Alt‐R CRISPR‐Cas9 guide RNA design tool” (Integrated DNA Technology, IDT) and chosen based on the best “on‐target potential” and “off target risk” combination from a list of 100 for every sequence tested. This resulted in the following breakpoints on chromosome 7; NC_000007.14:g.156984781 and chromosome 12; NC_000012.12:g.11797368, respectively. The crRNAs were synthesized at IDT and annealed to an ATTO550 tagged tracrRNA (IDT) to yield guideRNAs. Cas9 was introduced as a protein to make a Cas9:gRNA ribonucleoprotein (RNP) complex before delivery into the cells. Sequences for the crRNAs are listed in Table S1. The 150 nt ssODNs (single stranded oligodeoxynucleotides) were designed to cover the fusion sites by joining 75 nt each from the two chromosome partners to generate der (7) and der (12). The ssODNs were synthesized at IDT as UltramerOligonucleotides (Table S1). The 4D‐Nucleofector (Lonza) was used with 16 well nucleocuvettes and program CA‐137. For each well a reaction was set up with 350 000 cells in 15 μl nucleofector solution P3 and a premix of RNP complexes and ssODNs in 6 μl. Directly after the pulses 75 μl medium was added and the cells transferred to a previously Coat‐1 coated well in a 24‐well plate containing 1 ml DEF‐CS medium. Cells from two transfections were pooled in one well. Twenty‐four hours posttransfection the ATTO‐550+ cells were sorted using blue laser with a 585/42 nm filter on a FACS Aria IIu (BD Biosciences). The cells were suspended in DEF‐CS medium, left to recover for 24 to 48 h as a bulk before seeding in Coat‐1 coated 96‐well plates at a dilution corresponding to 0.5 cell/well. Surviving cells were expanded and approximately 2 to 3 weeks after single cell seeding cells were taken for analysis of successful translocation. The lysis procedure from the Guide‐it mutation detection kit (Takara Bio Europe) was used for colony screen with direct PCR. Primer sequences are listed in Table S1. gBlocks (IDT) were synthesized as positive controls for the correct translocation by PCR (Table S1). The iPSC lines positive for a correct translocation by PCR and FISH were tested for differentiation potential to all three germ layers with STEMdiff Trilineage Differentiation kit (Stemcell Technologies Inc.) and analyzed by immunocytochemistry. (Antibodies are listed in Table S2). Pluripotency was also tested via “Confirmation of pluripotency by spin embryoid body formation” (Takara Bio). Eighteen days after the start of spin EB formation, cells were taken for analysis of germ‐layer specific gene expression by RT‐qPCR (Table S3).
2.3. Cytogenetic characterization
Fluorescence in situ hybridization (FISH) analysis, karyotyping‐banding and single nucleotide polymorphism (SNP)‐array were performed with standard procedures at the Cytogenetic laboratory, Department of Clinical Genetics and Genomics, Sahlgrenska University Hospital. FISH was done using a Double Fusion Break Apart probe specific for t(7;12)(q36;p13) (MetaSystems Probes). SNP‐array was performed using the CytoScan HD Array (ThermoFischer Scientific). The software Nexus Copy Number Discovery (BioDiscovery) was used for data analysis.
2.4. Immunophenotyping
For flow cytometry analysis, the cells were incubated with antibodies for 20 min at room temperature in PBS/1% BSA/2 mM EDTA, washed and resuspended in the same solution with the addition of 7‐AAD (BD Via‐Probe, BD Biosciences) just before analysis on a BD FACS Aria IIu (BD Biosciences). The BD FACSDiva software was utilized for recording and analyzing data. Doublets and dead cells were gated out before final analysis and isotype antibodies were used as negative controls (Figure S1 and Table S2). For Figure 3A, the free software Flowing was used.
FIGURE 3.
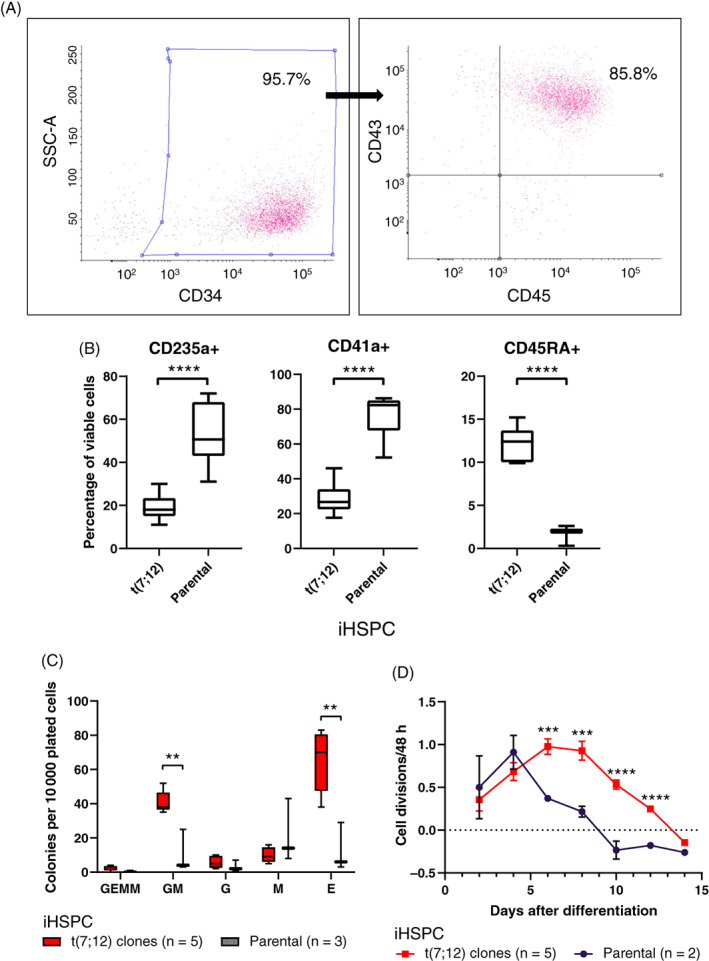
Analysis of iHSPC. (A) Flow cytometry showed efficient differentiation to hematopoietic cells by high CD34, CD43 and CD45 expression. Analysis was done on viable single cells and gatings were set on isotype control plots. The gated areas were used for sorting of triple positive population. Numbers shown are percentage of viable single cells and in the second graph the triple positive proportion (example from clone E). (B) Immunophenotyping by flow cytometry revealed that t(7;12) iHSPC lines have a significant decrease in number of CD235a+ and CD41a+ cells as well as an increase in CD45RA+ compared with the parental iHSPC. All cell lines were analyzed after repeated differentiation rounds, one to five times per line, CD235a; n = 19 + 7, CD41a; n = 10 + 6, CD45RA; n = 7 + 3, where n denotes total number of analyses for t(7;12) and the parental lines, respectively. ****P < .0001; see also Figure S1. (C) CFU analysis showed significantly more GM and E colonies as well as an increased total number of colonies in the t(7;12) iHSPC lines compared with the parental iHSPC. All five clones, A‐E, were analyzed once each and the parental line three times (E; erythroid, M; macrophage, G; granulocyte, GM; granulocyte, macrophage, GEMM; granulocyte, erythrocyte, macrophage, megakaryocyte). **P < .01. (D) An increased proliferative capacity for t(7;12) iHSPC lines compared with the parental iHSPC was seen by continuous culture after the 12 day differentiation protocol was over. All five clones, A‐E, were analyzed once each and the parental line twice. ****P < .0001, ***P < .001
Cytospins were made from 50 000 to 100 000 cells suspended in PBS, spun onto glass slides for 5 min at 400 rpm in a Shandon Cytospin 2 centrifuge, air dried and fixed in 4% formaldehyde solution. Cells on the cytospin slides were permeabilized with 0.1% Triton X‐100, washed and blocked with 5% fetal bovine serum +0.01% Tween20 in PBS. Antibodies (Table S2) were diluted, and staining performed according to manufacturer's recommendations. The slides were mounted with ProLong Gold Antifade Mountant with DAPI (Invitrogen/ThermoFisher Scientific).
2.5. CFU assay
Methocult H4435 Enriched (Stemcell Technologies) was used for the colony forming unit (CFU) assays where 5000 or 20 000 cells were plated/petri dish and incubated for 14 days according to the manufacturer's protocol.
2.6. Gene expression analysis
Total RNA was isolated using the miRNeasy Plus micro kit (Qiagen) and cDNA synthesized with SuperScript III First‐Strand Synthesis SuperMix for qRT‐PCR or SuperScript VILO cDNA Synthesis Kit (Invitrogen/ThermoFisher Scientific). TaqMan Gene Expression Assays (Table S3) and TaqMan Universal MasterMix II (Applied Biosystems/ThermoFisher Scientific) were used for probe‐based qPCR assays. A SYBR Green assay was used for the MNX1(ex1)‐ETV6(ex3) fusion detection (forward primer: CCCGACTTCAACTGCTTGCA, covering the splice site, and reverse primer: TGCTGTCAATTGGCCTTAAAGA), with primers synthetized at IDT and Power SYBR Green PCR Master Mix (Applied Biosystems/ThermoFisher Scientific). The reactions were performed on the ABI 7900HT Sequence Detection System (Applied Biosystems/ThermoFisher Scientific) with GUSB as the reference gene. Gene expression was calculated using the deltaCt method and is presented as 2−ΔCt.
RNA sequencing was performed at the Center for Medical Genomics, Department of Clinical Genetic and Genomics, Sahlgrenska University Hospital, Sweden, on a NextSeq 500 instrument (Illumina). The library preparation was done with TruSeq Stranded Total RNA Sample Preparation kit with Ribo‐Zero Gold (Illumina). For RNA‐seq analysis, alignment was carried out to reference human genome GRCH38(hg38) using STAR (version 2.9.0a) with the following parameters: outSAMtype BAM SortedByCoordinate. Quantification was carried out using HTSeq‐count (Python package HTSeq, python v 3.8.1) software using the following parameters ‐f bam ‐r pos ‐s no ‐m union with the reference annotation file. The human reference genome and annotation files were obtained from the Ensembl database. The sequencing coverage and quality statistics of the RNA sequencing data is listed in Table S4. Differential gene expression was performed using the R package “Deseq2.” 14 Genes with log2 (foldchange) 1 and false discovery rate (FDR) adjusted P value <.05 were considered differentially expressed genes (Table S5A).
Principal component (PCA) analysis and Pearson correlation heatmap analysis were performed in order to examine the level of differences in the gene expression profiles between control and t(7;12) samples. For pathway analysis two pathway databases were used; the Reactome pathway database and the Gene Ontology GO‐biological process database. A pathway was regarded significantly enriched when FDR <0.05, P value <.05 and >10 genes of the respective pathway were present. Gene Set Enrichment Analysis (GSEA) was used with the Gene Ontology GO‐biological process gene set. 15 A pathway in GSEA analysis was regarded significant at nominal P value <.05 and FDR <0.05 (Table S5B).
2.7. Gene expression comparison
For gene expression comparison analysis the significant differentially expressed genes from the RNA sequencing analysis of the t(7;12) induced HSPC was used (FDR <0.05, P value <.05, gene list in Table S5C). Microarray gene expression data from pediatric AML cases was retrieved from the GEO database (GSE17855) 16 and microarray and RNA Sequencing data was retrieved from the NCI TARGET database (https://target-data.nci.nih.gov/Public/AML/). AML gene expression profile analysis of this data set was performed using R packages “Affy” and “Limma.” The t(7;12) gene signature set was further validated using RNA sequencing data retrieved from the TARGET data set FHCRC‐LowDepth.
3. RESULTS
3.1. Leukemic cells from an AML patient with t(7;12)(q36;p13) are blocked in their potential to achieve pluripotency
Our first attempt to make a human disease model to study the mechanisms behind the t(7;12) AML development was to create an iPSC line directly from a patient sample with this translocation. The bone marrow sample from this patient contained 90% leukemic blasts positive for the t(7;12), but also had additional chromosomal aberrations typically found in this type of AML, in this case trisomy 8 and trisomy 19. Viably frozen bone marrow cells were subjected to reprogramming in two independent experiments, where the second was performed on CD34+ enriched bone marrow cells. Forty‐three iPSC clones were established, and the clones were defined as iPSC based on their expression of pluripotency markers, OCT3/4 and SSEA‐4, both positive on >99% of the cells. Interestingly, both FISH and G‐banding showed that all clones had a normal karyotype and lacked the t(7;12) translocation. Thus, leukemic cells from this AML patient with t(7;12) might have lost their potential to achieve pluripotency and the derived iPSC must therefore have originated from the very few normal nonleukemic cells in the bone marrow sample.
3.2. Efficient recreation of the t(7;12)(q36;p13) in human iPSC using CRISPR/Cas9
We consequently determined to use another approach, described by Torres‐Ruiz et al, 13 where they successfully generate several iPSC lines with a translocation t(11;22) with the CRISPR/Cas9 technology. Their protocol was slightly improved by including a fluorescent tag on the crisprRNA enabling FACS sorting of the successfully transfected cells increasing the yield of correct single cell clones. We used the human iPSC line ChiPSC22 (hereafter denoted parental iPSC) for introduction of the translocation. To mimic our patient's translocation, we chose to introduce the breakpoint in intron 2 of the ETV6 gene on chromosome 12. The breakpoint on chromosome 7 was placed in a region denoted CCB, Candidate Common Breakpoint, 13 to 26 kb downstream of MNX1. 3 The presence of the translocation was confirmed with PCR over the fusion site. Several different single‐cell derived iPSC clones were chosen for further analysis and were regarded as biological replicates. In total five different iPSC lines with the correct translocation were established, denoted t(7;12) iPSC (individual cell lines t(7;12)‐A‐E, respectively). The presence of the translocation was further verified by FISH, and mRNA expression of the MNX1‐ETV6 fusion transcript could be detected, although at a very low level (Figure 1A,B). Thus, a functional chromosomal rearrangement was verified. No other chromosomal alterations were seen when the t(7;12) iPSC lines were analyzed with conventional karyotyping and SNP array (Figure 1C,D).
FIGURE 1.
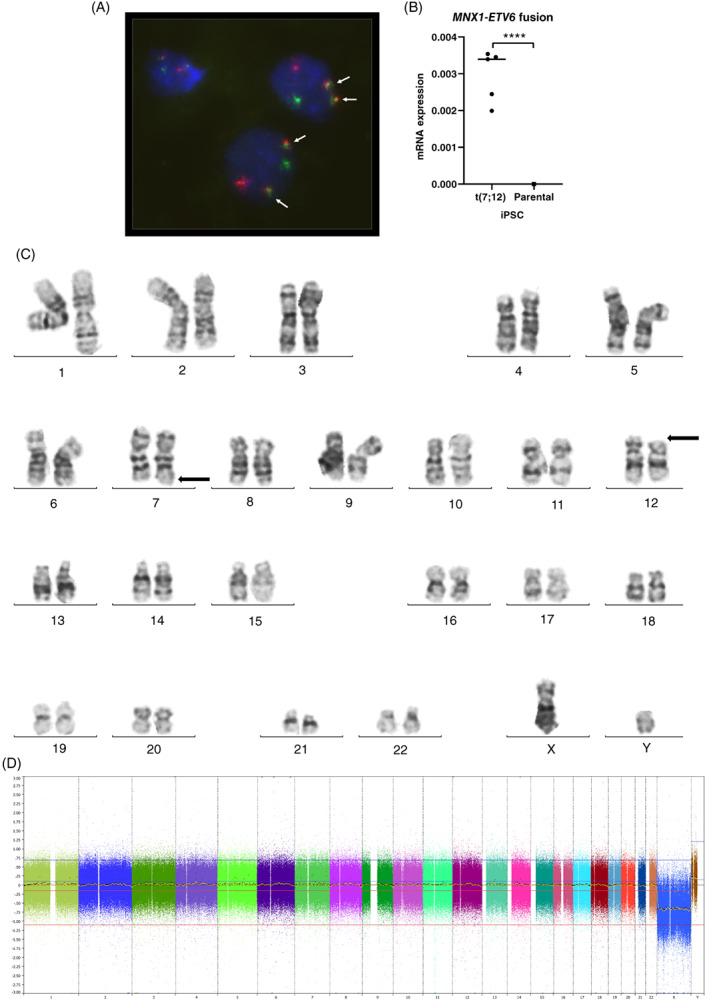
Human iPS cells with translocation t(7;12). (A) Human iPSC with t(7;12)(q36;p13) was created and the translocation was confirmed in all five clones with a FISH probe (Metasystems, Dual Fusion Break Apart probe) specific for t(7;12)(q36;p13) and indicated by arrows. Representative picture from clone A. (B) The presence of a functional fusion was confirmed by RT‐qPCR for the MNX1‐ETV6 transcript. Results are presented as 2−ΔCt vs endogenous reference gene GUSB (n = 5, all t(7;12) clones). (C) Conventional karyotype was performed on a subset of the clones as a complement to the FISH analysis. A representative metaphase from clone B is shown, with the translocation t(7;12) indicated (arrows). (D) SNP‐array was performed on all t(7;12) clones. No additional gains or losses of genetic material were detected. Representative SNP array from clone B is shown
3.3. Hematopoietic stem and progenitor cells differentiated from t(7;12) iPSCs show increased proliferation and are blocked at the megakaryocytic and erythroid progenitor stage
To confirm retained stem cell properties after introduction of the translocation, directed and spontaneous differentiation via embryoid bodies were investigated. The t(7;12) iPSCs showed similar propensity as the parental iPSC to differentiate into all three germ layers, as shown by expression of markers specific for endo‐, ecto‐ and mesoderm (Figure 2A,B). To be able to study the function and effects of the translocation in the appropriate cellular context, the iPSC lines were differentiated into HSPC. The resulting induced HSPC (iHSPC) displayed the expected combined expression of CD34, CD43 and CD45 (Figure 3A). When analyzed with a broader panel of markers for subpopulation of hematopoietic cells, the t(7;12) iHSPC showed a significant decrease in cells expressing CD235a and CD41a, and an increased expression of CD45RA compared with the parental iHSPC (Figures 3B and S1). This finding suggests a block in differentiation into the erythroid and megakaryocytic lineages and a shift towards the myeloid lineage. CFU analysis showed increased colony formation, in particular for BFU‐E and GM colonies, but also total cell numbers in the t(7;12) iHSPC compared with the parental iHSPC, indicating that cells were detained at the progenitor stage and with an increased proliferative capacity (Figure 3C). However, CFU secondary replating did not give rise to any colonies but continuous culturing of the iHSPC, we could see an increased proliferative capacity of the t(7;12) compared with the parental iHSPC (Figure 3D and Table S6).
FIGURE 2.
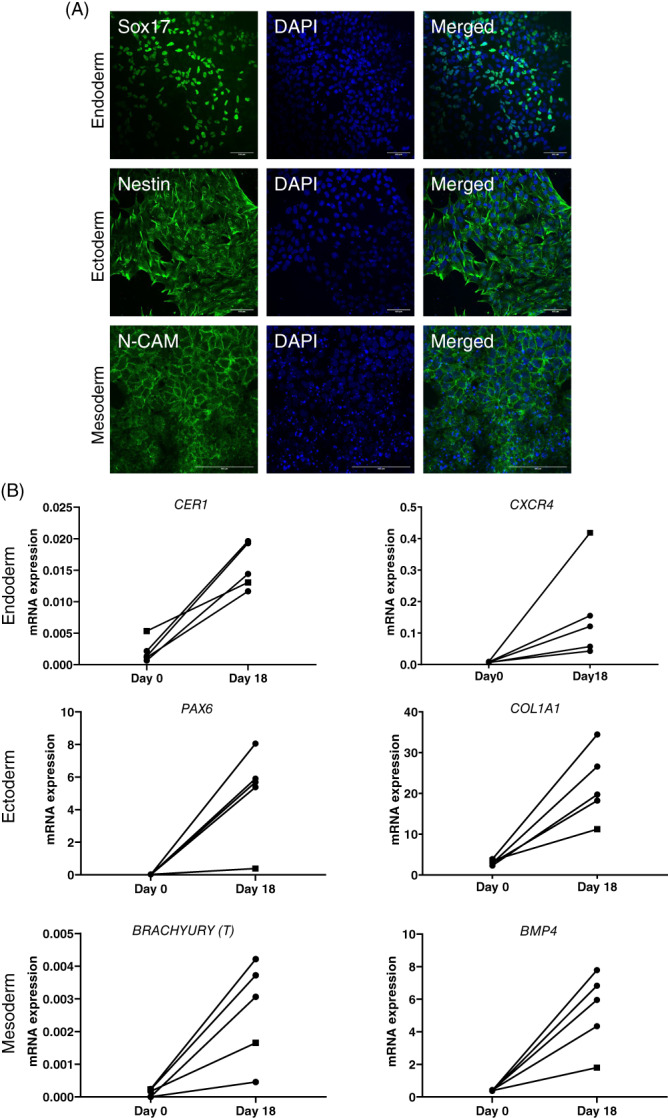
The CRISPR/Cas9‐generated iPSCs with the t(7;12) translocation showed propensity to differentiate into all three germ layers. (A) STEMdiff Trilineage Differentiation kit was utilized for directed differentiation towards the three germ layers and resulting cells were analyzed by immunocytochemistry. Four t(7;12), clone A, B, C, E and the parental lines were analyzed, here exemplified by clone C (scale bar = 100 μm). (B) Spontaneous differentiation via embryoid bodies (EBs) were analyzed after 18 days for gene expression with RT‐qPCR. Results are presented as 2−ΔCt vs endogenous reference gene GUSB. Four t(7;12) lines (A, B, C and E, circles) and the parental line, ChiPSC22, (square) analyzed
3.4. High expression of the MNX1 gene is induced in t(7;12) iHSPC
The translocation t(7;12) indicates that a fusion gene between MNX1 and ETV6 can be generated and the MNX1‐ETV6 gene fusion transcript was also detected in our iHSPC harboring the t(7;12) (Figure 4A). To investigate whether the translocation had any influence on the expression of full‐length MNX1, expression was analyzed with RT‐qPCR and immunocytochemistry in the parental and t(7;12) iHSPC (Figure 4B,C). The MNX1 gene was barely expressed or expressed at very low levels in the undifferentiated iPSCs, both in the parental and the t(7;12) cell lines, and could not be detected at the protein level. Upon differentiation into HSPC, the t(7;12) iHSPC showed a high mRNA expression of both the MNX1‐ETV6 fusion as well as MNX1 compared with the parental iHSPC (Figure 4A,B), and MNX1 could also be detected at the protein level (Figure 4C).
FIGURE 4.
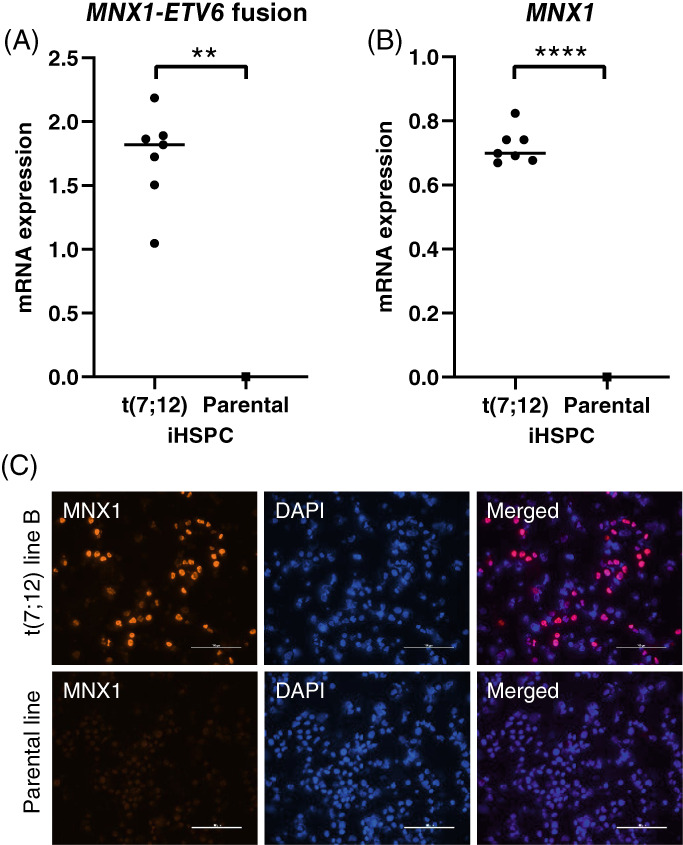
MNX1‐ETV6 and MNX1 expression in iHSPC. (A) The MNX1‐ETV6 fusion transcript was expressed only in the t(7;12) iHSPC analyzed by RT‐qPCR. Four clones analyzed, total n = 7 (A; n = 2, C; n = 2, D; n = 2, E; n = 1). Results are presented as 2−ΔCt vs endogenous reference gene GUSB. (B) A high expression of MNX1 was detected in t(7;12) iHSPC but was not detectable in the parental iHSPC with RT‐qPCR. Same clones analyzed as in 4A. (C) Immunocytochemistry on cytospins showed protein expression of MNX1 in the t(7;12) iHSPC but not in the parental iHSPC (scale bar = 100 μm). All clones analyzed, results shown for t(7;12) line B and parental line
3.5. Gene expression analysis of t(7;12) iHSPC revealed enrichment in pathways commonly affected in AML
The next step to investigate our t(7;12) iHSPC clones was to perform global transcriptome analysis. RNA sequencing was performed on iPSC differentiated into iHSPC, and differentially expressed genes and affected signaling pathways were identified by comparing the t(7;12) iHSPC to iHSPC from the parental iPSC. The read quality of all samples was deemed good, with the number of QC‐passed reads per sample ranging from 31.6 to 45.0 million and the fraction of uniquely mapped reads ranging from 81% to 89%. Pearson correlation heatmap and PCA showed a clear separation of the four sequenced t(7;12) iHSPC clones (A‐D) from the parental iHSPC on the first principal component and strong clustering of t(7;12) and parental iHSPC samples, respectively, (Figure S2A,B). Analysis of the most significant differentially expressed genes showed an abundance of genes that were downregulated in the t(7;12) iHSPC compared with the parental iHSPC (Figure 5A). Of the differentially expressed upregulated genes, MNX1 was the most significant. Elevated expression of the long noncoding RNA, MNX1‐AS1 and MNX1‐AS2, from the same gene locus as MNX1 was also observed.
FIGURE 5.
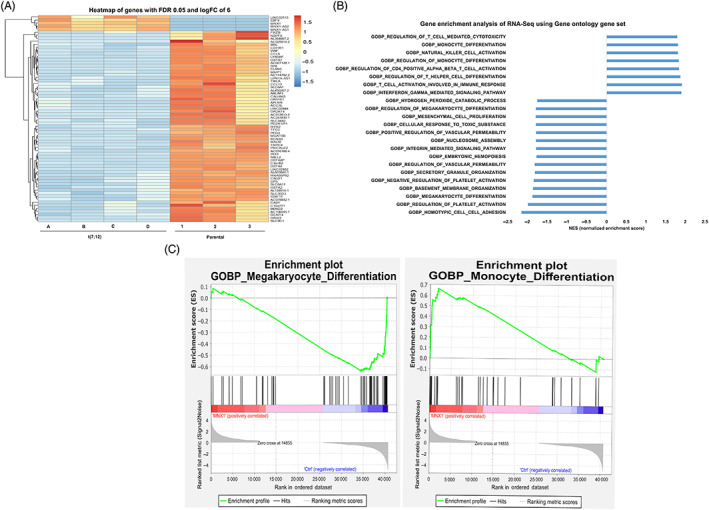
Heatmap and pathway analysis of differentially expressed genes in t(7;12) iHSPC. (A) Expression heatmap of the top 50 genes differentially expressed. Log2‐transformed expression fold change of expression, t(7;12) vs parental ChiPSC22 differentiated into iHSPC. (B) Gene set enrichment analysis. Bar chart showing the degree of enrichment as indicated by a normalized enrichment score or NES for control iPSC cells vs t(7;12) iPSC cells using the gene ontology biological pathway data set. (C) GSEA enrichment plot showing that positive enrichment of the monocyte differentiation and the negative enrichment of the megakaryocyte differentiation. Nominal P value = 0, FDR < 0.05
Pathway analysis based on the Reactome pathway database and the Gene Ontology GO‐biological process database, revealed a significant enrichment in immune, cell cycle and DNA repair pathways. Among the significant regulated immune pathways were myeloid differentiation and megakaryocyte differentiation pathways, in addition to leukocyte migration, cytokine production and T‐cell differentiation pathways (Figure S2C,D). Gene Set Enrichment Analysis (GSEA) was performed using the Gene Ontology GO‐biological process gene set and the all genes with normalized counts from the parental iHSCP and the t(7;12) iHSPC (Table S5B) to determine whether we could see any statistically significant differences between them. This analysis showed a significant enrichment of several immune pathways including monocytic and megakaryocytic differentiation in line with the Reactome pathway analysis (Figure 5B,C).
3.6. Comparison with gene expression signatures in pediatric acute myeloid leukemia
In order to assess the similarity between our iPSC model and AML with t(7;12), we compared the differentially expressed genes found in t(7;12) iHSPC with differentially expressed genes found in different pediatric AML using data retrieved from the TARGET database. This global comparison revealed an overlap where approximately 30% of the differentially expressed genes were in common with AML with t(7;12) but this degree of overlap was also seen with other subtypes of pediatric AML with recurrent chromosomal aberrations. We could not identify a specific pathways, using either Reactome or GO‐analysis, that was significant and overlapping between (7;12) iHSPC and t(7;12) AML samples from patients. Since AML subtypes with recurrent chromosomal aberrations typically have characteristic gene expression signatures based on a limited set of genes that are enough for their identification, we compared such signatures obtained from 237 pediatric AML cases 16 with our differentially expressed genes from t(7;12) iHSPC (Table S5C). This comparison revealed an overlap of 84% with t(7;12) AML and this degree of overlap could not be seen when compared with other pediatric AML subtypes (Figure 6A and Table S7). Thus, among the genes that were most discriminating and differentially expressed in t(7;12) AML compared with other pediatric AML subtype almost all were also differentially expressed in our t(7;12) iHSPC, and could also be verified by RT‐qPCR (Figure 6B and Table S7). Furthermore, using an independent RNAseq data set from the TARGET database we could verify that the same genes were differentially expressed in t(7;12) AML cases and that these genes also differ in their expression from most other types of pediatric AML (Figure S3).
FIGURE 6.
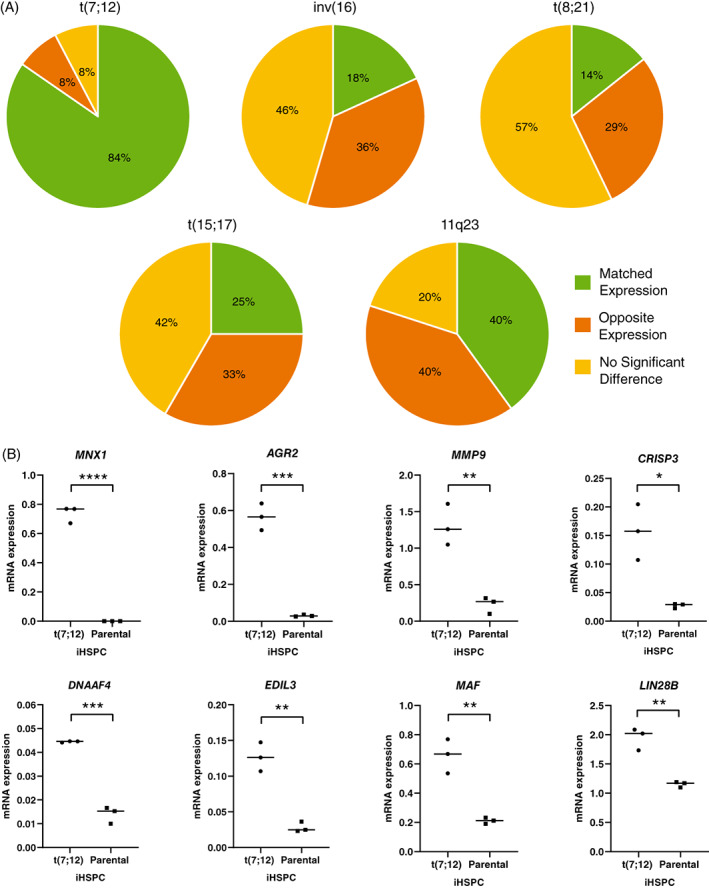
Comparison of gene expression signatures. (A) Pie chart illustrating the overlap of differentially expressed genes from RNA sequencing of t(7;12) iHSPC compared with pediatric leukemia gene expression signatures from patients with different AML subtypes. (B) RT‐qPCR of representative genes to validate the RNA sequencing results. RNA prepared from FACS sorted triple positive populations of cells, three different t(7;12) lines; A,C,D and the parental line differentiated at three different occasions. Results are presented as 2−ΔCt vs endogenous reference gene GUSB. ****P < .0001, ***P < .001, **P < .01, *P < .05
4. DISCUSSION
In this study we have created a human iPSC model of pediatric AML harboring the t(7;12) (q36;p13) using CRISPR/Cas9 technology. The iHSPC that were derived from these iPSC showed features typically seen in this type of leukemia, such as an induced block in differentiation and increased proliferative capacity. We could also verify that the translocation lead to ectopic and high expression of the homeodomain protein MNX1 in t(7;12) iHSPC, which is also a hallmark typically found in AML samples from patients. 1
Using iPSC derived from leukemia samples from patients has been suggested as a source to make suitable disease models, and some successful examples have also been reported. 17 Our finding that leukemic cells from AML patients with t(7;12)(q36;p13) seem to be blocked in their potential to achieve pluripotency is interesting. This implies that these leukemic cells also have a block in dedifferentiation capacity, and that this could be attributed to the epigenetic and genetic aberrations inherent to this type of AML. This is also in line with findings in other studies, where it has been shown that the ability to make iPSC from acute leukemia samples from patients is far from always possible. 18 To overcome this we instead used a modified CRISPR/Cas9 protocol to create iPSC clones with the t(7;12)(q36;p13). This comes with the advantage that we now have several iPSC clones that only harbor the translocation and no other genetic alterations that are typically seen in this AML, for example, trisomy 8 and trisomy 19. This makes it possible to further dissect the importance of individual genetic alterations where gene‐editing can be done stepwise, introducing one modification after another, studying the effect of each modification alone and in combination.
When we differentiated the t(7;12) iPSC to iHSPC we saw a relative block in their ability to differentiate into the megakaryocytic and erythroid linage and an accumulation at the progenitor stage. These findings corroborate well with what has been reported in another experimental model, where MNX1 transduced primary murine HSPC underwent profound differentiation arrest and accumulated at the megakaryocyte and erythrocyte progenitor stage. 8 Gene expression analysis of t(7;12) iHSPC also revealed pathway enrichment of genes associated with myeloid differentiation and megakaryocyte differentiation as well as leukocyte migration and cytokine production. In the majority of these the effects were negative, thus reflecting a down‐regulation, or lack of activation, of genes and a subsequent blockade of the pathways regulating cell differentiation. This is a hallmark of AML in general, and to find drugs that can overcome this block and induce differentiation has been one major focus to treat AML. 19 We also observed an increased proliferative and an increased colony formation capacity of t(7;12) iHSPC compared with parental iHSCP have. However, these cells did not give rice to new colonies in secondary replating, suggesting they do not have enhance self‐renewal capacity in vitro.
Our comparison of differentially expressed genes in t(7;12) iHSP and human AML revealed a clear enrichment of genes that are both typically expressed in t(7;12) AML compared with other forms of AML and that were also differentially expressed in the t(7;12) iHSPC. For this comparison, we used expression signatures introduced by Balgobind et al, 16 showing the potential to classify pediatric acute myeloid leukemia. Using gene expression microarray data from pediatric AML cases, Balgobind et al could correctly predict the most prevalent cytogenetic subtypes of pediatric acute myeloid leukemia with high accuracy. When comparing differentially expressed genes from the t(7;12) iHSPC to this more restricted set of differentially expressed genes from patient material we could see a large overlap between patients with t(7;12) and our generated t(7;12) iHSPC. This gene set was also verified when we analyzed a data set from TARGET representing a larger cohort of pediatric AML cases.
This shows that t(7;12) iHSPC reconstitutes a core gene expression signature similar to that of t(7;12) AML. Several of these identified core genes can also give important leads to the mechanism behind this type of leukemia. On a global level, there was however no unique RNA expression pattern or specific pathway overlapping significantly between t(7;12) iHSCP and t(7;12) AML patients. It has been shown that pediatric AML with different recurrent chromosomal aberrations share the majority of differentially expressed genes when compared with normal bone marrow. 20 This together with the fact that we were comparing results from cells cultured in vitro perhaps make such an effort futile.
The dramatic increase in MNX1 expression in the t(7;12) iHSCP is likely connected to the effects seen on differentiation and proliferation, although the mechanism behind the high expression of the MNX1 gene in t(7;12) AML is not known. Our findings however indicate that this is most likely directly linked to the chromosomal translocation itself and is presumably an enhancer hijacking event of a hitherto unidentified enhancer. The activity of this enhancer is most likely restricted to hematopoietic cells since we only saw high MNX1 expression in the t(7;12) iHSPC and not t(7;12) iPSC. We also saw that LIN28B is expressed in t(7;12) AML and in our t(7;129 iHSPC and this upregulation is potentially an intriguing finding. Lin28b has previously been shown to govern fetal hematopoiesis and its expression is severely reduced postpartum in normal hematopoietic cells. 21 Since the majority of patients harboring t(7;12) AML are diagnosed before 6 months of age and is typically not found in AML patients older than 2 years of age, development of t(7;12) AML may be restricted to fetal hematopoiesis. 2 Another interesting gene with high expression in t(7, 12) AML and our t(7;12) iHSCP is AGR2. AGR2 is a protein that plays a role in cell migration, cellular transformation, is a known p53 inhibitor and has been connected to drug resistance. 22 , 23 It has been shown that MNX1 induces senescence in human HT1080 and murine NIH3T3 cells through the p53 pathway 8 why inhibition of p53 might be a prerequisite for malignant transformation by MNX1.
In conclusion, our human t(7;12) iPSC model will be a valuable tool to continue to investigate the transforming effects by MNX1 in hematological malignancies. An interesting observation is that the t(7;12) AML is basically only found in infants or very young children. This suggests that MNX1 might be such a strong inducer or driver of leukemia transformation that it does not need any additional genetic lesions and therefore presents itself early. However, the exclusiveness of this AML to infants also suggests that the HSPC that can be transformed are only present during fetal development or early infancy and that leukemia initiation therefore can only occur in a window of early hematopoiesis, making our iPSC model extra suitable to address these questions. Furthermore, this model will be ideal to reveal the mechanism behind the activation of the MNX1 gene, to target its downstream effectors, and to investigate possible treatment strategies by drug screening.
AUTHOR CONTRIBUTIONS
Lars Palmqvist, Tina Nilsson and Ahmed Waraky designed the research study. Tina Nilsson, Ahmed Waraky, Anders Östlund, Susann Li, Anna Staffas performed laboratory work and data analysis. Jonas Abrahamsson and Linda Fogelstrand provided patient samples. Tina Nilsson, Ahmed Waraky, Anders Östlund, Anna Staffas, Julia Asp, Linda Fogelstrand and Lars Palmqvist analyzed the combined data and wrote the paper. All authors approved of the final version. The work reported in the paper has been performed by the authors unless clearly specified in the text.
CONFLICT OF INTEREST
The authors declare no conflict of interest associated with this paper.
ETHICS STATEMENT
The study was performed in accordance with the Declaration of Helsinki, and parents of the patient have given written informed consent. The research ethics committee at University of Gothenburg approved the study, Dnr 746/03 and 238/07.
Supporting information
TABLE S1 Nucleotide sequences
TABLE S2 Antibodies for immunophenotyping
TABLE S3 TaqMan Gene Expression Assays (Applied Biosystems)
TABLE S4 RNA sequencing data quality
TABLE S5 Normalized counts
TABLE S6 Cell counts of individual cell lines, total cell numbers ×106
TABLE S7 Overlap of differentially expressed genes in t(7;12) iHSPC to gene expression signatures of pediatric AML subtypes
FIGURE S1 Representative flow cytometry plots from BD FACS Aria IIu. Analysis was done on viable single cells using the BD FACSDiva software and gatings were set on the isotype controls. Results shown for t(7;12) clone A
FIGURE S2 Pearson correlation heatmap, PCA and GO pathway analysis of differentially expressed genes in t(7;12) iHSPC. (A) Pearson correlation heatmap of the t(7;12) iHSPC clones and biological replicates of parental iHSPC. (B) PCA showing a clear separation of the four analyzed t(7;12) iHSPC clones from the biological replicates of parental iHSPC. (C) Most enriched pathways analysis using the reactome. (D) Most significant regulated immune pathways using the gene‐ontology tools.
FIGURE S3 Gene expression profile of genes found differentially expressed in t(7;12) AML compared with other pediatric AML subtypes in the TARGET data set FHCRC‐LowDepth
ACKNOWLEDGEMENTS
This study was supported by grants from the Cancerfonden (CAN2017/461), the Barncancerfonden (PR2014‐0125 and PR2019‐0013, TJ2019‐0053) and Västra Götalandsregionen (ALFGBG‐431881). The computations were enabled by resources in project (SNIC 2021/22‐754) provided by the Swedish National Infrastructure for Computing (SNIC) at UPPMAX, partially funded by the Swedish Research Council (2018‐05973). The authors would like to acknowledge Clinical Genomics Gothenburg, Science for Life Laboratory, Sahlgrenska Akademin, Göteborgs Universitet and Center for Medical Genomics, Department of Clinical Genetic and Genomics, Sahlgrenska University Hospital, Sweden, for providing sequencing assistance and bioinformatic services.
Nilsson T, Waraky A, Östlund A, et al. An induced pluripotent stem cell t(7;12)(q36;p13) acute myeloid leukemia model shows high expression of MNX1 and a block in differentiation of the erythroid and megakaryocytic lineages. Int J Cancer. 2022;151(5):770‐782. doi: 10.1002/ijc.34122
Funding information Barncancerfonden, Grant/Award Numbers: PR2014‐0125, PR2019‐0013, TJ2019‐0053; Cancerfonden, Grant/Award Number: CAN2017/461; Västra Götalandsregionen, Grant/Award Number: ALFGBG‐431881; Swedish Research Council, Grant/Award Number: 2018‐05973; Swedish National Infrastructure for Computing (SNIC) at UPPMAX, Grant/Award Number: SNIC 2021/22‐754
DATA AVAILABILITY STATEMENT
The data that support the findings of this study are available in the supplementary material of this article, from Gene Expression Omnibus (GEO) database, accession number GSE182168. Further details and other data that support the findings of this study are available from the corresponding author upon request.
REFERENCES
- 1. Tosi S, Mostafa Kamel Y, Owoka T, Federico C, Truong TH, Saccone S. Pediatric acute myeloid leukemia with the t(7;12)(q36;p13) rearrangement: a review of the biological and clinical management aspects. Biomark Res. 2015;3:21. [DOI] [PMC free article] [PubMed] [Google Scholar]
- 2. Espersen ADL, Noren‐Nystrom U, Abrahamsson J, et al. Acute myeloid leukemia (AML) with t(7;12)(q36;p13) is associated with infancy and trisomy 19: data from Nordic Society for Pediatric Hematology and Oncology (NOPHO‐AML) and review of the literature. Genes Chromosomes Cancer. 2018;57:359‐365. [DOI] [PubMed] [Google Scholar]
- 3. Tosi S, Hughes J, Scherer SW, et al. Heterogeneity of the 7q36 breakpoints in the t(7;12) involving ETV6 in infant leukemia. Genes Chromosomes Cancer. 2003;38:191‐200. [DOI] [PubMed] [Google Scholar]
- 4. Ballabio E, Cantarella CD, Federico C, et al. Ectopic expression of the HLXB9 gene is associated with an altered nuclear position in t(7;12) leukemias. Leukemia. 2009;23:1179‐1182. [DOI] [PubMed] [Google Scholar]
- 5. Hock H, Shimamura A. ETV6 in hematopoiesis and leukemia predisposition. Semin Hematol. 2017;54:98‐104. [DOI] [PMC free article] [PubMed] [Google Scholar]
- 6. Harrison KA, Thaler J, Pfaff SL, Gu H, Kehrl JH. Pancreas dorsal lobe agenesis and abnormal islets of Langerhans in Hlxb9‐deficient mice. Nat Genet. 1999;23:71‐75. [DOI] [PubMed] [Google Scholar]
- 7. Harrison KA, Druey KM, Deguchi Y, Tuscano JM, Kehrl JH. A novel human homeobox gene distantly related to proboscipedia is expressed in lymphoid and pancreatic tissues. J Biol Chem. 1994;269:19968‐19975. [PubMed] [Google Scholar]
- 8. Ingenhag D, Reister S, Auer F, et al. The homeobox transcription factor HB9 induces senescence and blocks differentiation in hematopoietic stem and progenitor cells. Hematologica. 2019;104:35‐46. [DOI] [PMC free article] [PubMed] [Google Scholar]
- 9. von Bergh AR, van Drunen E, van Wering ER, et al. High incidence of t(7;12)(q36;p13) in infant AML but not in infant ALL, with a dismal outcome and ectopic expression of HLXB9. Genes Chromosomes Cancer. 2006;45:731‐739. [DOI] [PubMed] [Google Scholar]
- 10. Yang X, Pan Q, Lu Y, Jiang X, Zhang S, Wu J. MNX1 promotes cell proliferation and activates Wnt/beta‐catenin signaling in colorectal cancer. Cell Biol Int. 2019;43:402‐408. [DOI] [PubMed] [Google Scholar]
- 11. Wilkens L, Jaggi R, Hammer C, Inderbitzin D, Giger O, von Neuhoff N. The homeobox gene HLXB9 is upregulated in a morphological subset of poorly differentiated hepatocellular carcinoma. Virchows Arch. 2011;458:697‐708. [DOI] [PubMed] [Google Scholar]
- 12. Das M. MNX1: a novel prostate cancer oncogene. Lancet Oncol. 2016;17:e521. [DOI] [PubMed] [Google Scholar]
- 13. Torres‐Ruiz R, Martinez‐Lage M, Martin MC, et al. Efficient recreation of t(11;22) EWSR1‐FLI1(+) in human stem cells using CRISPR/Cas9. Stem Cell Rep. 2017;8:1408‐1420. [DOI] [PMC free article] [PubMed] [Google Scholar]
- 14. Love MI, Huber W, Anders S. Moderated estimation of fold change and dispersion for RNA‐seq data with DESeq2. Genome Biol. 2014;15:550. [DOI] [PMC free article] [PubMed] [Google Scholar]
- 15. Subramanian A, Tamayo P, Mootha VK, et al. Gene set enrichment analysis: a knowledge‐based approach for interpreting genome‐wide expression profiles. Proc Natl Acad Sci U S A. 2005;102:15545‐15550. [DOI] [PMC free article] [PubMed] [Google Scholar]
- 16. Balgobind BV, Van den Heuvel‐Eibrink MM, De Menezes RX, et al. Evaluation of gene expression signatures predictive of cytogenetic and molecular subtypes of pediatric acute myeloid leukemia. Hematologica. 2011;96:221‐230. [DOI] [PMC free article] [PubMed] [Google Scholar]
- 17. Chao MP, Gentles AJ, Chatterjee S, et al. Human AML‐iPSCs reacquire leukemic properties after differentiation and model clonal variation of disease. Cell Stem Cell. 2016;20:329‐344.e7. [DOI] [PMC free article] [PubMed] [Google Scholar]
- 18. Lee JH, Salci KR, Reid JC, et al. Brief report: human acute myeloid leukemia reprogramming to pluripotency is a rare event and selects for patient hematopoietic cells devoid of leukemic mutations. Stem Cells. 2017;35:2095‐2102. [DOI] [PubMed] [Google Scholar]
- 19. Madan V, Koeffler HP. Differentiation therapy of myeloid leukemia: four decades of development. Hematologica. 2021;106:26‐38. [DOI] [PMC free article] [PubMed] [Google Scholar]
- 20. Fan Y, Hu Y, Yan C, et al. Altered transcriptome in pediatric AML compared with normal hematopoiesis. Br J Cancer Res. 2020;3:415‐422. [Google Scholar]
- 21. Copley MR, Babovic S, Benz C, et al. The Lin28b‐let‐7‐Hmga2 axis determines the higher self‐renewal potential of fetal hematopoietic stem cells. Nat Cell Biol. 2013;15:916‐925. [DOI] [PubMed] [Google Scholar]
- 22. Patel P, Clarke C, Barraclough DL, et al. Metastasis‐promoting anterior gradient 2 protein has a dimeric thioredoxin fold structure and a role in cell adhesion. J Mol Biol. 2013;425:929‐943. [DOI] [PubMed] [Google Scholar]
- 23. Pan B, Yang J, Wang X, Xu K, Ikezoe T. miR‐217 sensitizes chronic myelogenous leukemia cells to tyrosine kinase inhibitors by targeting pro‐oncogenic anterior gradient 2. Exp Hematol. 2018;68:80–88.e2. [DOI] [PubMed] [Google Scholar]
Associated Data
This section collects any data citations, data availability statements, or supplementary materials included in this article.
Supplementary Materials
TABLE S1 Nucleotide sequences
TABLE S2 Antibodies for immunophenotyping
TABLE S3 TaqMan Gene Expression Assays (Applied Biosystems)
TABLE S4 RNA sequencing data quality
TABLE S5 Normalized counts
TABLE S6 Cell counts of individual cell lines, total cell numbers ×106
TABLE S7 Overlap of differentially expressed genes in t(7;12) iHSPC to gene expression signatures of pediatric AML subtypes
FIGURE S1 Representative flow cytometry plots from BD FACS Aria IIu. Analysis was done on viable single cells using the BD FACSDiva software and gatings were set on the isotype controls. Results shown for t(7;12) clone A
FIGURE S2 Pearson correlation heatmap, PCA and GO pathway analysis of differentially expressed genes in t(7;12) iHSPC. (A) Pearson correlation heatmap of the t(7;12) iHSPC clones and biological replicates of parental iHSPC. (B) PCA showing a clear separation of the four analyzed t(7;12) iHSPC clones from the biological replicates of parental iHSPC. (C) Most enriched pathways analysis using the reactome. (D) Most significant regulated immune pathways using the gene‐ontology tools.
FIGURE S3 Gene expression profile of genes found differentially expressed in t(7;12) AML compared with other pediatric AML subtypes in the TARGET data set FHCRC‐LowDepth
Data Availability Statement
The data that support the findings of this study are available in the supplementary material of this article, from Gene Expression Omnibus (GEO) database, accession number GSE182168. Further details and other data that support the findings of this study are available from the corresponding author upon request.